Categories
Crypto News Market Analysis Trading

NEXO Breakout Analysis – Nexo Performing Active Uptrend with +30% Gains in a Week

Nexo is trading in active uptrend here like many other altcoins are. The Cryptocurrency Nexo just went up +24.5% in a single day and surges over +30.6% in a week.

What is Nexo?

Nexo wants to Build The World’s First Instant Crypto Overdrafts. Powered by Credissimo – A Leading FinTech Group serving millions of people across Europe for over 10 years.

Nexo Quick Stats

SYMBOL:NEXO
Global rank:75
Market cap:$242,936,162 AUD
Current price:$0.4325 AUD
All time high price:$0.7304 AUD
1 day:+24.5%
7 day:+30.6%
1 year:+325.74%

Nexo Price Analysis

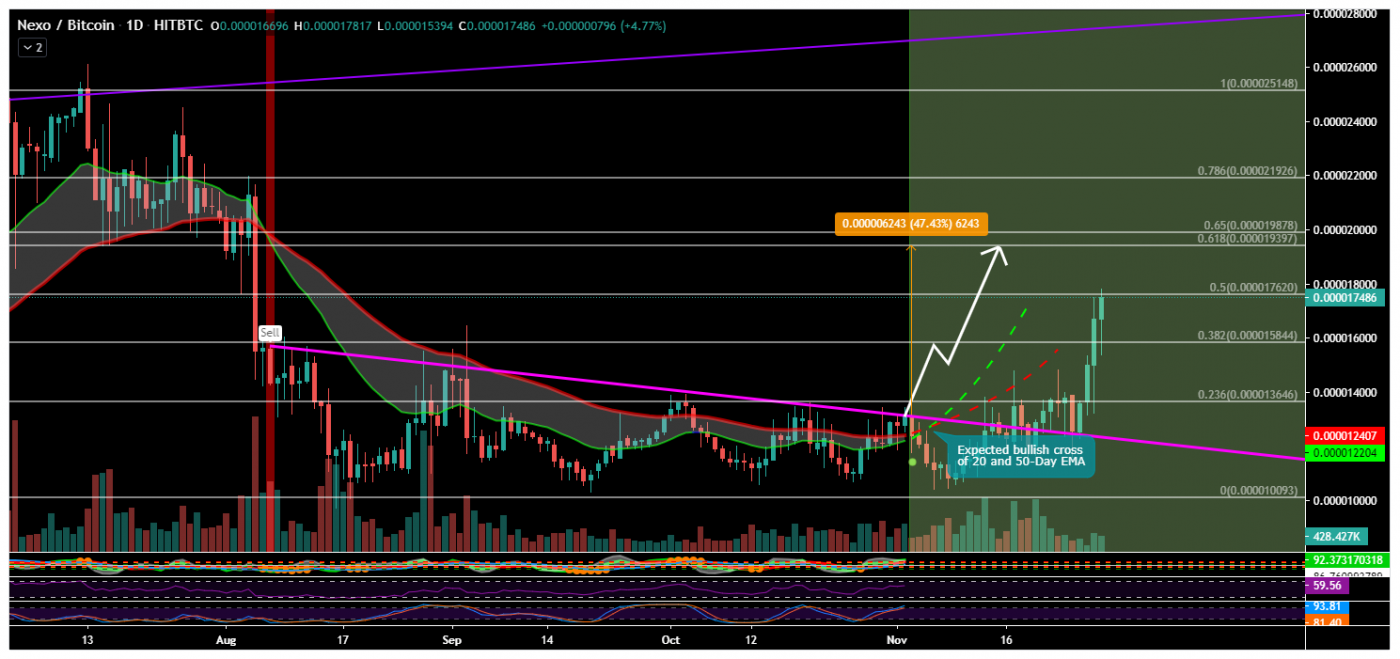
At the time of writing, Nexo is ranked 75th cryptocurrency globally and the current price is $0.4325 AUD. This is a +30% increase since 23 November 2020 (7 days ago) as shown in the chart below.
Source: TradingView

Price already increased a little bit after the Nexonomics announcement last week and then Nexo did an awesome breakout from this bearish rectangle by breaking all previous resistances & is now currently trading at $0.4325 AUD price levels.

“The bearish rectangle is a continuation pattern that occurs when a price pauses during a strong downtrend and temporarily bounces between two parallel levels before the trend continues.”

What do the technical indicators say?

The NEXO TradingView indicators (on the 1 day) mainly indicate Nexo as a buy, except the Oscillators which indicate Nexo as a sell.

So Why did NEXO Breakout?

The recent rise in Bitcoin over 100% since the halving in May and then the suggested start of the Altcoin season could have contributed to the recent breakout. Another reason could be the whales, secretly stacking up NEXO to their portfolio for the upcoming Altcoins rally. It could also be contributed to some of the recent news where they also announced an improved version of the Earn feature.

Recent Nexo News & Events:

Where to Buy or Trade Nexo?

Nexo has the highest liquidity on Binance Exchange so that would help for trading Nexo/USDT or Nexo/BTC pairs. However, if you’re just looking at buying some quick and hodling then Swyftx Exchange is a popular choice in Australia.

Categories
Crypto News Initial Coin Offering Market Analysis Trading

UNIFI Protocol DAO Breakout Analysis – UNFI Pumps +45% on Binance Launchpool

After the launch of UNFI Protocol DAO on Binance Launchpool last week, UNFI was trading sideways & took a strong Breakout with +45% gains in a single day. Let’s take a quick look at UNFI, price analysis, and possible reasons for the recent breakout.

What is Unifi?

Unifi Protocol DAO is a group of non-custodial, interoperable, decentralized, multi-chain smart contracts providing the building blocks for DeFi development. The project provides a bridge to connect the economy of Ethereum-based DeFi products to the growing DeFi markets on other blockchains. uTrade, a decentralized Automated Market Maker (AMM) and token exchange, is the first product built on the Unifi Protocol DAO smart contracts.

Unifi Quick Stats

SYMBOL:UNFI
Global rank:460
Market cap:$16,695,896 AUD
Current price:$6.95 AUD
All time high price:$8.12 AUD
1 day:+45.4%
7 day:+150.70%
1 year:+150.74%

Unifi Price Analysis

At the time of writing, UNFI is ranked 460th cryptocurrency globally and the current price is $6.95 AUD. This is a +150.70% increase since the launch of its ICO at Binance Launchpool on 19 November 2020 as shown in the chart below.

Source: TradingView

After the launch of Unifi on Binance Launchpool, It pumped up to $8.12 AUD having +300% gains in few hours and the initial opening price of UNFI was $2.1 AUD at Binance Exchange with many different trading pairs like UNFI/BTC, UNFI/USDT, and UNFI/BUSD.

Currently, UNFI is trading at $6.95 AUD price levels after breaking out the squeeze resistance in its sideways trend & now heading towards its all-time high price.

What do the technical indicators say?

The Unifi TradingView indicators (on the 1 day) mainly indicate UNFI as a strong buy, except the Oscillators which indicate UNFI as a neutral.

So Why did UNFI Breakout?

The recent rise in Bitcoin over 100% since the halving in May and then the suggested start of the Altcoin season could have contributed to the recent breakout. It could also be contributed to some recent news where UNFI is about to launch on Ethereum Network with uTrade.

Recent UNFI News & Events:

Where to Buy or Trade UNFI?

UNFI has the highest liquidity on Binance Exchange so that would help for trading UNFI/USDT or UNFI/BTC pairs. However, if you’re just looking at buying some quick and hodling then Swyftx Exchange is a popular choice in Australia.

Categories
Crypto News Market Analysis Nano Trading

NANO Trading Analysis – Nano up 51%, Holding Strong Position to Breakout from Resistance

NANO has already gone up over +51.55% this month, and the trading analysis suggests that there might be another wave incoming. Let’s take a look at NANO and what the charts are telling us.

What is Nano?

Nano is a digital currency for the real world – the fast and free way to pay for everything in life, with instant transactions, zero fees, and a scalable network.

Nano Quick Stats

Symbol:Nano
Global rank:78
Market cap:$203,749,249 AUD
Current price:$1.52 AUD
All time high price:$50.97 AUD
1 day:+8.69%
7 day:+51.55%
1 year:+37.63%

Nano Price Analysis

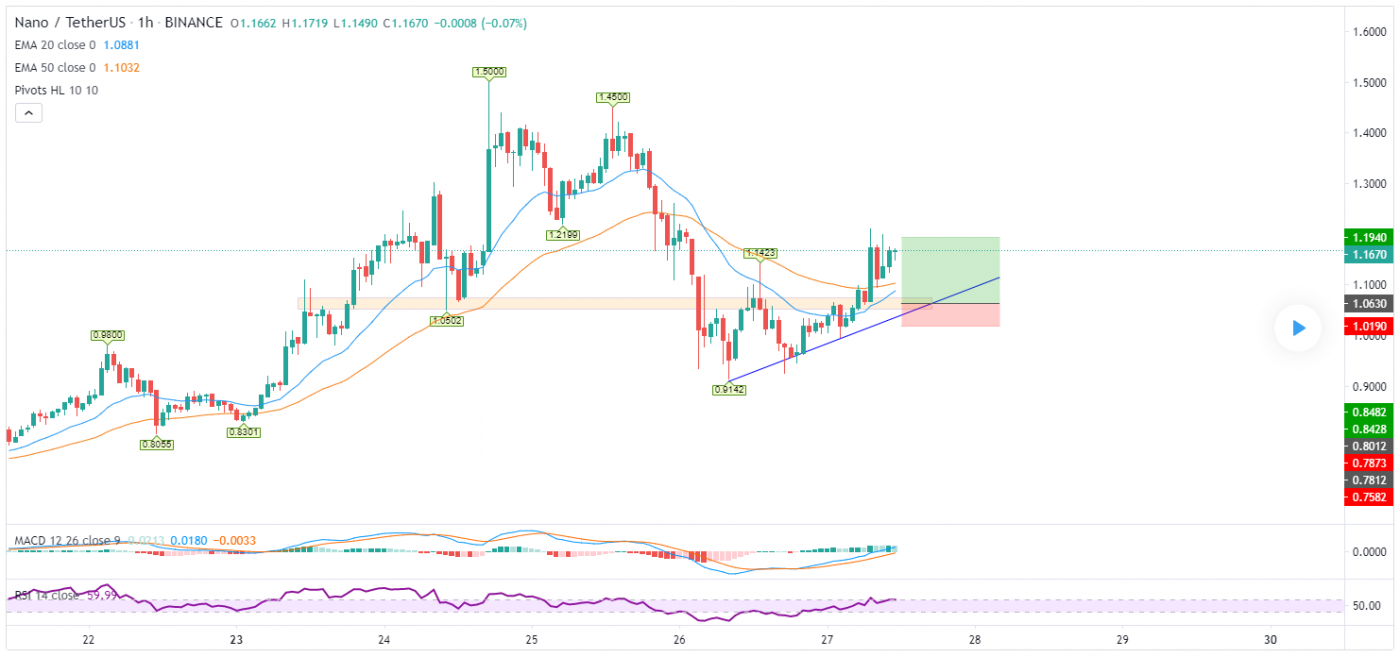
At the time of writing, Nano is ranked 78th cryptocurrency globally and the current price is $1.52 AUD. This is a +51.55% increase since 21 November 2020 (7 days ago) as shown in the chart below.

Source: TradingView

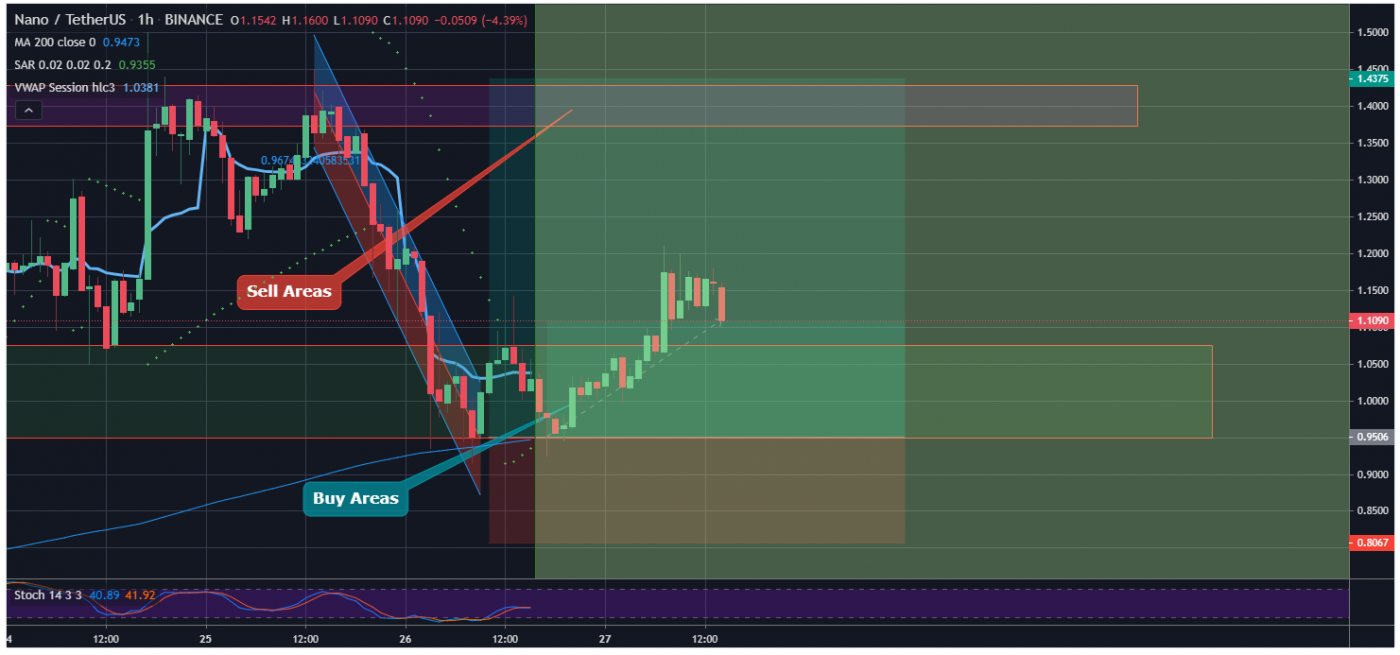
If we see the 1-hour candle chart, Nano just bounced back from its support levels of $1.0120 AUD and holding its position strong for the breakout from the next resistance which is at $1.6150 AUD. The blue line is acting as a support level for this Ascending triangle trend.

“An ascending triangle is a chart pattern used in technical analysis. It is created by price moves that allow for a horizontal line to be drawn along the swing highs, and a rising trendline to be drawn along the swing lows. The two lines form a triangle. Traders often watch for breakouts from triangle patterns.”

Source: TradingView

What do the technical indicators say?

The NANO TradingView indicators (on the 1 day) mainly indicate Nano as a buy.

Recent Nano News & Events:

Where to Buy or Trade Nano?

Nano has the highest liquidity on Binance Exchange so that would help for trading NANO/USDT or NANO/BTC pairs. However, if you’re just looking at buying some quick and hodling then Swyftx Exchange is a popular choice in Australia.

Categories
Crypto News Market Analysis Trading

Blockstack Trading Analysis – STX Bounced Back from Strong Support Level in Recent Altcoins Market Crash

While Bitcoin was trading at $26,240 AUD price levels, we saw a mini Altcoins rally following Bitcoin & Ethereum. Unfortunately, BTC crashed before it was going to make a new ATH (All-Time High). This impacts Altcoins every time when a market crashes resulting the Altcoins in a bloodbath.

Where Blockstack STX was holding a tight position & bounced back from its support levels to continue the bullish trend. Let’s take a quick look at STX, price analysis, and possible reasons for the recent bounce back.

What is Blockstack?

Blockstack is a new decentralized internet where users own their data and apps run locally. A browser portal is all that’s needed to get started.

Blockstack Quick Stats

SYMBOL:STX
Global rank:75
Market cap:$221,315,337 AUD
Current price:$0.3128 AUD
All time high price:$0.5341 AUD
1 day:+2.36%
7 day:+6.69%
1 year:+112.58%

Blockstack Price Analysis

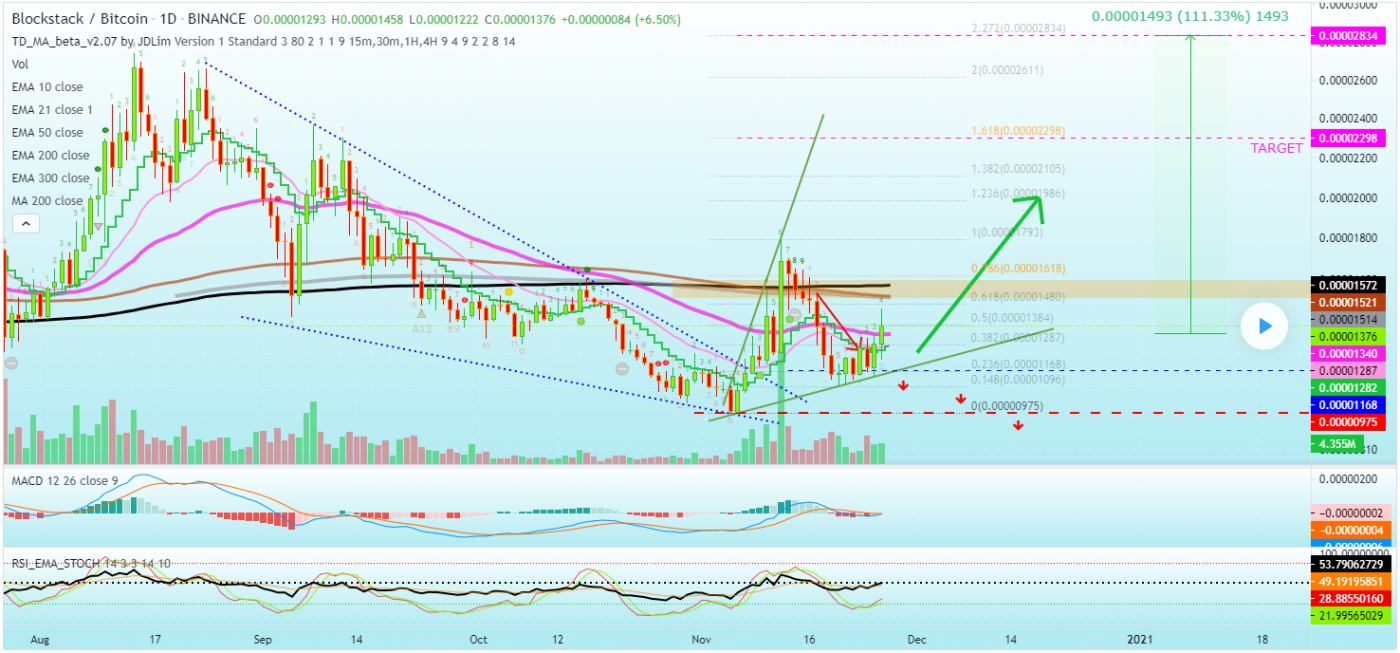
At the time of writing, STX is ranked 75th cryptocurrency globally and the current price is $0.3128 AUD. This is a +6.69% increase since 20 November 2020 (7 days ago) as shown in the chart below.

Source: TradingView

Blockstack STX moved up recently from its support level and challenged MA200, the black line on the chart. A rejection happened at this level which ended in a higher low. We are now seeing its price recovering, there might also be some additional growth to it.

“MA200 is the 200-day simple moving average (SMA) is considered a key indicator by traders and market analysts for determining overall long-term market trends. The 200-day SMA seems, at times, to serve as an uncanny support level when the price is above the moving average or a resistance level when the price is below it”

What do the Technical indicators say?

The  STX TradingView indicators (on the 1 day) mainly indicate STX as a buy, except the Moving Averages which indicate STX as a strong buy.

So Why did STX Bounced Back?

Blockstack is a solid project with its clear vision, a new decentralized internet where users own their data and apps run locally & the recent rise in Bitcoin over 100% since the halving in May and then the suggested start of the Altcoin season could have contributed to the recent bounce back. It could also be contributed to some of the recent news for upcoming Nigeria: STX 2.0 Mainnet launch today.

Recent Blockstack News & Events:

Where to Buy or Trade Blockstack STX?

Blockstack has the highest liquidity on Binance Exchange so that would help for trading STX/USDT or STX/BTC pairs. However, if you’re just looking at buying some quick and hodling then Swyftx Exchange is a popular choice in Australia.

Categories
Crypto News Market Analysis Ontology Trading

Ontology Gas ONG Breakout Analysis – Parabolic Breakout on ONG Pumps with +206% gains in a Single Day

Ontology ONG just pumped up to +206% in the last few hours with a strong breakout on Binance & other Exchanges. Let’s take a quick look at ONG, price analysis, and possible reasons for the recent breakout.

What is Ontology?

Ontology is a new high-performance public blockchain project & a distributed trust collaboration platform. It provides new high-performance public blockchains that include a series of complete distributed ledgers and smart contract systems.

Ontology Quick Stats

SYMBOL:ONG
Global rank:42
Market cap:$465,820,527
Current price:$0.3420 AUD
All time high price:$5.98 AUD
1 day:+206.4%
7 day:+210.70%
1 year:+234.74%

Ontology ONG Price Analysis

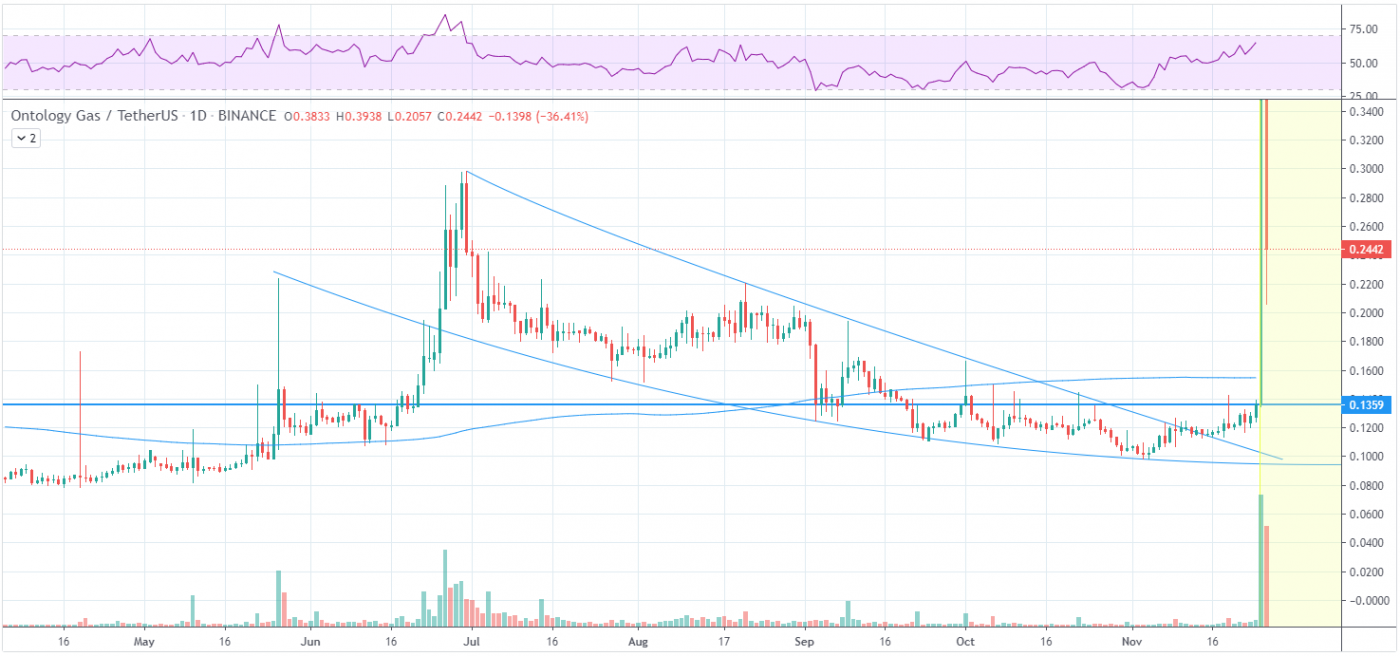
At the time of writing, ONG is ranked 42nd cryptocurrency globally and the current price is $0.34 AUD. This is a +210% increase since 20 November 2020 (7 days ago) as shown in the chart below.

Source: TradingView

If we see the above 1-day candle chart, ONG was trading inside the falling wedge at the $0.1245 AUD price levels. Ontology Gas just did an awesome breakout by breaking all the major resistances in a single day and is now currently trading at $0.2452 AUD.

Source: TradingView

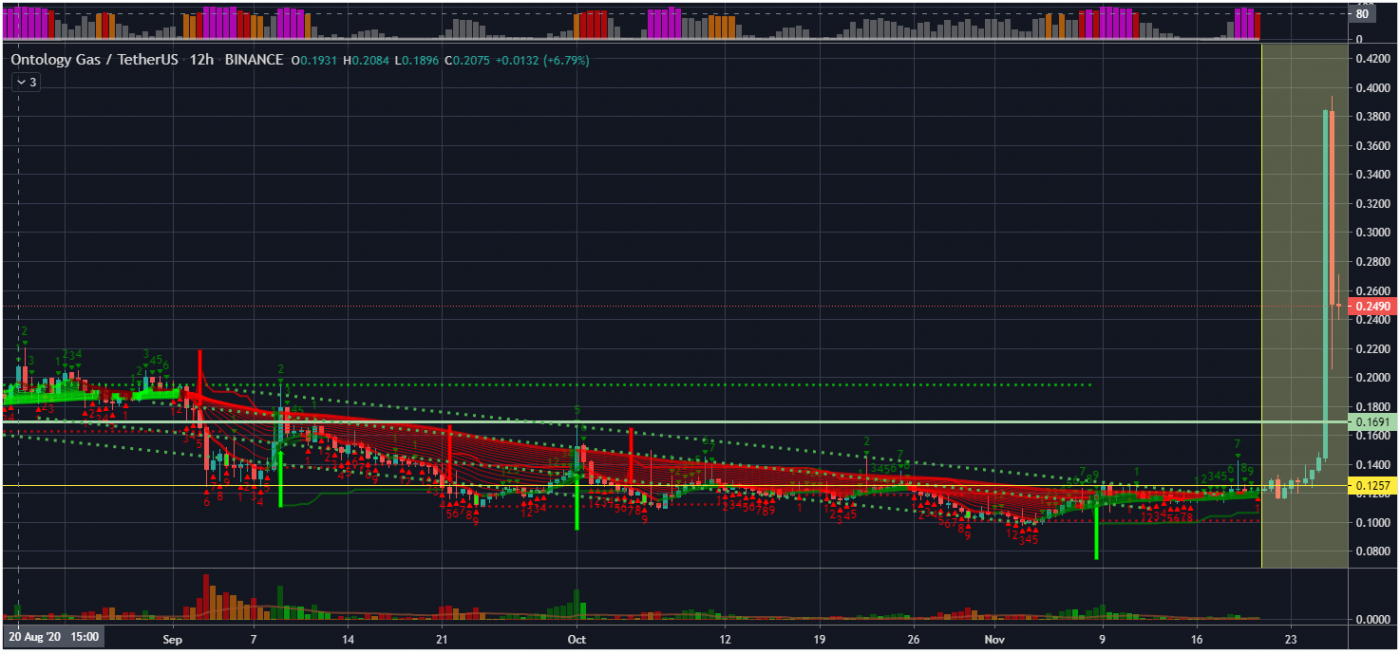
The price gained pace above the $0.30 AUD price levels and the 100-day simple moving average. It even broke the $0.40 AUD price level and traded to a new multi-month high at $0.4150 AUD. Ontology ONG price is currently correcting lower and trading below $0.2500 AUD.

What do the technical indicators say?

The Ontology ONG TradingView indicators (on the 1 day) mainly indicate ONG as a buy, except the Moving Averages which indicate ONG as a strong buy.

So Why did ONG Breakout?

The recent rise in Bitcoin over 100% since the halving in May and then the suggested start of the Altcoin season could have contributed to the recent breakout. Another big reason could be the whales secretly buying this coin for their portfolio which might give them huge profits in the next Altcoin rally. It could also be contributed to some of the recent events & news.

Recent Ontology News & Events:

Where to Buy or Trade Ontology?

ONG has the highest liquidity on Binance Exchange so that would help for trading ONG/USDT or ONG/BTC pairs. However, if you’re just looking at buying some quick and hodling then Swyftx Exchange is a popular choice in Australia.

Categories
Crypto News Market Analysis NEM Trading

NEM Breakout Analysis – XEM Pumps +57.73% in a Week by Breaking Falling Wedge Pattern

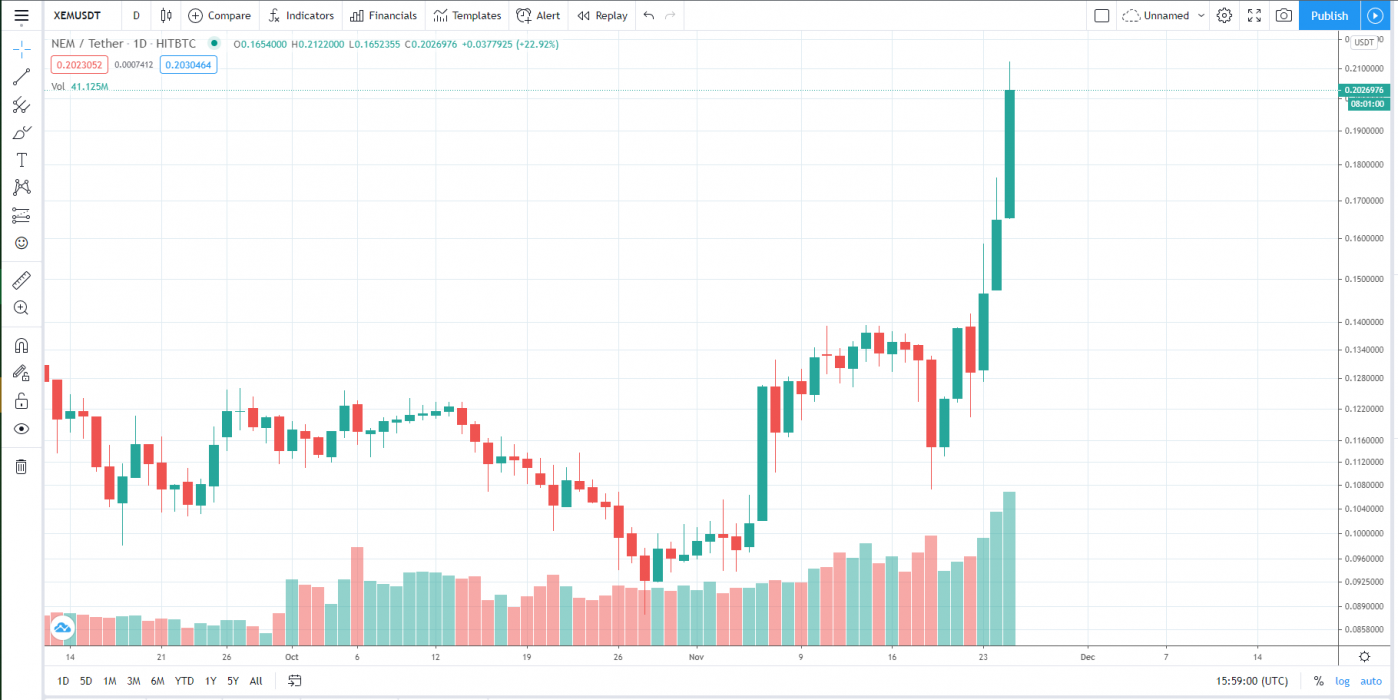
NEM was squeezing inside the falling wedge pattern on a 1-day candle chart, it just went up over +57% in the last 7 days. Let’s take a quick look at NEM, price analysis, and possible reasons for the recent breakout.

What is NEM?

NEM is a cryptocurrency and blockchain platform for smart digital assets. The main new feature in NEM includes Proof of Importance (POI), a new consensus algorithm, and a smart asset system.

NEM Quick Stats

SYMBOL:XEM
Global rank:20
Market cap:$2,390,016,420 AUD
Current price:$0.2655 AUD
All time high price:$2.85 AUD
1 day:+27.4%
7 day:+57.73%
1 year:+452.58%

NEM Price Analysis

At the time of writing, NEM is ranked 20th cryptocurrency globally and the current price is $0.2655 AUD. This is a +57.73% increase since 19 November 2020 (7 days ago) as shown in the chart below.

Source: TradingView

After looking at the above 1-day candle chart, we can clearly see that NEM was trading inside the falling wedge pattern on XEM/BTC pair. The first resistance was on the $0.1756 AUD price level which NEM broke with a strong bullish trend buying volume and is now heading towards the next resistance at $0.2755 AUD & $0.3155 AUD respectively.

“The falling wedge pattern is a continuation pattern formed when price bounces between two downward slopings, converging trendlines. It is considered a bullish chart formation but can indicate both reversal and continuation patterns – depending on where it appears in the trend”

Source: TradingView

If we zoom out and take a look at the price over the past few days or so, we can see the recent breakout more clearly, the line is almost vertical which looks insane.

What do the Technical indicators say?

The  NEM XEM TradingView indicators (on the 1 day) mainly indicate NEM as a buy, except the Oscillators which indicate NEM as a neutral.

So Why did NEM Breakout?

The recent rise in Bitcoin over 100% since the halving in May and then the suggested start of the Altcoin season could have contributed to the recent breakout. Another reason could be the whales, secretly stacking up NEM to their portfolio for this Altcoin rally. It could also be contributed to some of the recent news for the upcoming Mainnet Launch of NEM and of course, they are giving 30% off on BlackFriday.

Recent NEM News & Events:

Where to Buy or Trade NEM XEM?

NEM has the highest liquidity on Binance Exchange so that would help for trading NEM/USDT or NEM/BTC pairs. However, if you’re just looking at buying some quick and hodling then Swyftx Exchange is a popular choice in Australia.
Categories
Crypto News Market Analysis Trading

Horizen ZEN Breakout Analysis – ZEN Pumps +139% in a Week with Strong Bullish Trend

Horizen ZEN is flipping on a 1-day candle chart, ZEN has grown by a massive 139% in the past week. Let’s take a quick look at ZEN, price analysis, and possible reasons for the recent breakout.

What is Horizen?

Horizen is an inclusive ecosystem where everyone is empowered and rewarded for their contributions. Horizen’s massively scalable platform enables businesses and developers to quickly and affordably create their own public or private blockchains on the largest node network in the industry. Horizen’s Sidechain SDK provides all necessary components for easy and fast deployment of a fully customizable blockchain.

Horizen Quick Stats

SYMBOL:ZEN
Global rank:85
Market cap:$199,323,485 AUD
Current price:$18.95 AUD
All time high price:$91.50 AUD
1 day:+10.4%
7 day:+139.55%
1 year:+203.74%

Horizen Price Analysis

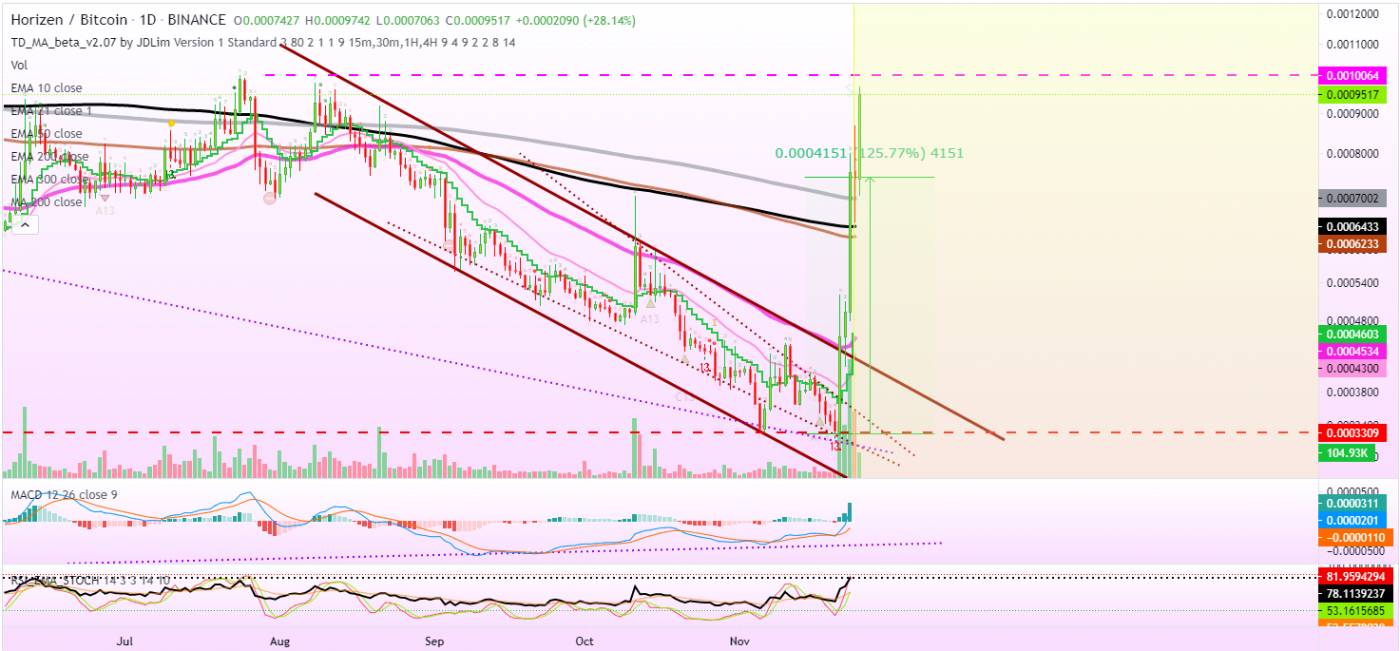
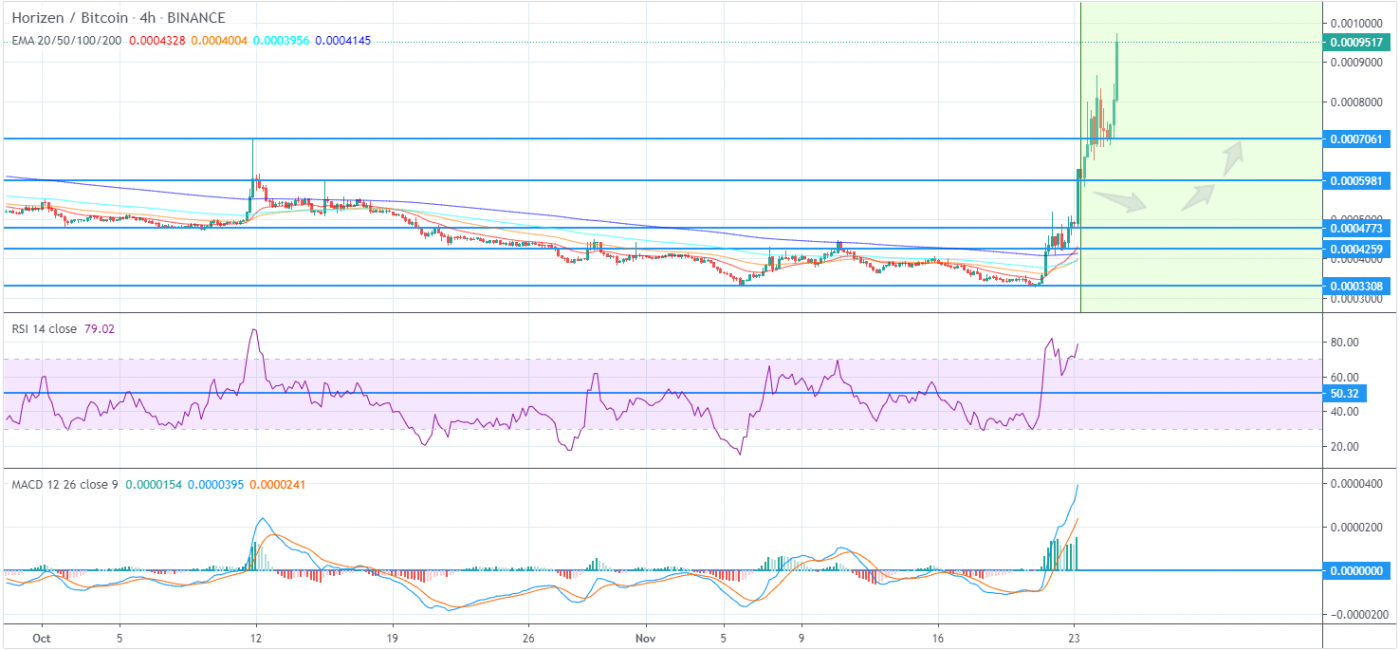
At the time of writing, ZEN is ranked 85th cryptocurrency globally and the current price is $18.95 AUD. This is a +139% increase since 19 November 2020 (7 days ago) as shown in the chart below.

Source: TradingView

In the past week, there was a strong rise in Bitcoin, Ethereum, and Ripple. As a result, Horizen ZEN also formed strong support near $6.56 before starting a fresh increase against the AUD.

Here we also have the “W” pattern with a higher low just as looking at it before starting a strong increase, there was a break above a crucial contracting triangle with resistance near $11.65 on the daily chart of the ZEN/AUD. The pair gained pace above the $14.12 and $15.70 resistance levels.

“W pattern is a price pattern, also called Double Bottom. This pattern, when drawn it looks like the W and this is why it is called as W pattern. Sometimes patterns look like W but it is not the exact W pattern and these patterns are called Semi-W patterns.”

Source: TradingView

The price of ZEN gained pace by breaking above the 3rd major resistance of $15.12 AUD. If we see the above chart of ZEN/BTC pair on a 4-hour candle, it clearly shows the uptrend of Horizen ZEN has been started by joining the altcoins rally of 2020.

What do the technical indicators say?

The Horizen ZEN TradingView indicators (on the 1 day) mainly indicate ZEN as a buy, except the Oscillators which indicate ZEN as a neutral.

So Why did ZEN Breakout?

The recent rise in Bitcoin over 100% since the halving in May and then the suggested start of the Altcoin season could have contributed to the recent breakout. It could also be contributed to some of the recent events where the Horizen ZEN 2.0.22 Mainnet Fork is happening today expected around Nov 25 – Block 835968.

Recent Horizen News & Events:

Where to Buy or Trade Horizen?

ZEN has the highest liquidity on Binance Exchange so that would help for trading ZEN/USDT or ZEN/BTC pairs. However, if you’re just looking at buying some quick and hodling then Swyftx Exchange is a popular choice in Australia.
Categories
Crypto News Market Analysis Trading Verge

Verge XVG Breakout Analysis – XVG Pumps +65% in a Single Day

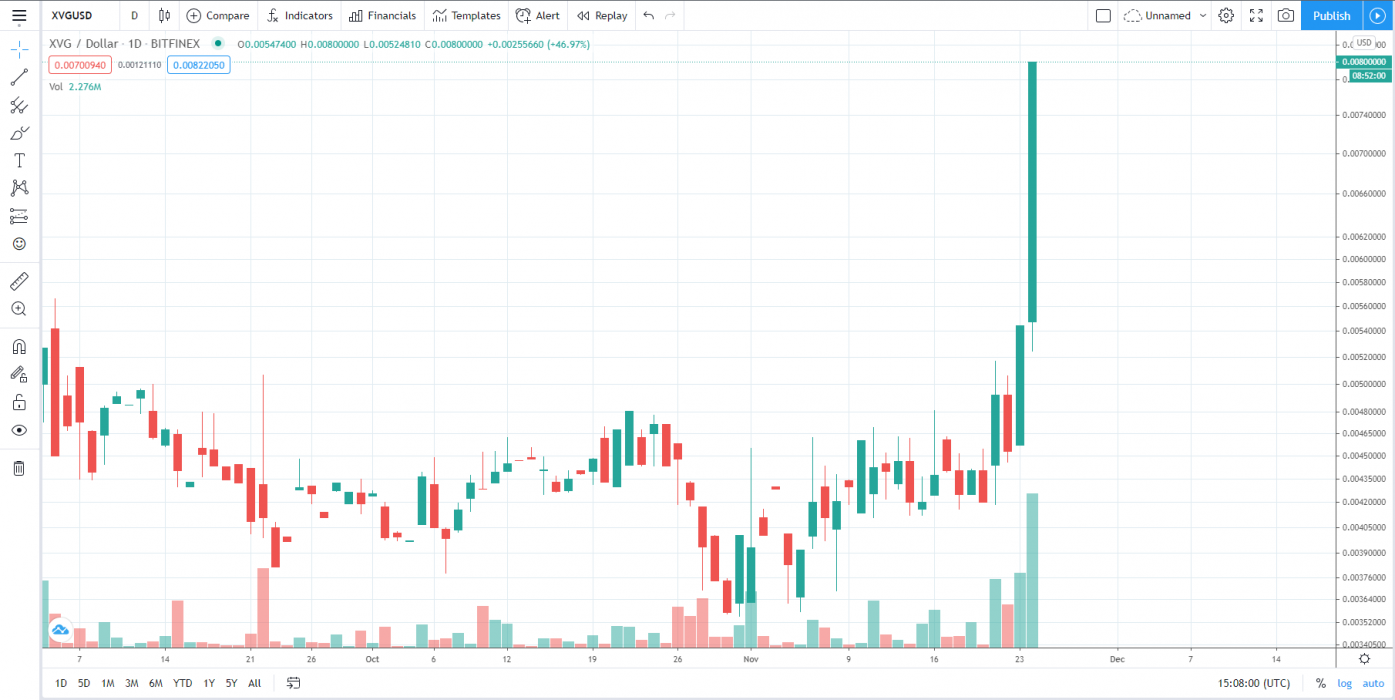
Verge XVG – Cryptocurrency is widely known as the “King Altcoin of 2017 Bullrun”, gave massive gains in that Altcoins season and, today XVG pumped +65% in a single day by just making its new all-time low & bouncing back from the support to join the Altcoins rally of 2020. Let’s take a quick look at XVG, price analysis, and possible reasons for the recent breakout.

What is Verge?

Verge is an open-source, decentralized cryptocurrency that claims to offer completely anonymous transactions by obfuscating the location and IP address of the transacting participants using TOR and I2P network layers. Verge trades on leading cryptocurrency exchanges with the symbol XVG.

Verge Quick Stats

SYMBOL:XVG
Global rank:93
Market cap:$156,663,352 AUD
Current price:$0.0109 AUD
All time high price:$0.410255 AUD
1 day:+65.4%
7 day:+75.70%
1 year:+112.74%

Verge Price Analysis

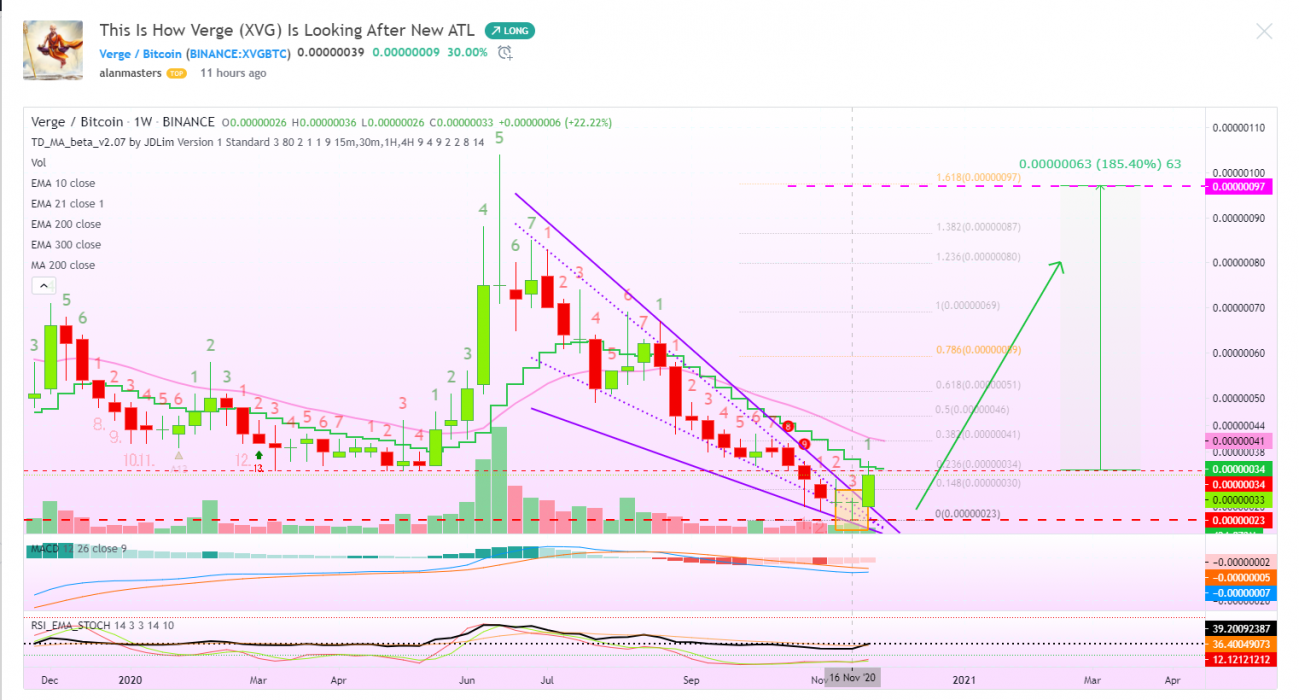
At the time of writing, XVG is ranked 93rd cryptocurrency globally and the current price is $0.01095 AUD. This is a +75.7% increase since 18 November 2020 (7 days ago) as shown in the chart below with a 1-week candle.

Source: TradingView

Verge XVG just bounced back from its support by making it’s new all-time-low price levels. By looking at this chart, you can see the bottom has been hit and once you hit bottom, the only place left to go is up. Looking at the weekly/long-term chart, we can notice another bullish signal.

Source: TradingView

What do the Technical indicators say?

The Verge XVG TradingView indicators (on the 1 day) mainly indicate XVG as a buy, except the Oscillators which indicate XVG as a neutral.

So Why did XVG Breakout?

The recent rise in Bitcoin over 100% since the halving in May and then the suggested start of the Altcoin season could have contributed to the recent breakout. Another reason could be the whales, secretly stacking up XVG to their portfolio for this Altcoin rally. It could also be contributed to some of the recent news from the Verge about NowPayments & Black Friday Discounts.

Recent Verge News & Events:

Where to Buy or Trade Verge XVG?

XVG has the highest liquidity on Binance Exchange so that would help for trading XVG/USDT or XVG/BTC pairs. However, if you’re just looking at buying some quick and hodling then Swyftx Exchange is a popular choice in Australia.
Categories
Crypto News Market Analysis Stellar Trading

Stellar XLM Breakout Analysis – Parabolic Breakout on XLM with +103% gains in a Week

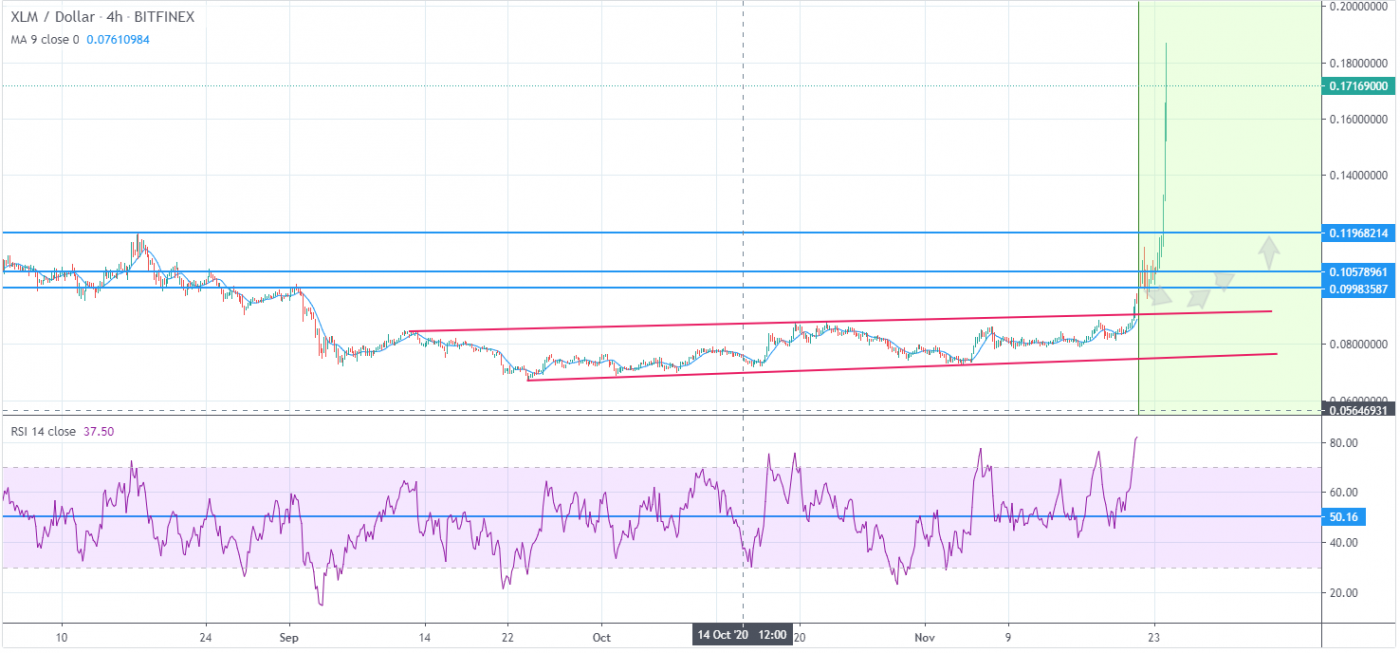
Stellar XLM is flipping on a 4-hour candle chart, XLM just went up over +103% from the past week. Let’s take a quick look at XLM, price analysis, and possible reasons for the recent breakout.

What is Stellar?

Stellar is an open platform for building financial products that connect people everywhere. Stellar blockchain enables near-instant payments, with almost zero fees, and a smart contract platform to create a digital asset economy.

Stellar Quick Stats

SYMBOL:XLM
Global rank:12
Market cap:$4,906,911,142 AUD
Current price:$0.2327 AUD
All time high price:$1.28 AUD
1 day:+62.4%
7 day:+103.70%
1 year:+193.74%

Stellar Price Analysis

At the time of writing, XLM is ranked 12th cryptocurrency globally and the current price is $0.23 AUD. This is a +103% increase since 18 November 2020 (7 days ago) as shown in the chart below.

Source: TradingView

In the past week, there was a strong rise in Bitcoin, Ethereum, and Ripple. As a result, stellar (XLM) also formed strong support near $0.096 before starting a fresh increase against the AUD.

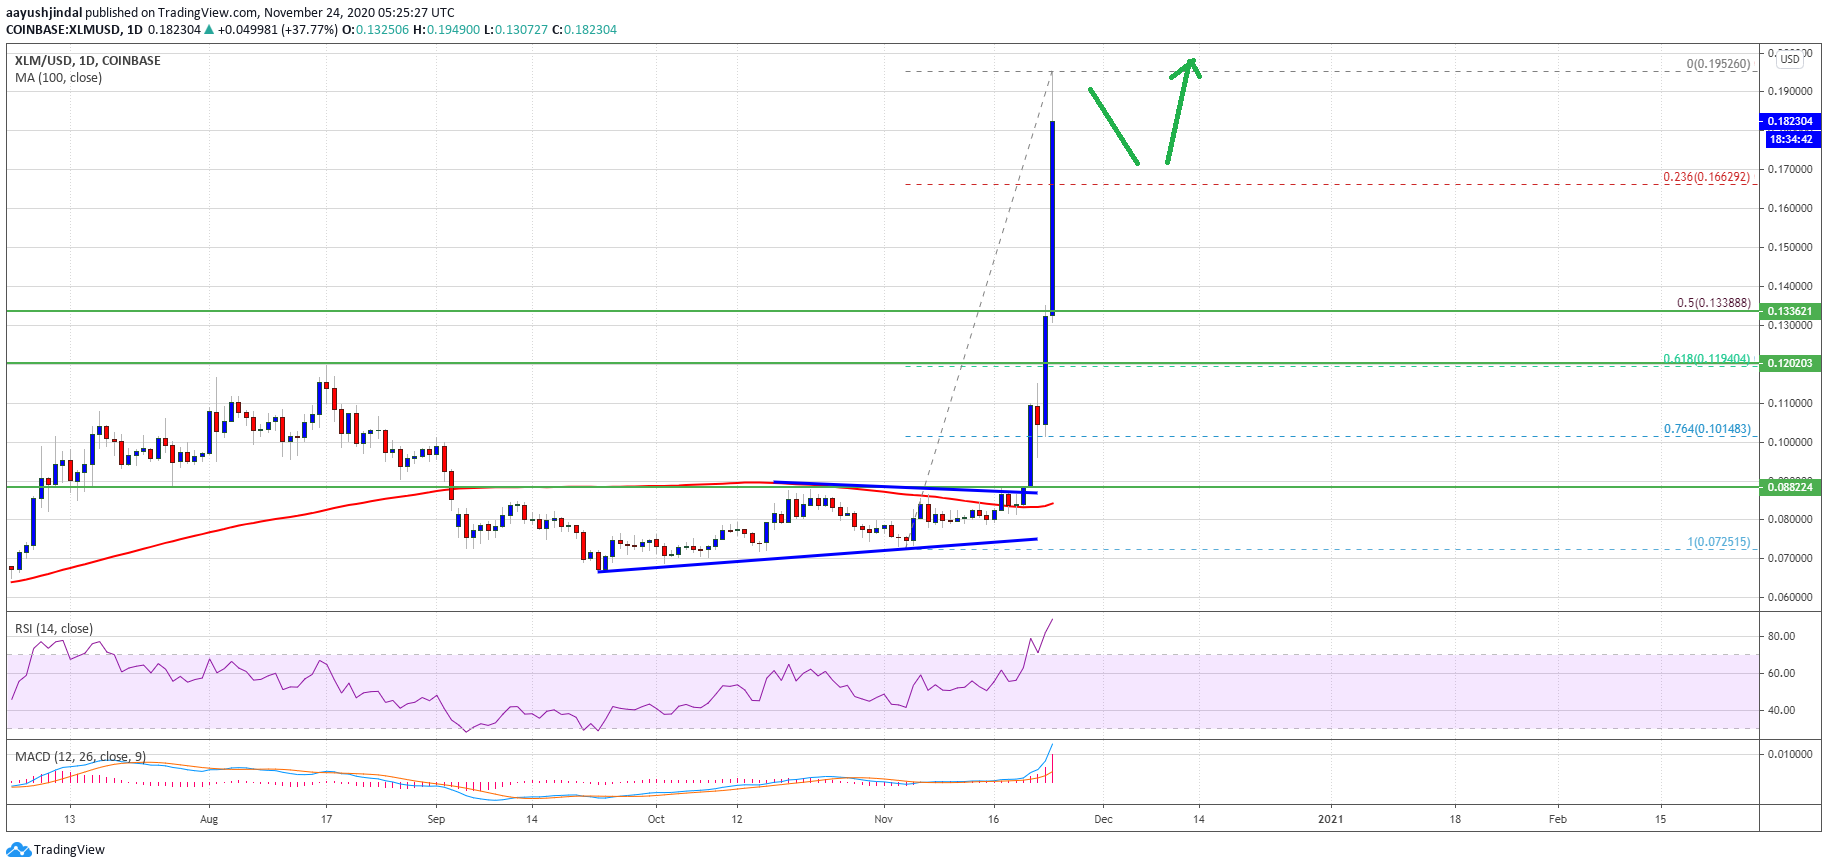
To start a strong increase, there was a break above a crucial contracting triangle with resistance near $0.0882 on the daily chart of the XLM/AUD. The pair gained pace above the $0.1250 and $0.1470 resistance levels.

Stellar (XLM)
Source: TradingView

The price gained pace above the $0.1700 level and the 100-day simple moving average. It even broke the $0.2000 level and traded to a new multi-month high at $0.2352. Stellar’s XLM price is currently correcting lower and trading below $0.2400 AUD.

More Upsides in XLM

If the XLM price remains elevated, there are chances of more upsides above $0.2300. The next key resistance is near the $0.2550 level, followed by $0.2400 AUD.

A clear break above the $0.2350 resistance level may perhaps open the doors for more gains above $0.2450. The next major hurdle for the bulls could be near the $0.2600 AUD level.

What do the technical indicators say?

The Stellar XLM TradingView indicators (on the 1 day) mainly indicate XLM as a buy, except the Oscillators which indicate XLM as a neutral.

So Why did XLM breakout?

The recent rise in Bitcoin over 100% since the halving in May and then the suggested start of the Altcoin season could have contributed to the recent breakout. It could also be contributed to some of the recent events where the Stellar anchor Settle Network is issuing two new stablecoins, ARST and BRLT.

Recent Stellar News & Events:

Where to Buy or Trade Stellar?

XLM has highest liquidity on Binance Exchange so that would help for trading XLM/USDT or XLM/BTC pairs. However, if you’re just looking at buying some quick and hodling then Swyftx Exchange is a popular choice in Australia.

Categories
Cardano Crypto News Market Analysis Trading

Cardano Trading Analysis – ADA Performing Active Uptrend with +47% Gains in a Week.

Cardano ADA is in active uptrend here like many other altcoins are. The Cryptocurrency Cardano ADA just went up +15% in a single day and surges over +47% in a week.

What is Cardano ADA?

ADA is a token on a distributed computing platform that runs smart contracts, decentralized applications, side chains, multi-party computation, and metadata.

Cardano Quick Stats

SYMBOL:ADA
Global rank:9
Market cap:$6,521,127,429 AUD
Current price:$0.205990 AUD
All time high price:$1.81 AUD
1 day: +14.4%
7 day: +47.70%
1 year: +325.74%

Cardano Price Analysis

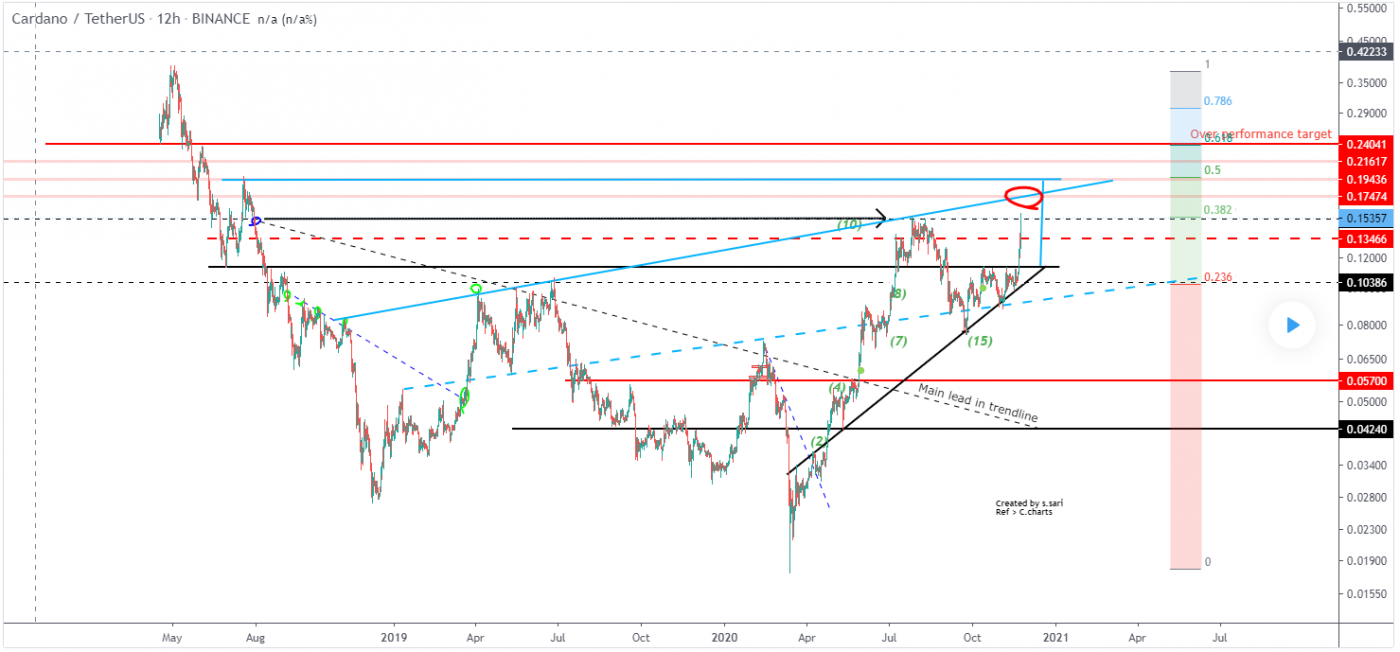
At the time of writing, ADA is ranked 9th cryptocurrency globally and the current price is $0.20 AUD. This is a +47% increase since 17 November 2020 (7 days ago) as shown in the chart below.

Source: TradingView

The target of this active trend is either this blue top trend line or the 0.5 fib level. Assuming if Cardano ADA breaks this double top, then it’s leaning towards a $0.173 price level, If Cardano ADA hits the 0.5 fib level, it might make a huge bullish structure, inverse H&S, and it most likely to retest that top blue trendline.

Fib is Fibonacci retracement levels & these are horizontal lines that indicate where support and resistance are likely to occur. They are based on Fibonacci numbers. Each level is associated with a percentage. The percentage is how much of a prior move the price has retraced.

Source: TradingView

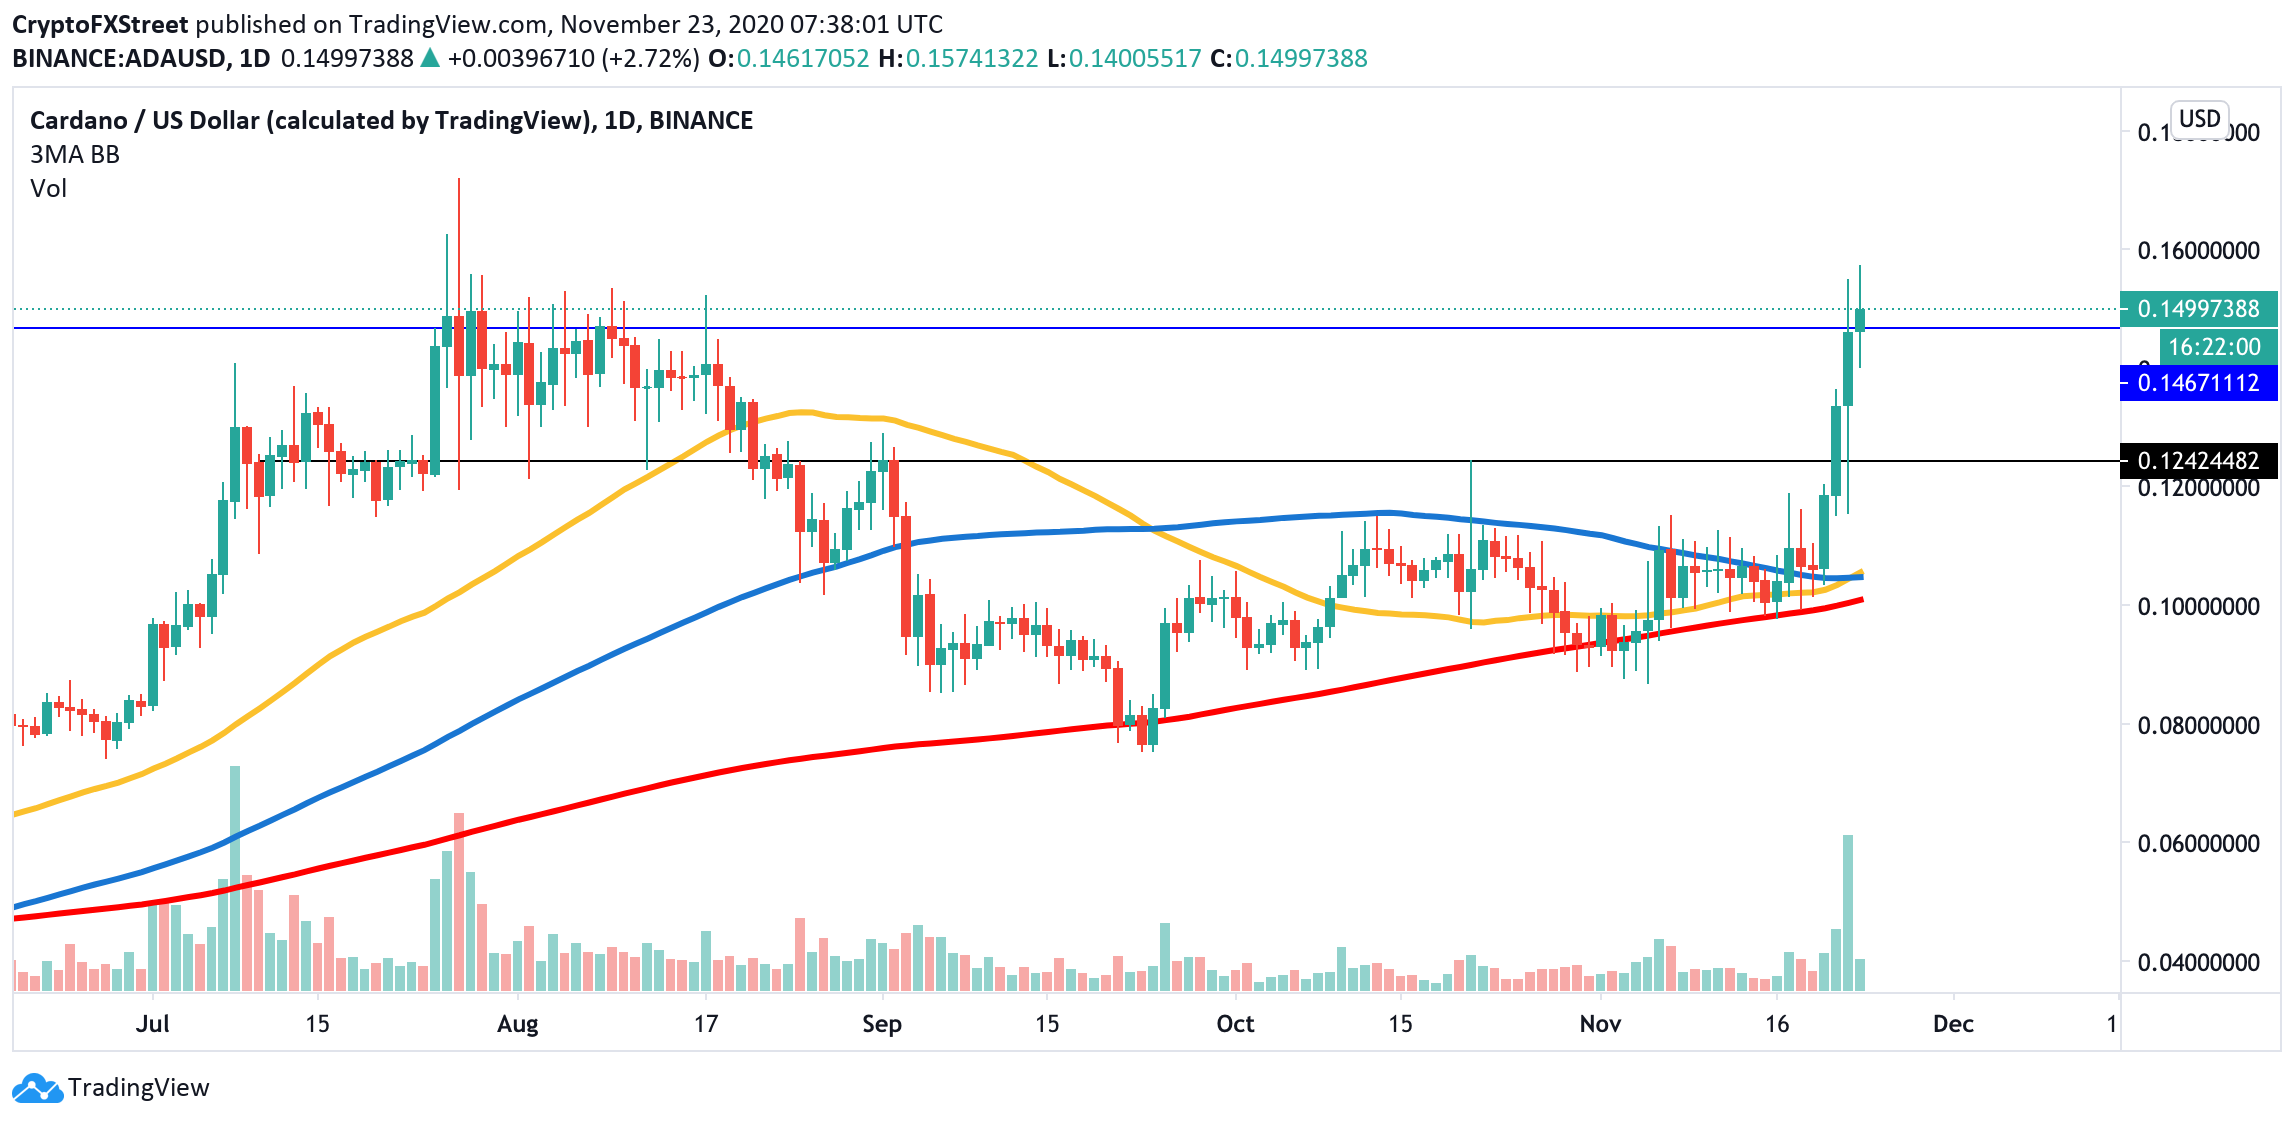
Despite the optimistic bullish scenario, the cryptocurrency market’s unpredictability means the bearish outlook cannot be disregarded. The charts show that the sell-off below $0.12 will speed up the correction and bring more sellers to the market. In this case, $0.1 will come into focus. This psychological barrier is reinforced by a combination of 50,100 and 200-day EMA.  a sustainable move below this area will invalidate the bullish scenario.

What do the technical indicators say?

The Cardano ADA TradingView indicators (on the 1 day) mainly indicate ADA as a buy, except the Oscillators which indicate ADA as a sell.

Cardano’s Network is on Fire

Cardano’s network growth gives additional credence to the bullish outlook. The number of new addresses doubled in the past few days and hit the highest level since the beginning of August. According to Intotheblock’s data, over 12,500 new addresses were created on Cardano’s blockchain on November 22 against 5,600 addresses on November 19. The growth coincides with the price increase and implies that the bullish momentum remains strong.

Recent ADA News & Events:

Where to Buy or Trade ADA?

ADA has the highest liquidity on Binance Exchange so that would help for trading ADA/USDT or ADA/BTC pairs. However, if you’re just looking at buying some quick and hodling then Swyftx Exchange is a popular choice in Australia.