Categories
Crypto News Market Analysis Trading

Civic Breakout Analysis – CVC Pumps +54% in a Single Day by Breaking Falling Wedge Pattern

Civic was squeezing inside the falling wedge pattern on a 1-day candle chart and it just went up over +54% in a single day. Let’s take a quick look at CVC, price analysis, and possible reasons for the recent breakout.

What is Civic?

Civic’s identity verification and protection tools give both businesses and individuals the power to control and protect their identities through the blockchain.

Civic Quick Stats

SYMBOL:CVC
Global rank:112
Market cap:$118,682,481 AUD
Current price:$0.1855 AUD
All time high price:$2.25 AUD
1 day:+54.41%
7 day:+49.73%
1 year:+330.15%

Civic Price Analysis

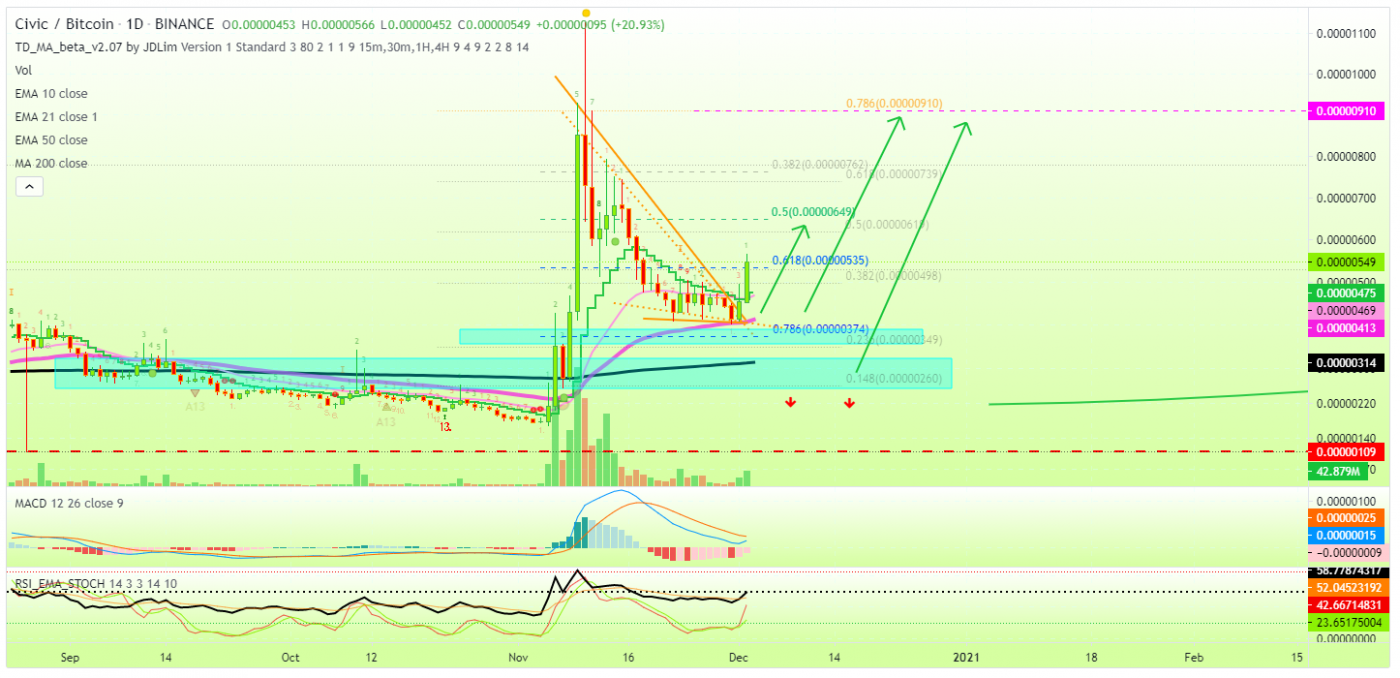
At the time of writing, CVC is ranked 112th cryptocurrency globally and the current price is $0.1855 AUD. This is a +54.41% increase in a single day as shown in the chart below.
Source: TradingView

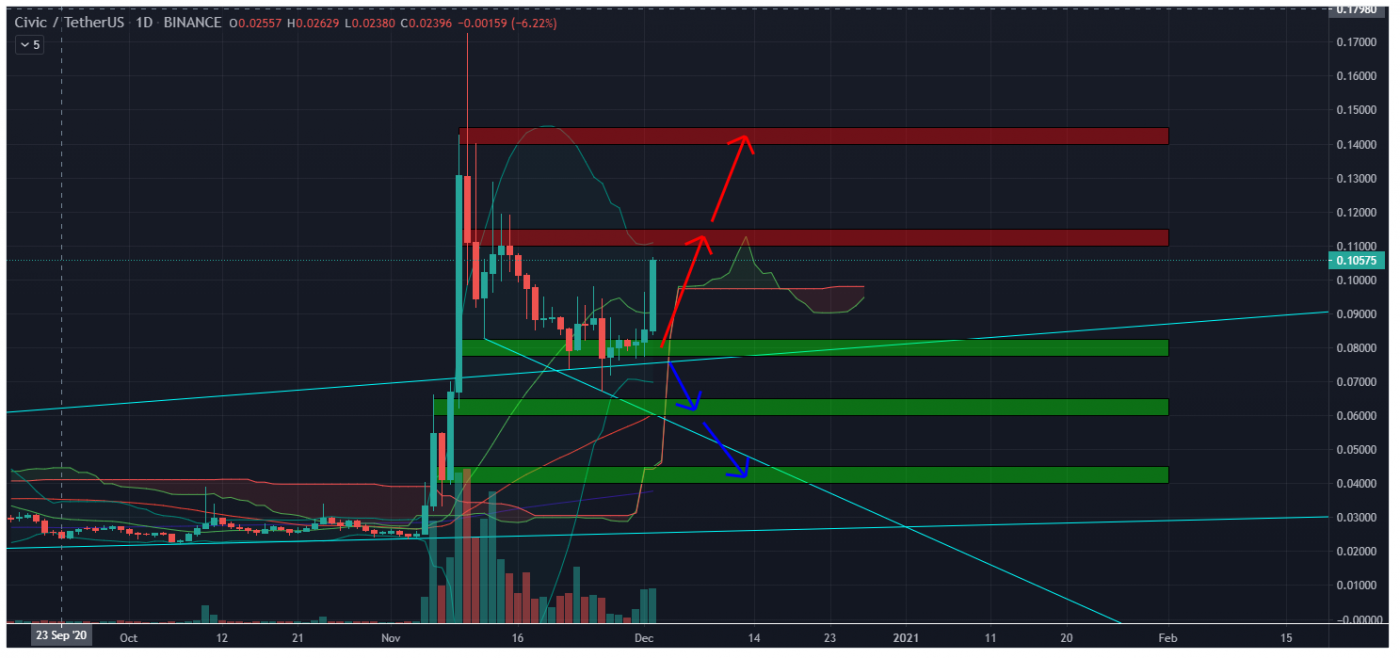
After looking at the above 1-day candle chart, we can clearly see that Civic was trading inside the falling wedge pattern on the CVC/BTC pair. The first resistance was on the $0.1456 AUD price level which CVC broke with a strong bullish trend buying volume and is now heading towards the next resistance at $0.2935 AUD & $0.3555 AUD respectively. Seeing that many altcoins are waking up bullish today, CVC is likely to continue to increase.

“The falling wedge pattern is a continuation pattern formed when price bounces between two downward slopings, converging trendlines. It is considered a bullish chart formation but can indicate both reversal and continuation patterns – depending on where it appears in the trend”
Source: TradingView

What do the Technical indicators say?

The  Civic TradingView indicators (on the 1 day) mainly indicate CVC as a strong buy, except the Oscillators which indicate CVC as a buy.

So Why did Civic Breakout?

The recent rise in Bitcoin over 100% since the halving in May and then the suggested start of the Altcoin season could have contributed to the recent breakout. Another reason could be the whales, secretly stacking up CVC to their portfolio for this Altcoin rally. It could also be contributed to some of the recent news for the public demo of Launch Accelerator.

Recent Civic News & Events:

Where to Buy or Trade Civic?

Civic has the highest liquidity on Binance Exchange so that would help for trading CVC/USDT or CVC/BTC pairs. However, if you’re just looking at buying some quick and hodling then Swyftx Exchange is a popular choice in Australia.

Categories
Crypto News Market Analysis Trading

Sushi Swap Breakout Analysis – SUSHI Performing Active Uptrend with +51% Gains in a Week

SushiSwap is trading in uptrend here like many other altcoins are. The Cryptocurrency SuhsiSwap SUSHI just went up +18% in a single day and surges over +51% in a week.

What is SushiSwap?

SushiSwap (SUSHI) is an example of an automated market maker (AMM). An increasingly popular tool among cryptocurrency users, AMMs are decentralized exchanges that use smart contracts to create markets for any given pair of tokens.

SushiSwap Quick Stats

SYMBOL:SUSHI
Global rank:51
Market cap:$470,260,452 AUD
Current price:$3.01 AUD
All time high price:$4.23AUD
1 day:+18.4%
7 day:+51.70%
1 year:+274.34%

SushiSwap Price Analysis

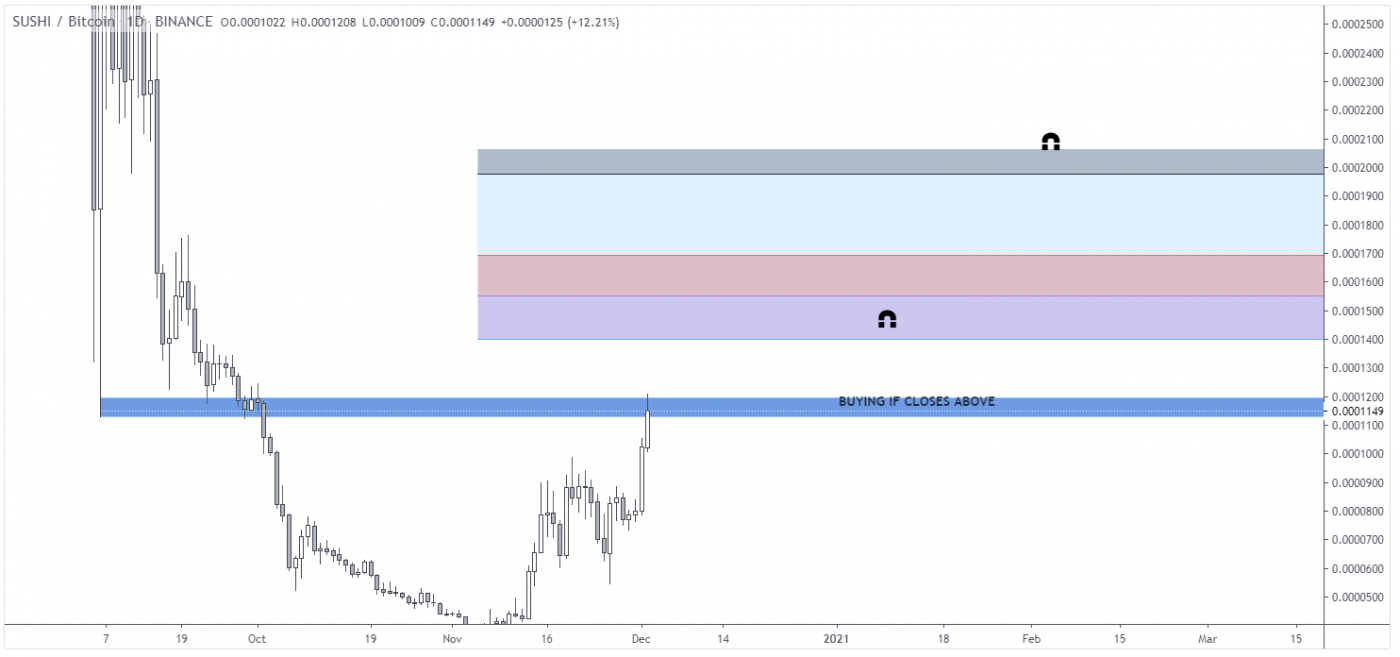
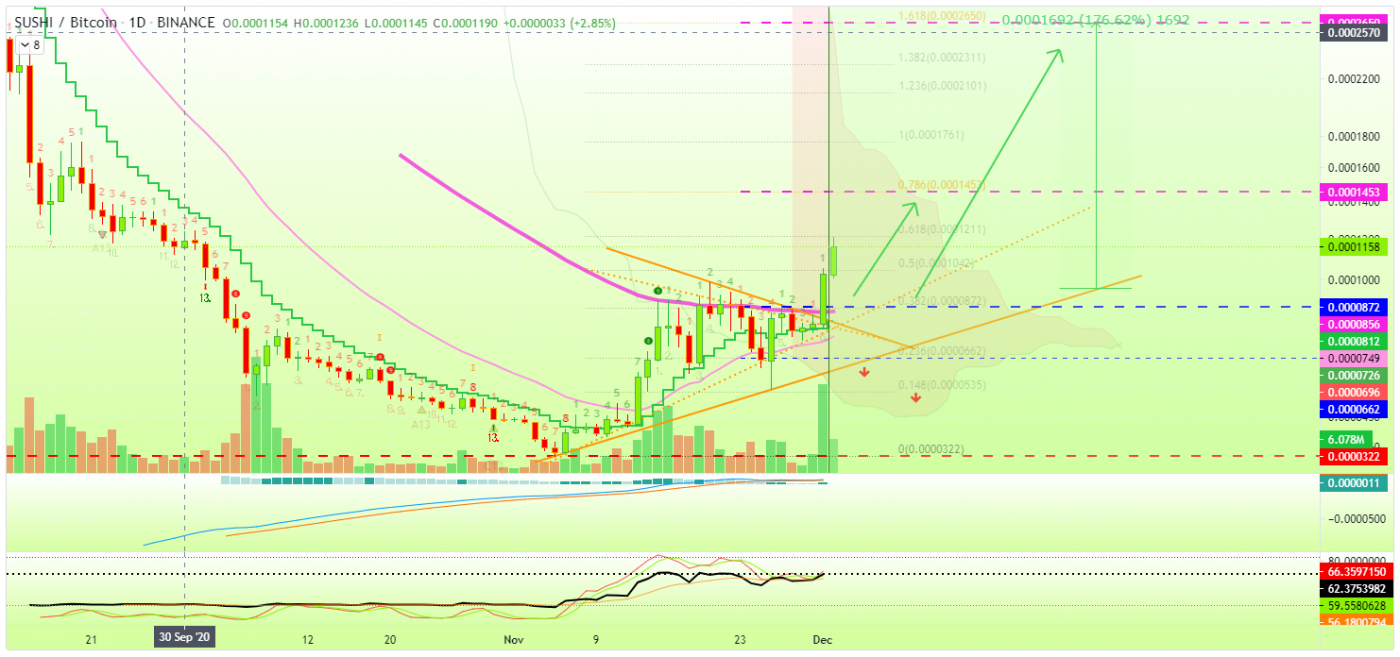
At the time of writing, SUSHI is ranked 51st cryptocurrency globally and the current price is $3.02 AUD. This is a +51% increase since 26 November 2020 (7 days ago) as shown in the chart below.

Source: TradingView

If we see the above 1-day candle chart, SushiSwap just bounced back from its support levels of $2.13 AUD and holding its position strong for the breakout from the next resistance which is at $3.61 AUD. The blue line is acting as a support level for this Ascending triangle trend.

“An ascending triangle is a chart pattern used in technical analysis. It is created by price moves that allow for a horizontal line to be drawn along the swing highs, and a rising trendline to be drawn along the swing lows. The two lines form a triangle. Traders often watch for breakouts from triangle patterns.”

Source: TradingView

What do the technical indicators say?

The SushiSwap SUSHI TradingView indicators (on the 1 day) mainly indicate SUSHI as a buy, except the Oscillators which indicate SUSHI as a neutral.

So Why did SUSHI Breakout?

The recent rise in Bitcoin over 100% since the halving in May and then the suggested start of the Altcoin season could have contributed to the recent breakout. It could also be contributed to some of the recent events where an increase in yields for incentivized pools.

Recent SushiSwap News & Events:

Where to Buy or Trade SUSHI?

SUSHI has the highest liquidity on Binance Exchange so that would help for trading SUSHI/USDT or SUSHI/BTC pairs. However, if you’re just looking at buying some quick and hodling then Swyftx Exchange is a popular choice in Australia.

Categories
Bitcoin Crypto News Cryptocurrencies

$860 Million In Crypto Wiped Out in a Single day — An Even More Volatile Market Ahead

These past two weeks have been interesting for the cryptomarket world: an overall bullish trend and a new all-time high of $19,918 for Bitcoin since 2017 — more financial institutions savagely acquiring BTC, famous investors highlighting crypto in general and, even more insane: at least $860 million in Bitcoin, Ethereum, XRP, and other alts were liquidated this Tuesday, in just a few hours.

But Bitcoin takes the lead on ramping liquidations — recent data from Bybt shows how exchanges were massively liquidating trading positions after BTC dropped from 19,900 to 18,000 — which means that more than 80,500 long traders sold off their futures to avoid bigger losses.

Futures Liquidation Data chart: Source: Bybt

Binance Takes The Lead

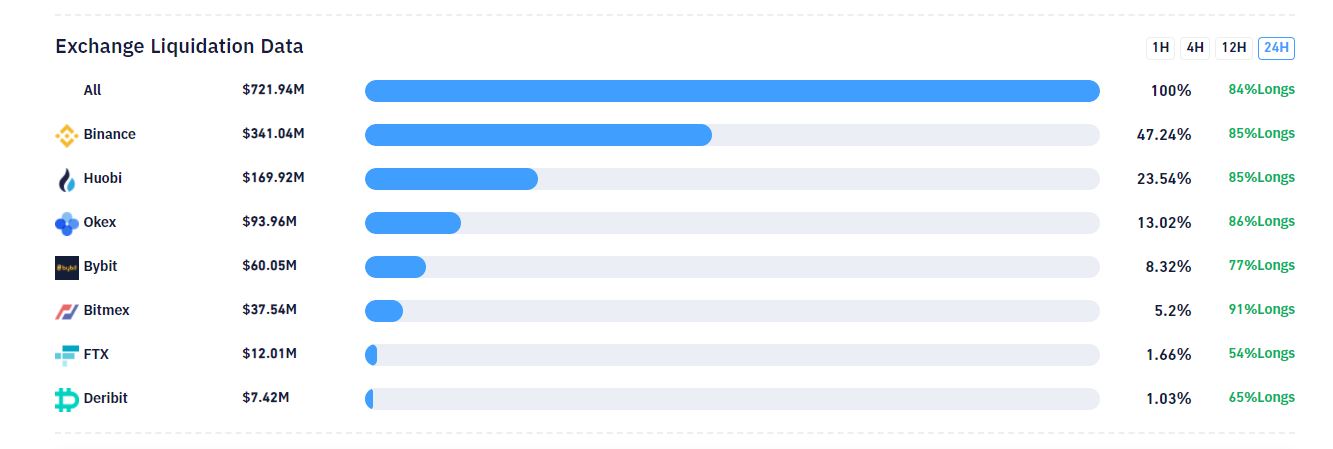
Binance is the current platform with the most liquidated positions — and long positions were 85 % of that sum. In a single order, a trader lost $6 million on the Singapore-based Huobi-BTC, which is the largest liquidation in a single order.

This Tuesday, investors were looking to hit $20,000 on Bitcoin after the price surged again at the beginning of this week. Sadly, it never went above 19,918. This second drop — from 19,900 to 18,000 — caused more than $370 million in liquidations in less than a single hour.

Now, in Bitcoin alone, the number appears to go as high as $720M at the moment of writing.

Exchange Liquidation Data. Source: Bybt

“It Was Just A Bull Trap”

However, some traders think that this was just a correction, and a more volatile market is ahead, just as Gleen Goldman, lays it out on his Twitter account:

$20,000 is a major resistance level, and we are now seeing volumes that are rarely traded. There’s a lot of uncertainty surrounding the next move of Bitcoin, so traders must take measures before entering the market again.

Categories
Crypto News

Aussie BTC Markets to Self-report to OAIC Over Erroneously-exposed Users Info

Leading Australian digital currency exchange, BTC Markets had mistakenly exposed customers’ contact information today while trying to send out a message to them through email. Having explained how the incident occurred, the cryptocurrency exchange expressed their remorse for the data breach. To that extent, BTC Markets said it’s ready to self-report the development to the Office of Australian Information Commissioner (OAIC).

How Users’ Contact Information Got Exposed

As the Australian exchange explained, it sends out messages to customers through email, using an external system. BTC Markets first runs test emails with the system before proceeding with the actual message. This method has been practically working for the exchange for a number of years now, until the malfunction today. The exchange precisely explained:

“However, today, our testing didn’t pick up that the sample email addresses in the batch were added to the same email, rather than sent individually. In this case, the batch sizes were under 1,000 email addresses.”

BTC Markets said it was impossible to prevent the error when it was realized because the whole process was very quick. Consequently, the contact details, such as users’ names and email addresses, were exposed in the messages. “This is a deeply regrettable situation, and we apologize wholeheartedly for it,” the exchange wrote, adding that the security of its users is of paramount importance to them.

BTC Markets to Self-report to OAIC

Meanwhile, BTC Markets said it would self-report the incident to the Office of Australian Information Commissioner and comply with whatever be the requirements for the data breach reporting. To ensure the adequate safety of users, the exchange will also undergo an internal review to tighten up its data security. 

About users’ assets, BTC Markets assured that they are unaffected and secured. “Our external communication process has no interaction with our internal system, and no password data was exposed.”

Categories
Crypto News

Facebook’s Libra Association Rebrands to ‘Diem’ as it Prepares for 2021 Launch

The independent Libra association, which spearheads the development of the Facebook-linked LIbra digital currency, announced Tuesday it is rebranding to “Diem,” as it prepares to launch the US dollar-backed Libra stablecoin next year. The rebranding could be viewed as another move from the organization to gain regulatory clarity for the project which has faced intense scrutiny from global regulators. 

The Diem Project is Gaining Ground

When the social media platform introduced the Libra project, it described plans to launch the digital currency as a multi-currency stablecoin. This initiative was greatly challenged by different regulators of the world, who expressed that Libra might undermine the financial stability of several economies. The regulatory scrutiny of the project led to the departure of many prominent companies who joined the-now Diem Association during the time.

Due to the regulatory issues, the association recently decided to launch the long-planned Libra as a stablecoin backed by a single fiat currency, starting with the US dollar. The stablecoin is expected to launch as early as January, according to the previous report by Crypto News Australia. Separate support for other fiat currency is expected to be announced at a later date. 

A Push for Regulatory Acceptance 

The developments so far are all coming from the association to convince regulators that the Diem project is only aimed at “building a safe, secure and compliant payment system that empowers people and businesses around the world.” With the new name, the association said it’s reinforcing their organizational independence to ensure that the Diem project debuts in full compliance with regulatory expectations.

While commenting on the development today, the CEO at Diem Association, Stuart Levey, said:

“We are committed to doing so in a way that promotes financial inclusion – expanding access to those who need it most, and simultaneously protecting the integrity of the financial system by deterring and detecting illicit conduct. We are excited to introduce Diem – a new name that signals the project’s growing maturity and independence.”

Categories
Crypto News Initial Coin Offering Market Analysis Trading

SKALE Network Breakout Analysis – SKL Pumps +173% on Binance Launchpad

After the launch of Skale Network on Binance Launchpad today, SKL took a strong Breakout with +173% gains in a single day. Let’s take a quick look at SKL, price analysis, and possible reasons for the recent breakout.

What is Skale?

SKALE Network’s modular protocol is one of the first of its kind to allow developers to easily provision highly configurable blockchains, which provide the benefits of decentralization without compromising on computation, storage, or security.

Skale Quick Stats

SYMBOL:SKL
Global rank:269
Market cap:$62,644,180 AUD
Current price:$0.1138 AUD
All-time high price:$0.1969 AUD
1 day:+173.26%
7 day:+255.70%
1 year:+256.74%

Skale Price Analysis

At the time of writing, SKL is ranked 269th cryptocurrency globally and the current price is $0.1138 AUD. This is a +173.26% increase since the launch of its ICO at Binance Launchpad today (1 December 2020). Have a look at the chart below for price analysis.

Source: Binance-TradingView

After the launch of Skale on Binance Launchpad, It pumped up to $0.1912 AUD having +385% gains in just a few minutes and the initial opening price of SKL was $0.0413 AUD at Binance Exchange with many different trading pairs like SKL/BTC, SKL/USDT, and SKL/BUSD.

Currently, SKL is trading at $0.1138 AUD price levels after breaking out the squeeze resistance in its sideways trend & now heading towards its all-time high price.

What do the technical indicators say?

The Skale TradingView indicators (on the 1 day) mainly indicate SKL as a strong buy, except the Oscillators which indicate SKL as a neutral.

So Why did Skale Breakout?

After the opening at Binance Launchpad, mostly ICO’s pumps after going live on exchange for trade and, the recent rise in Bitcoin over 100% since the halving in May and then the suggested start of the Altcoin season could have contributed to the recent breakout. It could also be contributed to some recent news where Skale gets listed on more exchanges.

Recent Skale News & Events:

Where to Buy or Trade Skale?

Skale has the highest liquidity on Binance Exchange so that would help for trading SKL/USDT or SKL/BTC pairs. However, if you’re just looking at buying some quick and hodling then Swyftx Exchange is a popular choice in Australia.
Categories
Coinjar Crypto News

CoinJar – Monthly News Recap November 2020

This is our monthly Partners news recap for CoinJar to keep you updated on what’s been happening with them this month and what they have upcoming.

YFI and UNI are now available for trading on CoinJar!

YFI and UNI are now available for trading on CoinJar!

We’re excited to welcome the following ERC-20 tokens YFI and UNI to the CoinJar lineup!

These tokens will  be automatically added to new purchases of the CoinJar DeFi Bundle, the CoinJar ERC-20 Bundle, and CoinJar Universe Bundle. Existing owners of these bundles will not be impacted, and will need to unbundle and re-purchase the desired bundle.

Changes to CoinJar Exchange fees from 1st of December 2020

Changes to CoinJar Exchange fees from 1st of December 2020

All users will benefit from our new reduced Taker fees, while Maker fees will be increased for users with 30-day volume tiers above AUD $10,000. Read more.

  • Taker fees will be lowered to 0.20% for volume Tier 1, 0.15% for volume Tier 2, 0.12% for volume Tier 3, 0.10% for volume Tier 4, 0.08% for volume Tier 5 and 0.00% for Crypto Trading Pairs* across all volumes.
  • Maker fees will be increased to 0.12% for volume Tier 2, 0.10% for volume Tier 3, 0.08% for volume Tier 4, 0.05% for volume Tier 5 and 0.05% for Crypto Trading Pairs* across all volumes.
  • No change to existing Maker volume tiers below $10,000.

Stay up to date with CoinJar

Established in 2013, CoinJar is the easiest way to buy, sell, store and spend cryptocurrencies in the UK and Australia. CoinJar’s iOS and Android apps allow users to trade cryptocurrencies on the go, while CoinJar Exchange and CoinJar OTC Trading Desk cater for professional traders, as well as individuals and institutions looking to make larger transactions.

Website: https://www.coinjar.com/au/
Twitter: https://twitter.com/getcoinjar
Facebook: https://www.facebook.com/CoinJar/
LinkedIn: https://www.linkedin.com/company/coinjar/

Categories
Crypto News Ethereum

Ethereum 2.0 Phase 0 has More Than Enough Staked ETH for Tomorrow’s Launch

Last week, the Ethereum 2.0 deposit contract gained the required number of Ethereum coins, or ETH needed to kick-off the blockchain’s transition to the Proof-of-Stake (PoS). Although the threshold has already been met, the Ethereum community didn’t back out from locking more ETH on the network. This demonstrates a strong level of confidence the community has for the long-anticipated Ethereum 2.0 or Serenity upgrade.

Eth2 Deposit Contract has Over US$500 Million ETH

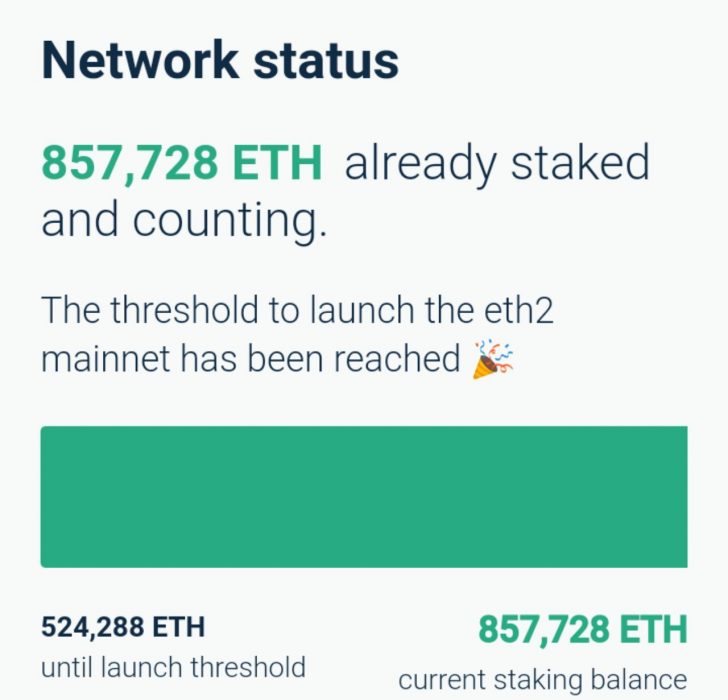
According to the information on Eth2 Launchpad, there are presently 857,728 ETH staked on the deposit contract. This is more than 60 percent the stated threshold of 524,288 ETH and currently worth over US$518 million, following the growing price of the crypto at $605 on Coinmarketcap. An Ethereum 2.0 researcher at Ethereum Foundation, Justin Drake, commented on the development, saying:

“It is a fantastic display of confidence by the Ethereum community. […] I’m proud thousands of Ethereans felt compelled to lock their funds for many months to secure Eth2.”

It’s worth noting that these cryptocurrencies can’t be withdrawn from the network for at least two years later when Phase 1.5 is deployed. Tomorrow’s Eth2 Phase 0 launch marks the first step towards the transition of the current Ethereum blockchain to the PoS era. Phase 0 is expected to launch by 12 UTC on December 1. It will enable the Beacon Chain on the network, which acts as a backbone for Ethereum 2.0.

The highly anticipated Serenity upgrade is expected to undergo about four development phases before its completion. It’s estimated that these phases might take about two years (i.e., 2022). However, there are speculations that the network might take more time to be completed, as many hurdles may possibly be encountered while being deployed.

Ethereum Nodes Surpass Bitcoin’s

Besides the upcoming Eth2 Phase 0, reports on Monday also confirmed a growing number of Ethereum nodes during these times. Currently, Ethereum has about 11,137 nodes, while the largest blockchain network, Bitcoin, has only 10,981.

Categories
Crypto News Market Analysis Trading

Kusama Breakout Analysis – KSM Pumps +35% in a Week with Strong Bullish Trend

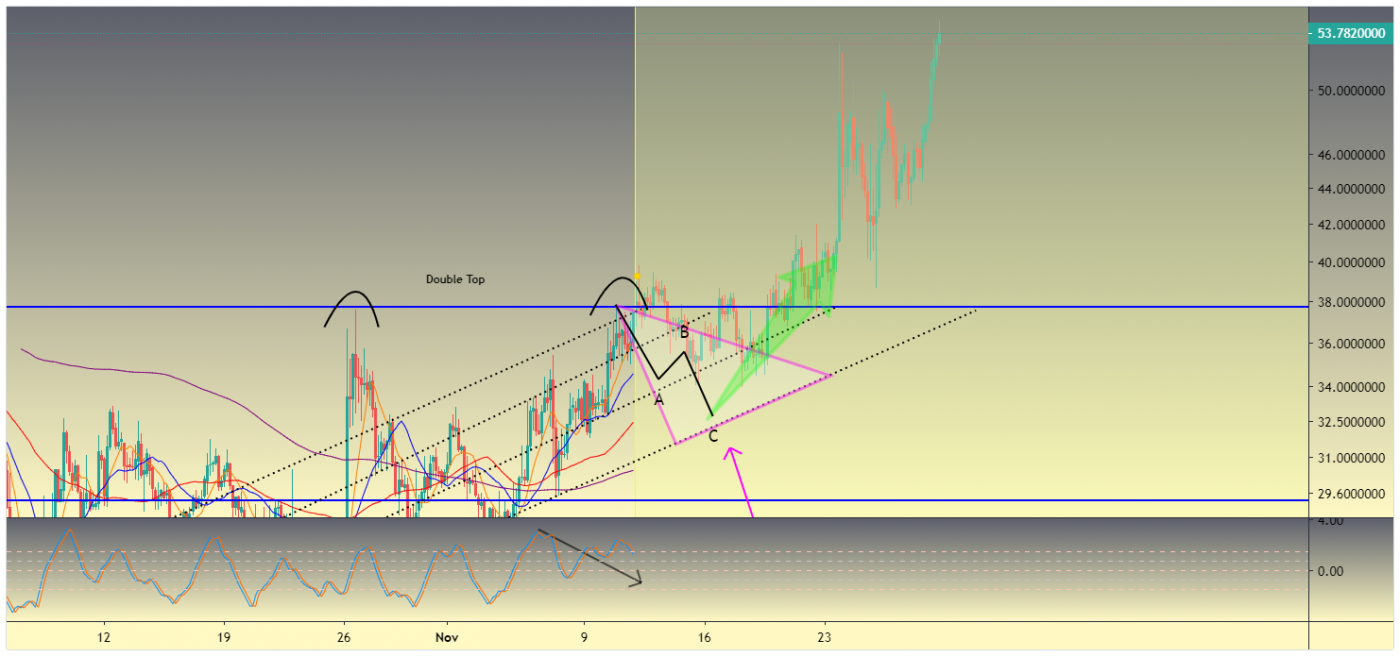
KSM was squeezing inside the double top pattern on a 4-hour candle chart, it just went up over +35% in the last 7 days. Let’s take a quick look at KSM, price analysis, and possible reasons for the recent breakout.

What is Kusama KSM?

Self-described as “Polkadot’s wild cousin,” Kusama is an experimental blockchain platform that is designed to provide a massively interoperable and scalable framework for developers.

Kusama is built on substate — a blockchain building kit developed by Parity Technologies. Kusama has almost the same codebase as Polkadot — one of the most successful interoperable blockchains.

KSM Quick Stats

SYMBOL:KSM
Global rank:46
Market cap:$615,973,312 AUD
Current price:$72.36 AUD 
All time high price:77.09 AUD
1 day:+13.44%
7 day:+35.74%
1 year:+79.76%

KSM Price Analysis

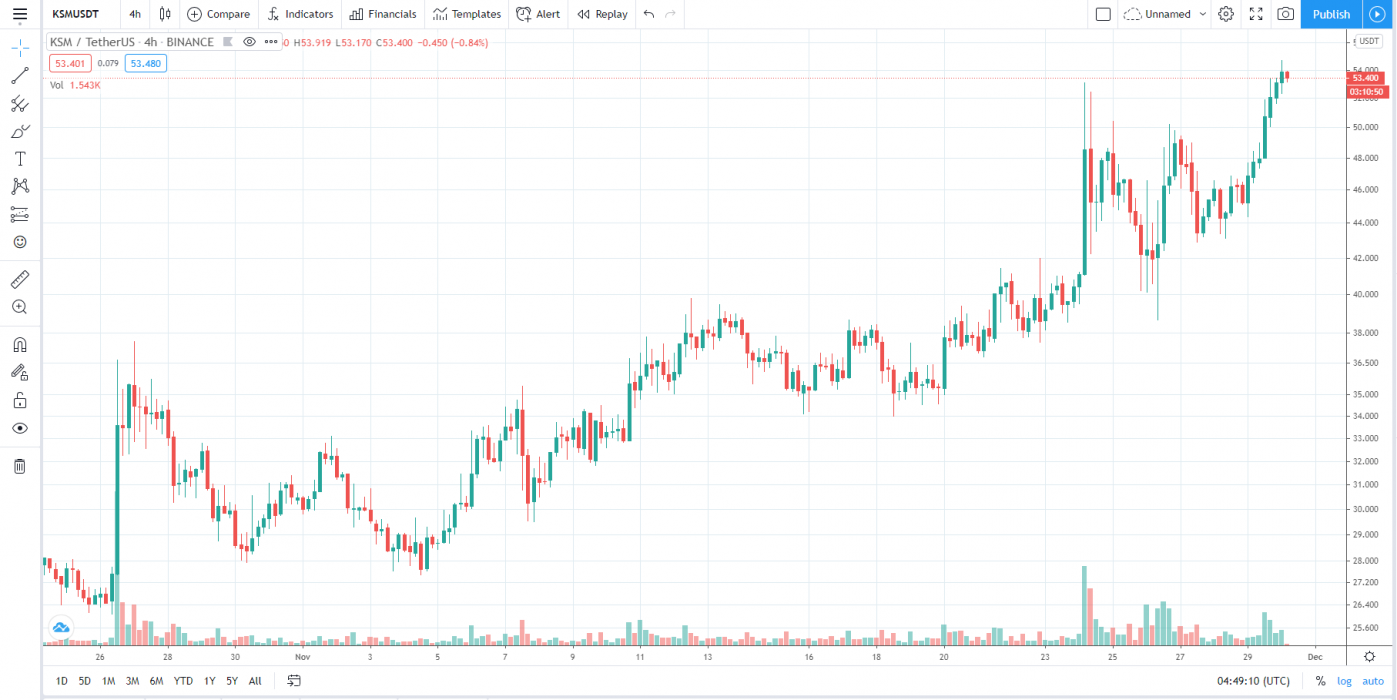
At the time of writing, KSM is ranked 46th cryptocurrency globally and the current price is $72.36 AUD. This is a +35.74% increase since 24 November 2020 (7 days ago) as shown in the chart below.

Source: TradingView

After looking at the above 4-hour candle chart, we can clearly see that KSM touched the Double Top before forming (A-B-C Triangle Pattern) on the KSM/USDT pair. The first resistance was on the $42.00 AUD price levels from which KSM broke with a strong bullish trend buying volume and is now heading towards its ATH all-time high price.

The above triangle pattern John called it the ABC pattern, which he defines in simple terms: “It’s a stop run of the first pullback after an aggressive move to the upside that signifies more potential in the direction of the larger movement.”

Source: TradingView

If we zoom out the live price chart and take a look at the price over the past few days or so, we can see the recent breakout more clearly, the trend is almost parabolic & bullish which looks insane.

What do the Technical indicators say?

The  Kusama KSM TradingView indicators (on the 1 day) mainly indicate KSM as a strong buy, except the Oscillators which indicate KSM as a buy.

So Why did KSM Breakout?

The recent rise in Bitcoin over 100% since the halving in May and then the suggested start of the Altcoin season could have contributed to the recent breakout. Another reason could be the whales, secretly stacking up KSM to their portfolio for the next Altcoins rally. It could also be contributed to some of the recent news where ChainX issued a KusamaNetwork

Recent KSM News & Events:

Where to Buy or Trade Kusama KSM?

Kusama has the highest liquidity on Binance Exchange so that would help for trading KSM/USDT or KSM/BTC pairs. However, if you’re just looking at buying some quick and hodling then Swyftx Exchange is a popular choice in Australia.
Categories
Crypto News Litecoin Market Analysis Trading

Litecoin LTC Breakout Analysis – LTC with +16% Gains in a Single Day

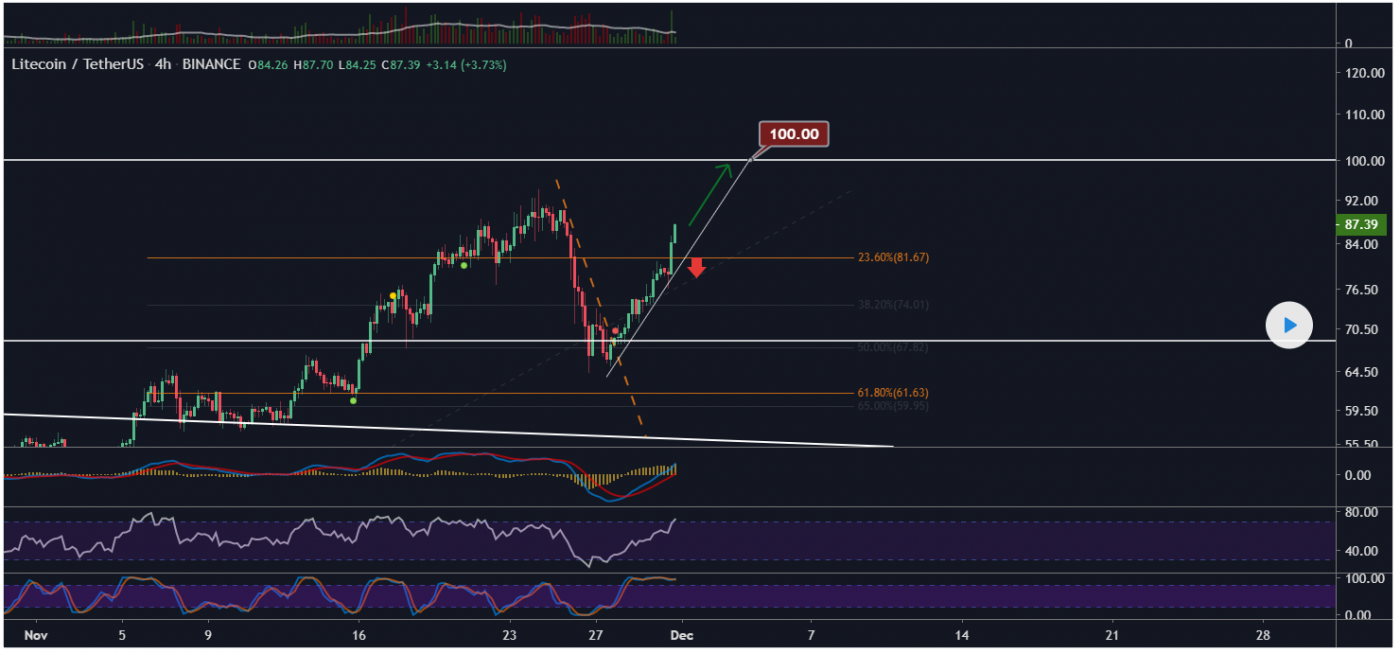
Litecoin LTC is flipping on a 4-hour candle chart, LTC just went up over +16% in a single day. Let’s take a quick look at LTC price analysis and possible reasons for the recent breakout.

What is Litecoin?

Litecoin is a peer-to-peer Internet currency that enables instant, near-zero cost payments to anyone in the world. Litecoin is an open-source, global payment network that is fully decentralized without any central authorities.

Litecoin Quick Stats

SYMBOL:LTC
Global rank:6
Market cap:$7,763,926,899 AUD
Current price:$115.84 AUD
All time high price:$509.34 AUD
1 day:+16.42%
7 day:+5.42%
1 year:+83.99%

Litecoin Price Analysis

At the time of writing, LTC is ranked 6th cryptocurrency globally and the current price is $115.84 AUD. This is a +5.42% increase since 24 November 2020 (7 days ago) as shown in the chart below.

Source: TradingView

If we see the above 4-hour candle chart, LTC did a strong breakout from the falling wedge pattern & is now heading towards its major resistance of the month. After BTC did a new historical high today, LTC looks well-positioned to test the $100 AUD price levels.

“The Falling Wedge is a bullish pattern that begins wide at the top and contracts as prices move lower. This price action forms a cone that slopes down as the reaction highs and reaction lows converge.”

Source: TradingView

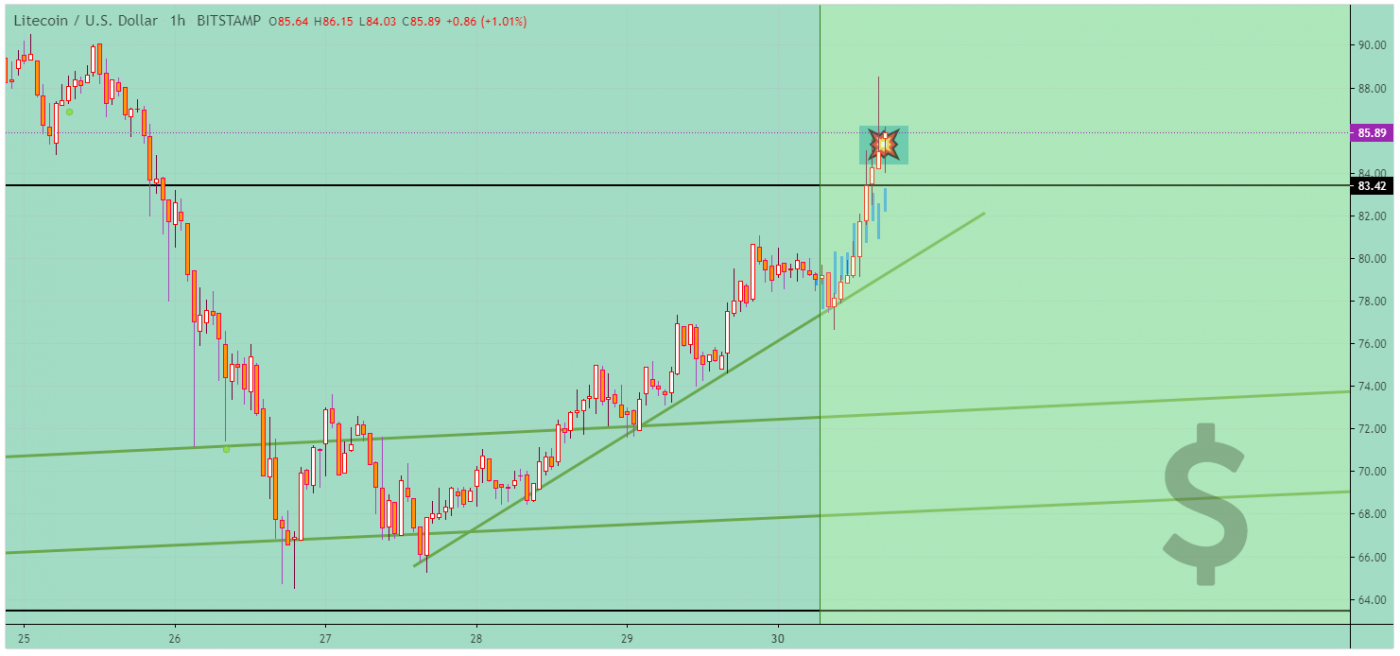
When the price reached the lower support line, LTC immediately began its upward movement. The price was again able to break through the upper lines and continue to grow. Now the Litcoin is moving along the support line that accompanies the initiative from the very beginning of the price growth.

What do the technical indicators say?

The Litecoin LTC TradingView indicators (on the 1 day) mainly indicate LTC as a buy, except the Oscillators which indicate sell as a neutral.

So Why did Litecoin Breakout?

The recent rise in Bitcoin over 100% since the halving in May and then the suggested start of the Altcoin season could have contributed to the recent breakout. Another reason could be the whales secretly buying LTC for the next Altcoins rally & it could also be contributed to some of the recent events.

Recent Litecoin News & Events:

Where to Buy or Trade Litecoin?

LTC has the highest liquidity on Binance Exchange so that would help for trading LTC/USDT or LTC/BTC pairs. However, if you’re just looking at buying some quick and hodling then Swyftx Exchange is a popular choice in Australia.