NANO has already gone up over +51.55% this month, and the trading analysis suggests that there might be another wave incoming. Let’s take a look at NANO and what the charts are telling us.
What is Nano?
Nano is a digital currency for the real world – the fast and free way to pay for everything in life, with instant transactions, zero fees, and a scalable network.
Nano Quick Stats
| Symbol: | Nano |
| Global rank: | 78 |
| Market cap: | $203,749,249 AUD |
| Current price: | $1.52 AUD |
| All time high price: | $50.97 AUD |
| 1 day: | +8.69% |
| 7 day: | +51.55% |
| 1 year: | +37.63% |
Nano Price Analysis
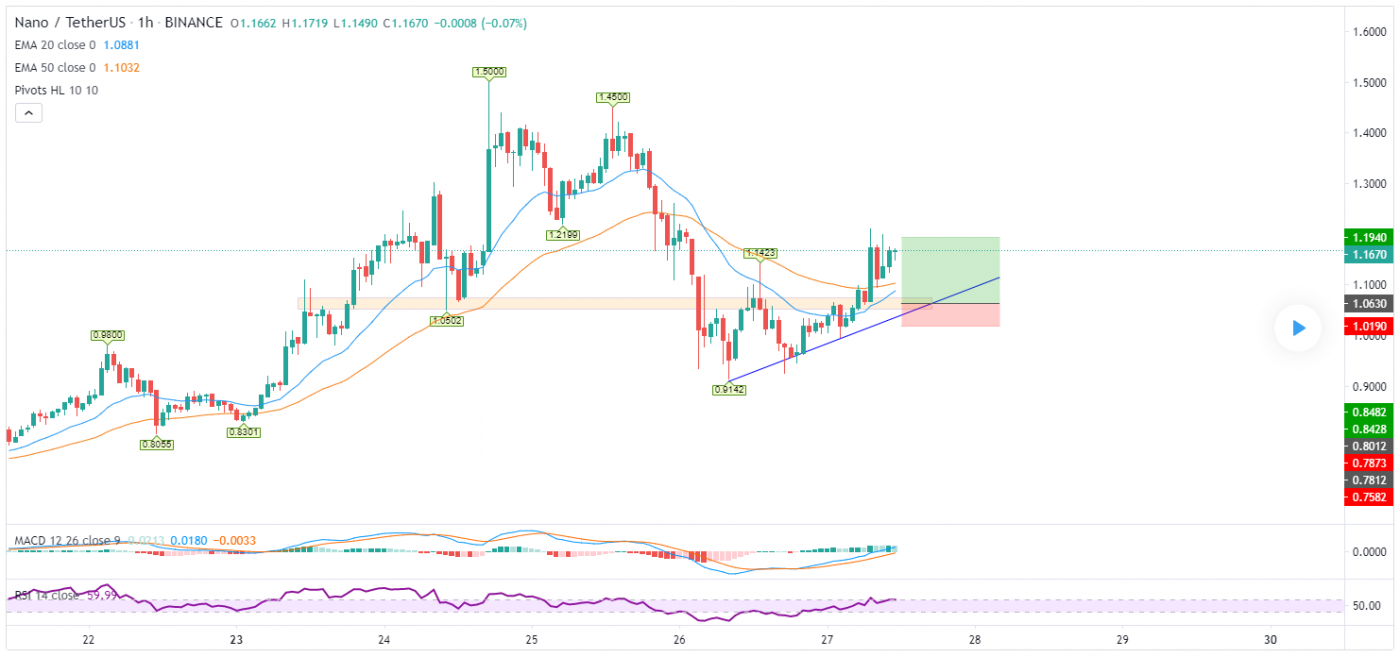
At the time of writing, Nano is ranked 78th cryptocurrency globally and the current price is $1.52 AUD. This is a +51.55% increase since 21 November 2020 (7 days ago) as shown in the chart below.

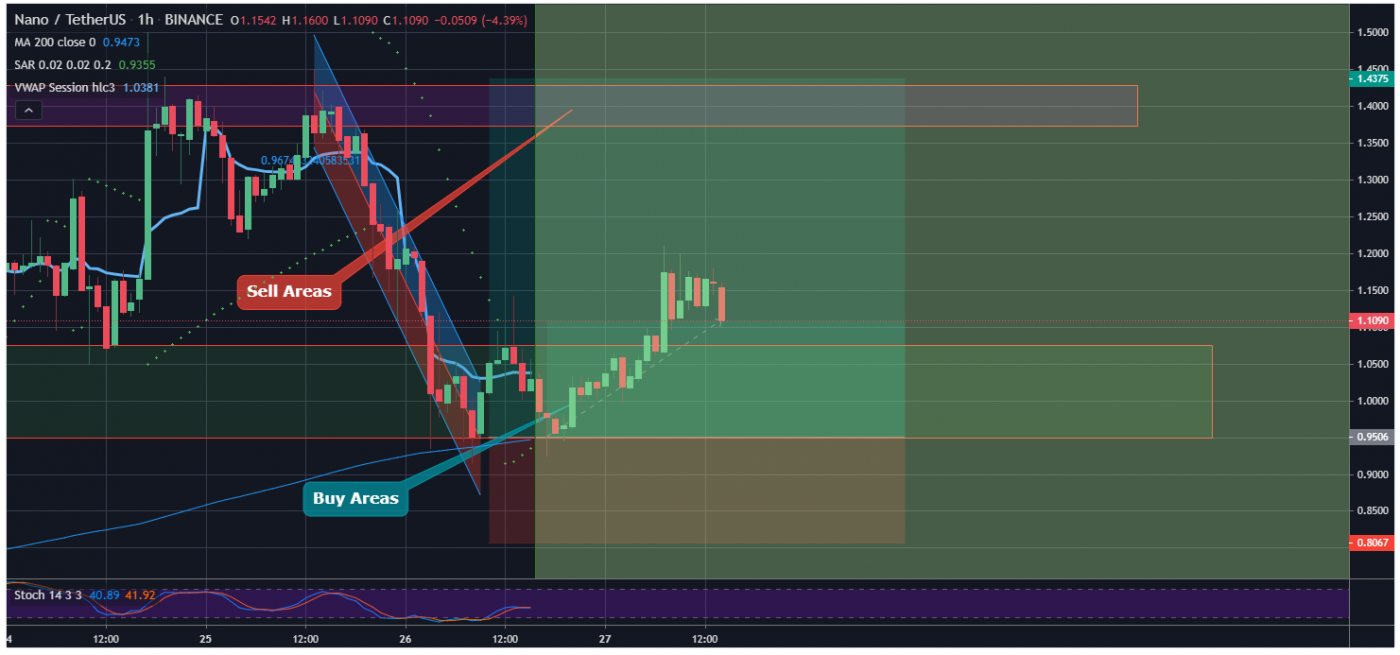
If we see the 1-hour candle chart, Nano just bounced back from its support levels of $1.0120 AUD and holding its position strong for the breakout from the next resistance which is at $1.6150 AUD. The blue line is acting as a support level for this Ascending triangle trend.
“An ascending triangle is a chart pattern used in technical analysis. It is created by price moves that allow for a horizontal line to be drawn along the swing highs, and a rising trendline to be drawn along the swing lows. The two lines form a triangle. Traders often watch for breakouts from triangle patterns.”

What do the technical indicators say?

The NANO TradingView indicators (on the 1 day) mainly indicate Nano as a buy.
Recent Nano News & Events:
- 26 November 2020 – UnrealEngine Nano
- 26 November 2020 – BlackFriday Discount on SwapZone
Where to Buy or Trade Nano?
Nano has the highest liquidity on Binance Exchange so that would help for trading NANO/USDT or NANO/BTC pairs. However, if you’re just looking at buying some quick and hodling then Swyftx Exchange is a popular choice in Australia.

