Categories
Crypto News Market Analysis Trading

KEEP3RV1 Breakout Analysis – Parabolic Breakout on KP3R with +74% Gains in a Single Day

Keep3rv1 just pumped up to +74% in a single day with a strong breakout on Binance & other Exchanges. Let’s take a quick look at KP3R, price analysis, and possible reasons for the recent breakout.

What is KP3R?

Keep3rV1 is a decentralized platform designed to facilitate the coordination between projects that need to source outside development operations and those who can provide those required services. Essentially, the project serves as a job board that facilitates the interaction between job posters, such as decentralized finance protocols, and job executors, known as Keepers.

KEEP3RV1 Quick Stats

SYMBOL:KP3R
Global rank:122
Market cap:$106,480,841 AUD
Current price:$529.18 AUD
All time high price:$586.24 AUD
1 day:+74.41%
7 day:+81.70%
1 year:+82.74%

KP3R Price Analysis

At the time of writing, KP3R is ranked 122nd cryptocurrency globally and the current price is $529.18 AUD. This is a +81% increase since 27 November 2020 (7 days ago) as shown in the chart below.
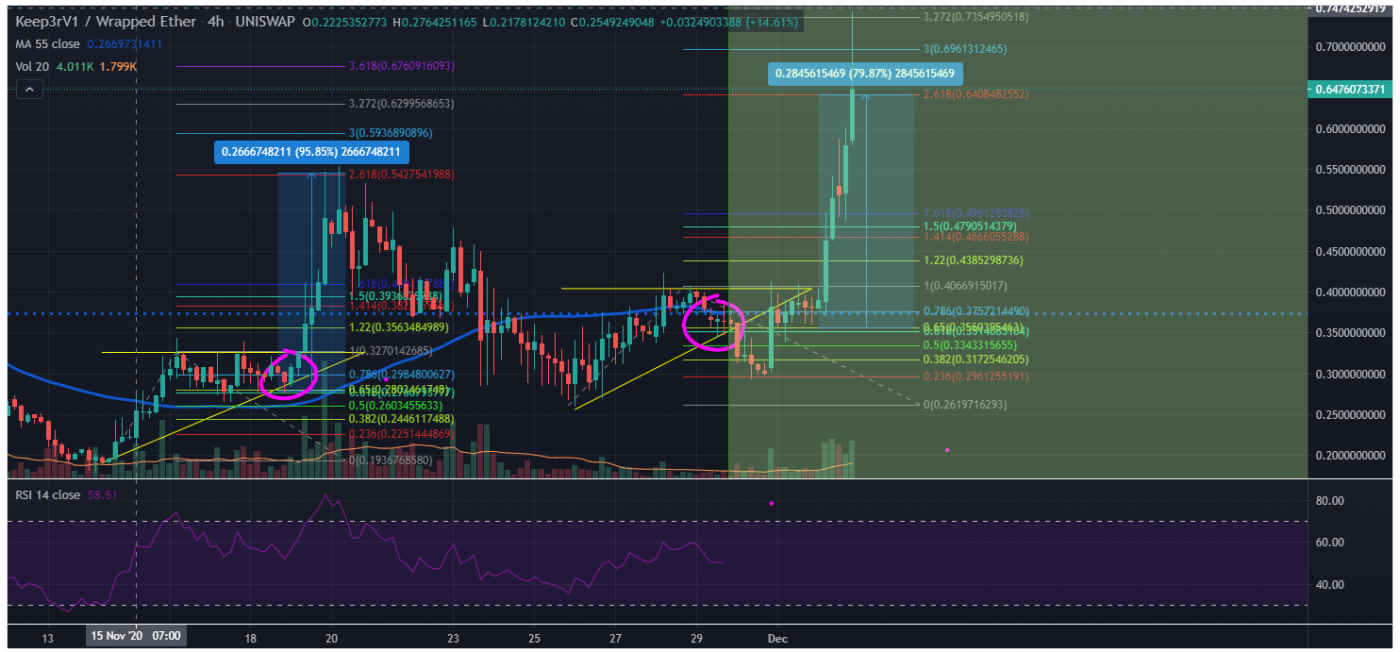
Source: TradingView

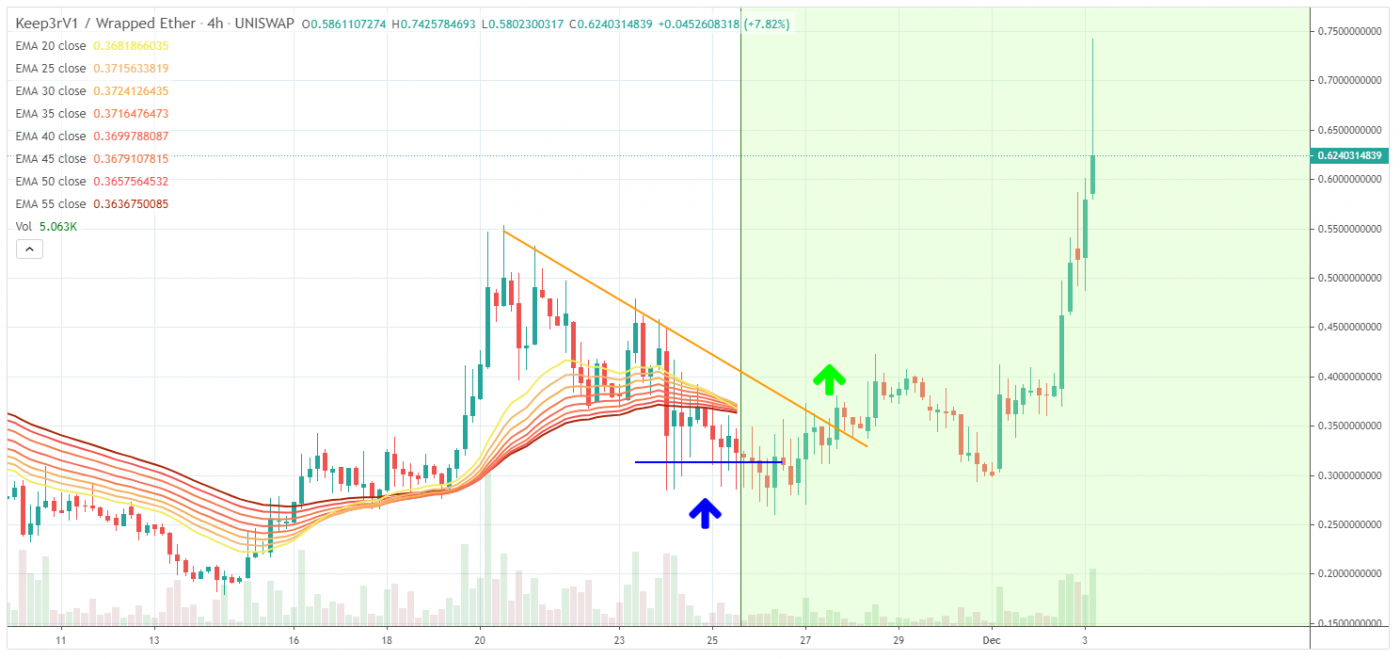
If we see the above 1-day candle chart, KP3R was trading inside the rising wedge pattern at $390.14 AUD price levels. KP3R just did an awesome breakout by breaking all the major resistances in a single day and is now currently trading at $529.18 AUD.

“A rising wedge is a technical indicator, suggesting a reversal pattern frequently seen in bear markets. This pattern shows up in charts when the price moves upward with pivot highs and lows converging toward a single point known as the apex.”
Source: TradingView

What do the technical indicators say?

The KEEP3RV1 TradingView indicators (on the 1 day) mainly indicate KP3R as a strong buy, except the Moving Averages which indicate KP3R as a buy.

So Why did KP3R breakout?

The recent rise in Bitcoin over 100% since the halving in May and then the suggested start of the Altcoin season could have contributed to the recent breakout in KP3R. Another big reason could be the whales secretly buying this coin for their portfolio which might give them huge profits in the next Altcoins rally. It could also be contributed to some of the recent events & news of Scaling Keep3r with Chainlink.

Recent KP3R News & Events:

Where to Buy or Trade KP3R?

KEEP3RV1 has the highest liquidity on Binance Exchange so that would help for trading KP3R/USDT or KP3R/BTC pairs. However, if you’re just looking at buying some quick and hodling then Swyftx Exchange is a popular choice in Australia.

Categories
Crypto News Market Analysis Trading

Civic Breakout Analysis – CVC Pumps +54% in a Single Day by Breaking Falling Wedge Pattern

Civic was squeezing inside the falling wedge pattern on a 1-day candle chart and it just went up over +54% in a single day. Let’s take a quick look at CVC, price analysis, and possible reasons for the recent breakout.

What is Civic?

Civic’s identity verification and protection tools give both businesses and individuals the power to control and protect their identities through the blockchain.

Civic Quick Stats

SYMBOL:CVC
Global rank:112
Market cap:$118,682,481 AUD
Current price:$0.1855 AUD
All time high price:$2.25 AUD
1 day:+54.41%
7 day:+49.73%
1 year:+330.15%

Civic Price Analysis

At the time of writing, CVC is ranked 112th cryptocurrency globally and the current price is $0.1855 AUD. This is a +54.41% increase in a single day as shown in the chart below.

Source: TradingView

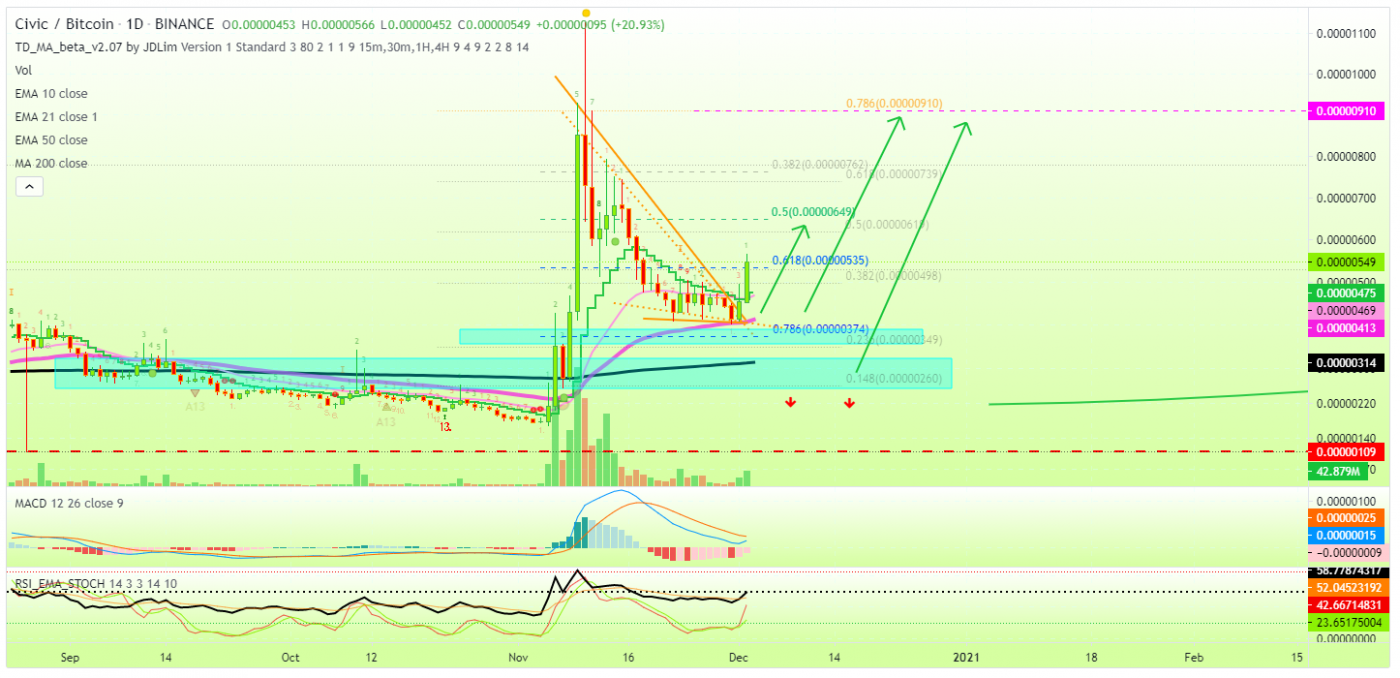
After looking at the above 1-day candle chart, we can clearly see that Civic was trading inside the falling wedge pattern on the CVC/BTC pair. The first resistance was on the $0.1456 AUD price level which CVC broke with a strong bullish trend buying volume and is now heading towards the next resistance at $0.2935 AUD & $0.3555 AUD respectively. Seeing that many altcoins are waking up bullish today, CVC is likely to continue to increase.

“The falling wedge pattern is a continuation pattern formed when price bounces between two downward slopings, converging trendlines. It is considered a bullish chart formation but can indicate both reversal and continuation patterns – depending on where it appears in the trend”

Source: TradingView

What do the Technical indicators say?

The  Civic TradingView indicators (on the 1 day) mainly indicate CVC as a strong buy, except the Oscillators which indicate CVC as a buy.

So Why did Civic Breakout?

The recent rise in Bitcoin over 100% since the halving in May and then the suggested start of the Altcoin season could have contributed to the recent breakout. Another reason could be the whales, secretly stacking up CVC to their portfolio for this Altcoin rally. It could also be contributed to some of the recent news for the public demo of Launch Accelerator.

Recent Civic News & Events:

Where to Buy or Trade Civic?

Civic has the highest liquidity on Binance Exchange so that would help for trading CVC/USDT or CVC/BTC pairs. However, if you’re just looking at buying some quick and hodling then Swyftx Exchange is a popular choice in Australia.

Categories
Crypto News Market Analysis Trading

Sushi Swap Breakout Analysis – SUSHI Performing Active Uptrend with +51% Gains in a Week

SushiSwap is trading in uptrend here like many other altcoins are. The Cryptocurrency SuhsiSwap SUSHI just went up +18% in a single day and surges over +51% in a week.

What is SushiSwap?

SushiSwap (SUSHI) is an example of an automated market maker (AMM). An increasingly popular tool among cryptocurrency users, AMMs are decentralized exchanges that use smart contracts to create markets for any given pair of tokens.

SushiSwap Quick Stats

SYMBOL:SUSHI
Global rank:51
Market cap:$470,260,452 AUD
Current price:$3.01 AUD
All time high price:$4.23AUD
1 day:+18.4%
7 day:+51.70%
1 year:+274.34%

SushiSwap Price Analysis

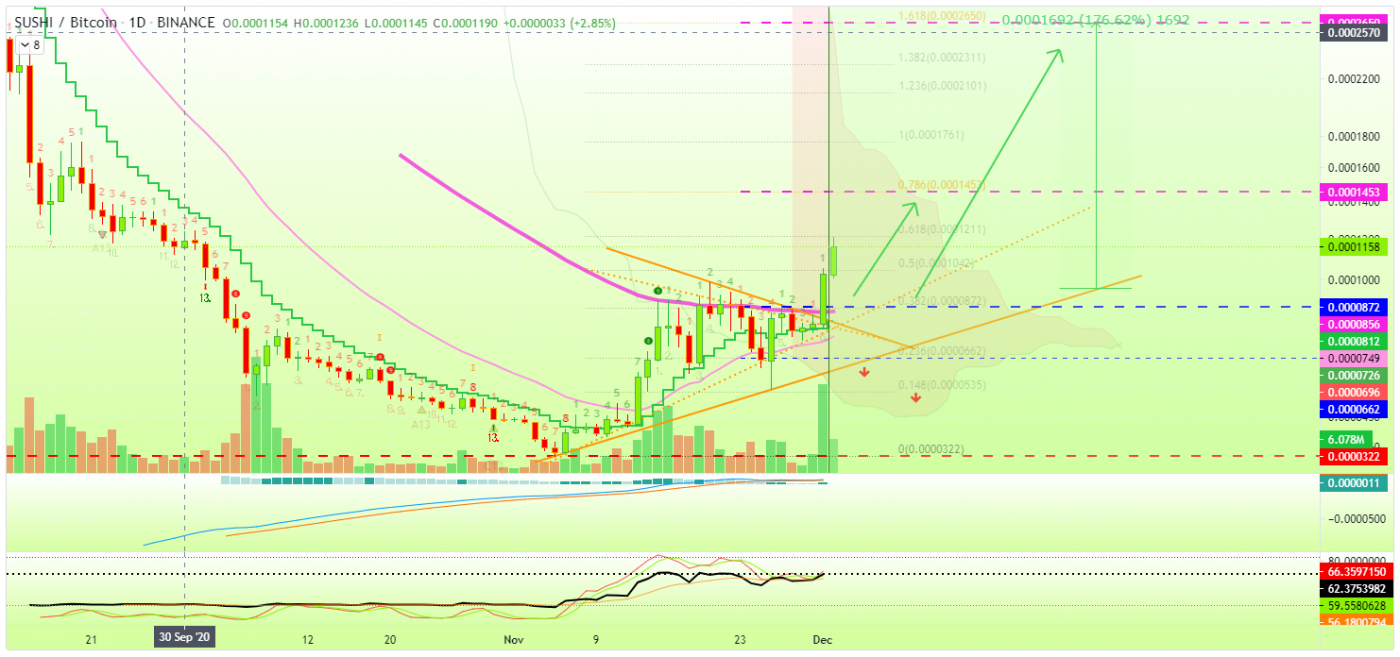
At the time of writing, SUSHI is ranked 51st cryptocurrency globally and the current price is $3.02 AUD. This is a +51% increase since 26 November 2020 (7 days ago) as shown in the chart below.

Source: TradingView

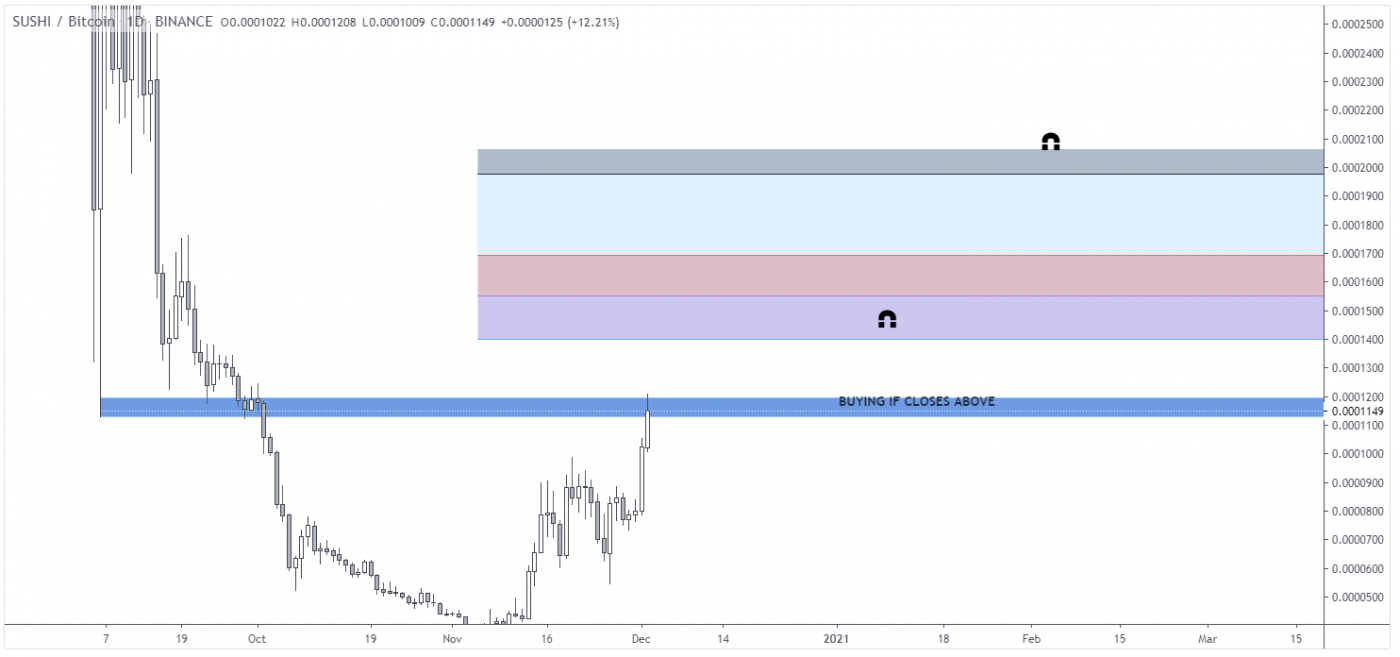
If we see the above 1-day candle chart, SushiSwap just bounced back from its support levels of $2.13 AUD and holding its position strong for the breakout from the next resistance which is at $3.61 AUD. The blue line is acting as a support level for this Ascending triangle trend.

“An ascending triangle is a chart pattern used in technical analysis. It is created by price moves that allow for a horizontal line to be drawn along the swing highs, and a rising trendline to be drawn along the swing lows. The two lines form a triangle. Traders often watch for breakouts from triangle patterns.”

Source: TradingView

What do the technical indicators say?

The SushiSwap SUSHI TradingView indicators (on the 1 day) mainly indicate SUSHI as a buy, except the Oscillators which indicate SUSHI as a neutral.

So Why did SUSHI Breakout?

The recent rise in Bitcoin over 100% since the halving in May and then the suggested start of the Altcoin season could have contributed to the recent breakout. It could also be contributed to some of the recent events where an increase in yields for incentivized pools.

Recent SushiSwap News & Events:

Where to Buy or Trade SUSHI?

SUSHI has the highest liquidity on Binance Exchange so that would help for trading SUSHI/USDT or SUSHI/BTC pairs. However, if you’re just looking at buying some quick and hodling then Swyftx Exchange is a popular choice in Australia.

Categories
Crypto News Initial Coin Offering Market Analysis Trading

SKALE Network Breakout Analysis – SKL Pumps +173% on Binance Launchpad

After the launch of Skale Network on Binance Launchpad today, SKL took a strong Breakout with +173% gains in a single day. Let’s take a quick look at SKL, price analysis, and possible reasons for the recent breakout.

What is Skale?

SKALE Network’s modular protocol is one of the first of its kind to allow developers to easily provision highly configurable blockchains, which provide the benefits of decentralization without compromising on computation, storage, or security.

Skale Quick Stats

SYMBOL:SKL
Global rank:269
Market cap:$62,644,180 AUD
Current price:$0.1138 AUD
All-time high price:$0.1969 AUD
1 day:+173.26%
7 day:+255.70%
1 year:+256.74%

Skale Price Analysis

At the time of writing, SKL is ranked 269th cryptocurrency globally and the current price is $0.1138 AUD. This is a +173.26% increase since the launch of its ICO at Binance Launchpad today (1 December 2020). Have a look at the chart below for price analysis.

Source: Binance-TradingView

After the launch of Skale on Binance Launchpad, It pumped up to $0.1912 AUD having +385% gains in just a few minutes and the initial opening price of SKL was $0.0413 AUD at Binance Exchange with many different trading pairs like SKL/BTC, SKL/USDT, and SKL/BUSD.

Currently, SKL is trading at $0.1138 AUD price levels after breaking out the squeeze resistance in its sideways trend & now heading towards its all-time high price.

What do the technical indicators say?

The Skale TradingView indicators (on the 1 day) mainly indicate SKL as a strong buy, except the Oscillators which indicate SKL as a neutral.

So Why did Skale Breakout?

After the opening at Binance Launchpad, mostly ICO’s pumps after going live on exchange for trade and, the recent rise in Bitcoin over 100% since the halving in May and then the suggested start of the Altcoin season could have contributed to the recent breakout. It could also be contributed to some recent news where Skale gets listed on more exchanges.

Recent Skale News & Events:

Where to Buy or Trade Skale?

Skale has the highest liquidity on Binance Exchange so that would help for trading SKL/USDT or SKL/BTC pairs. However, if you’re just looking at buying some quick and hodling then Swyftx Exchange is a popular choice in Australia.
Categories
Crypto News Market Analysis Trading

Kusama Breakout Analysis – KSM Pumps +35% in a Week with Strong Bullish Trend

KSM was squeezing inside the double top pattern on a 4-hour candle chart, it just went up over +35% in the last 7 days. Let’s take a quick look at KSM, price analysis, and possible reasons for the recent breakout.

What is Kusama KSM?

Self-described as “Polkadot’s wild cousin,” Kusama is an experimental blockchain platform that is designed to provide a massively interoperable and scalable framework for developers.

Kusama is built on substate — a blockchain building kit developed by Parity Technologies. Kusama has almost the same codebase as Polkadot — one of the most successful interoperable blockchains.

KSM Quick Stats

SYMBOL:KSM
Global rank:46
Market cap:$615,973,312 AUD
Current price:$72.36 AUD 
All time high price:77.09 AUD
1 day:+13.44%
7 day:+35.74%
1 year:+79.76%

KSM Price Analysis

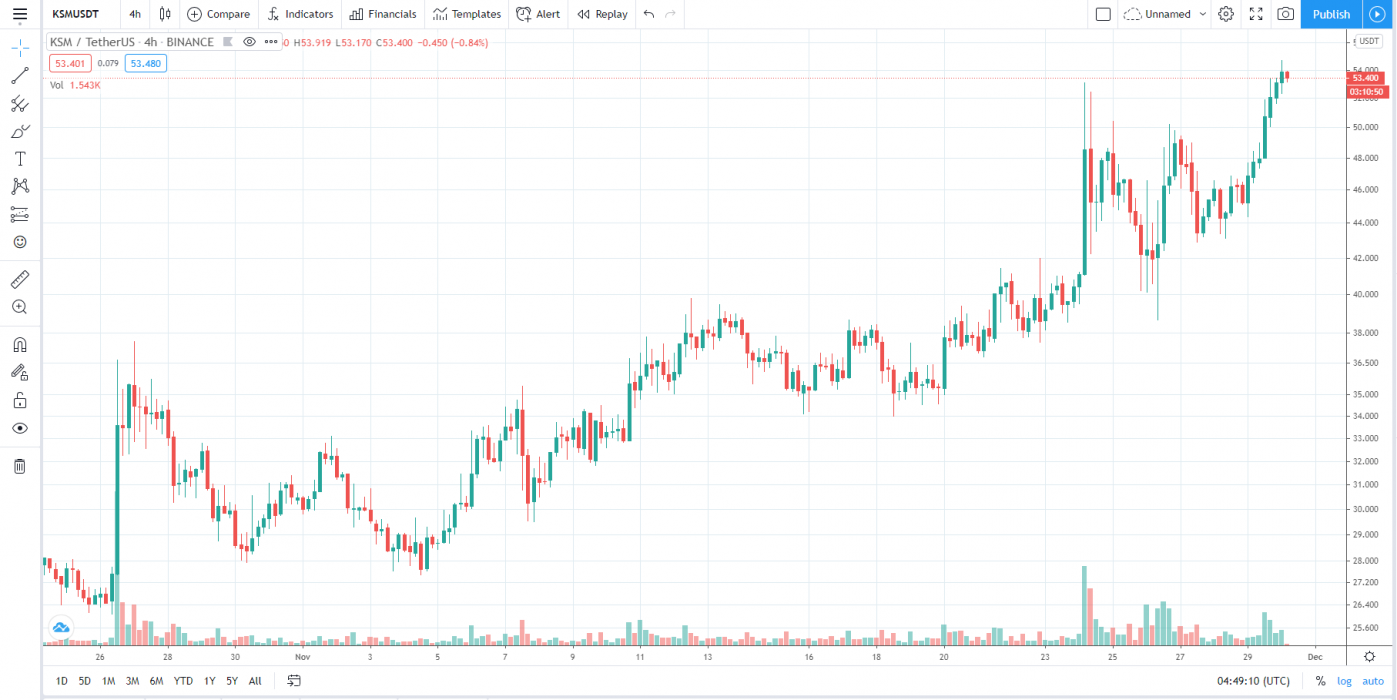
At the time of writing, KSM is ranked 46th cryptocurrency globally and the current price is $72.36 AUD. This is a +35.74% increase since 24 November 2020 (7 days ago) as shown in the chart below.

Source: TradingView

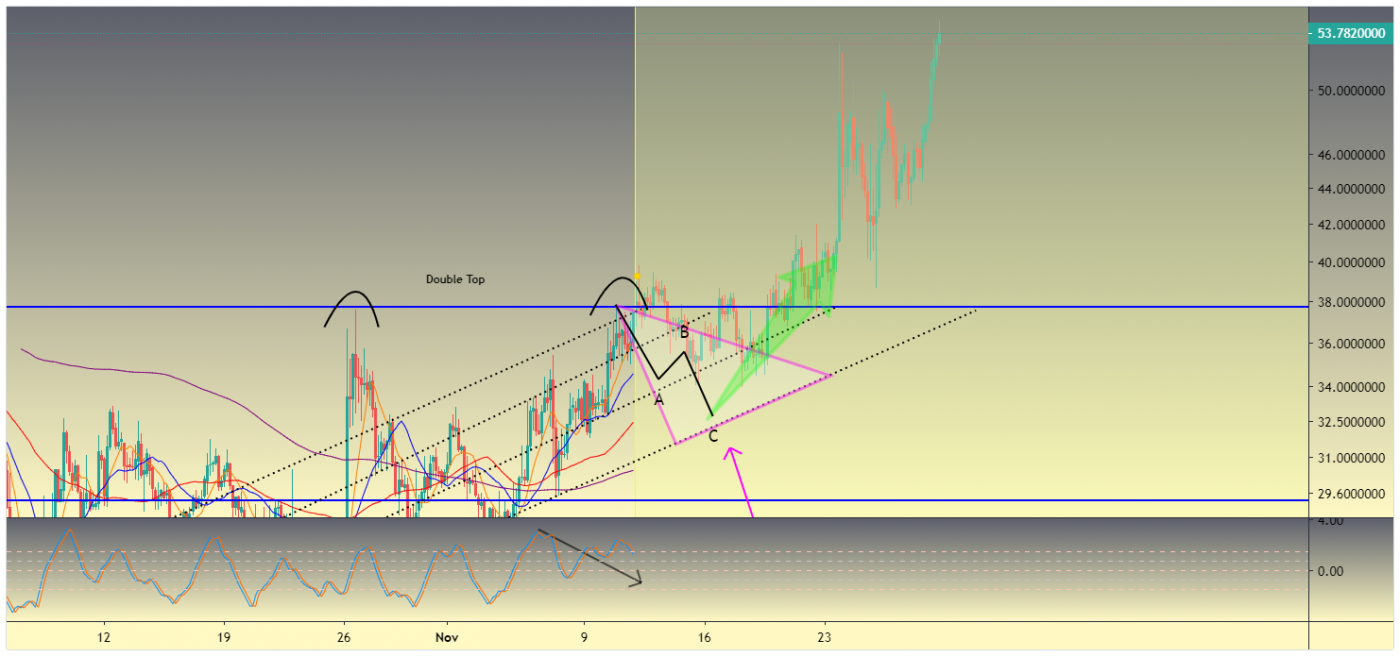
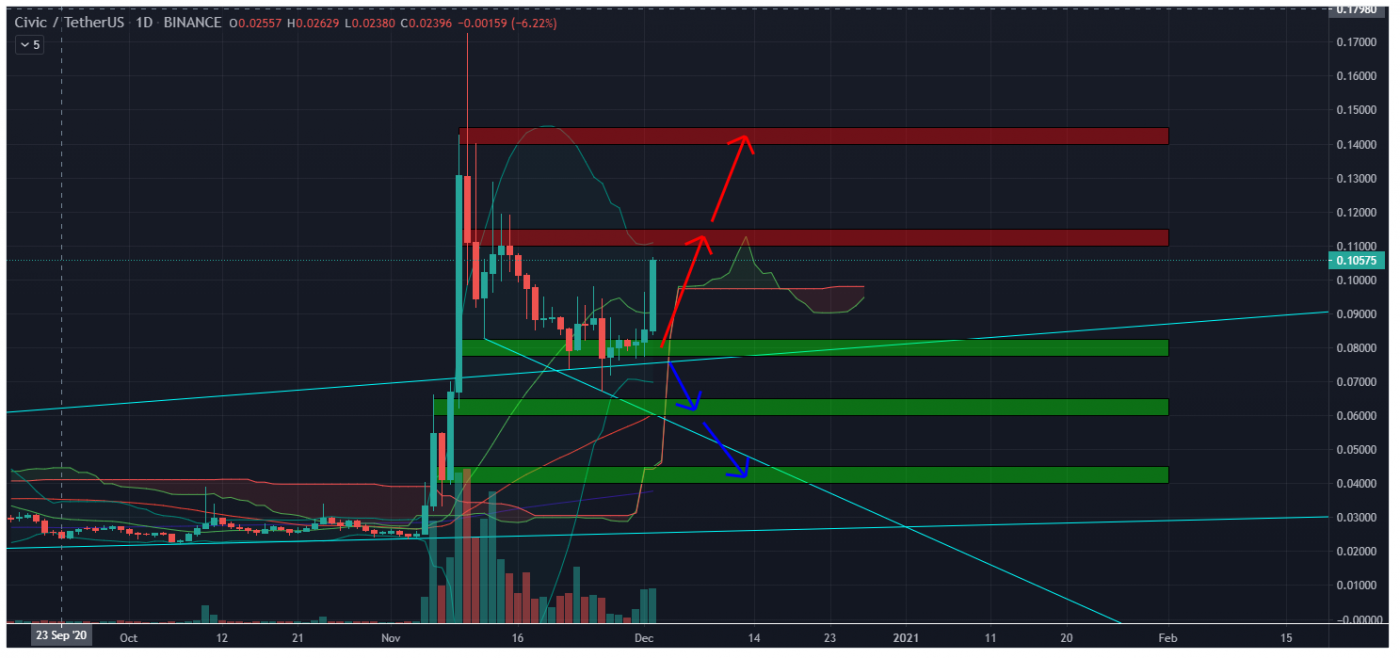
After looking at the above 4-hour candle chart, we can clearly see that KSM touched the Double Top before forming (A-B-C Triangle Pattern) on the KSM/USDT pair. The first resistance was on the $42.00 AUD price levels from which KSM broke with a strong bullish trend buying volume and is now heading towards its ATH all-time high price.

The above triangle pattern John called it the ABC pattern, which he defines in simple terms: “It’s a stop run of the first pullback after an aggressive move to the upside that signifies more potential in the direction of the larger movement.”

Source: TradingView

If we zoom out the live price chart and take a look at the price over the past few days or so, we can see the recent breakout more clearly, the trend is almost parabolic & bullish which looks insane.

What do the Technical indicators say?

The  Kusama KSM TradingView indicators (on the 1 day) mainly indicate KSM as a strong buy, except the Oscillators which indicate KSM as a buy.

So Why did KSM Breakout?

The recent rise in Bitcoin over 100% since the halving in May and then the suggested start of the Altcoin season could have contributed to the recent breakout. Another reason could be the whales, secretly stacking up KSM to their portfolio for the next Altcoins rally. It could also be contributed to some of the recent news where ChainX issued a KusamaNetwork

Recent KSM News & Events:

Where to Buy or Trade Kusama KSM?

Kusama has the highest liquidity on Binance Exchange so that would help for trading KSM/USDT or KSM/BTC pairs. However, if you’re just looking at buying some quick and hodling then Swyftx Exchange is a popular choice in Australia.
Categories
Crypto News Litecoin Market Analysis Trading

Litecoin LTC Breakout Analysis – LTC with +16% Gains in a Single Day

Litecoin LTC is flipping on a 4-hour candle chart, LTC just went up over +16% in a single day. Let’s take a quick look at LTC price analysis and possible reasons for the recent breakout.

What is Litecoin?

Litecoin is a peer-to-peer Internet currency that enables instant, near-zero cost payments to anyone in the world. Litecoin is an open-source, global payment network that is fully decentralized without any central authorities.

Litecoin Quick Stats

SYMBOL:LTC
Global rank:6
Market cap:$7,763,926,899 AUD
Current price:$115.84 AUD
All time high price:$509.34 AUD
1 day:+16.42%
7 day:+5.42%
1 year:+83.99%

Litecoin Price Analysis

At the time of writing, LTC is ranked 6th cryptocurrency globally and the current price is $115.84 AUD. This is a +5.42% increase since 24 November 2020 (7 days ago) as shown in the chart below.

Source: TradingView

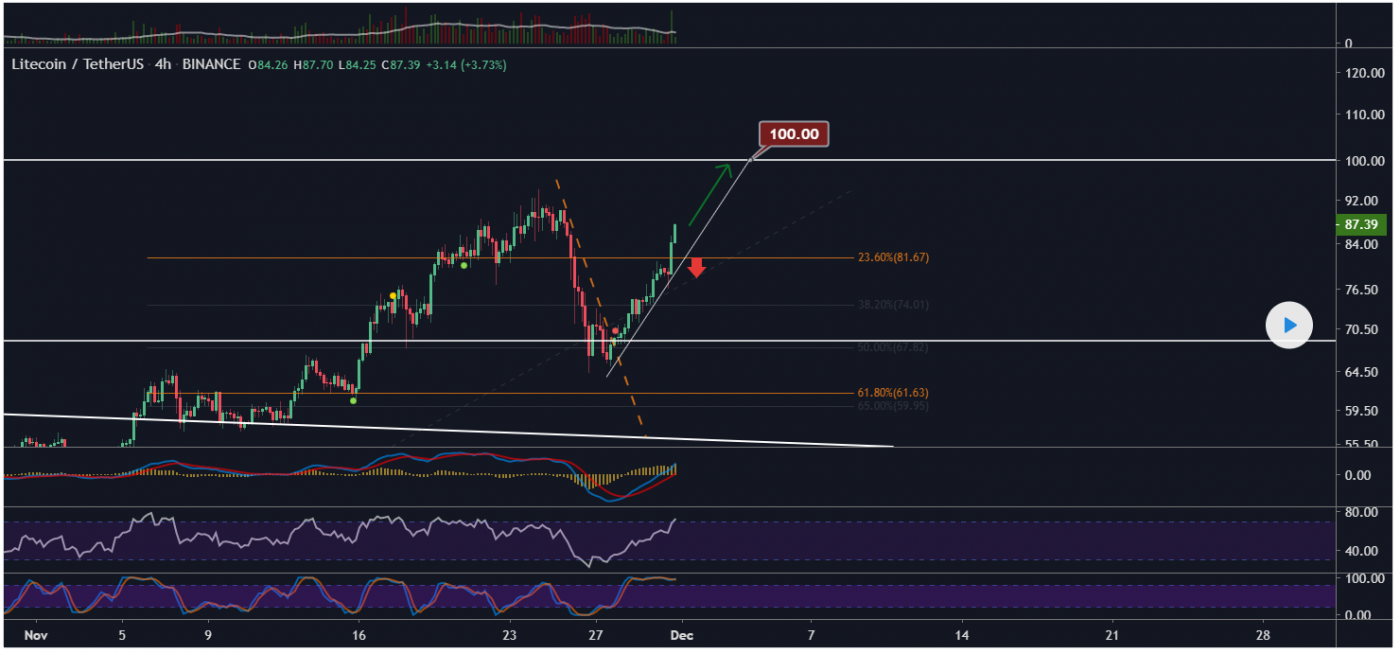
If we see the above 4-hour candle chart, LTC did a strong breakout from the falling wedge pattern & is now heading towards its major resistance of the month. After BTC did a new historical high today, LTC looks well-positioned to test the $100 AUD price levels.

“The Falling Wedge is a bullish pattern that begins wide at the top and contracts as prices move lower. This price action forms a cone that slopes down as the reaction highs and reaction lows converge.”

Source: TradingView

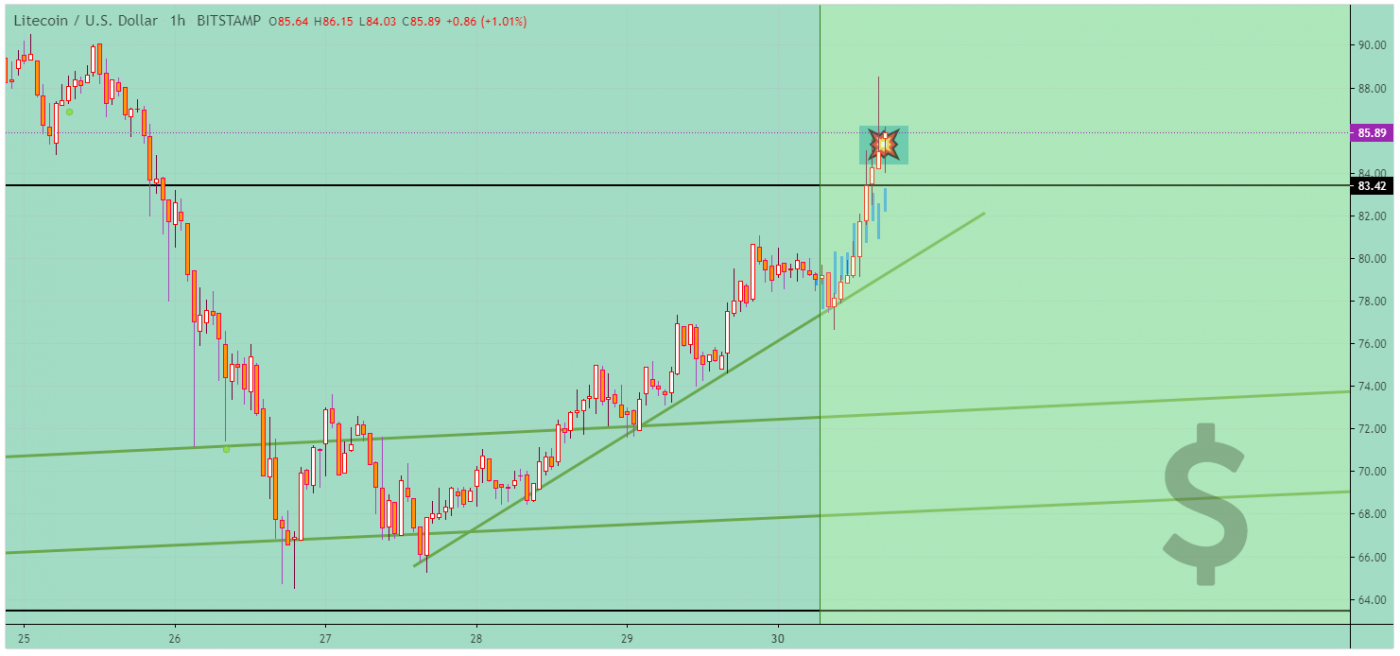
When the price reached the lower support line, LTC immediately began its upward movement. The price was again able to break through the upper lines and continue to grow. Now the Litcoin is moving along the support line that accompanies the initiative from the very beginning of the price growth.

What do the technical indicators say?

The Litecoin LTC TradingView indicators (on the 1 day) mainly indicate LTC as a buy, except the Oscillators which indicate sell as a neutral.

So Why did Litecoin Breakout?

The recent rise in Bitcoin over 100% since the halving in May and then the suggested start of the Altcoin season could have contributed to the recent breakout. Another reason could be the whales secretly buying LTC for the next Altcoins rally & it could also be contributed to some of the recent events.

Recent Litecoin News & Events:

Where to Buy or Trade Litecoin?

LTC has the highest liquidity on Binance Exchange so that would help for trading LTC/USDT or LTC/BTC pairs. However, if you’re just looking at buying some quick and hodling then Swyftx Exchange is a popular choice in Australia.

Categories
Crypto News Market Analysis Trading

Numeraire NMR Breakout Analysis – NMR Forming Rising Wedge Pattern with +32% Gains in a Week

The cryptocurrency Numeraire NMR just went up over +32% in the past week. Let’s take a quick look at NMR, price analysis, and possible reasons for the recent breakout.

What is Numeraire?

Numeraire: A Cryptographic Token for Coordinating Machine Intelligence and Preventing Overfitting. (NMR) is a cryptocurrency and operates on the Ethereum platform.

Numeraire Quick Stats

SYMBOL:NMR
Global rank:76
Market cap:$221,151,628 AUD
Current price:$49.67 AUD
All time high price:$228.14 AUD
1 day:+24.52%
7 day:+32.15%
1 year:+515.33%

Numeraire Price Analysis

At the time of writing, NMR is ranked 76th cryptocurrency globally and the current price is $49.67 AUD. This is a +32.15% increase since 24 November 2020 (7 days ago) as shown in the chart below.

Source: TradingView

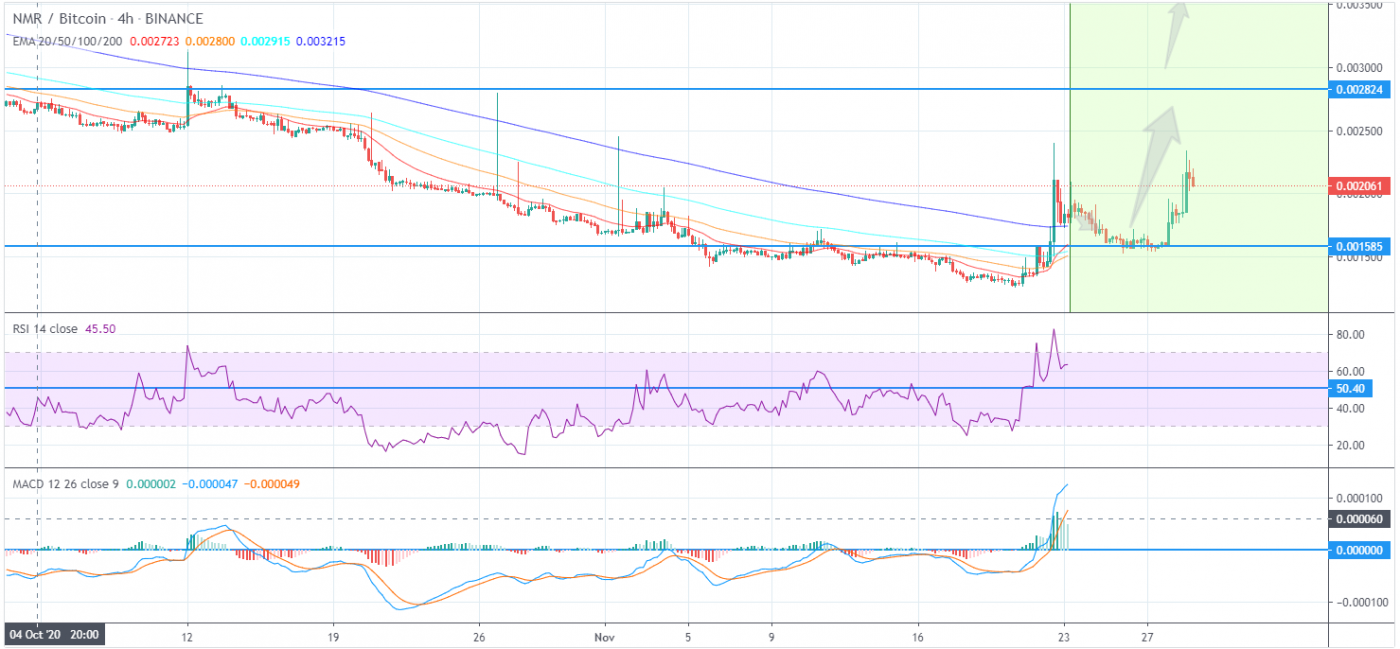
In the past week, there was a strong rise in Bitcoin, Ethereum, and Ripple. As a result, Numeraire (NMR) also formed strong support near $28.96 before starting a fresh increase against the AUD.

If we see the above 4-hour candle chart, NMR is forming a Rising Wedge pattern and is now currently trading at $49.67 AUD. The next resistance is on the $60.12 AUD price levels which can be broken any time soon if NMR keeps the trend with strong buying.

“A rising wedge is a technical indicator, suggesting a reversal pattern frequently seen in bear markets. This pattern shows up in charts when the price moves upward with pivot highs and lows converging toward a single point known as the apex.”

Source: TradingView

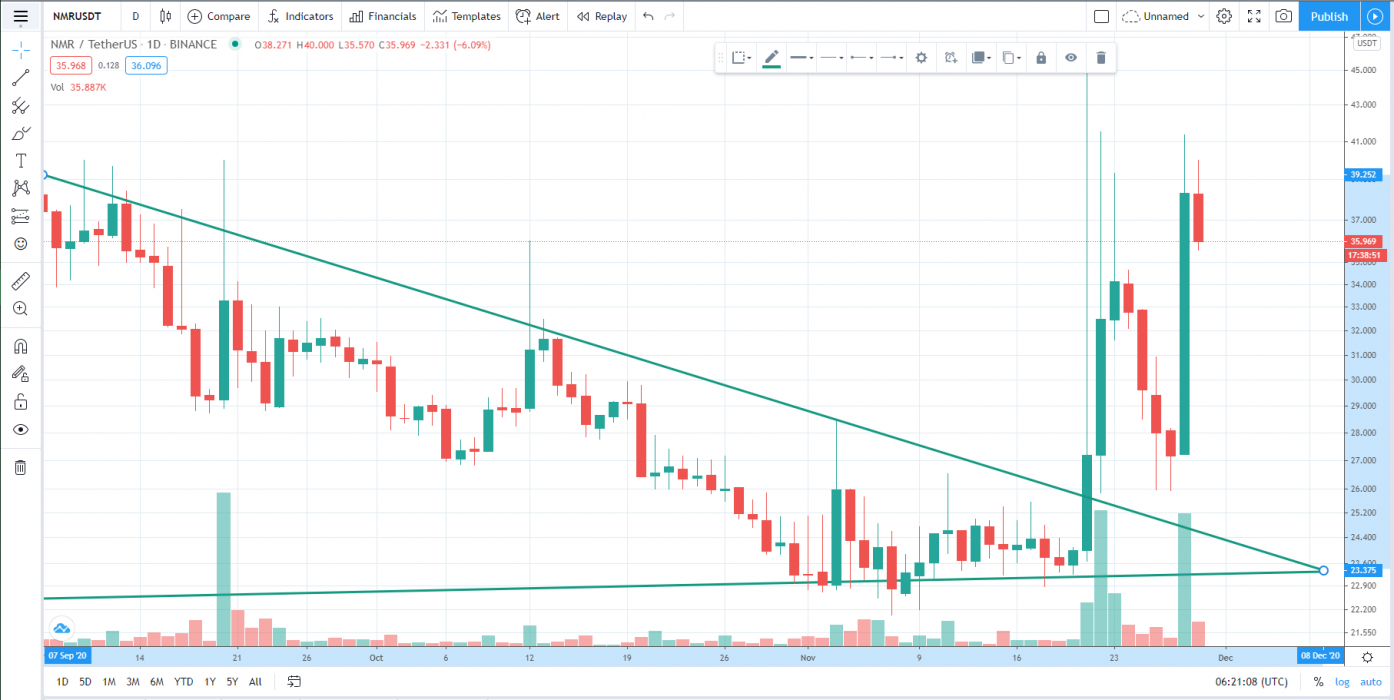
If we zoom out and take a look at the price over the past few days or so, we can see the recent breakout more clearly, the line is almost vertical which looks insane.

What do the Technical indicators say?

The  Numeraire NMR TradingView indicators (on the 1 day) mainly indicate NMR as a strong buy, except the Oscillators which indicate NMR as a buy.

So Why did NMR Breakout?

The recent rise in Bitcoin over 100% since the halving in May and then the suggested start of the Altcoin season could have contributed to the recent breakout. Another reason could be the whales, secretly stacking up NMR to their portfolio for the next Altcoins rally. It could also be contributed to some of the recent news relating Interview with the CEO of Numeraire @RicharCraib

Recent NMR News & Events:

Where to Buy or Trade Numeraire NMR?

NMR has the highest liquidity on Binance Exchange so that would help for trading NMR/USDT or NMR/BTC pairs. However, if you’re just looking at buying some quick and hodling then Swyftx Exchange is a popular choice in Australia.
Categories
Crypto News Market Analysis Trading

NEXO Breakout Analysis – Nexo Performing Active Uptrend with +30% Gains in a Week

Nexo is trading in active uptrend here like many other altcoins are. The Cryptocurrency Nexo just went up +24.5% in a single day and surges over +30.6% in a week.

What is Nexo?

Nexo wants to Build The World’s First Instant Crypto Overdrafts. Powered by Credissimo – A Leading FinTech Group serving millions of people across Europe for over 10 years.

Nexo Quick Stats

SYMBOL:NEXO
Global rank:75
Market cap:$242,936,162 AUD
Current price:$0.4325 AUD
All time high price:$0.7304 AUD
1 day:+24.5%
7 day:+30.6%
1 year:+325.74%

Nexo Price Analysis

At the time of writing, Nexo is ranked 75th cryptocurrency globally and the current price is $0.4325 AUD. This is a +30% increase since 23 November 2020 (7 days ago) as shown in the chart below.

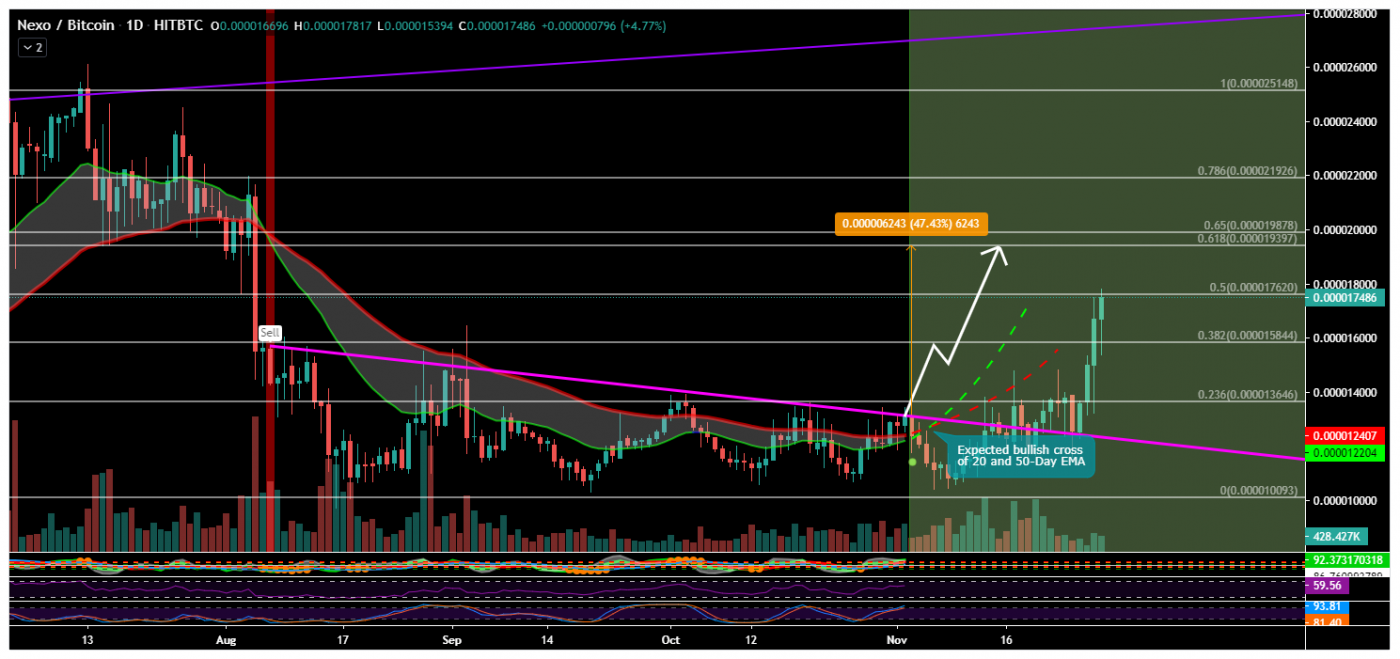
Source: TradingView

Price already increased a little bit after the Nexonomics announcement last week and then Nexo did an awesome breakout from this bearish rectangle by breaking all previous resistances & is now currently trading at $0.4325 AUD price levels.

“The bearish rectangle is a continuation pattern that occurs when a price pauses during a strong downtrend and temporarily bounces between two parallel levels before the trend continues.”

What do the technical indicators say?

The NEXO TradingView indicators (on the 1 day) mainly indicate Nexo as a buy, except the Oscillators which indicate Nexo as a sell.

So Why did NEXO Breakout?

The recent rise in Bitcoin over 100% since the halving in May and then the suggested start of the Altcoin season could have contributed to the recent breakout. Another reason could be the whales, secretly stacking up NEXO to their portfolio for the upcoming Altcoins rally. It could also be contributed to some of the recent news where they also announced an improved version of the Earn feature.

Recent Nexo News & Events:

Where to Buy or Trade Nexo?

Nexo has the highest liquidity on Binance Exchange so that would help for trading Nexo/USDT or Nexo/BTC pairs. However, if you’re just looking at buying some quick and hodling then Swyftx Exchange is a popular choice in Australia.
Categories
Crypto News Initial Coin Offering Market Analysis Trading

UNIFI Protocol DAO Breakout Analysis – UNFI Pumps +45% on Binance Launchpool

After the launch of UNFI Protocol DAO on Binance Launchpool last week, UNFI was trading sideways & took a strong Breakout with +45% gains in a single day. Let’s take a quick look at UNFI, price analysis, and possible reasons for the recent breakout.

What is Unifi?

Unifi Protocol DAO is a group of non-custodial, interoperable, decentralized, multi-chain smart contracts providing the building blocks for DeFi development. The project provides a bridge to connect the economy of Ethereum-based DeFi products to the growing DeFi markets on other blockchains. uTrade, a decentralized Automated Market Maker (AMM) and token exchange, is the first product built on the Unifi Protocol DAO smart contracts.

Unifi Quick Stats

SYMBOL:UNFI
Global rank:460
Market cap:$16,695,896 AUD
Current price:$6.95 AUD
All time high price:$8.12 AUD
1 day:+45.4%
7 day:+150.70%
1 year:+150.74%

Unifi Price Analysis

At the time of writing, UNFI is ranked 460th cryptocurrency globally and the current price is $6.95 AUD. This is a +150.70% increase since the launch of its ICO at Binance Launchpool on 19 November 2020 as shown in the chart below.

Source: TradingView

After the launch of Unifi on Binance Launchpool, It pumped up to $8.12 AUD having +300% gains in few hours and the initial opening price of UNFI was $2.1 AUD at Binance Exchange with many different trading pairs like UNFI/BTC, UNFI/USDT, and UNFI/BUSD.

Currently, UNFI is trading at $6.95 AUD price levels after breaking out the squeeze resistance in its sideways trend & now heading towards its all-time high price.

What do the technical indicators say?

The Unifi TradingView indicators (on the 1 day) mainly indicate UNFI as a strong buy, except the Oscillators which indicate UNFI as a neutral.

So Why did UNFI Breakout?

The recent rise in Bitcoin over 100% since the halving in May and then the suggested start of the Altcoin season could have contributed to the recent breakout. It could also be contributed to some recent news where UNFI is about to launch on Ethereum Network with uTrade.

Recent UNFI News & Events:

Where to Buy or Trade UNFI?

UNFI has the highest liquidity on Binance Exchange so that would help for trading UNFI/USDT or UNFI/BTC pairs. However, if you’re just looking at buying some quick and hodling then Swyftx Exchange is a popular choice in Australia.
Categories
Crypto News Market Analysis Nano Trading

NANO Trading Analysis – Nano up 51%, Holding Strong Position to Breakout from Resistance

NANO has already gone up over +51.55% this month, and the trading analysis suggests that there might be another wave incoming. Let’s take a look at NANO and what the charts are telling us.

What is Nano?

Nano is a digital currency for the real world – the fast and free way to pay for everything in life, with instant transactions, zero fees, and a scalable network.

Nano Quick Stats

Symbol:Nano
Global rank:78
Market cap:$203,749,249 AUD
Current price:$1.52 AUD
All time high price:$50.97 AUD
1 day:+8.69%
7 day:+51.55%
1 year:+37.63%

Nano Price Analysis

At the time of writing, Nano is ranked 78th cryptocurrency globally and the current price is $1.52 AUD. This is a +51.55% increase since 21 November 2020 (7 days ago) as shown in the chart below.

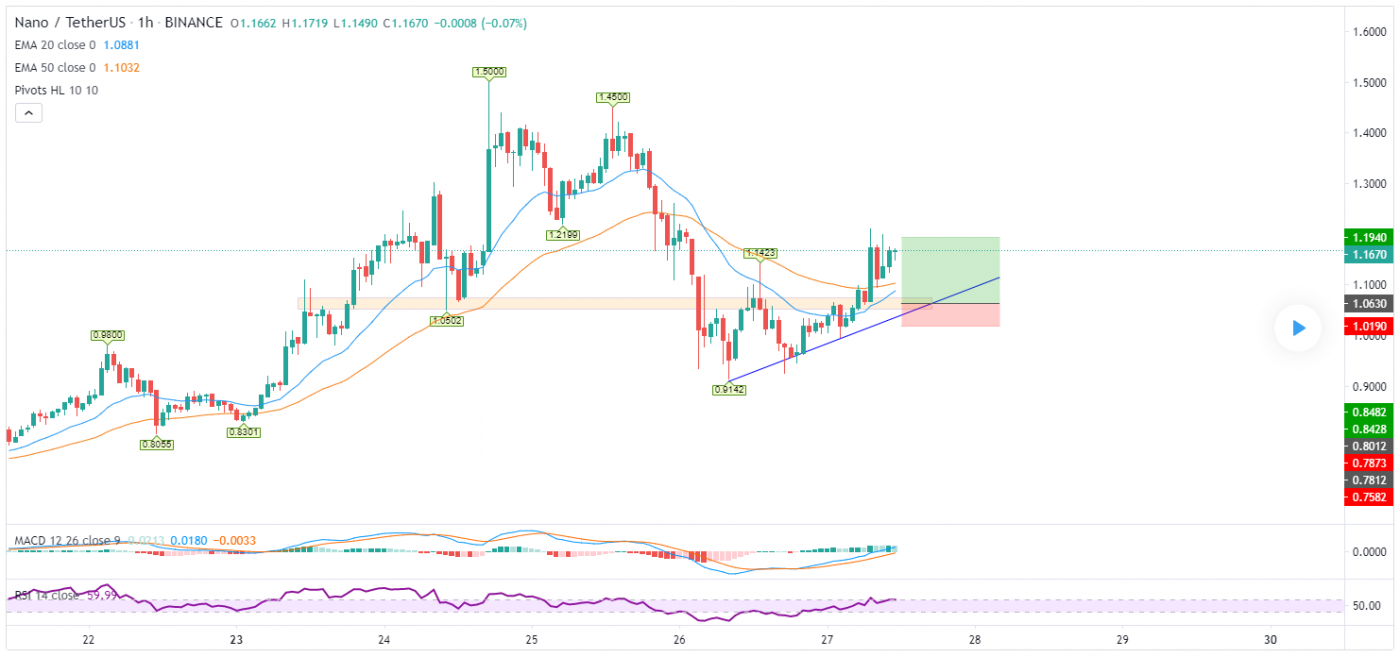
Source: TradingView

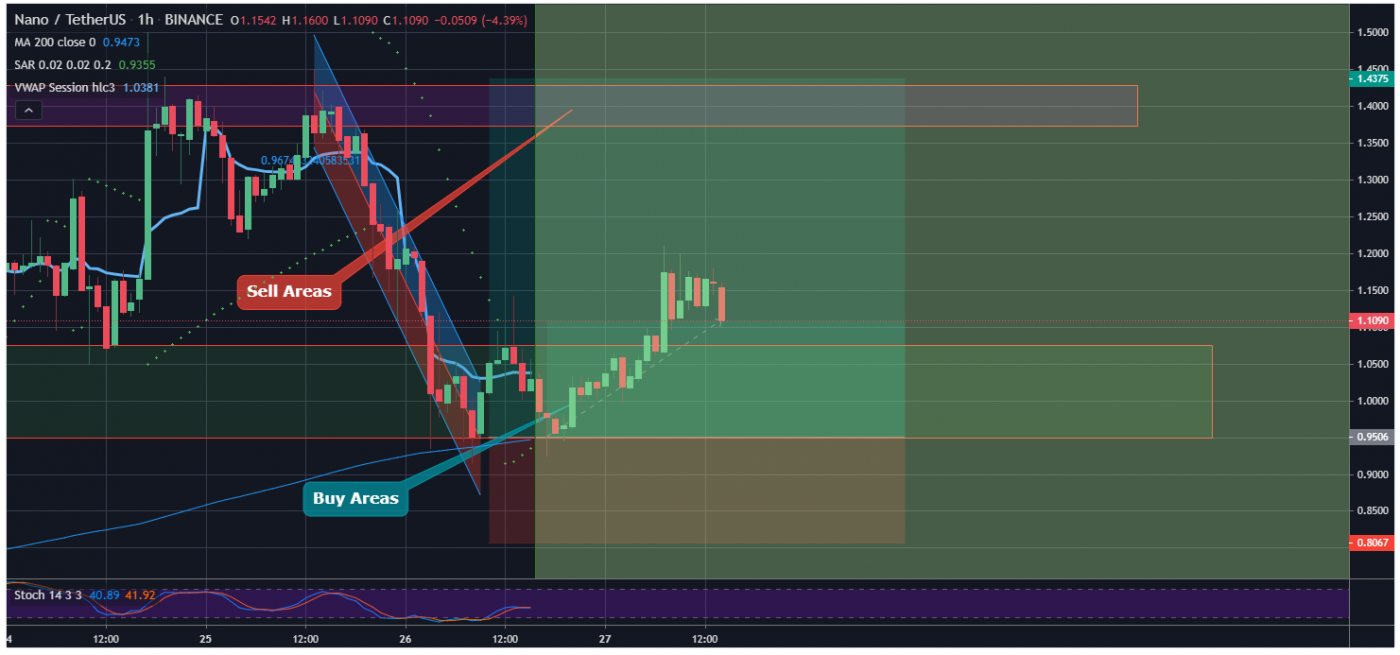
If we see the 1-hour candle chart, Nano just bounced back from its support levels of $1.0120 AUD and holding its position strong for the breakout from the next resistance which is at $1.6150 AUD. The blue line is acting as a support level for this Ascending triangle trend.

“An ascending triangle is a chart pattern used in technical analysis. It is created by price moves that allow for a horizontal line to be drawn along the swing highs, and a rising trendline to be drawn along the swing lows. The two lines form a triangle. Traders often watch for breakouts from triangle patterns.”

Source: TradingView

What do the technical indicators say?

The NANO TradingView indicators (on the 1 day) mainly indicate Nano as a buy.

Recent Nano News & Events:

Where to Buy or Trade Nano?

Nano has the highest liquidity on Binance Exchange so that would help for trading NANO/USDT or NANO/BTC pairs. However, if you’re just looking at buying some quick and hodling then Swyftx Exchange is a popular choice in Australia.