Categories
Market Analysis The Crypto Den

TradeRoom: Our Weekly Crypto Trades Analysis – Feb 21, 2022

Welcome to this weekly series from the TradeRoom. My name is Dave and I’m the founder of The Crypto Den, an Australian-based crypto trading and education community aiming to give you the knowledge to take your trading game to the next level.

Crypto Market Outlook

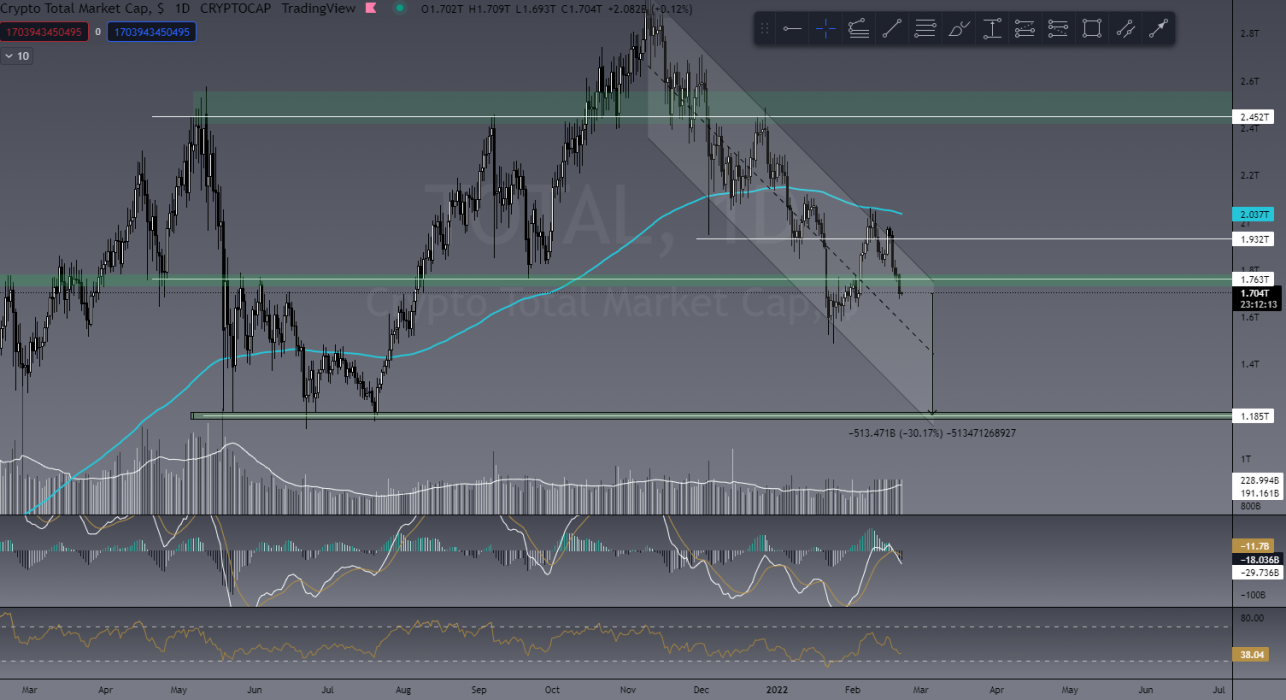
Well, the market lost another US$250 billion this last week and is still not really showing any signs of strength. The TOTAL crypto cap is still trending down in this channel and if we don’t see a recovery soon, I anticipate we could lose another US$500+ billion. I know it’s not what people want to hear/read, but we have tried to give as much warning and caution as possible since November 2021 that the markets could get much worse, and they have with the TOTAL down US$1.3 trillion (43%).
TOTAL market cap

BTC has broken the local uptrend I showed in last week’s article after hitting the retrace golden pocket on the fibs. To me this is the first confirmation that the recent uptick was nothing but a relief rally, as we have been saying for a couple of weeks now. The second confirmation I’m looking for is a new lower low (LL) on the daily timeframe. An anticipated 13%-23% drop is likely at this stage, taking us back to US$29,000.
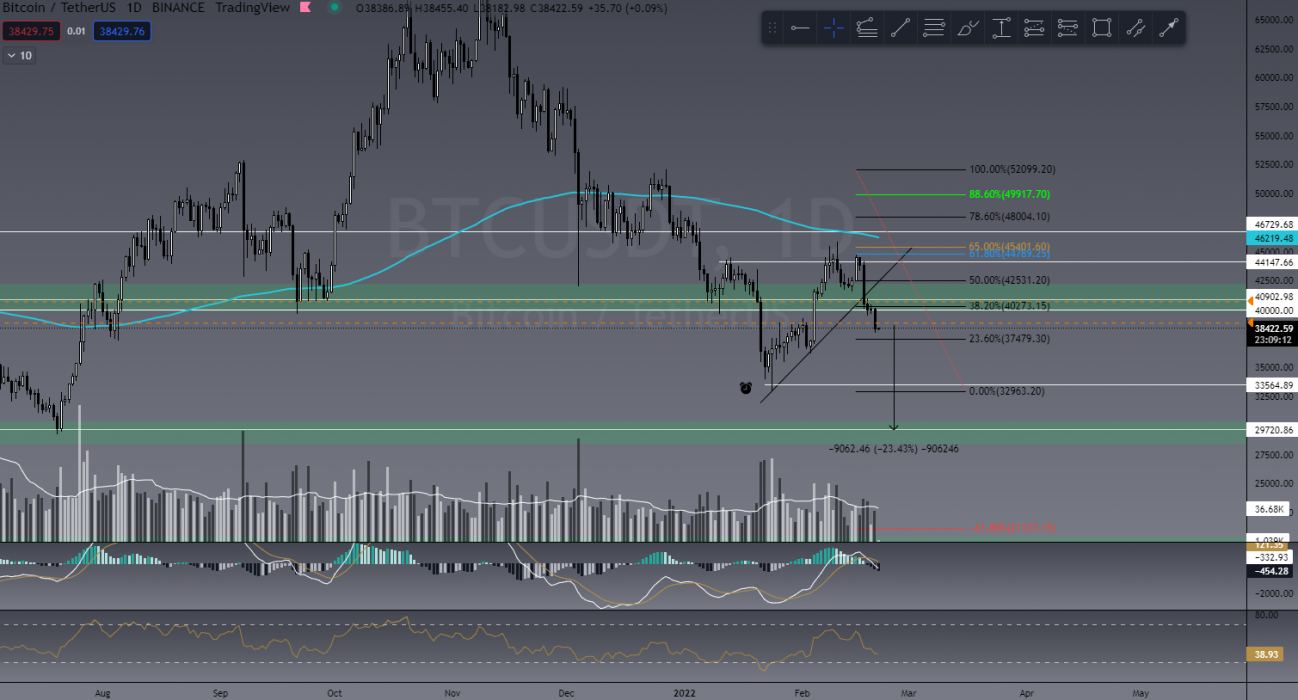
BTC/USDT

Last Week’s Performance

In last Thursday night’s live market scan in Our TradeRoom we had an absolute banger! We found six amazing entries into short trades as a community effort to help each other WIN! I’ll show three here today:

KNC/USDT

We looked at KNC/USDT peaking out at a daily level of resistance which is generally a very strong level to break. With its solid risk-to-reward ratio, we jumped into this one there and then. For me at the time of writing, it’s currently on 160% profit on a 10x trade.

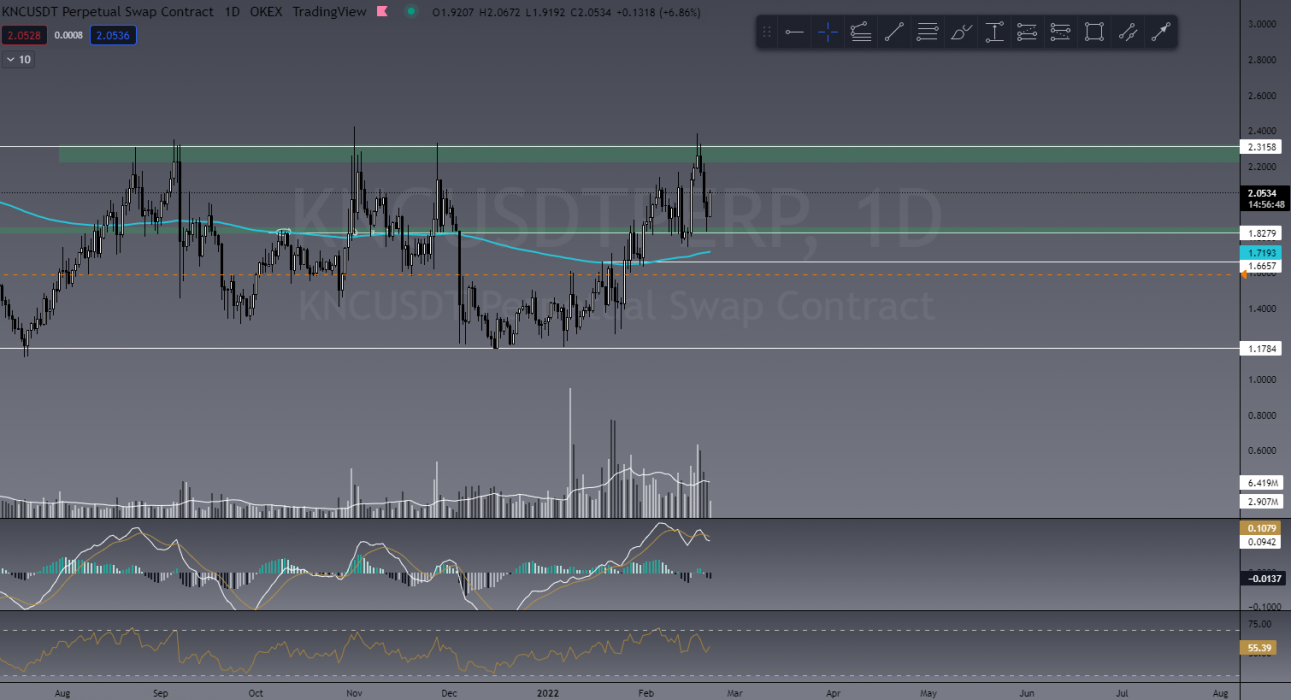
Dids’ chart in Thursday market scan
My chart showing the current price action

DASH/USDT

DASH showed us a textbook little double top at daily resistance. We entered this short and within minutes were already in profit. Doesn’t really get simpler than this. Currently sitting at 150% on 10x.

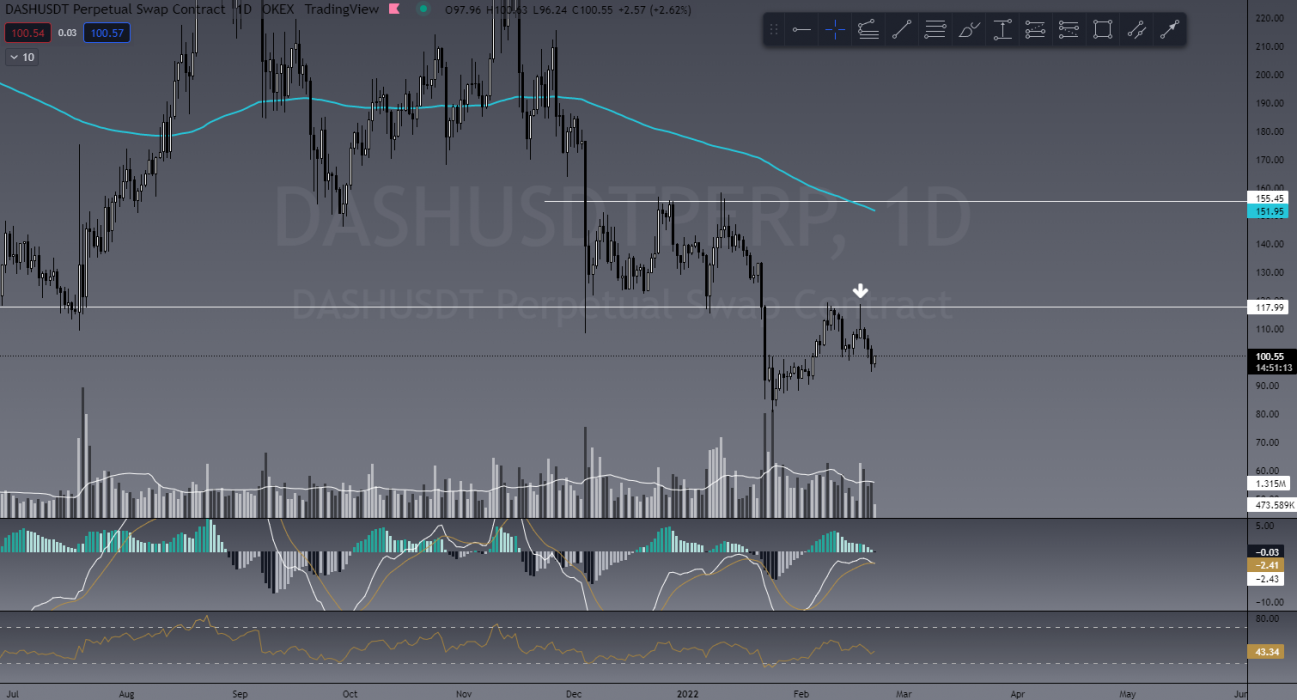
Dids’ chart from Thursday market scan
My chart showing current price action

GALA/USDT

Again we see a beauty of a support/resistance flip here with a lower high (LH) capping out at the golden pocket fib level. Credit to “Typeguy” for finding this one! He’s pretty much a trade-finding machine! Currently 220% on 10x.

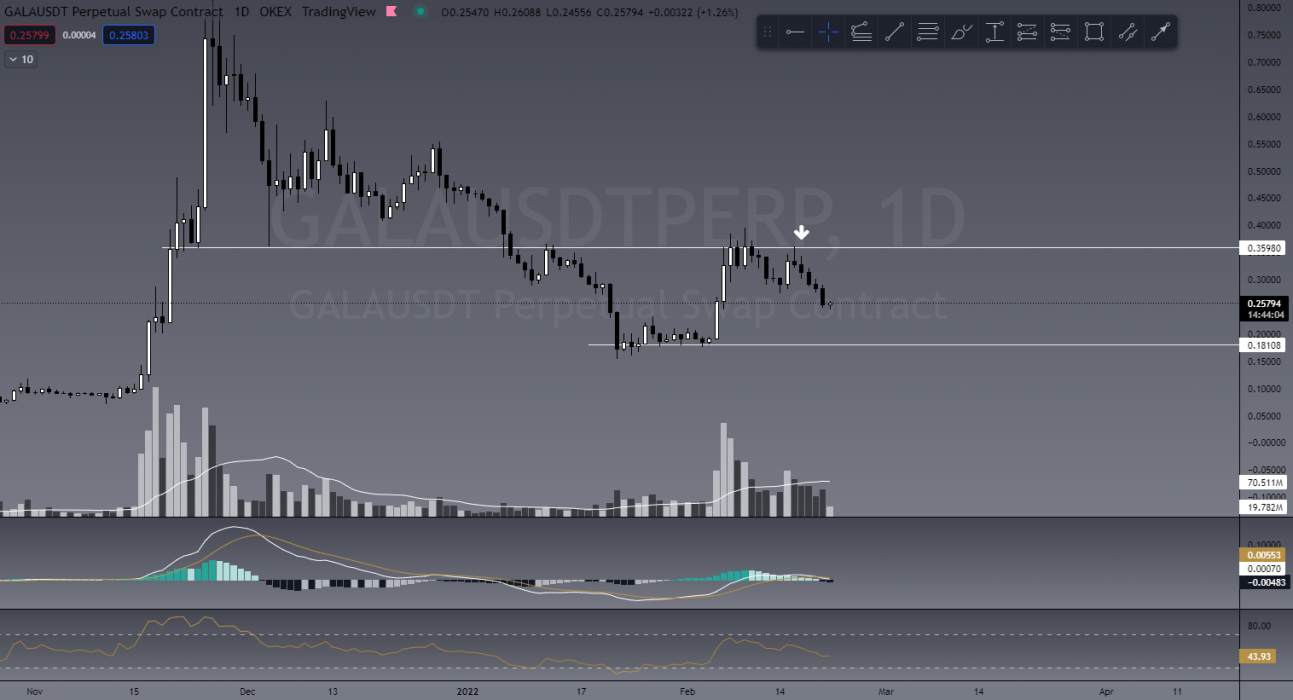
Dids’ chart from Thursday market scan
My chart showing current price action

This Week’s Trades

ADA/USDT

I’m finally in! For those of you who have been following along, I have been waiting for this trade since November 2021 and first shared this here in an early December article. At the risk of repeating myself enough to annoy readers, this still looks primed for me! A potential 80% drop can be seen here on ADA, and if BTC continues to drop there’s absolutely no reason for people to think this can’t happen. I know A LOT of holders of this coin get quite upset when you post a bearish chart, but it’s important not to get emotionally attached to a coin when investing your hard-earned money.
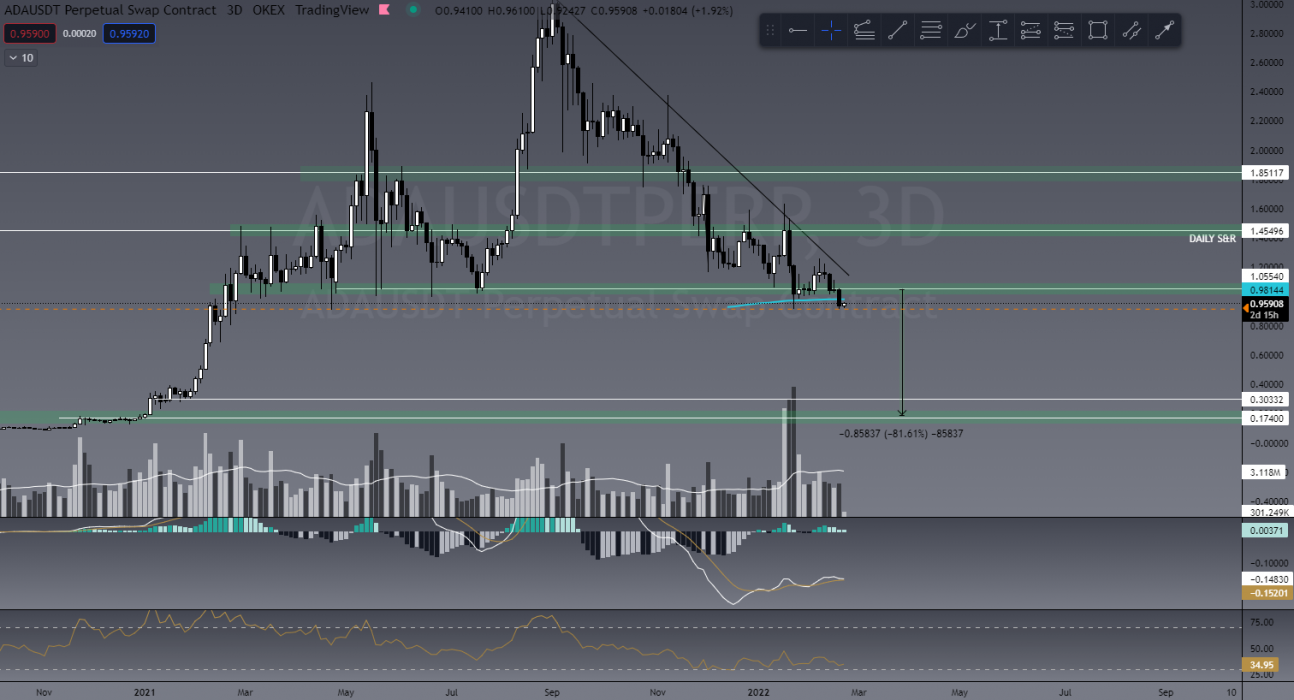
ADA/USDT

TORN/USDT

Another one found in Thursday’s market scan is TORN. With a potential 50% drop, it’s one we’re keeping an eye on and some have entered already.
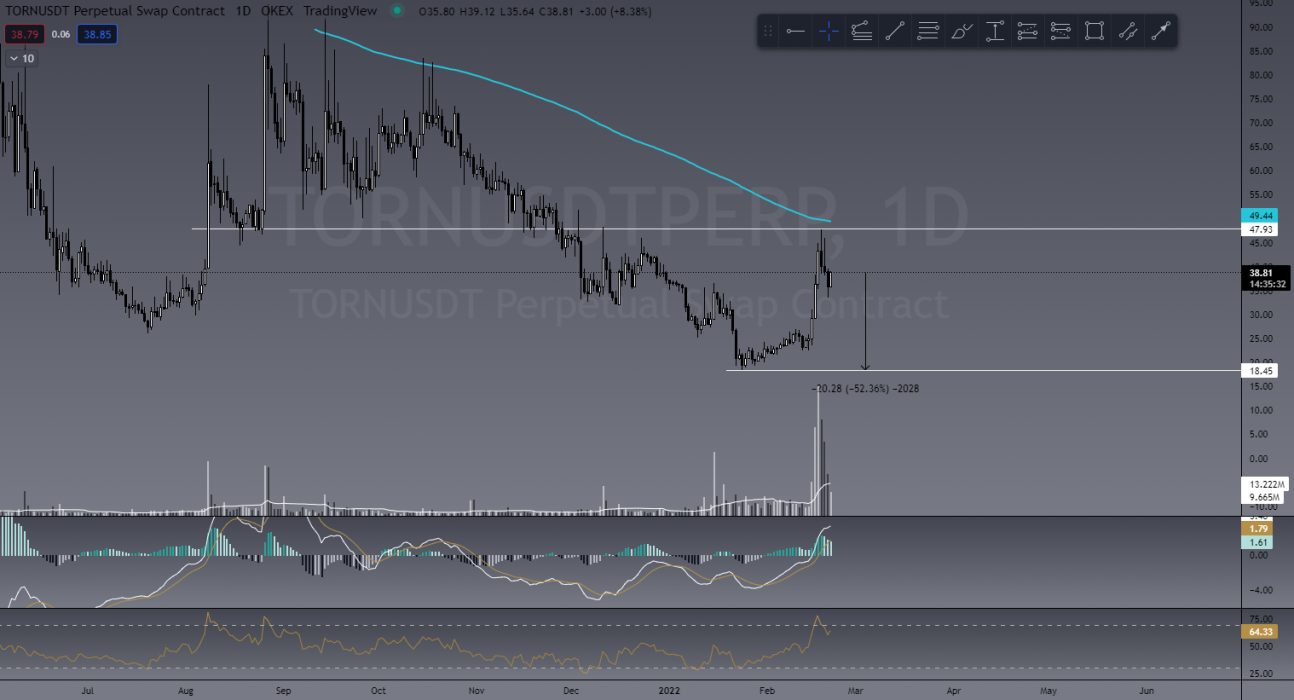
TORN/USDT

NOTE:

I just wanted to mention that in a lot of social media posts I see on Facebook, Twitter and even YouTube, there are A LOT of people sharing bullish charts and have been for months. It’s for this reason we continue to caution people when we’re seeing a bearish outlook despite the amount of negativity we receive. It’s incredibly important to not blindly follow ANYONE (myself included). I’ve seen too many people lose money as a result, so I encourage you to at the very least learn the basics before entering the markets. No matter where you decide to learn, please do it!


Learn to Trade

We are giving away 3 months FREE TradeRoom (valued at $300) to those who join our Trading Fundamentals course starting February 28!

The Crypto Den is holding its first of only two trading courses for 2022 on February 28! That’s right, we will only be running two programs in 2022! What makes us different? Our lessons are LIVE and come with a community where you submit your homework and receive feedback to ensure you understand what we teach!

Duration: 6 week course
Date/Time: Live trading course twice a week – Mon & Wed at 7pm AEST
Frequency: We now run our LIVE course only twice per year
Location: Zoom Webinar
From: February 28 to April 13

The Crypto Den’s Trading Fundamentals trading course is a LIVE interactive course designed to teach you how to trade the crypto markets from absolute beginner level!

Our six-week program teaches you how to set up your trade accounts using reputable exchanges and brokers, how to read the charts using technical analysis, and to protect your capital using effective risk management strategies.

We have taught thousands of students in the past five years how to trade these volatile and highly profitable markets. See our REAL reviews from REAL students.

Using ZOOM twice a week, all of our lessons are LIVE and recorded so you can access them over and over again in our structured course through our website and smartphone app. Lessons come with homework and online quizzes, as well as an amazing online and private community of students.

So what are you waiting for? Join now to start learning!


Already Know How to Trade?

Invite to Join our TradeRoom

If you’d like to become a better trader, you’re invited to join our TradeRoom where we share daily charts and market analysis. In our community we strongly encourage and teach correct risk management strategies to keep our members safe in this new volatile crypto market.
Join our “Apprentice” plan now for your 7-day trial.
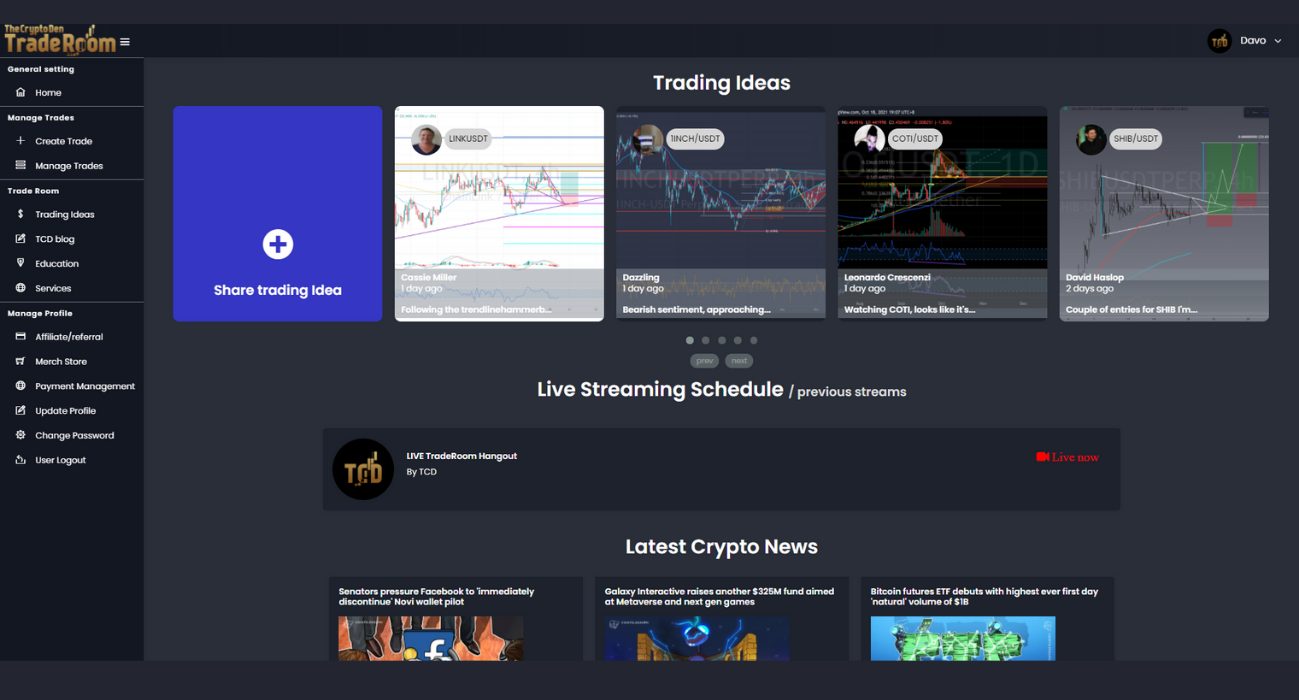

The Crypto Den was created in 2017 to help the rapidly growing crypto community learn and understand the fundamentals of digital currencies and how to trade them. 

Since then we have taught thousands of members the basics of technical analysis and trading strategies to further progress and perfect their trading abilities.

In the TradeRoom you will be included in a supportive environment which encourages personal growth, education and community support.

It’s a place to share your trading ideas and follow other experienced traders’ feeds to help keep your finger on the pulse of such a volatile market!

Categories
Market Analysis The Crypto Den

TradeRoom: Our Weekly Crypto Trades Analysis – Nov 29, 2021

Welcome to this weekly series from the TradeRoom. My name is Dave and I’m the founder of The Crypto Den, an Australian-based crypto trading and education community aiming to give you the knowledge to take your trading game to the next level.

Crypto Market Outlook

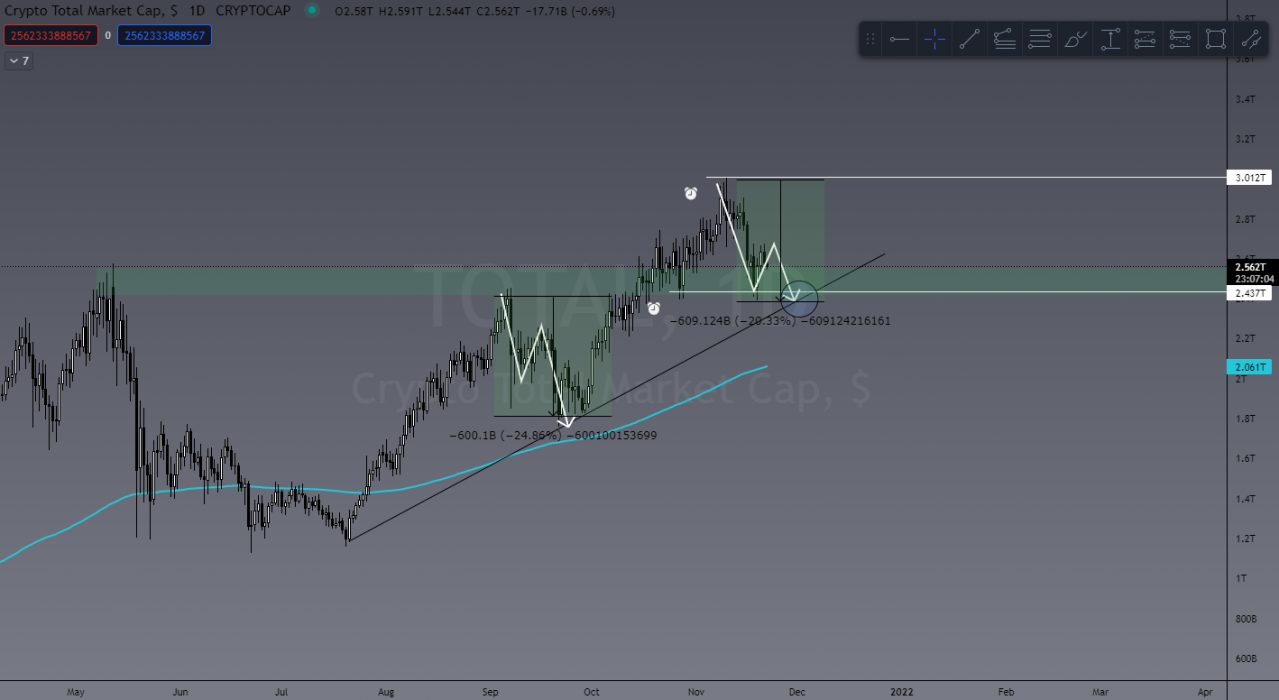
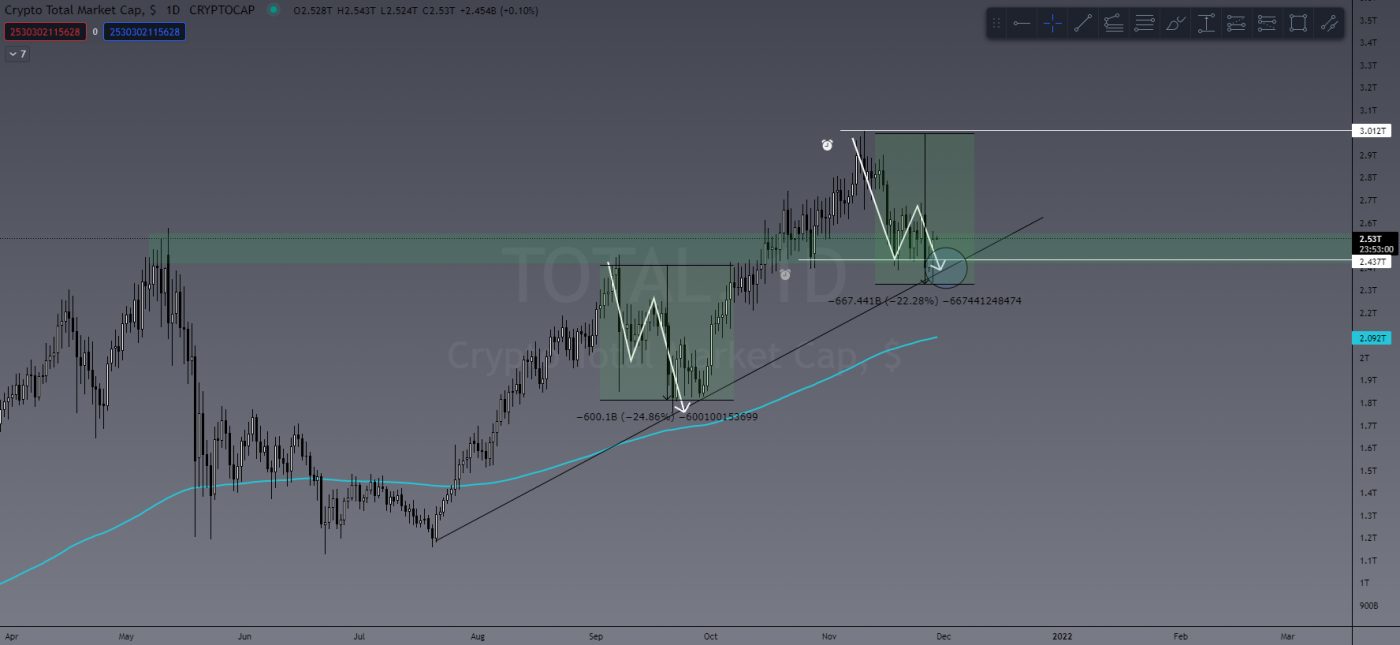
Last week I touched on the US$600 billion drop in TOTAL crypto market cap. I warned that we could see some more selling pressure but there was no reason to stress or start panic selling. You can see below that the TOTAL crypto cap has indeed pulled back further to retest its current uptrend. So far it’s showing a bullish test with a long wick to the downside and a strong bullish engulfing candle on the daily timeframe.

Image from last week’s update
TOTAL crypto market cap current value

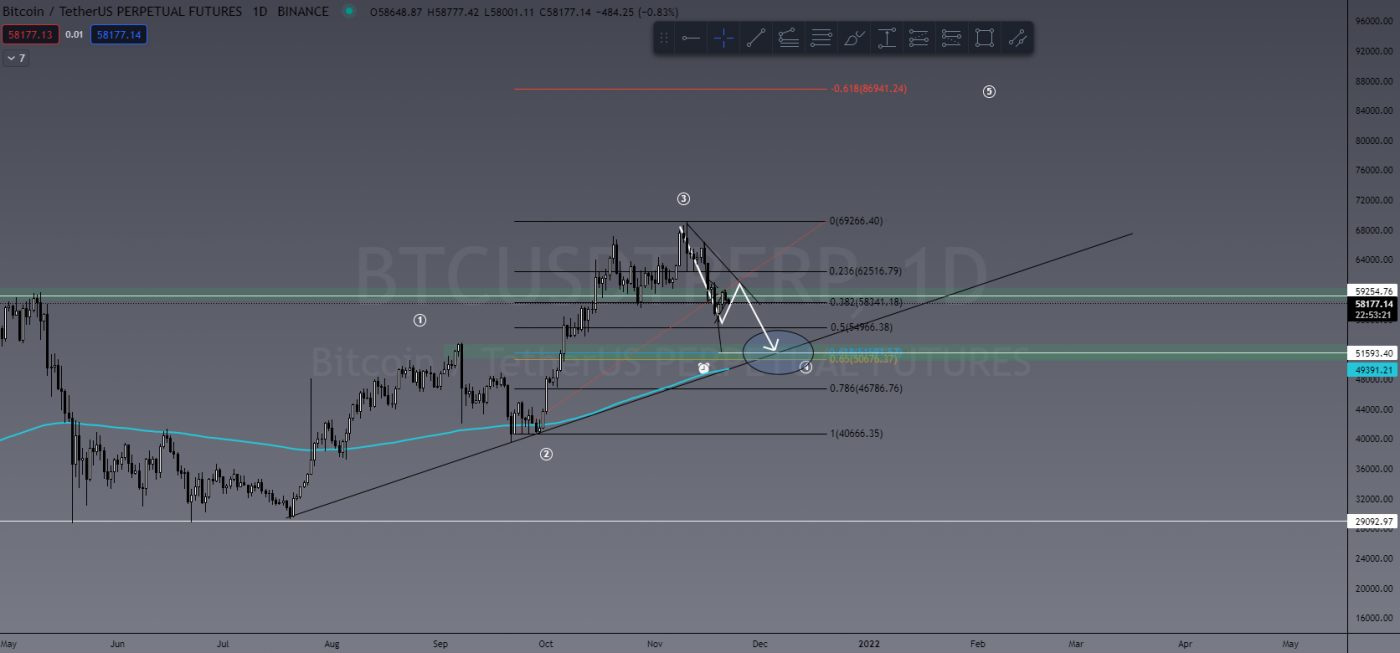
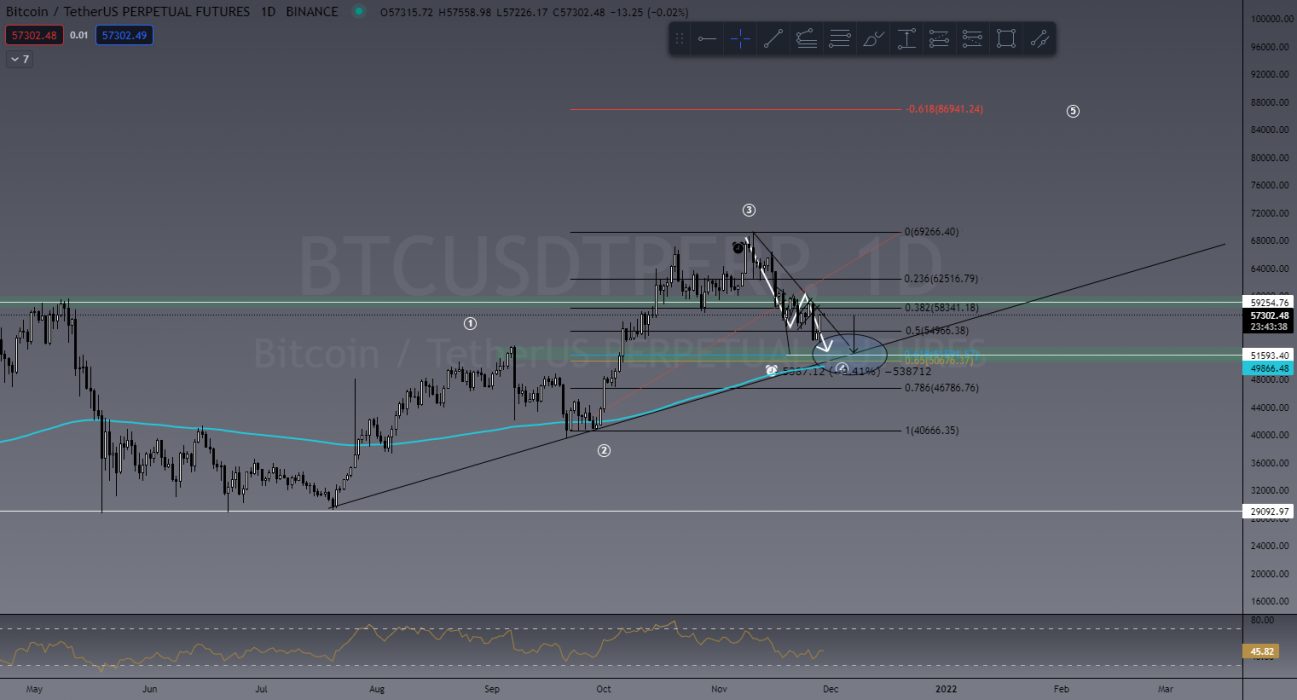
With the projection of the TOTAL heading down in value, I suggested BTC would follow this formation and see further bearish price action. My target being US$51,000, we haven’t hit that price YET. So far BTC is showing some signs of strength and the bottom of this local downtrend MIGHT be in, so it would serve you well to expect a bounce here and plan your trades accordingly.

That said, we’re not out of the woods yet. While BTC is trending below that local downtrend line and forming lower lows/lower highs (bearish market structure), we could see it hit that suggested area of support at US$51,500.

Projection from last week’s article
Current BTC price action

What’s interesting about the US$51,500 level is the perfect storm forming. There are so many key identifiers converging in that one area. We have:

  • the 61.8% Fibonacci retrace level;
  • daily 200 Exponential Moving Average(EMA);
  • daily level of support;
  • daily uptrend;
  • daily Higher Low (excellent market structure);
  • all of which plays well into the Elliott Wave Theory of market cycles.

It’s almost the perfect trade setup and something we discussed in last Thursday’s market scan in the TradeRoom. You can catch a sneak peek on our YouTube channel.


Last Week’s Performance

SAND/USDT

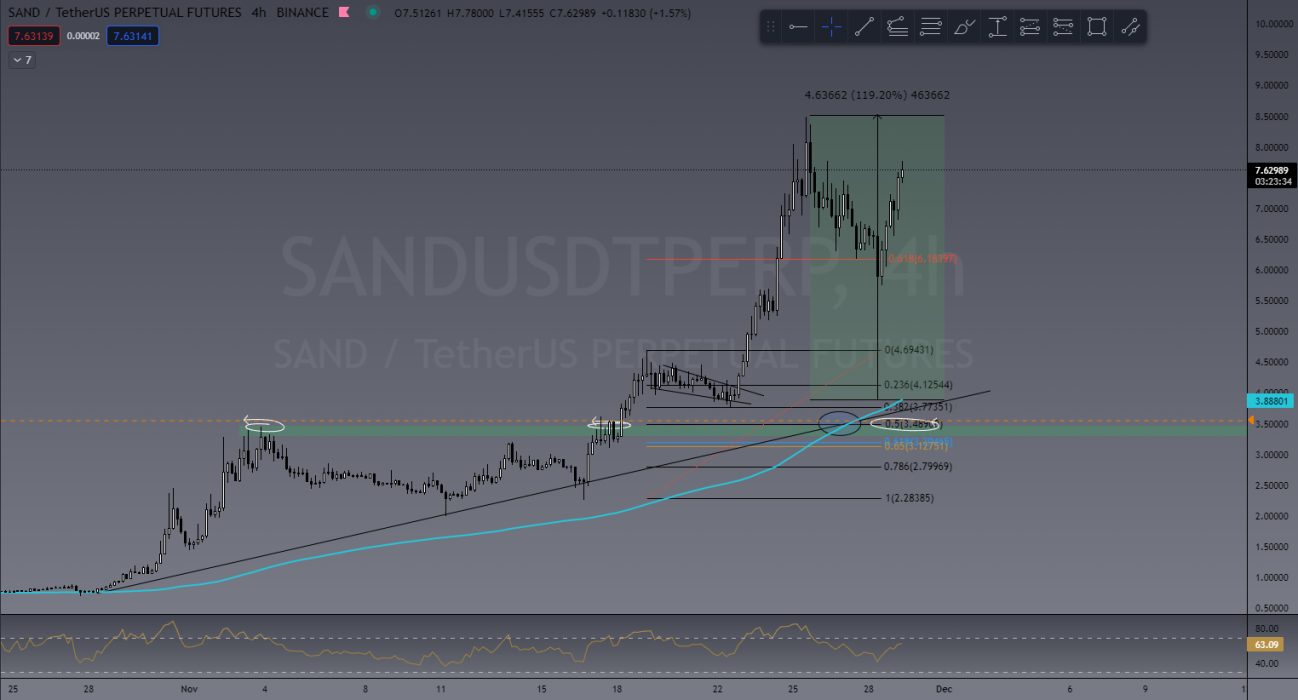
Last week in the TradeRoom, we were watching a lot of these Metaverse coins and SAND did not disappoint. I showed a bullflag forming on the 4H chart and was personally hoping to see a test of previous support and uptrend, but SAND didn’t want to wait. Breakout from the bullflag boasted a 120% push to the upside!

Bullflag breakout for SAND/USDT

LRC/USDT

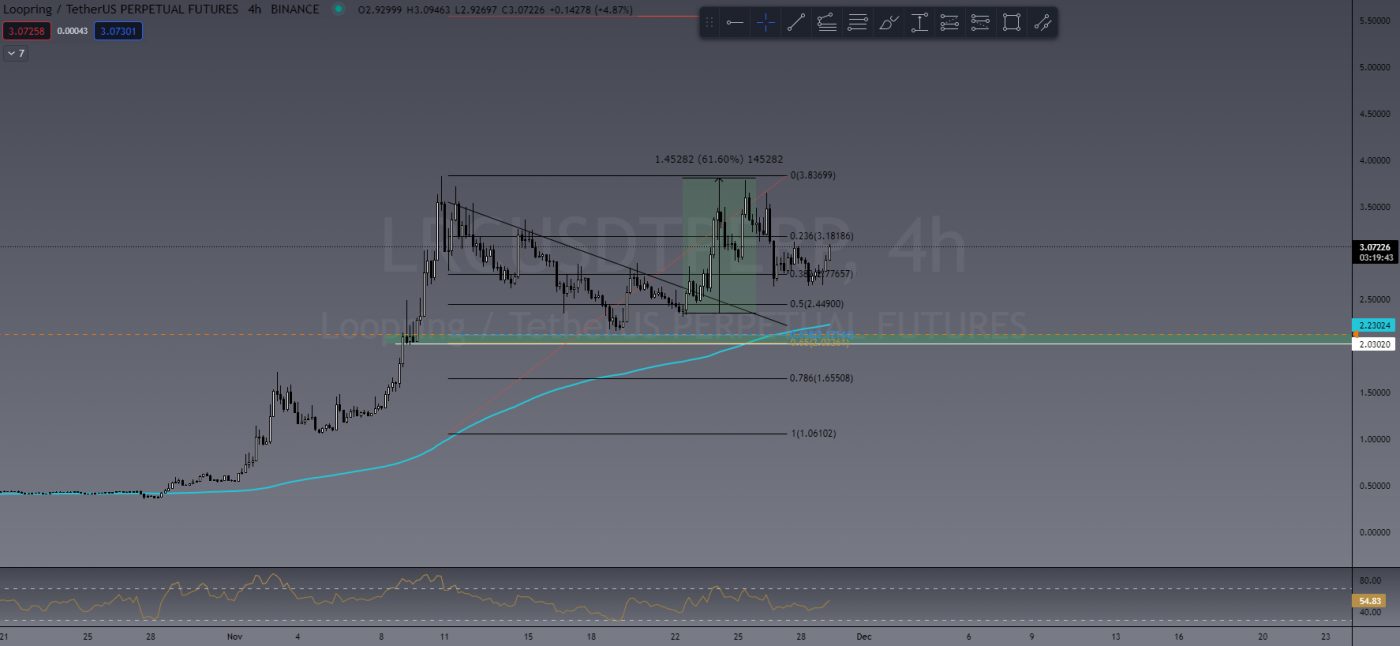
Like SAND, LRC didn’t want to wait for another test on support. Breaking out of a falling wedge identified by one of our team leaders, Pete, last week LRC sported a 60% bullish push and currently seems to be forming a new bullish market structure.

GALA/USDT

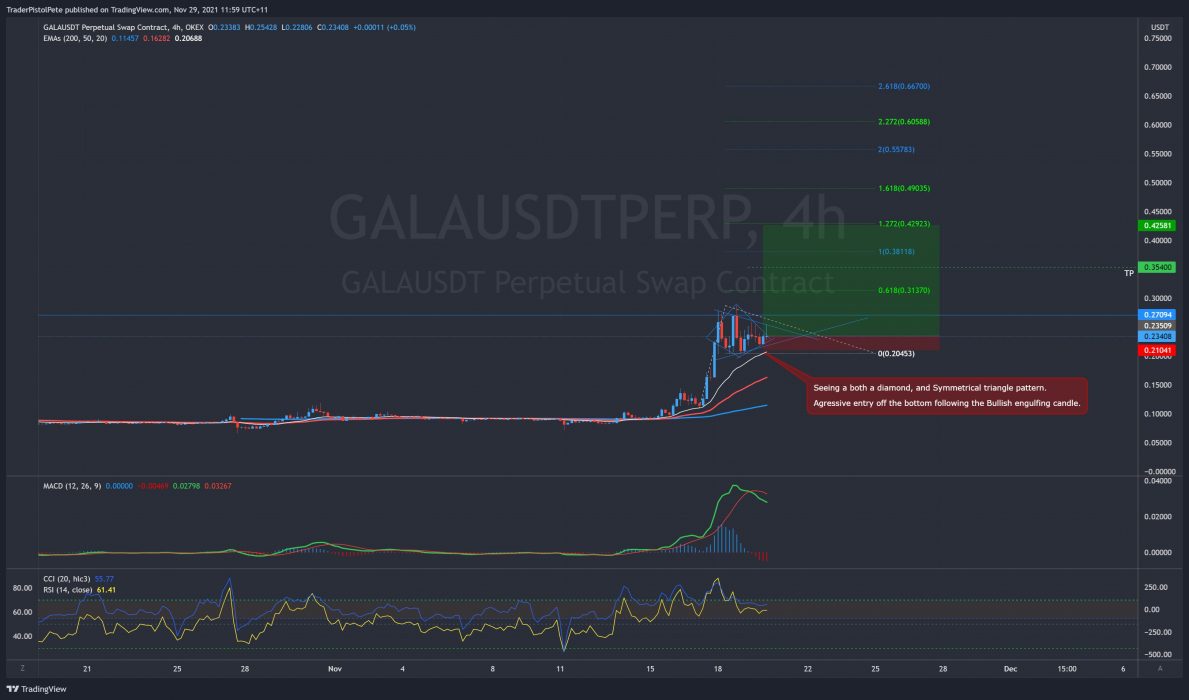
Trade of the week has to go to TCD team leader Pete for his massive GALA trade! With 10x leverage (considered a safe leverage for experienced traders), Pete’s profit is currently over 2000% while a spot trade would give a massive 262% from entry. Pete is a pattern trader and often enters trades based off certain chart patterns. In this case, he has seen a symmetrical triangle bullish continuation pattern.

GALA/USDT Before
GALA/USDT After

This Week’s Trades

ADA/USDT

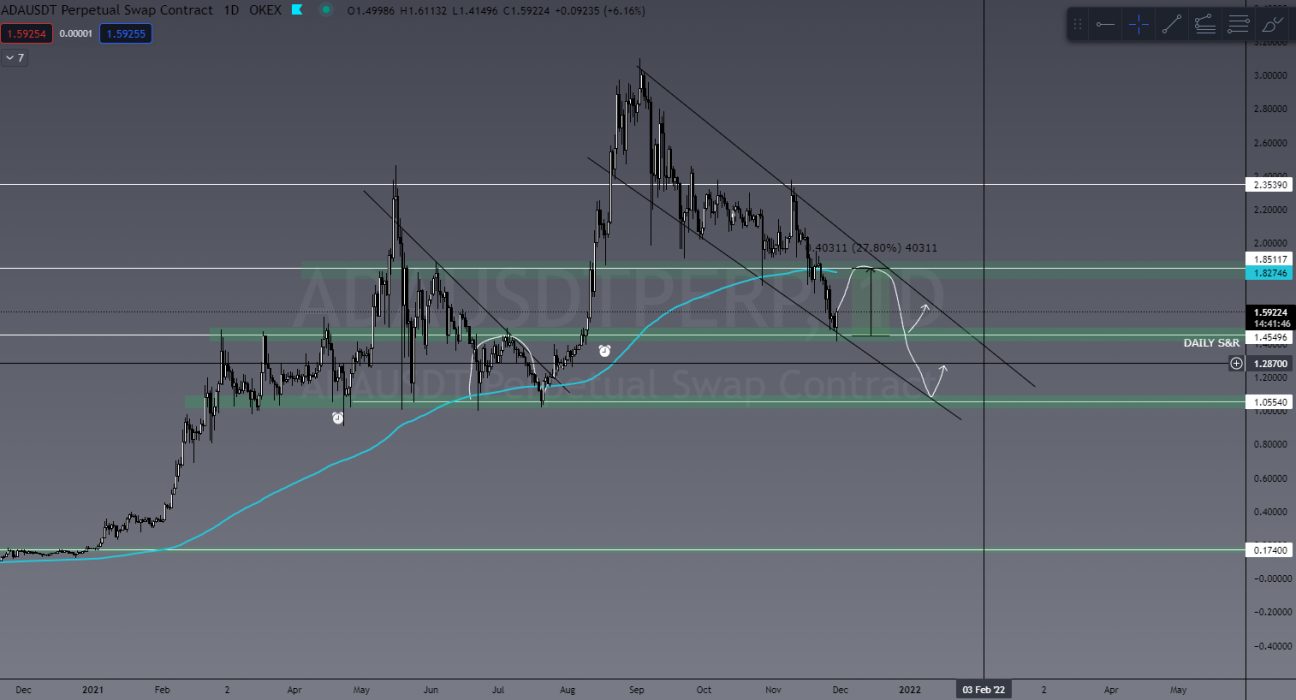
ADA has been trending down since the start of September and is really starting to come into some key levels here. This trade might play out this week or even over the next two weeks, but it’s certainly worth mentioning.

You can see in the chart below that ADA has currently found some bullish price action at the US$1.45 level of support. We could see a decent 30% push here, which would be great, and MAYBE even a breakout of the downtrend. However, I’m looking a little further ahead. If ADA rejected off the downtrend and pushed further below, the next, and likely last, level of support before revisiting US$0.30 is at the US$1 level.

This is a major level of both tested and psychological zone of support, and I’d expect to see some big money flow happen around here because failing to rally at US$1 would absolutely nuke ADA’s price action.

ADA/USDT

THETA/USDT

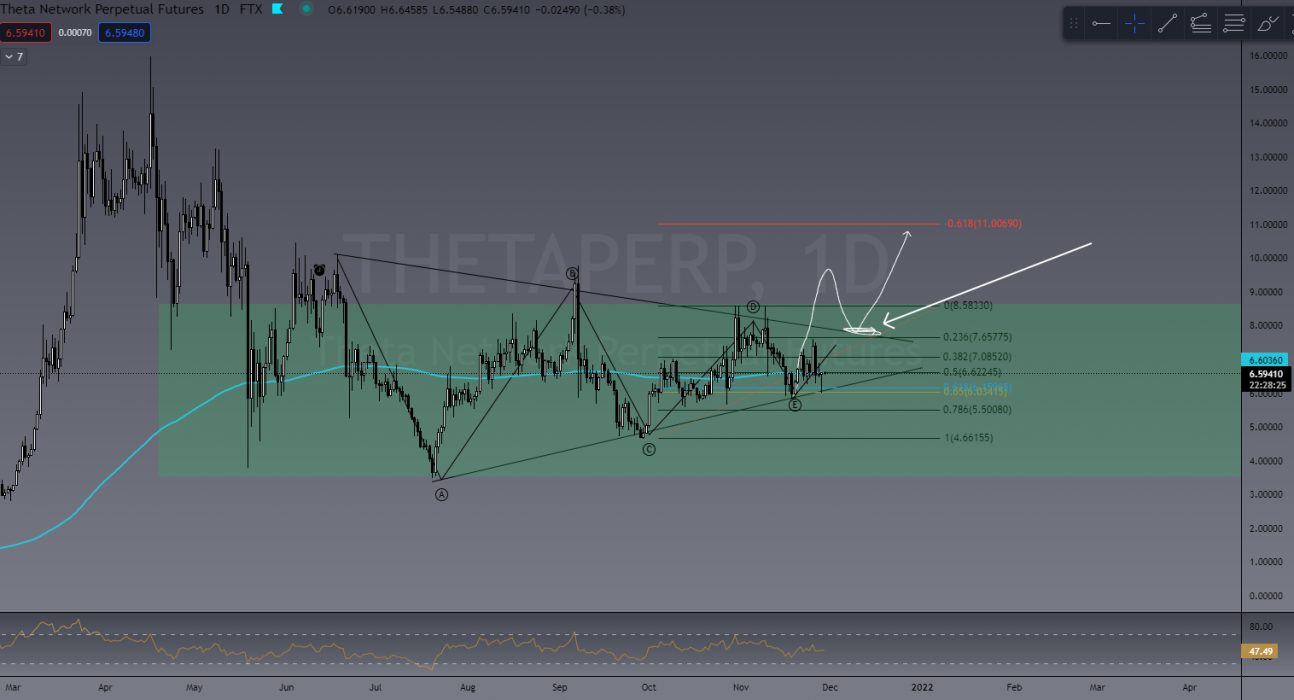
Another coin to keep an eye on is THETA. This is such a good coin to trade and will require a bit of patience to find the right entry.

After a period of consolidation, I’m looking to enter LONG/BUY at the RETEST of a breakout. This will of course highly depend on what BTC does this week, and it may stay in a consolidation zone a little longer. Nevertheless, it’s one to add to your watchlist.

THETA/USDT

OMG/USDT

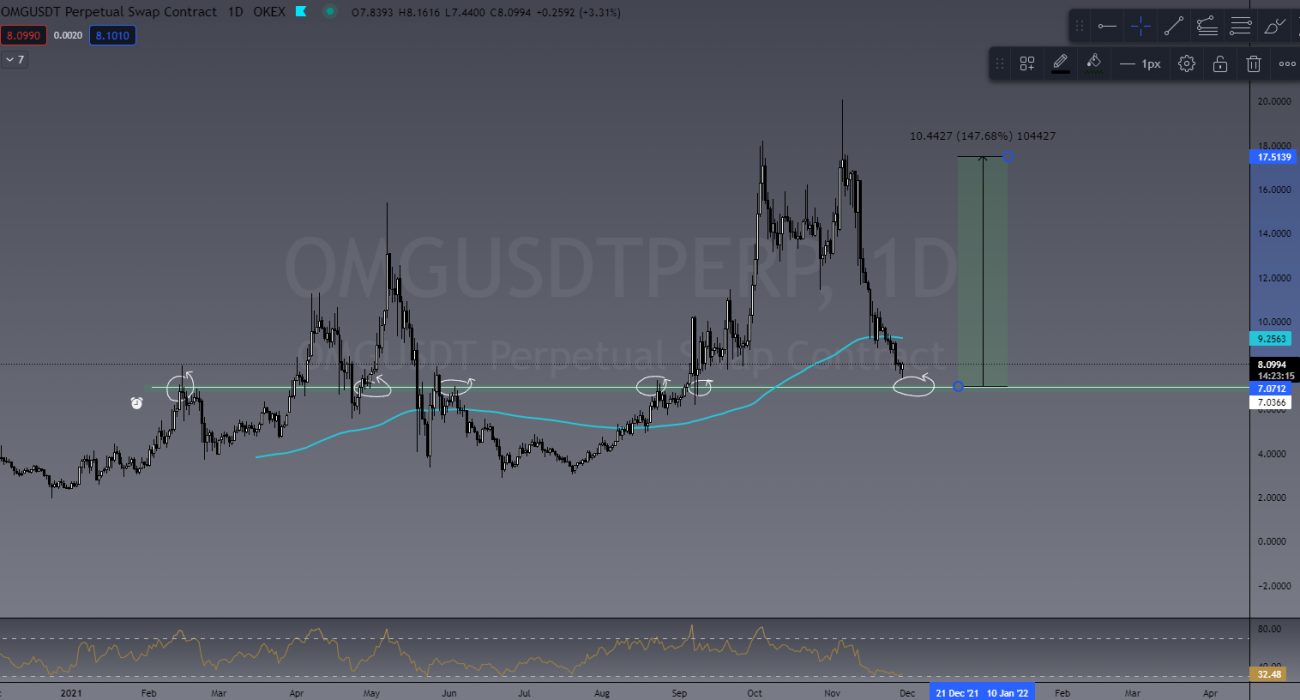
OMG could be coming into a key area of daily support, and is likely a rally point if BTC can behave a little. If OMG can push from US$7 and reclaim its previous high of US$17, we’ll see 150% growth. Another one to add to the watchlist.

OMG/USDT

Invite to Join our TradeRoom

If you’d like to become a better trader, you’re invited to join our TradeRoom where we share daily charts and market analysis. In our community we strongly encourage and teach correct risk management strategies to keep our members safe in this new volatile crypto market.
Join our “Apprentice” plan now for your 7-day trial.

TCD’s TradeRoom

The Crypto Den was created in 2017 to help the rapidly growing crypto community learn and understand the fundamentals of digital currencies and how to trade them. 

Since then we have taught thousands of members the basics of technical analysis and trading strategies to further progress and perfect their trading abilities.

In the TradeRoom you will be included in a supportive environment which encourages personal growth, education and community support.

It’s a place to share your trading ideas and follow other experienced traders’ feeds to help keep your finger on the pulse of such a volatile market!