Categories
Market Analysis The Crypto Den

TradeRoom: Our Weekly Crypto Trades Analysis – Dec 6, 2021

Welcome to this weekly series from the TradeRoom. My name is Dave and I’m the founder of The Crypto Den, an Australian-based crypto trading and education community aiming to give you the knowledge to take your trading game to the next level.

Crypto Market Outlook

Wow! What a week! Well, we alluded to a decent drop in TOTAL crypto cap over the past couple of weeks, but even this Trader wasn’t expecting an ADDITIONAL US$440 billion to get wiped out of the market. We’ve since clawed back US$365 billion of that, showing some strong bullish buyback, bringing the current TOTAL market cap back to US$2.26 trillion.

Remember it was only a couple of months ago we were all excited that the TOTAL hit its ATH again of just under US$2.5 trillion, so it’s not all bad!
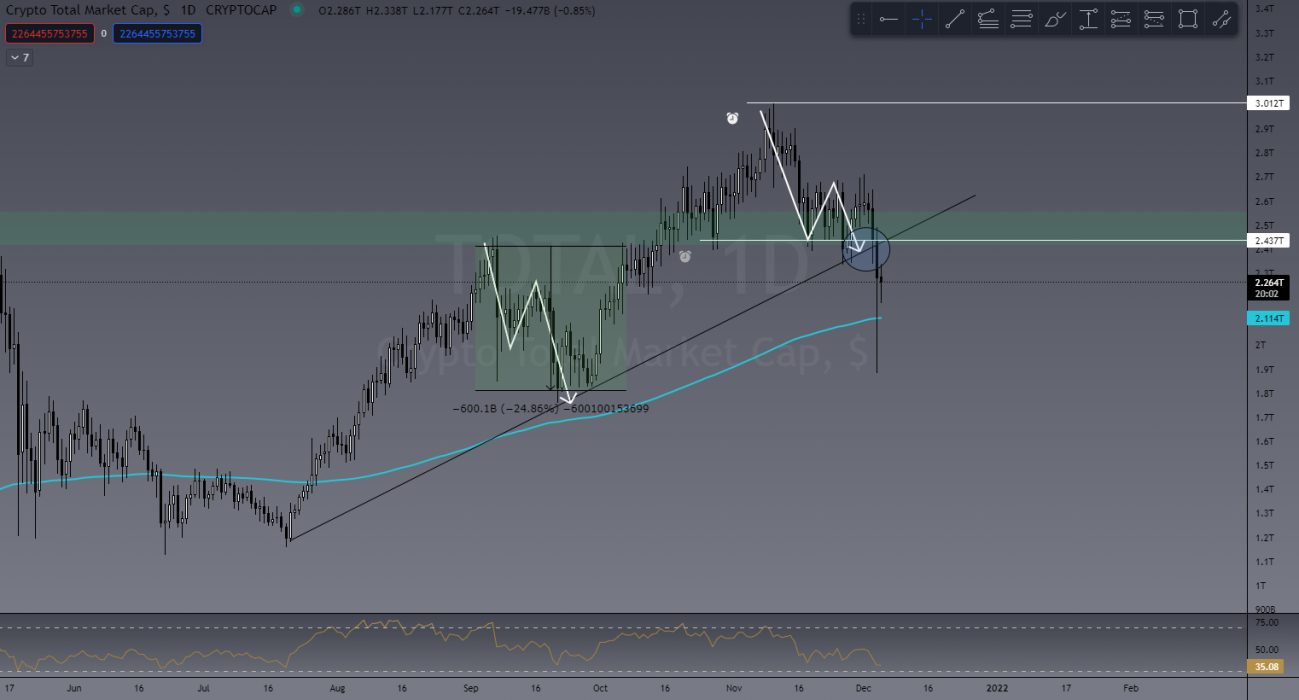
TOTAL Crypto Market Cap

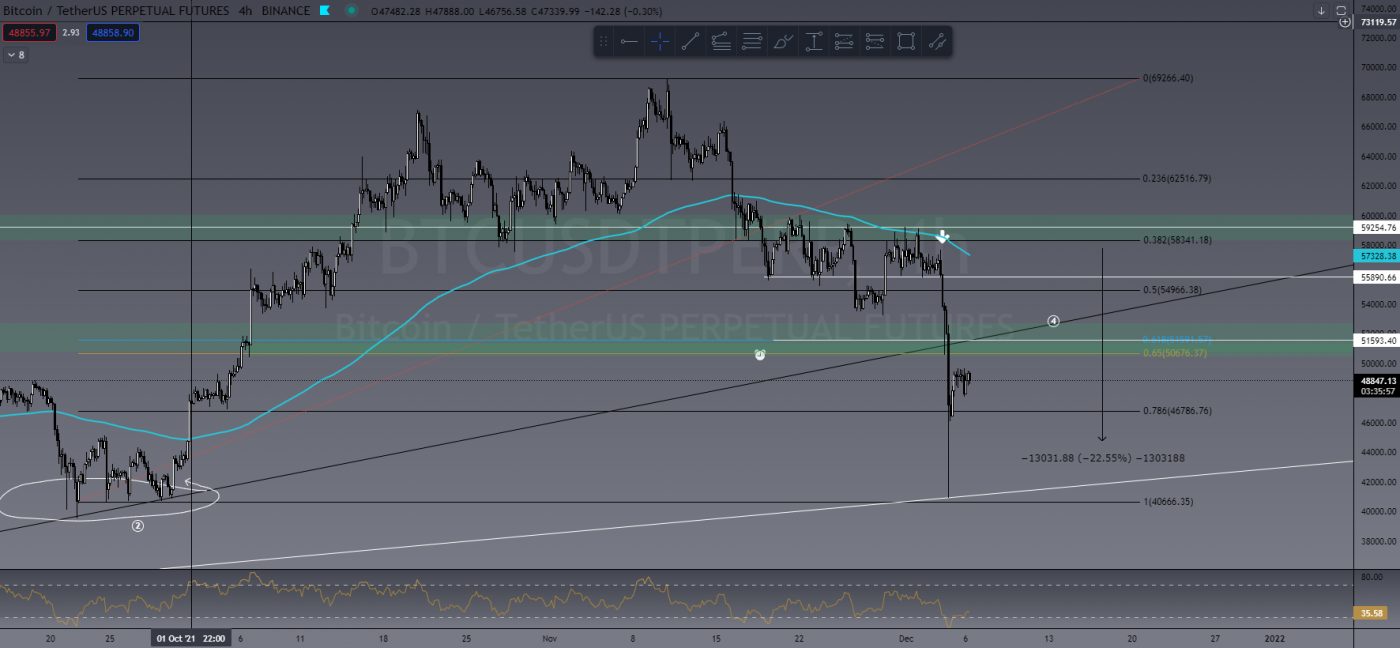
I had a target last week of US$51,500 for BTC. I was in an open short trade and BTC decided to blow right through that target and hit US$40,000. A US$13,000 daily candle! Now for me personally this was a good thing due to my open short trade, and I closed 50% of that trade at approximately US$45,000 and will let it play out from here.

Not so good for holders at the moment. If BTC fails to rally back above that daily 200 EMA (exponential moving average – blue line), then there could be a decent chance we see further downside. That said, I’m not feeling overly concerned just yet. I’m expecting a bullish push soon, although hedging my bets a little by keeping the remainder of my short trade open until the dust settles. ALWAYS wait for the dust to settle and a clear confirmation before entering a NEW position.
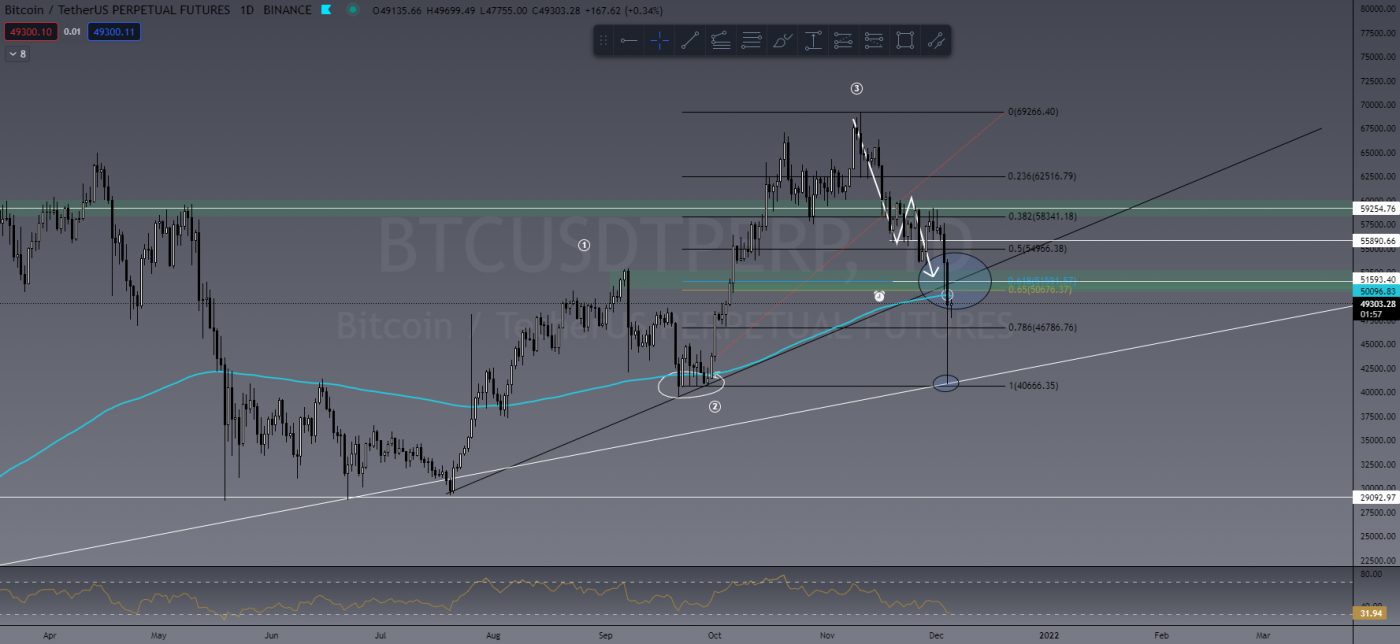
Current BTC daily chart

Ultimately I think we could see some more bearish action before a big bull run appears.


Last Week’s Performance

Well, last week we saw a lot of long positions get stopped out, some in profit, some not. This is why we teach you to use stop losses to mitigate risk! When BTC decides to nuke, the rest of the market follows.

For those of you in our TradeRoom it makes little difference if the market is going up or down because we can trade it both ways. So while some longs were getting stopped, we were scaling into shorts! Here are a couple of short trades from the week past.

LRC/USDT

You can see in the chart below where I’ve entered short twice on LRC and the reasons why are as basic as it gets. Support and Resistance. LRC was approaching ATH again while the rest of the market started to bleed. I waited for that first Lower High (LH) and entered short. Then I waited for the second LH and added to that position after confirming downtrending market structure. I closed 50% of the trade at US$2.17 and let the rest ride – currently at a 430% win on a 10x trade.
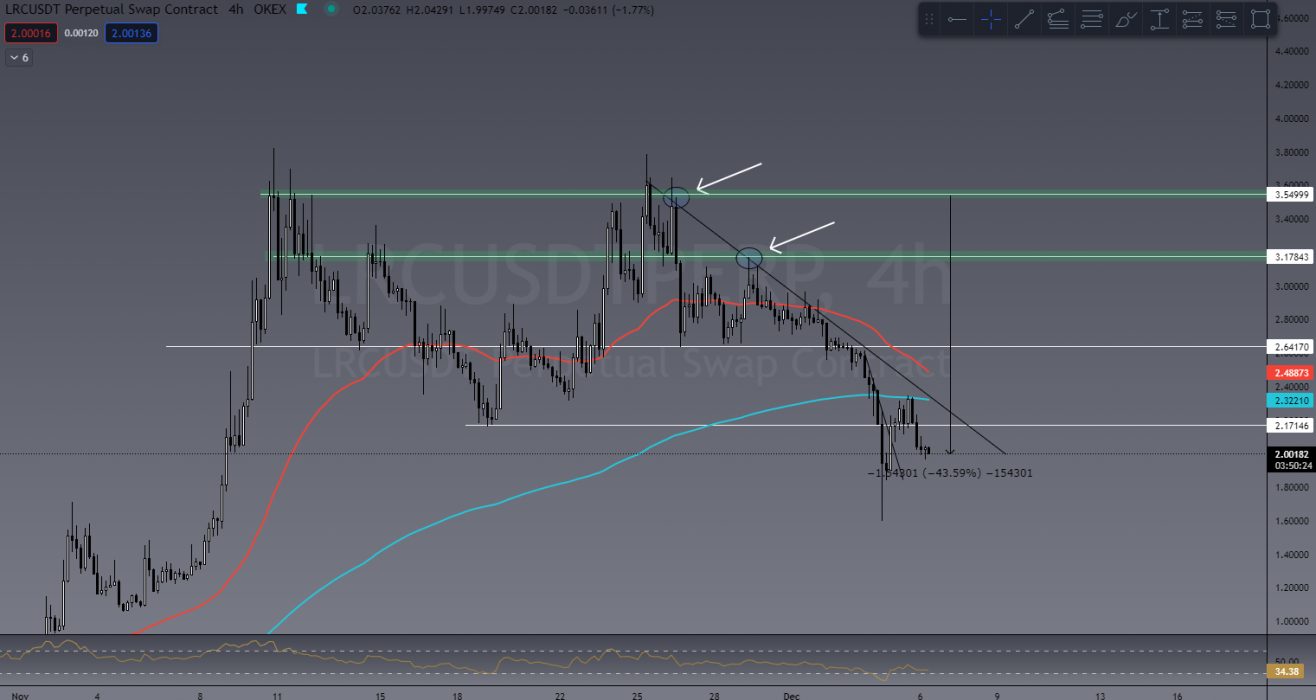
LRC/USDT short trade

BTC/USD

In a chart I shared in the TradeRoom last week, I outlined that BTC had three attempts at breaking through resistance and failed. Once again waiting for a LH to confirm, I entered short. I closed 50% of that position at approx. US$45,000 and will hedge my bets by letting the rest ride.

Our current position is 316% profit on a 20x trade.
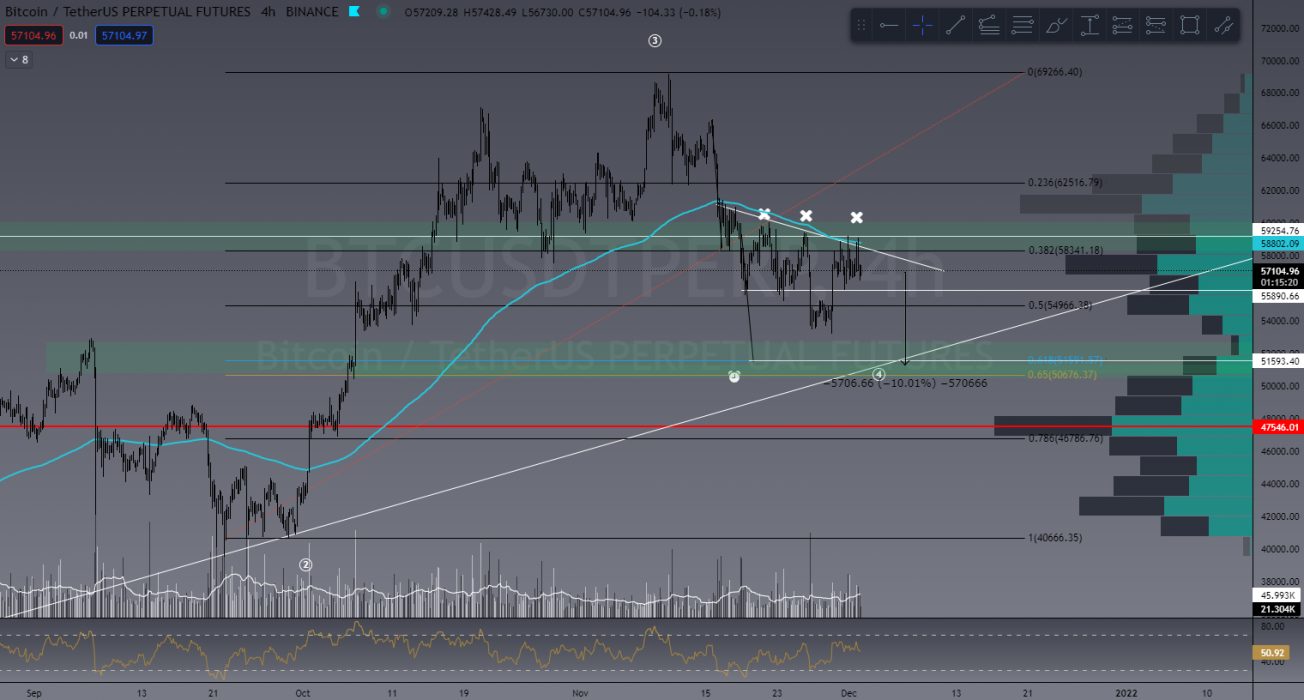
BTC chart shared in TradeRoom
Current BTC chart showing my trade entry


STORJ/USDT

STORJ was approaching a resistance level at its previous ATH price point. After it rejected, I again waited for that LH to form and entered short at US$2.92 and closed 100% of the trade at US$1.47 for a 490% ROI on 10x trade. You can see how this trade played out below:
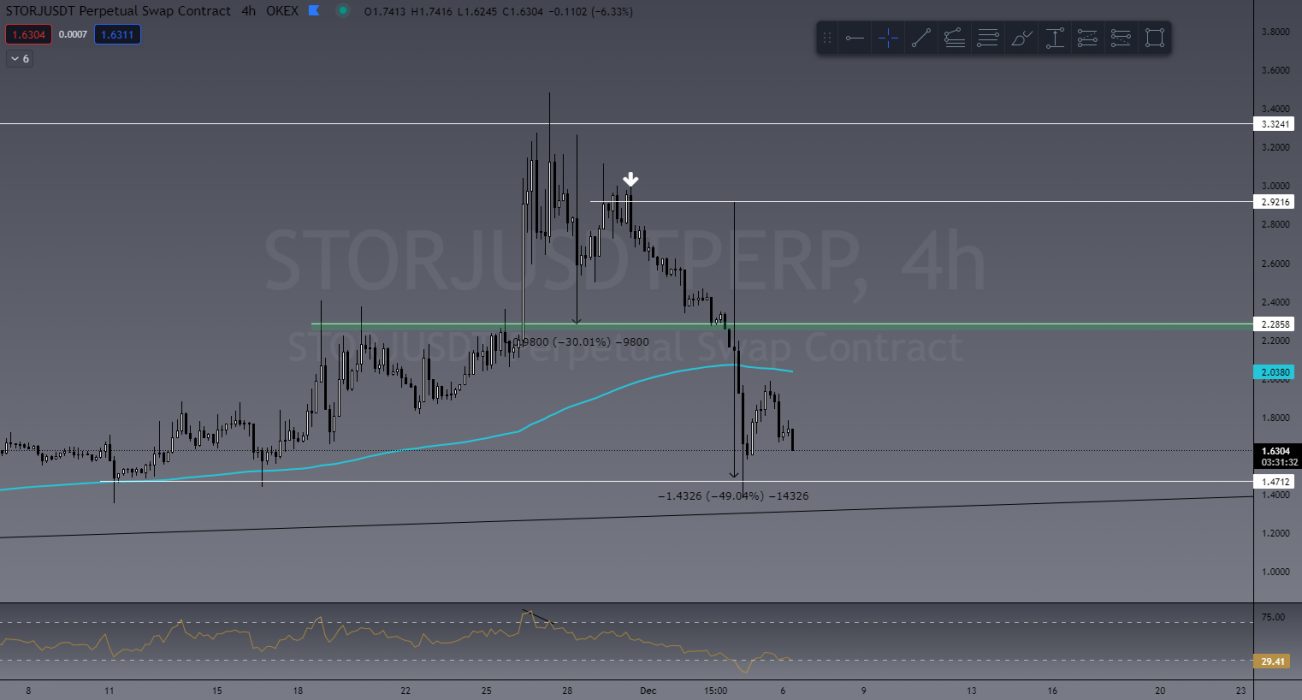
STORJ/USDT short trade

IMPORTANT NOTES ON SHORTING:

These trades taken this week have been short trades using leverage. The reason for this is simply because the market had been trending DOWN and this is how we profit from a bearish market. This cannot be done in a SPOT trading market, where your only option would be to sell and wait for a new buy level.

Shorting a market should only be done by experienced traders and should NOT be taken by beginners. While the profits I’ve mentioned above seem very attractive, it takes time to learn and practise this craft before being profitable.

If you would like to learn how to do this, TODAY IS THE LAST DAY you can register for our current trading course. Our next LIVE course will be in February 2022.


This Week’s Trades

ADA/USDT

As I mentioned in last week’s article, I’m watching ADA pretty closely to come down and hit that US$1 level. Not only will I likely take longs here but will also buy in spot. This will ultimately depend highly on candlestick analysis in that area AND on what BTC is doing at the time. However, I still think this could present a good opportunity at this psychological level. If ADA breaks this level of support, then US$0.30 is on the table so it will be really important for US$1 to hold.
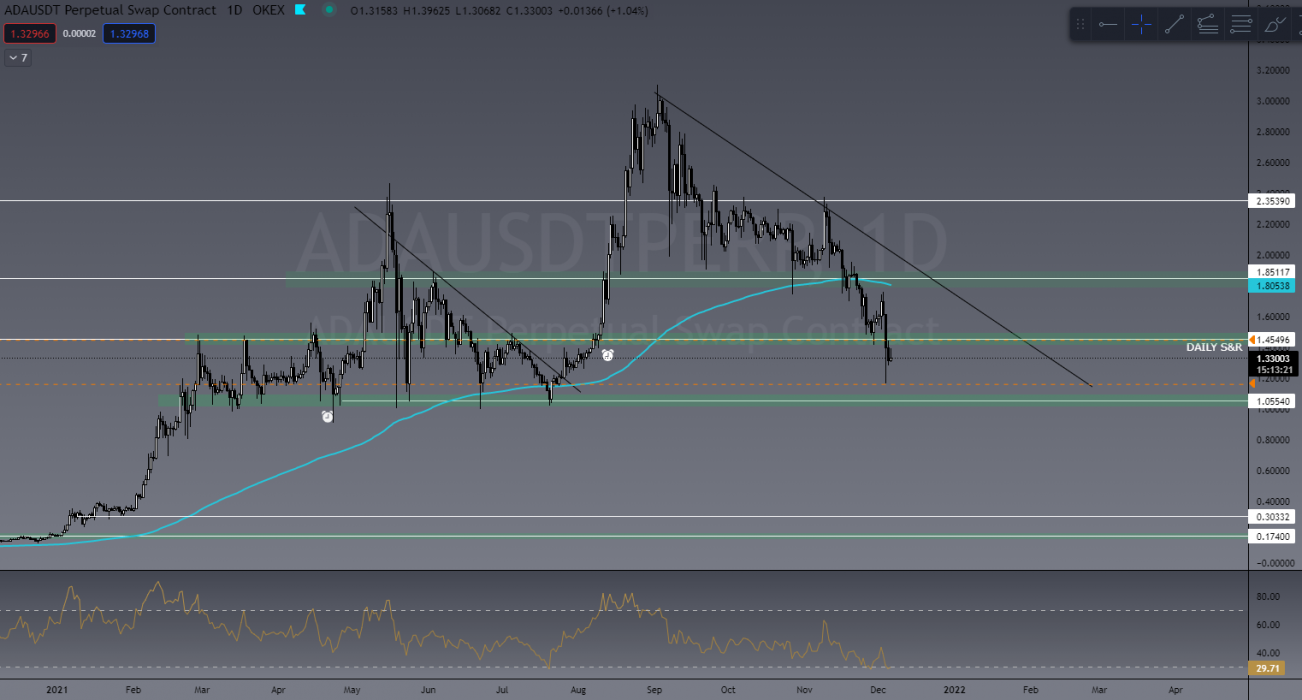
ADA/USDT

BTM/USDT

Another I’m watching pretty closely is BTM. Not a lot of price history for this one, but there could be opportunity here. This will depend heavily on BTC behaving as there are no more levels of support below the current price zone, meaning another drop will be forming all-time lows (ATL). From here there’s no data to base anything on so we use tools like market oscillators and Fibonacci to find key levels.
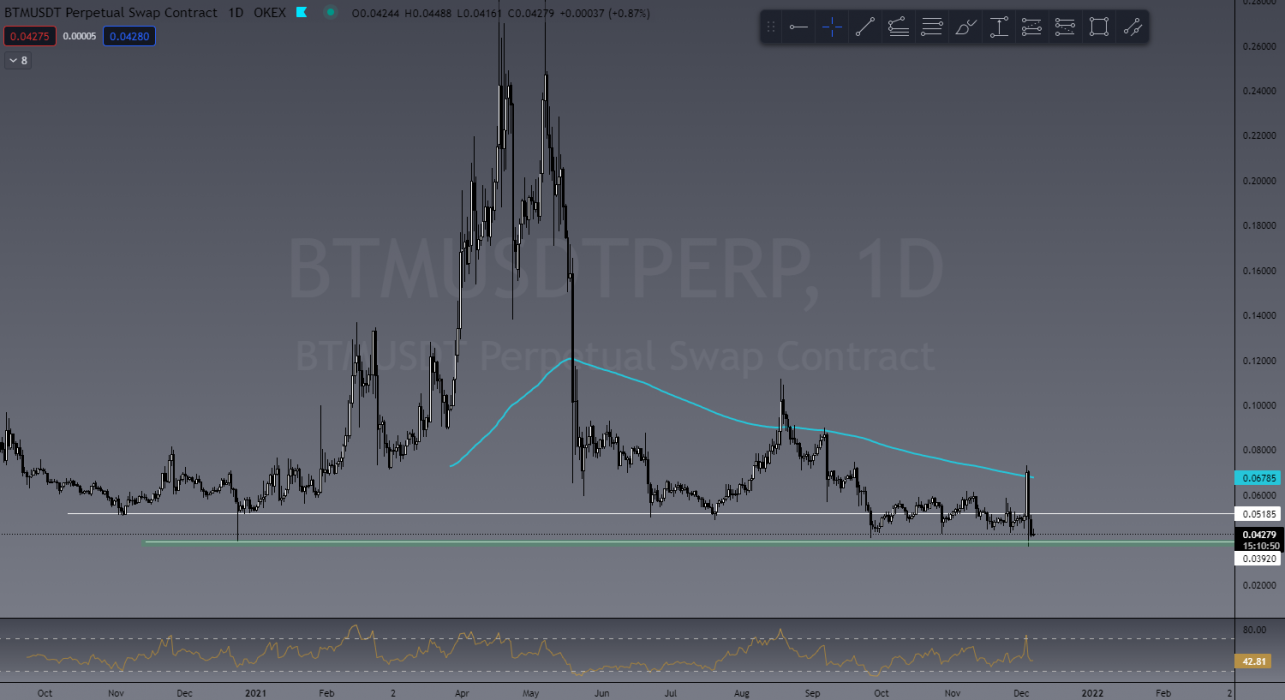
BTM/USDT

Invite to Join our TradeRoom

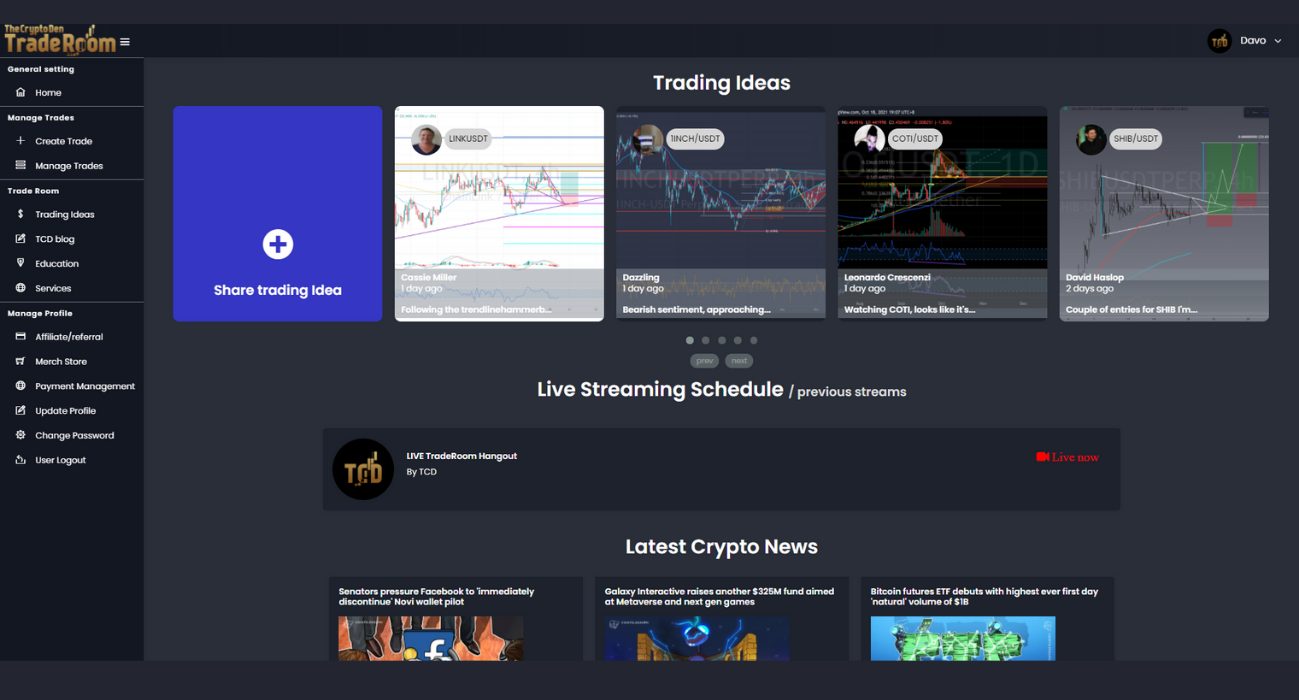
If you’d like to become a better trader, you’re invited to join our TradeRoom where we share daily charts and market analysis. In our community we strongly encourage and teach correct risk management strategies to keep our members safe in this new volatile crypto market.
Join our “Apprentice” plan now for your 7-day trial.

The Crypto Den was created in 2017 to help the rapidly growing crypto community learn and understand the fundamentals of digital currencies and how to trade them. 

Since then we have taught thousands of members the basics of technical analysis and trading strategies to further progress and perfect their trading abilities.

In the TradeRoom you will be included in a supportive environment which encourages personal growth, education and community support.

It’s a place to share your trading ideas and follow other experienced traders’ feeds to help keep your finger on the pulse of such a volatile market!

Categories
Market Analysis The Crypto Den

TradeRoom: Our Weekly Crypto Trades Analysis – Nov 29, 2021

Welcome to this weekly series from the TradeRoom. My name is Dave and I’m the founder of The Crypto Den, an Australian-based crypto trading and education community aiming to give you the knowledge to take your trading game to the next level.

Crypto Market Outlook

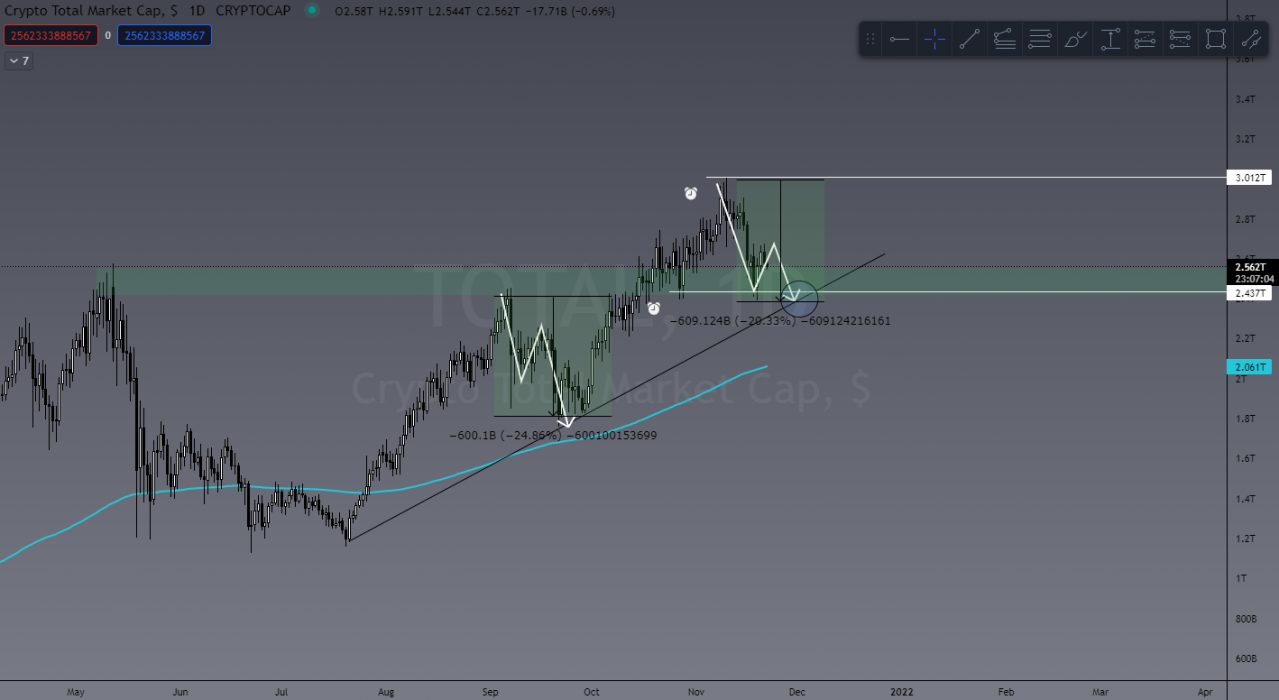
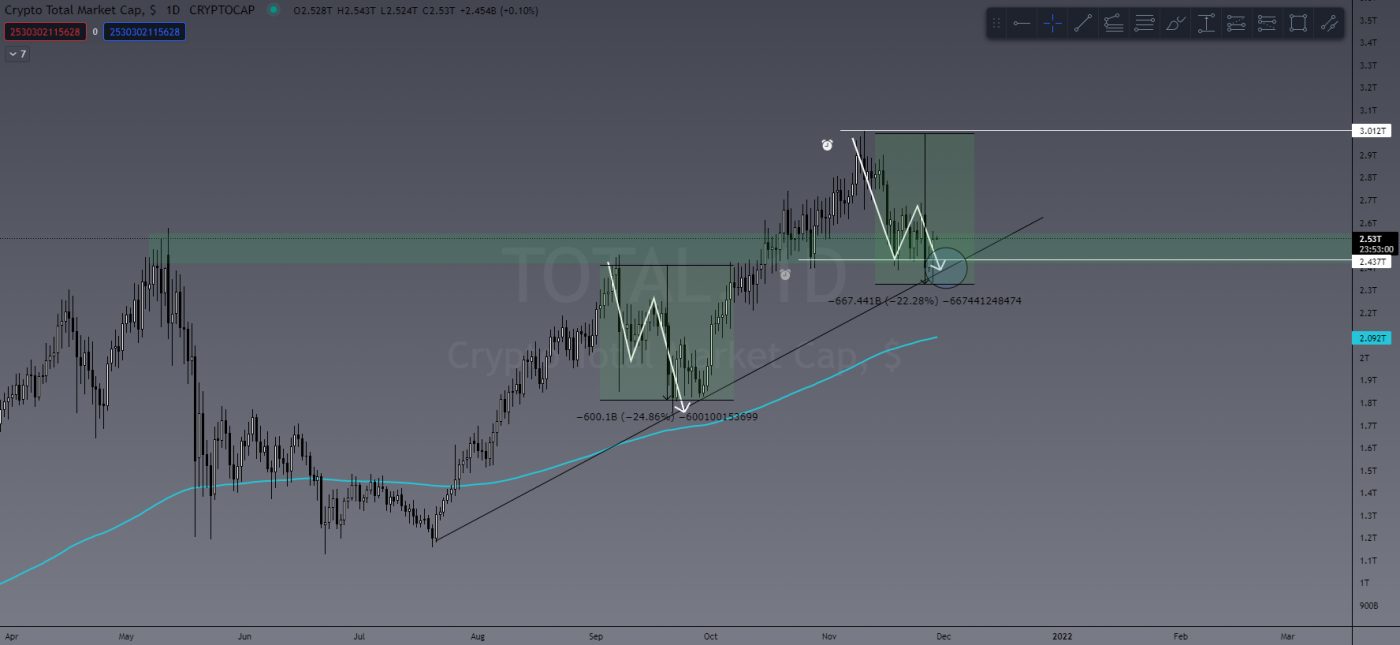
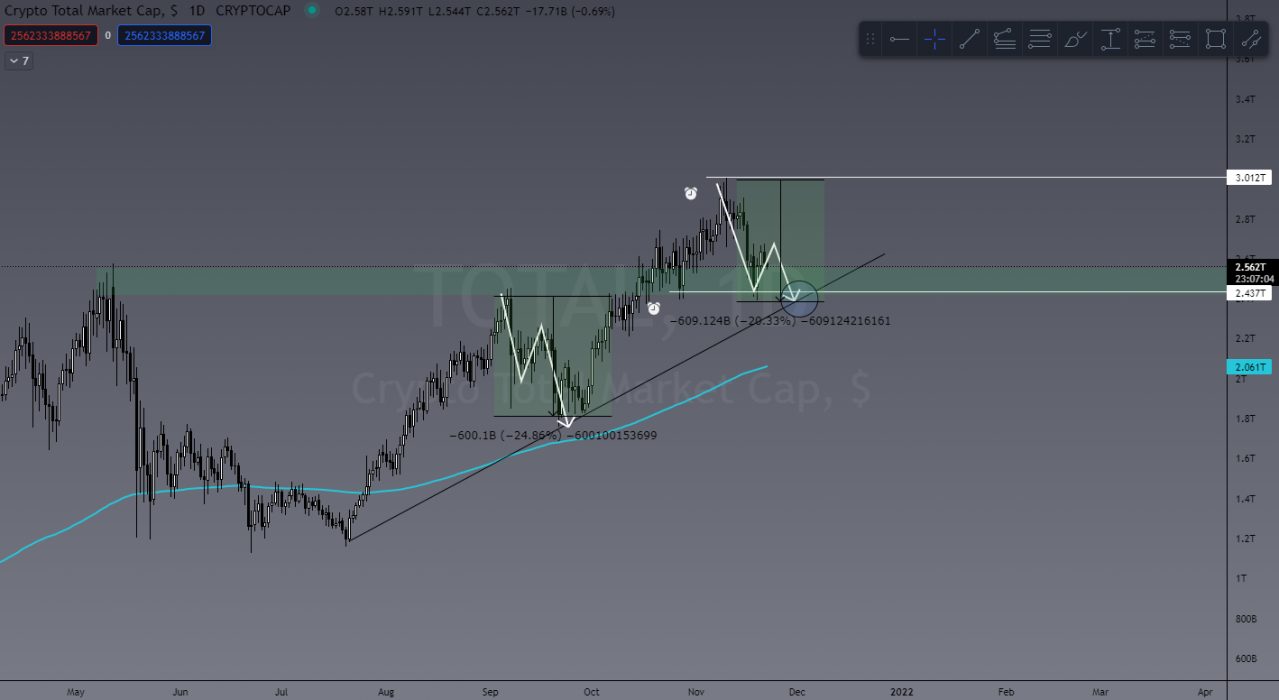
Last week I touched on the US$600 billion drop in TOTAL crypto market cap. I warned that we could see some more selling pressure but there was no reason to stress or start panic selling. You can see below that the TOTAL crypto cap has indeed pulled back further to retest its current uptrend. So far it’s showing a bullish test with a long wick to the downside and a strong bullish engulfing candle on the daily timeframe.

Image from last week’s update
TOTAL crypto market cap current value

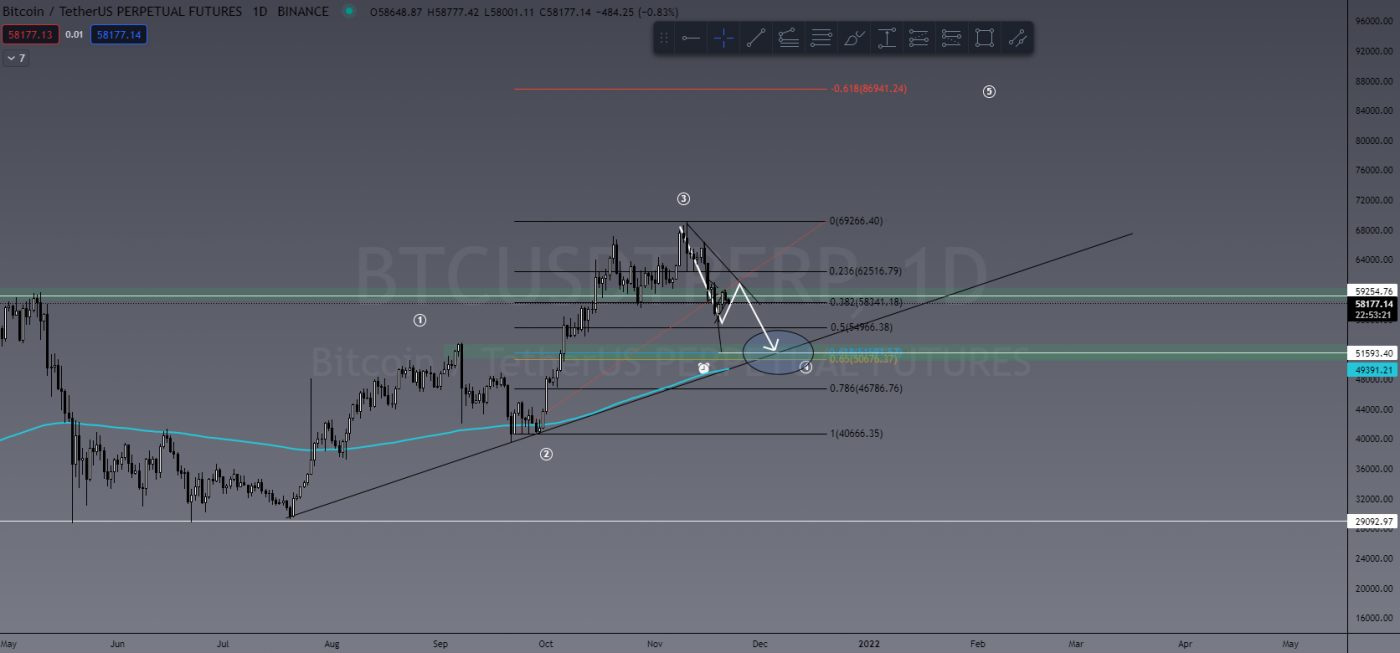
With the projection of the TOTAL heading down in value, I suggested BTC would follow this formation and see further bearish price action. My target being US$51,000, we haven’t hit that price YET. So far BTC is showing some signs of strength and the bottom of this local downtrend MIGHT be in, so it would serve you well to expect a bounce here and plan your trades accordingly.

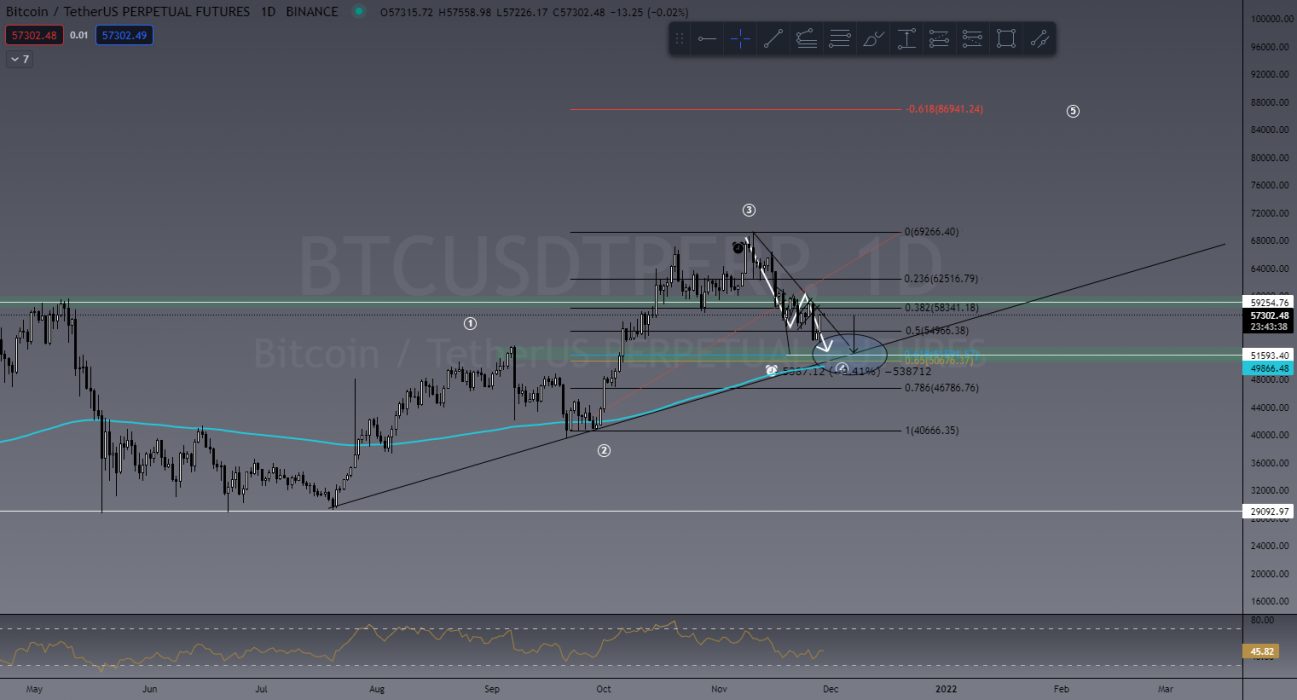
That said, we’re not out of the woods yet. While BTC is trending below that local downtrend line and forming lower lows/lower highs (bearish market structure), we could see it hit that suggested area of support at US$51,500.

Projection from last week’s article
Current BTC price action

What’s interesting about the US$51,500 level is the perfect storm forming. There are so many key identifiers converging in that one area. We have:

  • the 61.8% Fibonacci retrace level;
  • daily 200 Exponential Moving Average(EMA);
  • daily level of support;
  • daily uptrend;
  • daily Higher Low (excellent market structure);
  • all of which plays well into the Elliott Wave Theory of market cycles.

It’s almost the perfect trade setup and something we discussed in last Thursday’s market scan in the TradeRoom. You can catch a sneak peek on our YouTube channel.


Last Week’s Performance

SAND/USDT

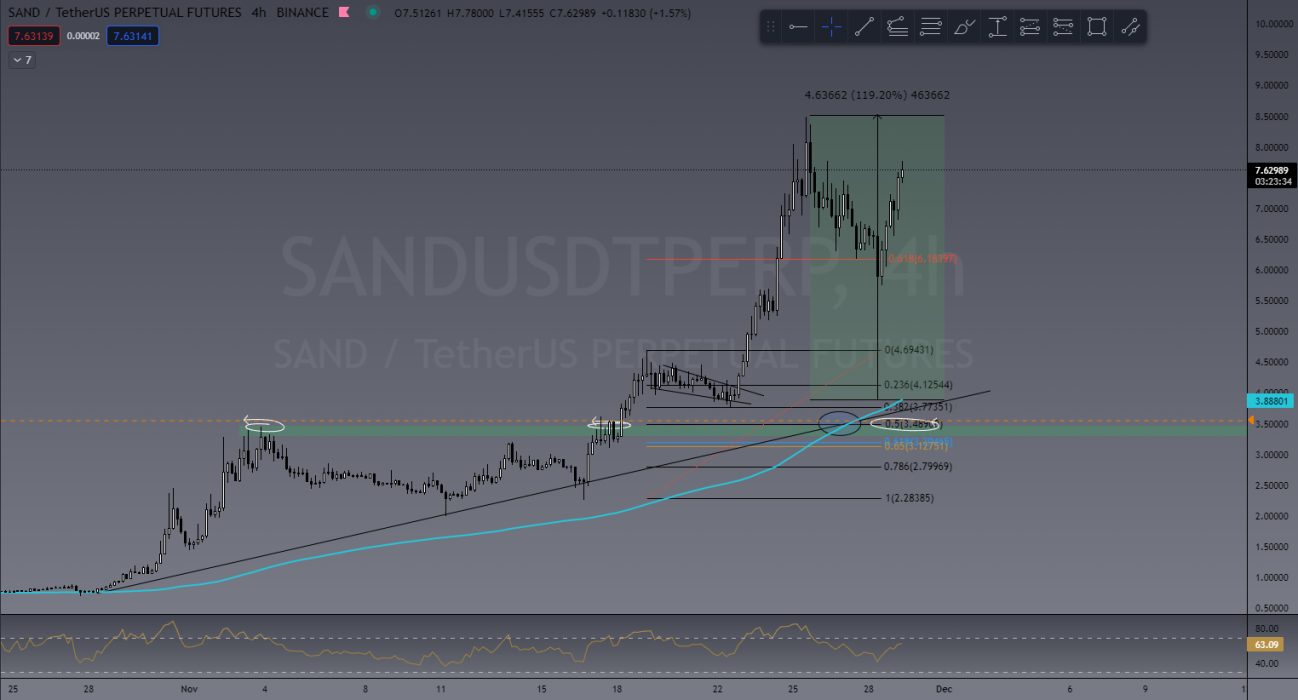
Last week in the TradeRoom, we were watching a lot of these Metaverse coins and SAND did not disappoint. I showed a bullflag forming on the 4H chart and was personally hoping to see a test of previous support and uptrend, but SAND didn’t want to wait. Breakout from the bullflag boasted a 120% push to the upside!

Bullflag breakout for SAND/USDT

LRC/USDT

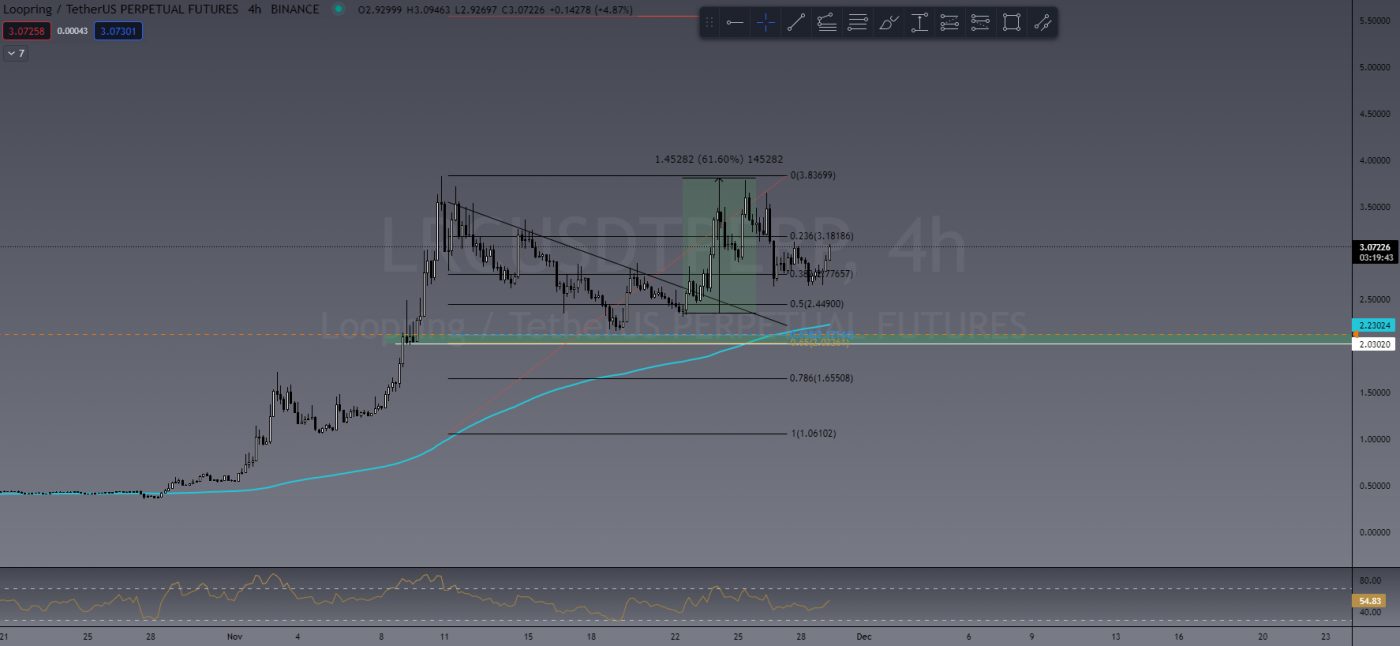
Like SAND, LRC didn’t want to wait for another test on support. Breaking out of a falling wedge identified by one of our team leaders, Pete, last week LRC sported a 60% bullish push and currently seems to be forming a new bullish market structure.

GALA/USDT

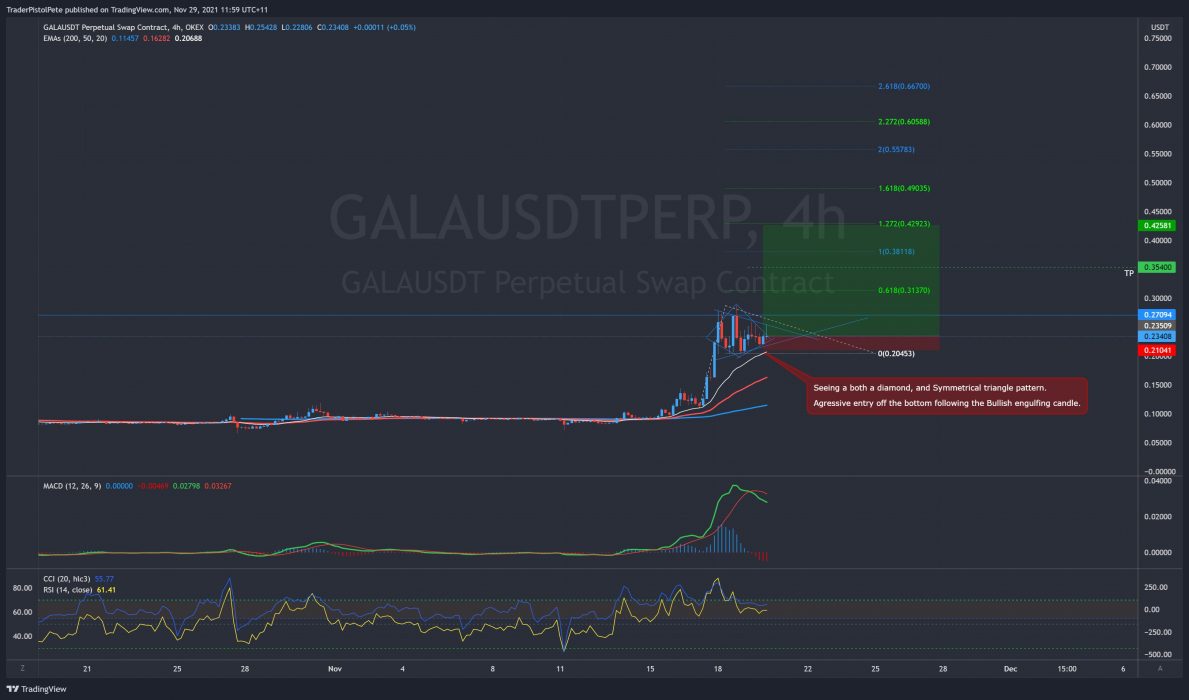
Trade of the week has to go to TCD team leader Pete for his massive GALA trade! With 10x leverage (considered a safe leverage for experienced traders), Pete’s profit is currently over 2000% while a spot trade would give a massive 262% from entry. Pete is a pattern trader and often enters trades based off certain chart patterns. In this case, he has seen a symmetrical triangle bullish continuation pattern.

GALA/USDT Before
GALA/USDT After

This Week’s Trades

ADA/USDT

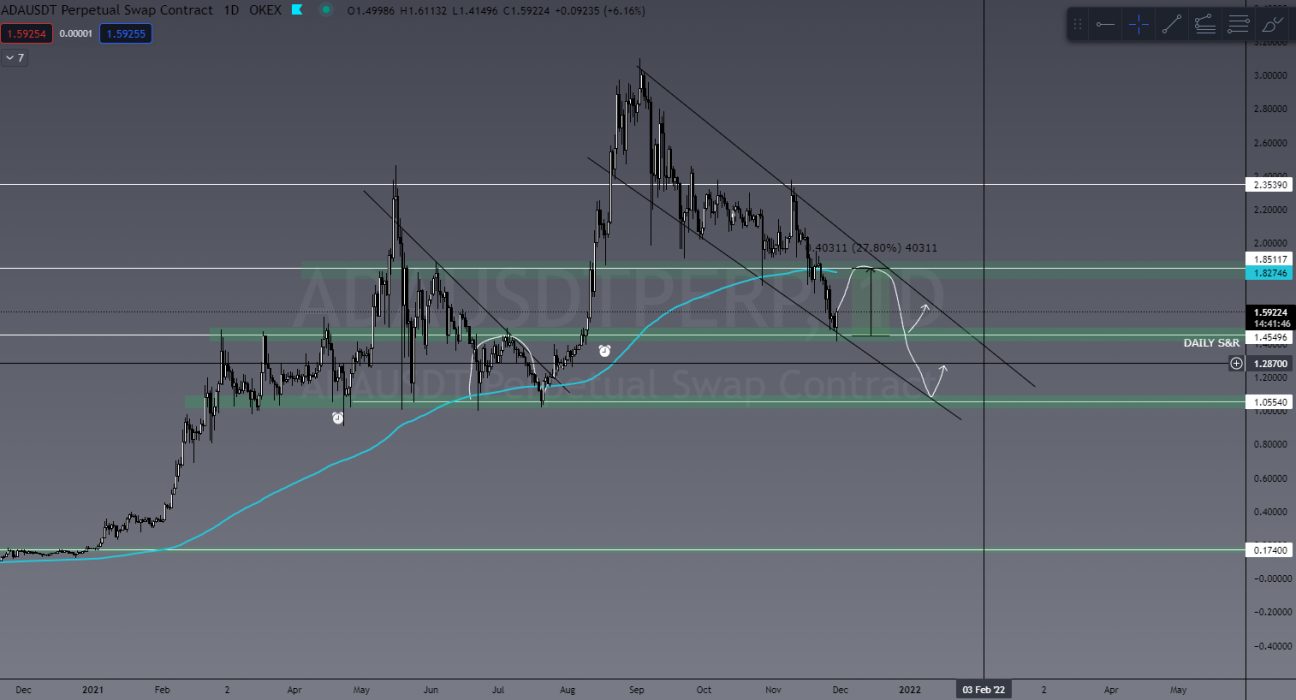
ADA has been trending down since the start of September and is really starting to come into some key levels here. This trade might play out this week or even over the next two weeks, but it’s certainly worth mentioning.

You can see in the chart below that ADA has currently found some bullish price action at the US$1.45 level of support. We could see a decent 30% push here, which would be great, and MAYBE even a breakout of the downtrend. However, I’m looking a little further ahead. If ADA rejected off the downtrend and pushed further below, the next, and likely last, level of support before revisiting US$0.30 is at the US$1 level.

This is a major level of both tested and psychological zone of support, and I’d expect to see some big money flow happen around here because failing to rally at US$1 would absolutely nuke ADA’s price action.

ADA/USDT

THETA/USDT

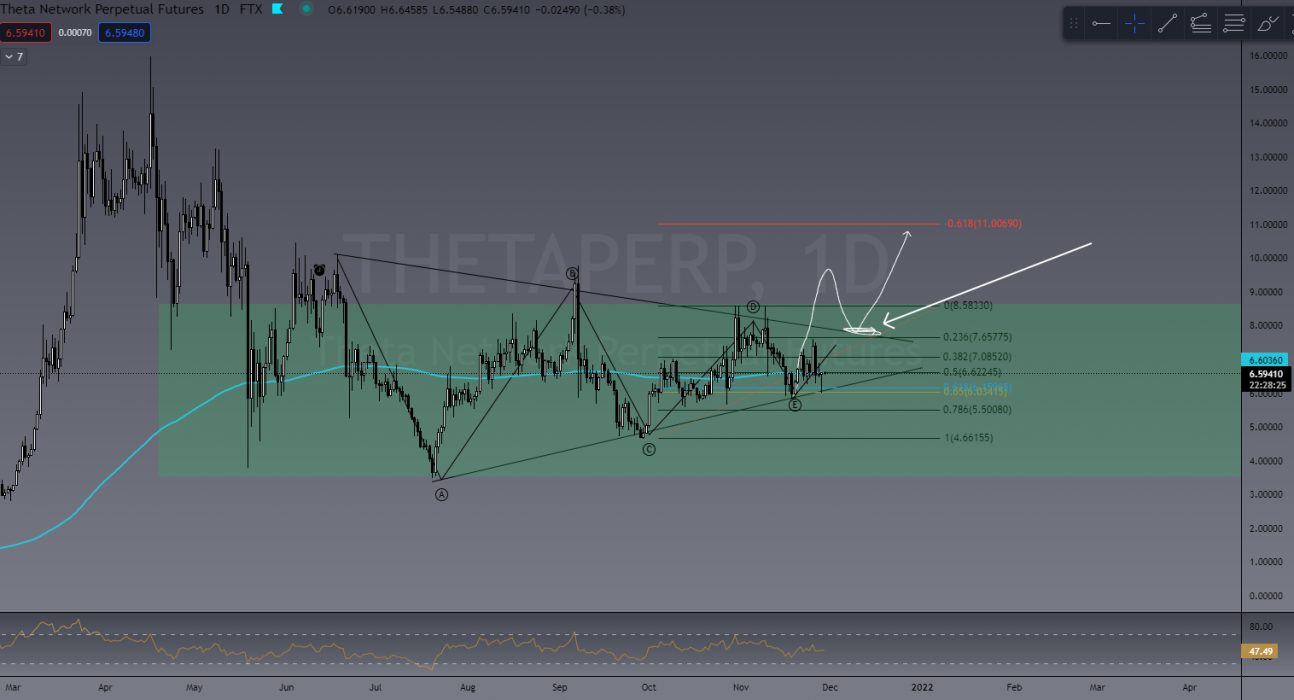
Another coin to keep an eye on is THETA. This is such a good coin to trade and will require a bit of patience to find the right entry.

After a period of consolidation, I’m looking to enter LONG/BUY at the RETEST of a breakout. This will of course highly depend on what BTC does this week, and it may stay in a consolidation zone a little longer. Nevertheless, it’s one to add to your watchlist.

THETA/USDT

OMG/USDT

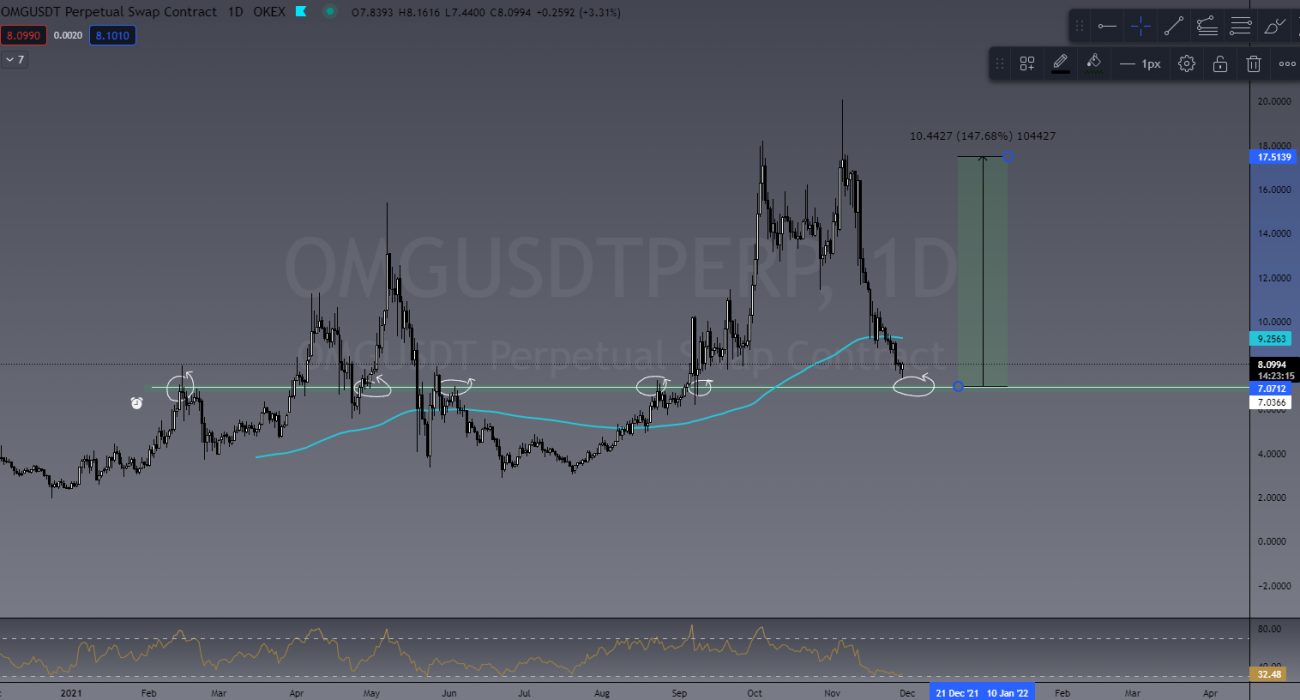
OMG could be coming into a key area of daily support, and is likely a rally point if BTC can behave a little. If OMG can push from US$7 and reclaim its previous high of US$17, we’ll see 150% growth. Another one to add to the watchlist.

OMG/USDT

Invite to Join our TradeRoom

If you’d like to become a better trader, you’re invited to join our TradeRoom where we share daily charts and market analysis. In our community we strongly encourage and teach correct risk management strategies to keep our members safe in this new volatile crypto market.
Join our “Apprentice” plan now for your 7-day trial.

TCD’s TradeRoom

The Crypto Den was created in 2017 to help the rapidly growing crypto community learn and understand the fundamentals of digital currencies and how to trade them. 

Since then we have taught thousands of members the basics of technical analysis and trading strategies to further progress and perfect their trading abilities.

In the TradeRoom you will be included in a supportive environment which encourages personal growth, education and community support.

It’s a place to share your trading ideas and follow other experienced traders’ feeds to help keep your finger on the pulse of such a volatile market!

Categories
Market Analysis The Crypto Den

TradeRoom: Our Weekly Crypto Trades Analysis – Nov 22, 2021

Welcome to this weekly series from the TradeRoom. My name is Dave and I’m the founder of The Crypto Den, an Australian-based crypto trading and education community aiming to give you the knowledge to take your trading game to the next level.

Crypto Market Outlook

The crypto markets took a pretty decent hit after a US$500 billion sell-off in the past week. If you’re one of those people I’m seeing across all socials freaking out about this, DON’T STRESS!
You can see in the TOTAL chart below that the entire crypto cap took a US$600 billion hit back in September and recovered quite well. At this point I’m expecting the same to happen again.

TOTAL Crypto market cap

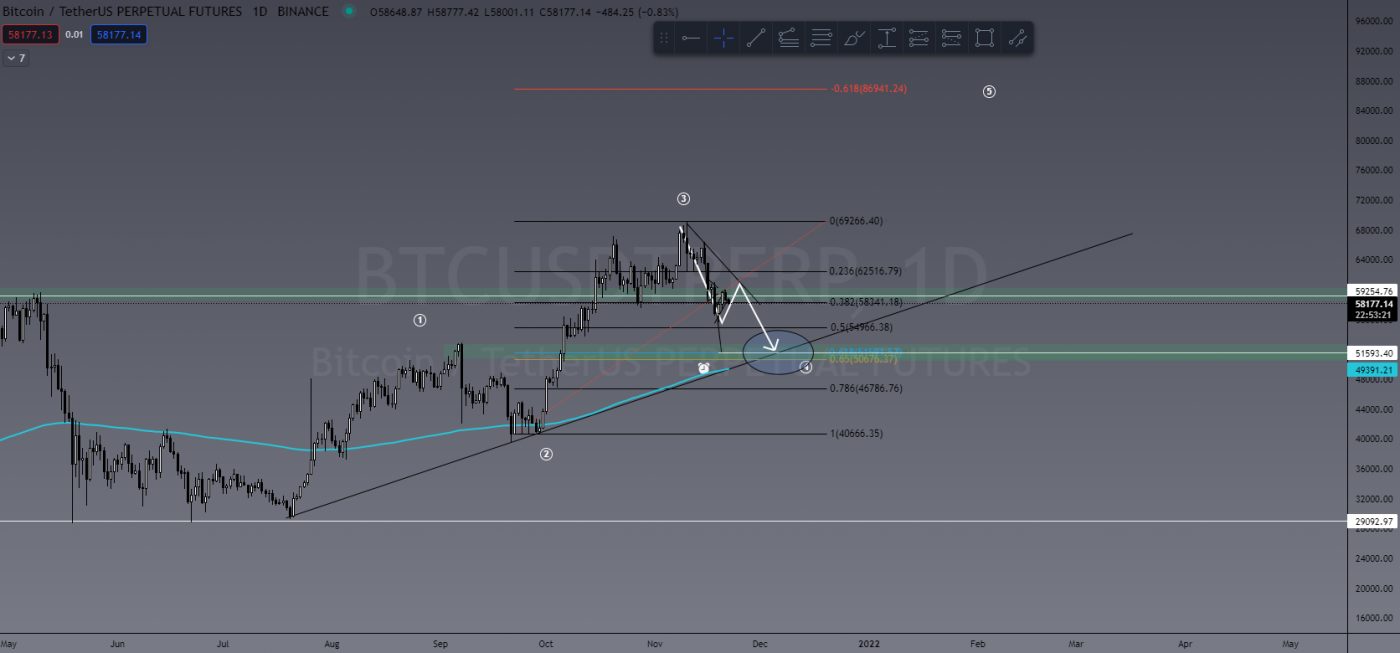
Looking at Bitcoin, we are seeing a bit of Elliott Wave Theory in play here. For those who don’t know what that is, it’s essentially investor psychology and sentiment presented as recurring patterns in the market – a 5 wave pattern, 3 waves up (impulse waves) and 2 waves down (corrective waves).

BTC is currently in the middle of wave 4 having a small bounce on the 50% Fibonacci level. We are expecting to to see further downside to a level of confluence between the current uptrend, 61.8% Fibonacci level and daily support level at US$51,500. All of which supports the Elliott Wave Theory.

BTC/USDT

Keep in mind wave 4 is a corrective wave. So this doesn’t mean doom and gloom. It would indicate BTC is simply having a healthy correction before the next leg up. I stand by our initial targets of US$78,000 as target 1 and US$87,000 as target 2.


Last Week’s Performance

MANA/USDT

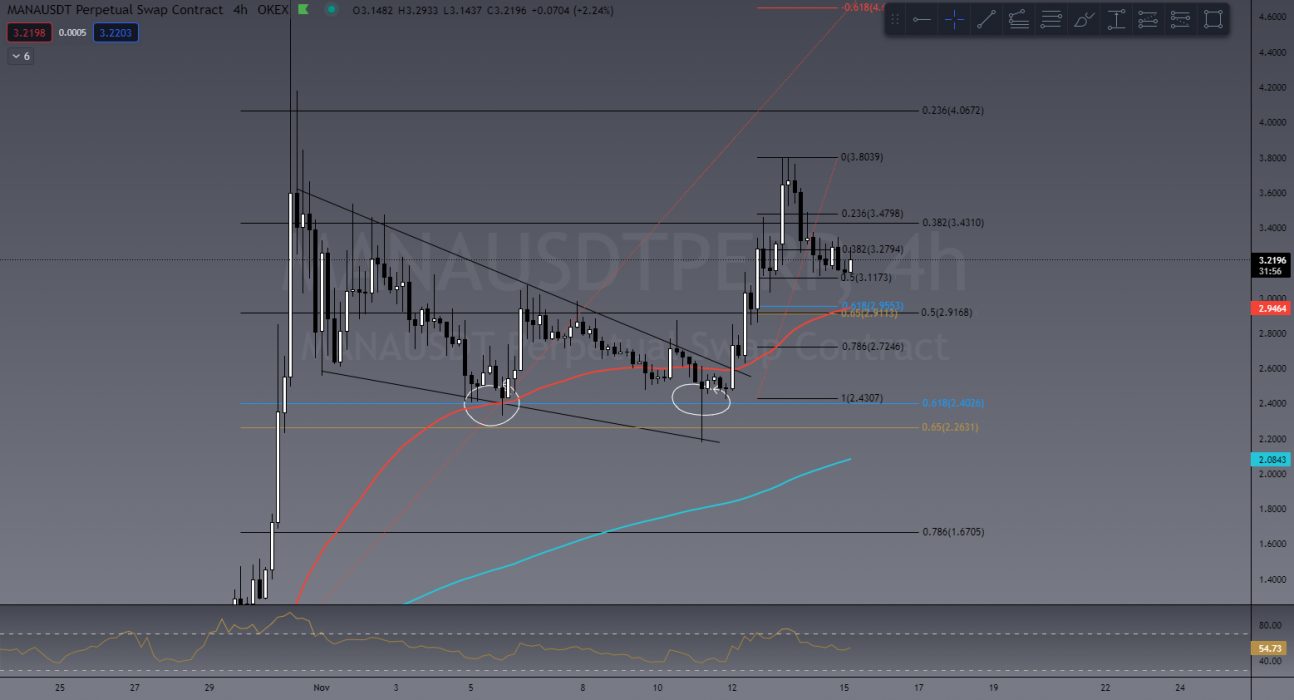
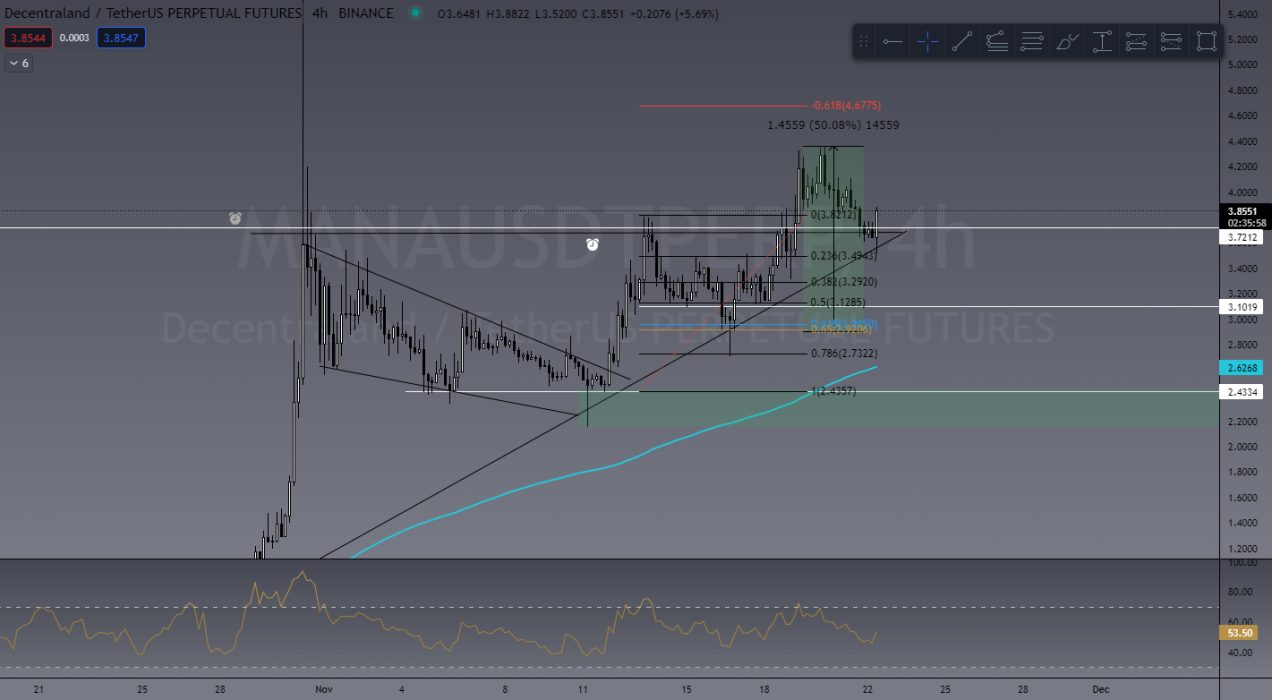
MANA has again made the list this week for top performers. In the TradeRoom, these metaverse tokens have been going crazy despite BTC itself seeing bearish action. In last week’s article I mentioned MANA would likely see a pullback into that 61.8% Fib level, which it did before a continuation up. It performed perfectly with a price increase of 50%.

MANA/USDT chart from last week’s article
Current MANA/USDT Chart


ENJ/USDT

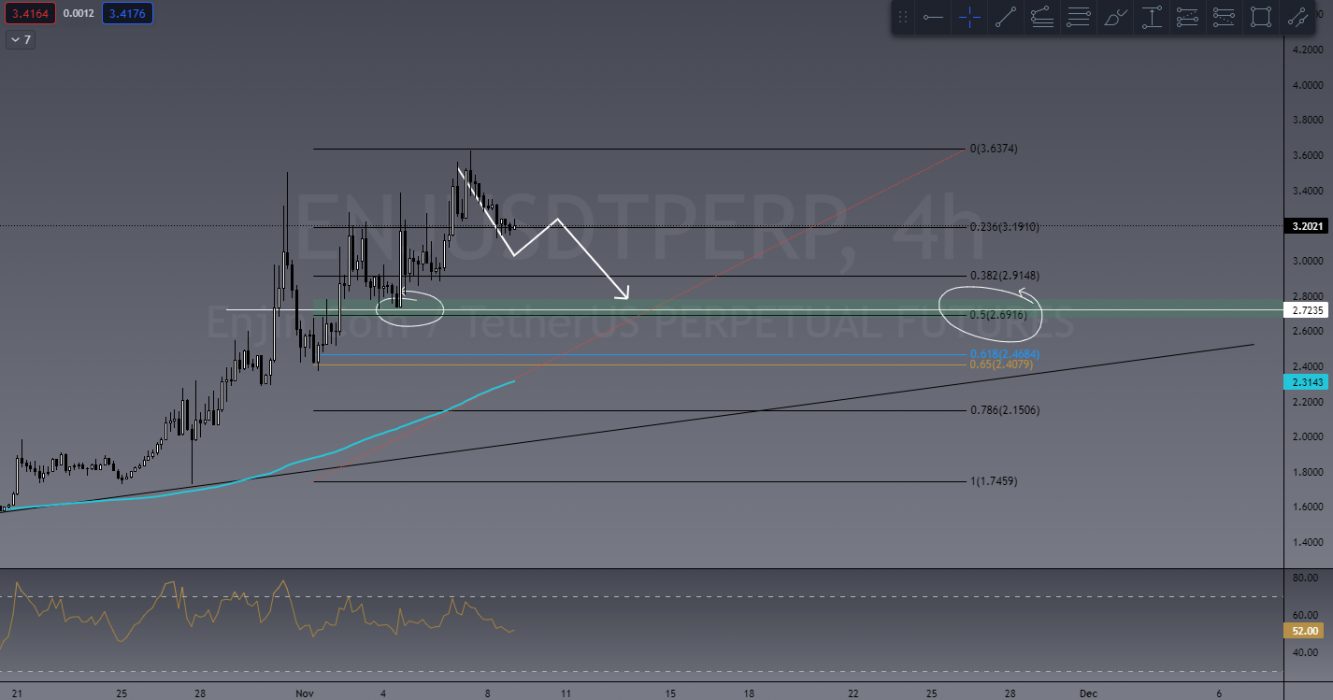
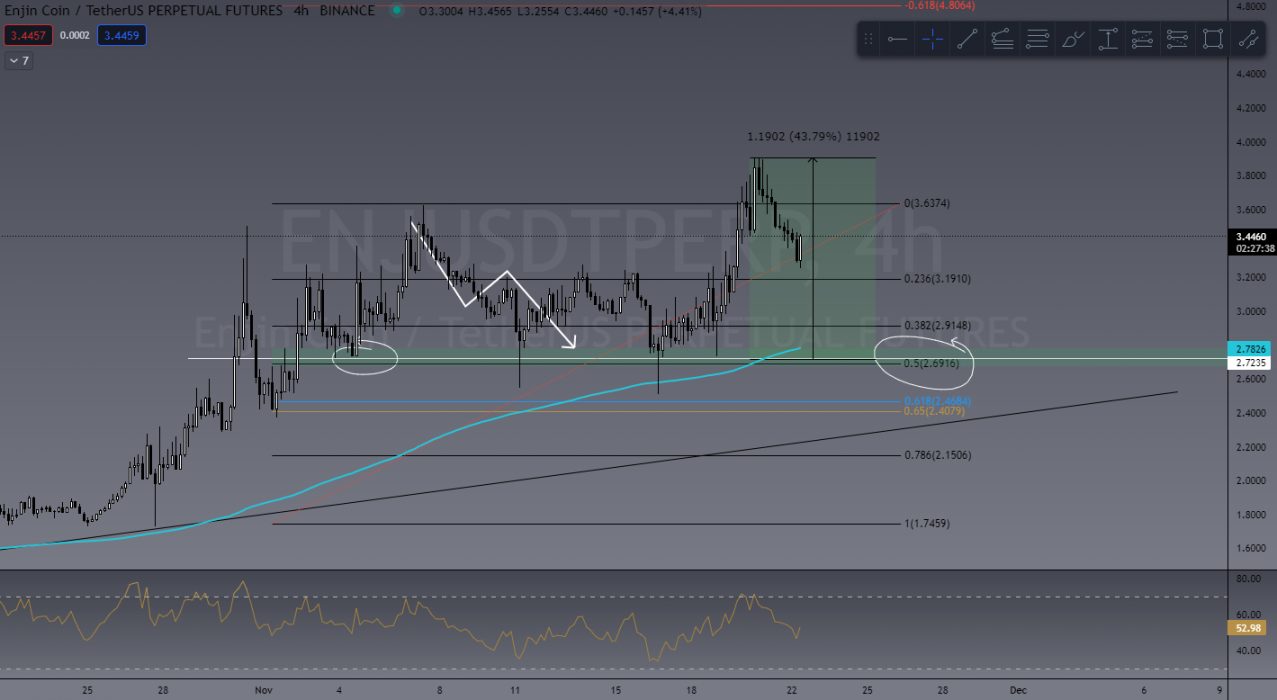
Another metaverse coin that performed well last week was Enjin: a nice clean pullback to a solid support level and the 50 Fib, and away she went with a nice 43% rise.

ENJ/USDT chart shared in our TradeRoom
ENJ/USDT Chart currently

This Week’s Trades

AXS/USDT

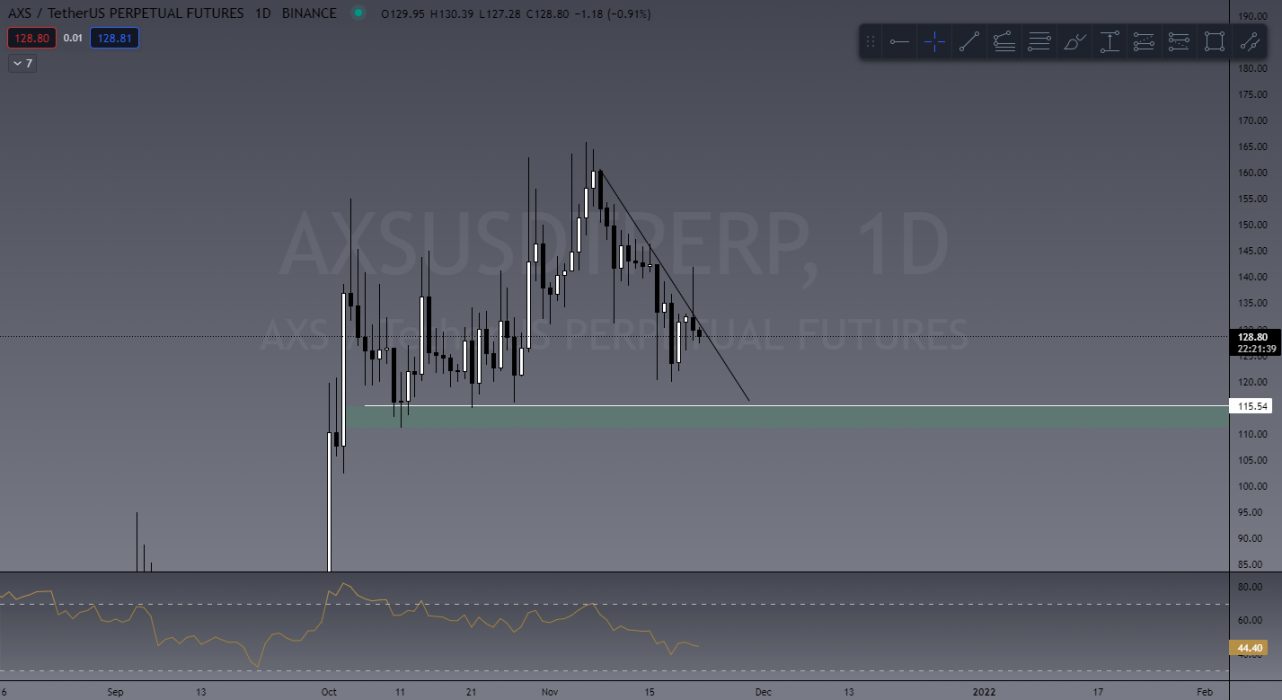
Sticking with the metaverse theme this week, we can’t go past AXS. Hoping to see a pullback to a good buy zone at the US$115 mark, where I’ll be looking for entries. If AXS continues to perform well with the BTC drops, who knows how high this beast can go?

AXS/USDT

SAND/USDT

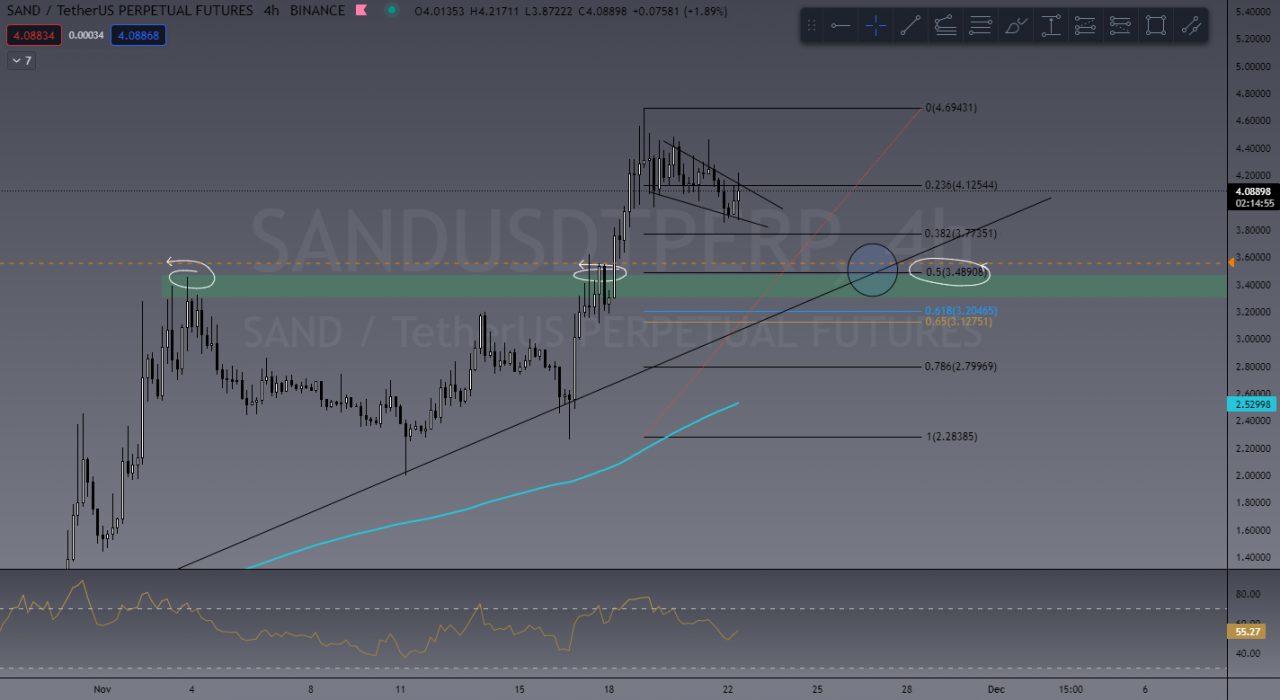
Again with the MV coins I know but hey, profit is profit. SAND is currently looking to be forming a bit of a bull pennant, however I’m personally hoping to see a bigger pullback into a healthier buy zone at around the US$3.48 area. Why? Well, it’s a good test on what will be a new level of support, test on current uptrend and the 50% Fib retrace.

LRC/USDT

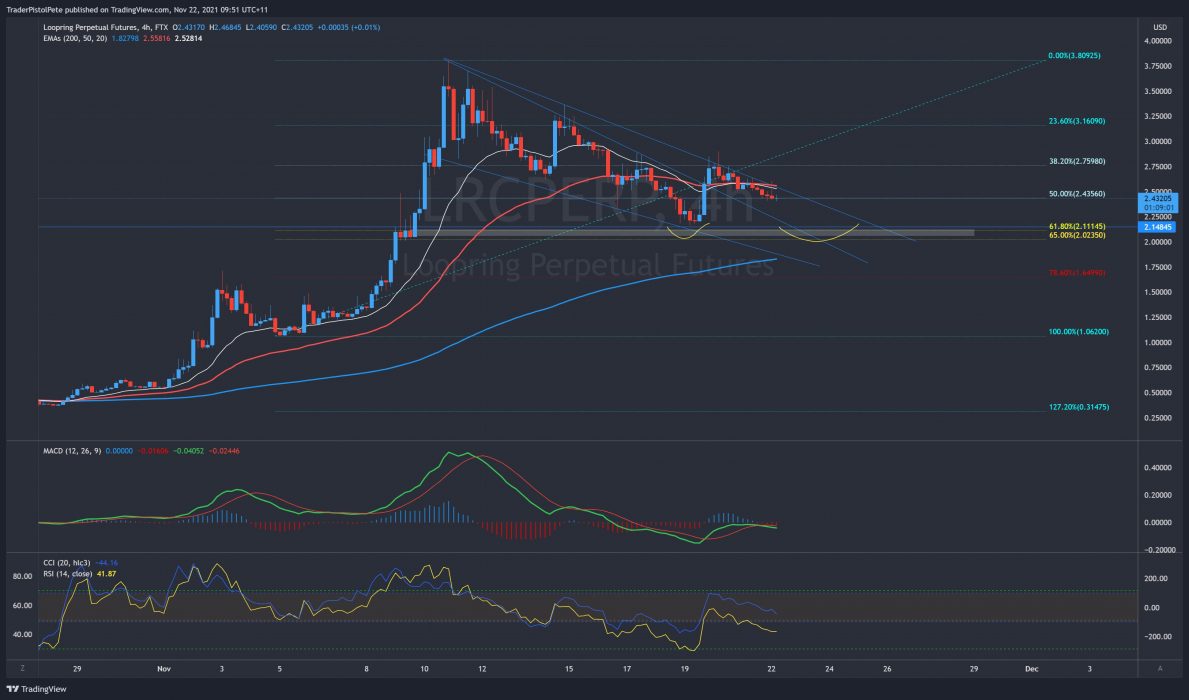
LRC is showing a really good pullback into a buy zone. In a chart posted in the TradeRoom by one of our team leaders, Pete, this morning you could see the buy zone clearly displayed in the 61.8% Fib level, which again is a common retracement level and Pete has also drawn a bullflag, which is a strong bullish continuation pattern. Target is US$2.10.

Pete’s LRC/USDT chart

Invite to Join our TradeRoom

If you’d like to become a better trader, you’re invited to join our TradeRoom where we share daily charts and market analysis. In our community we strongly encourage and teach correct risk management strategies to keep our members safe in this new volatile crypto market.

TCD’s TradeRoom

The Crypto Den was created in 2017 to help the rapidly growing crypto community learn and understand the fundamentals of digital currencies and how to trade them. 

Since then we have taught thousands of members the basics of technical analysis and trading strategies to further progress and perfect their trading abilities.

In the TradeRoom you will be included in a supportive environment which encourages personal growth, education and community support.

It’s a place to share your trading ideas and follow other experienced traders’ feeds to help keep your finger on the pulse of such a volatile market!