Categories
Market Analysis The Crypto Den

TradeRoom: Our Weekly Crypto Trades Analysis – Dec 27, 2021

Welcome to this weekly series from the TradeRoom. My name is Dave and I’m the founder of The Crypto Den, an Australian-based crypto trading and education community aiming to give you the knowledge to take your trading game to the next level.

Crypto Market Outlook

Merry Christmas everyone! I hope you all took some time away from the charts and crypto to spend it with loved ones!

In last week’s article I mentioned that the TOTAL crypto cap needed to hold on that daily 200 EMA, which it did and then continued to break out from its new downtrend. It’s currently finding resistance at US$2.4 trillion.
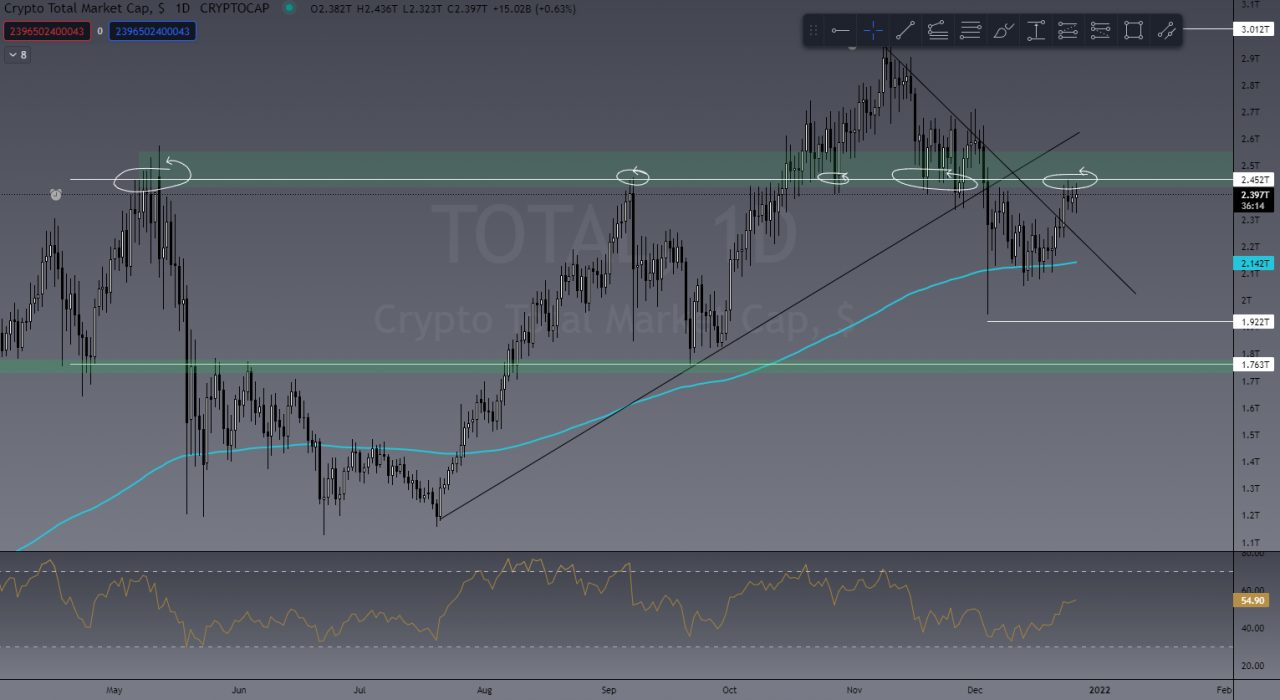
TOTAL Crypto Market cap

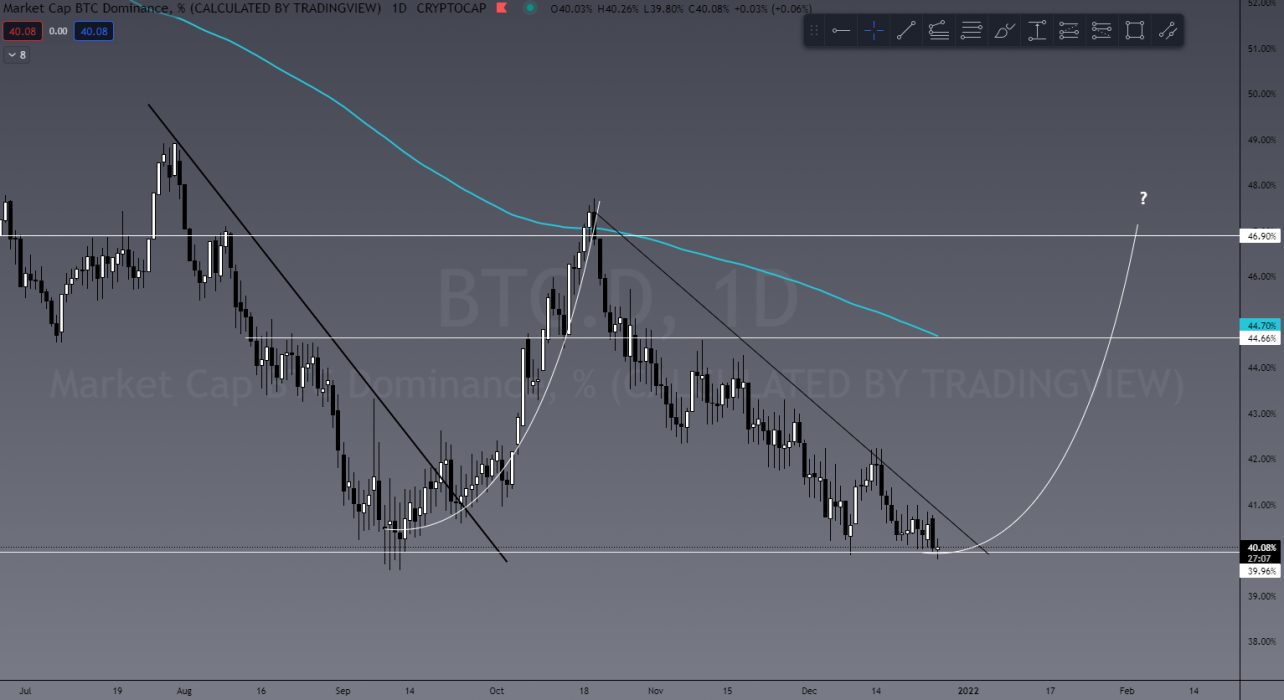
The TOTAL2 (ALTcoin market) has broken its US$1.4 trillion resistance, while the BTC.D (% of BTC dominance over the market) has dropped again significantly, underlining the fact that the capital flow has been in ALTS.

Something to note at this point is that BTC.D is now at a support level and could see a reversal, meaning capital flow will leave ALTS and go back into BTC.
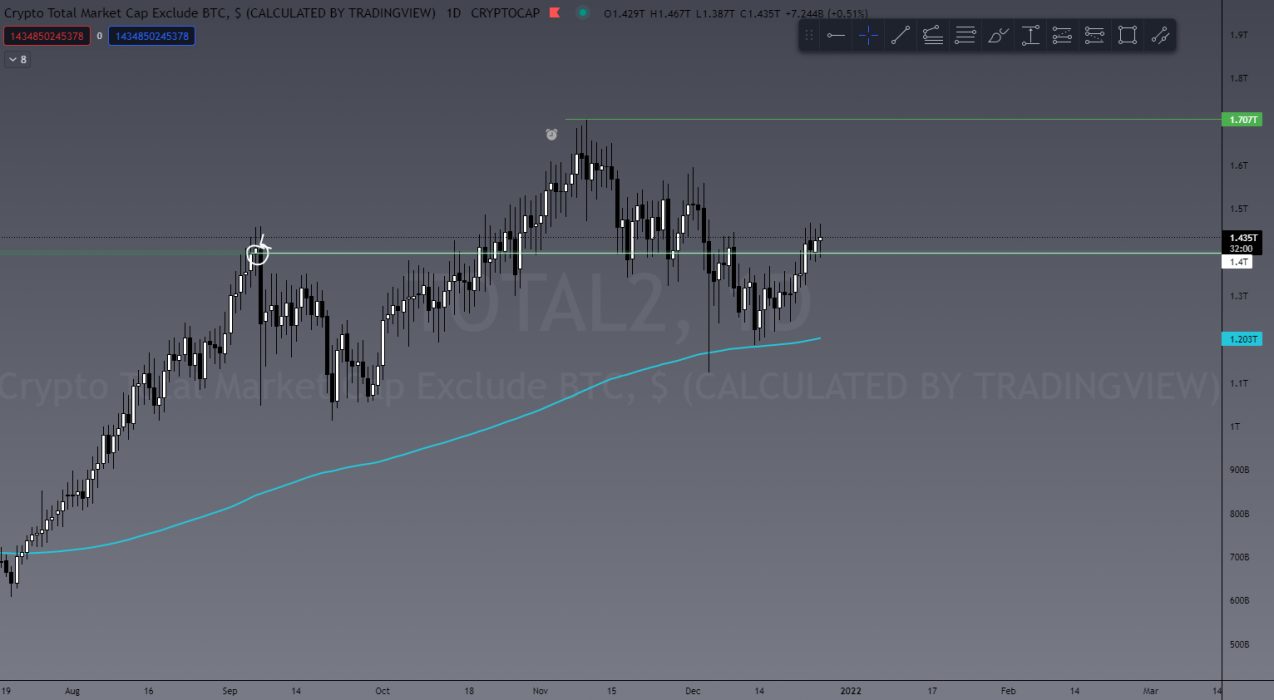
TOTAL2 (ALTcoin market cap)
BTC.D Chart

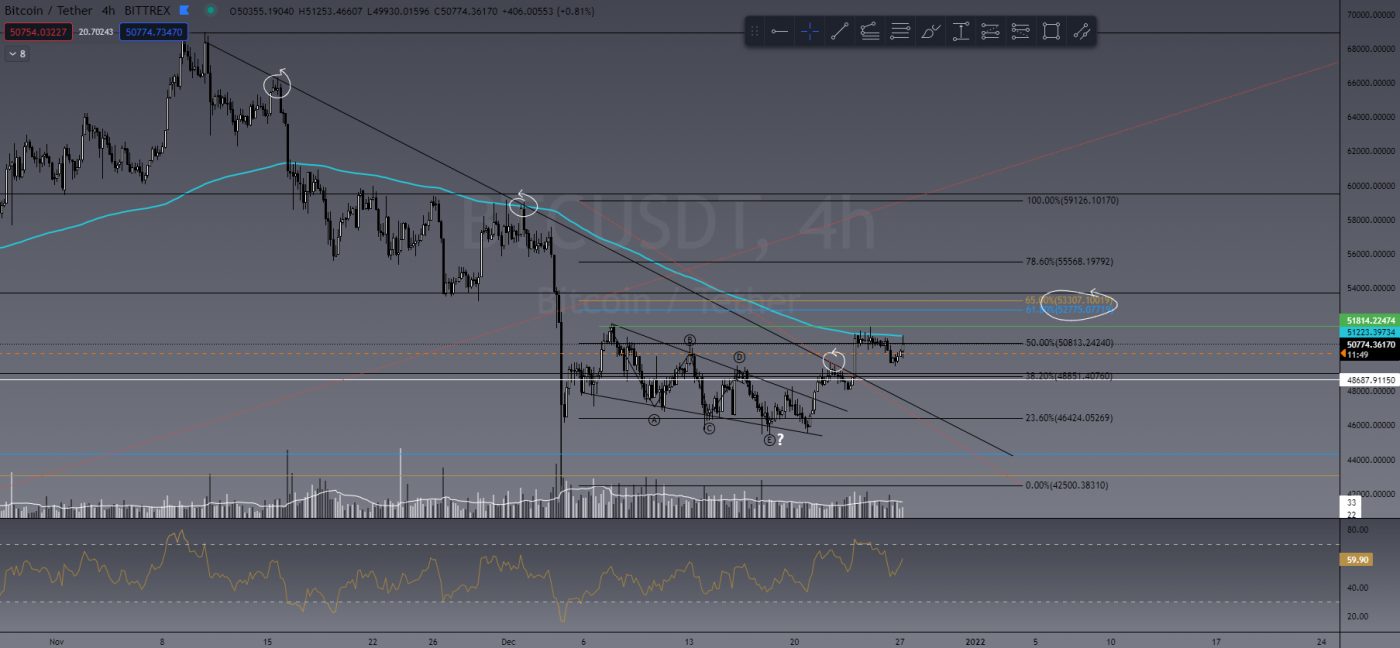
What plays well with this possibility is that BTC seems to have broken out of the current local downtrend and performed a support/resistance flip on the 4H chart, and is currently being snagged on that daily 200EMA. Breaking through this level around US$51,800 will help confirm a bullish bias for me. The last thing we’d need to see is a clear and strong breach of the 618 retrace (Fibonacci level) of the US$52,000 – US$53,000 zone WITH VOLUME. Failing that, I see another test of US$45,000.
BTC/USDT

Last Week’s Performance

BTC/USDT

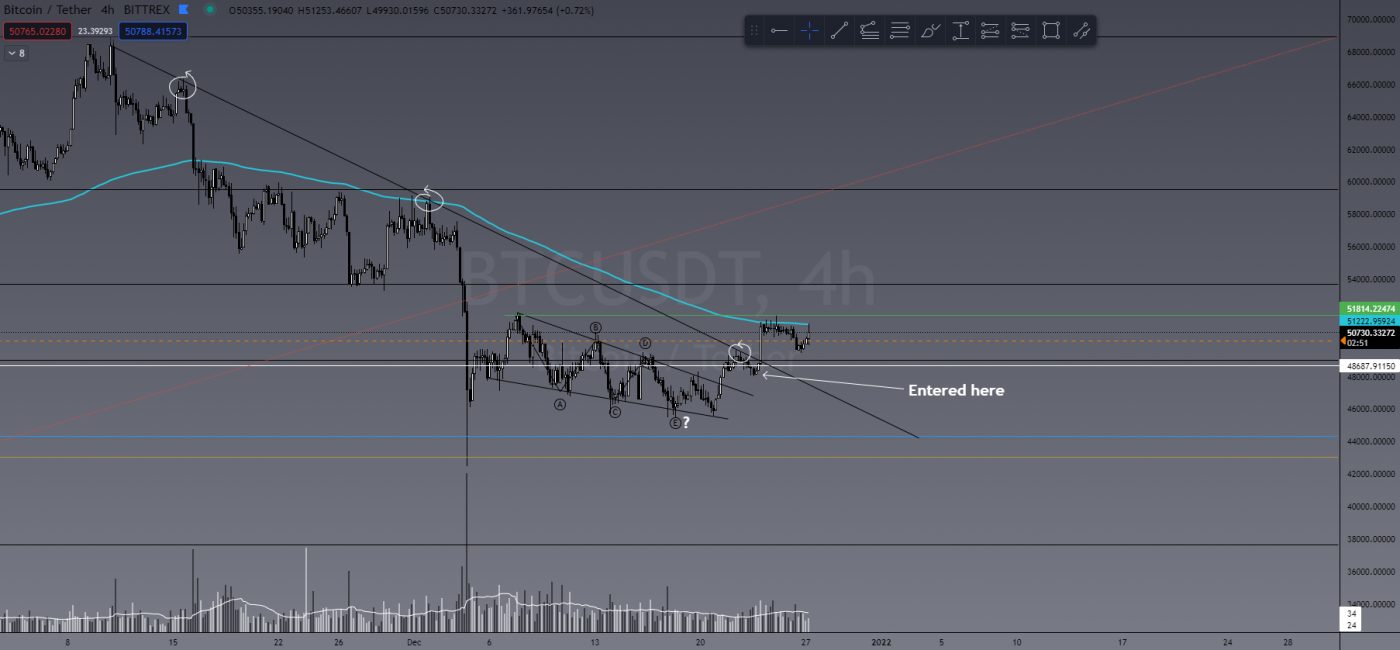
Following my short trade on BTC I wrote about last week, I’m now in a BTC long trade and currently sitting at around 100%. I waited for the breakout of the falling wedge and a retest of support before entering. Not a massive trade just yet, but waiting for confirmation is always the safest trade to take.
BTC/USDT

SHIB/USDT

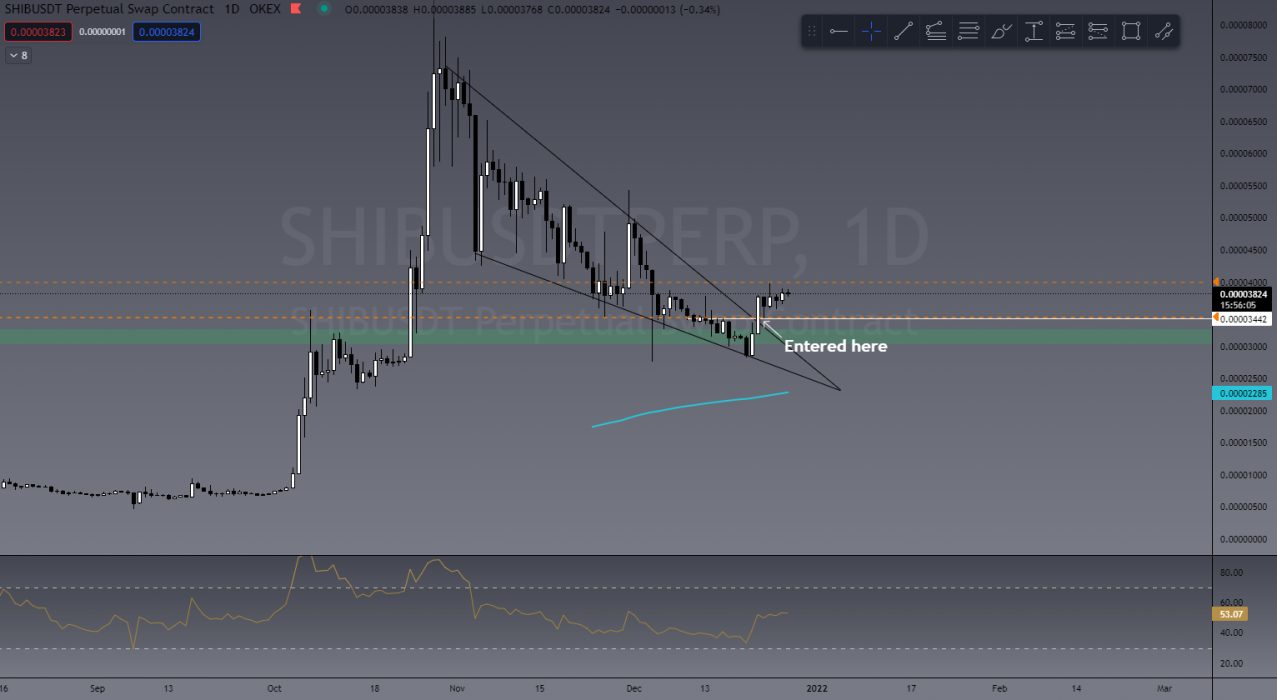
It almost hurts me to even write this but traders see opportunity in anything – even overhyped, high supply coins. SHIB, for example, broke out of a falling wedge that started at the beginning of November. With the hype around this coin lining up with the technicals, it was a no-brainer entry. Although I didn’t enter on the initial pump, I waited for the safest entry. Price action broke out and then tested new support, which is where I entered my longs. This thing has crazy volatility, so it’s likely a riskier trade than most.
SHIB/USDT

NEO/USDT

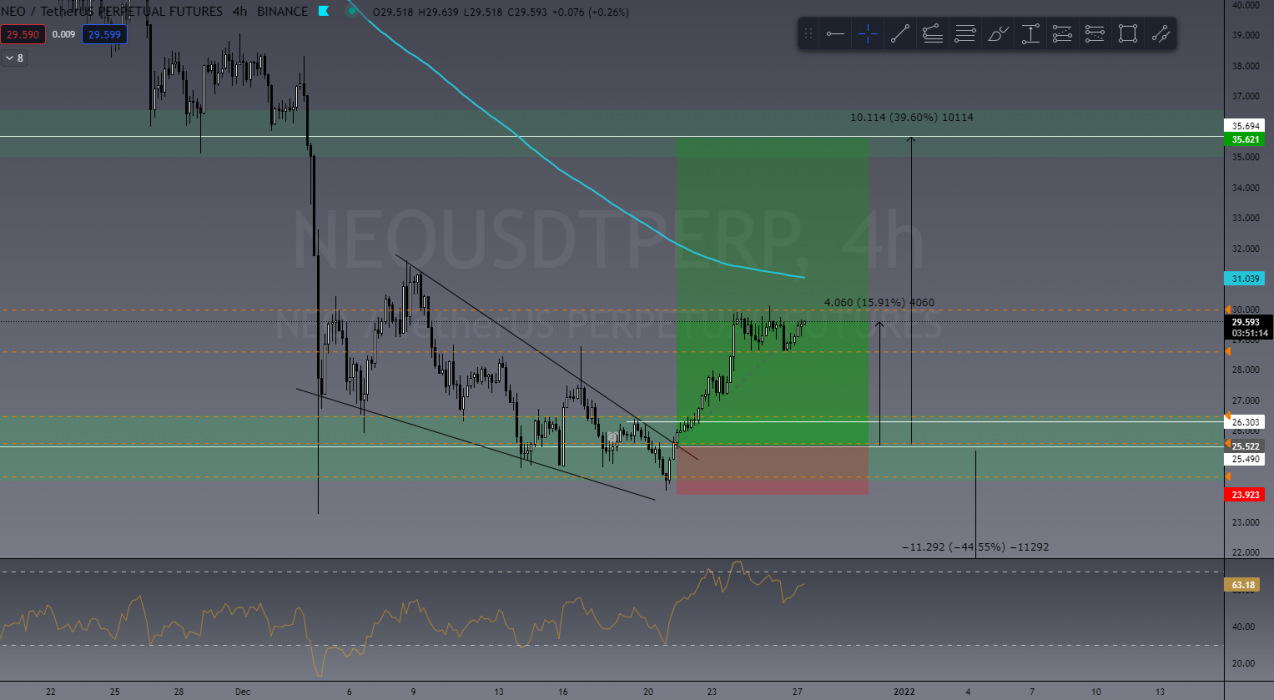
I took the NEO long that I also mentioned in last week’s article. I got the hammer and bullish engulfing I was hoping to see and entered on the breakout. It’s currently up 120% and I’m looking for that to double if BTC sees some bullish PA (price action).
NEO/USDT

SOL/USDT

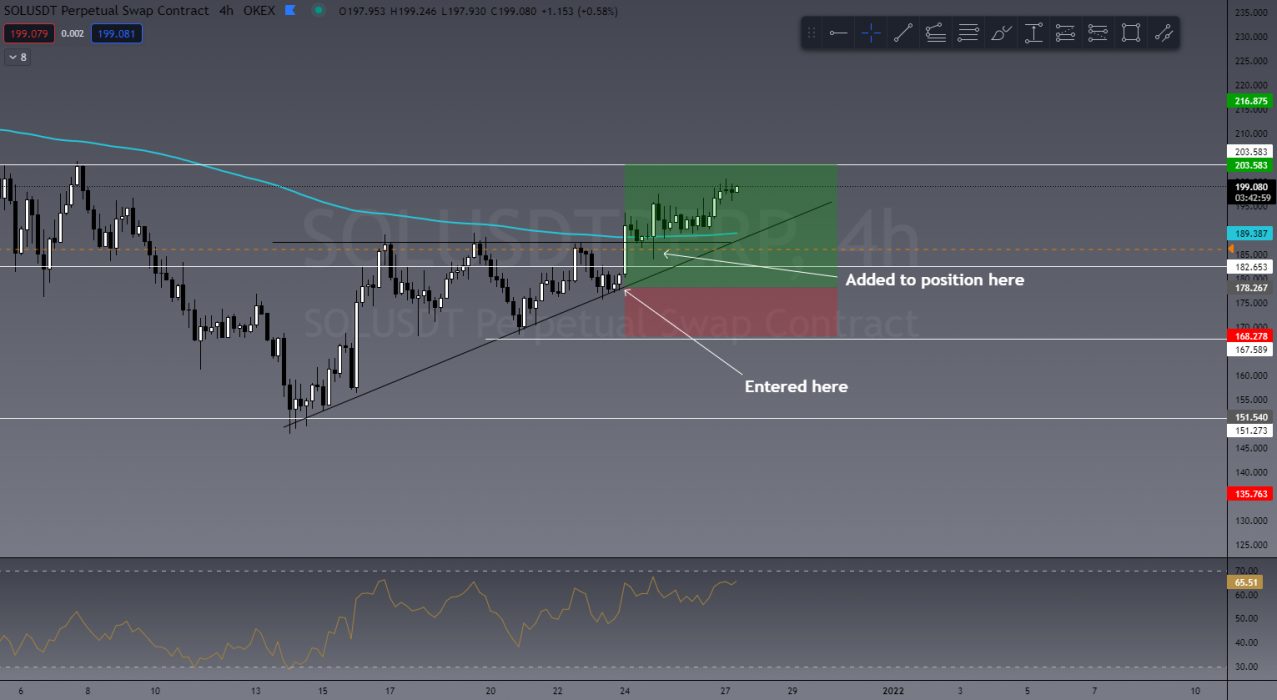
One of my favourites to trade is SOL. Finding a bounce off trend forming ascending triangle (3 touch rule), I decided to enter. I added to my position after the triangle break and retest (we teach how to trade these patterns in our Trading Fundamentals course). Trade is still active, currently up 179%.
SOL/USDT

This Week’s Trades

FIL/USDT

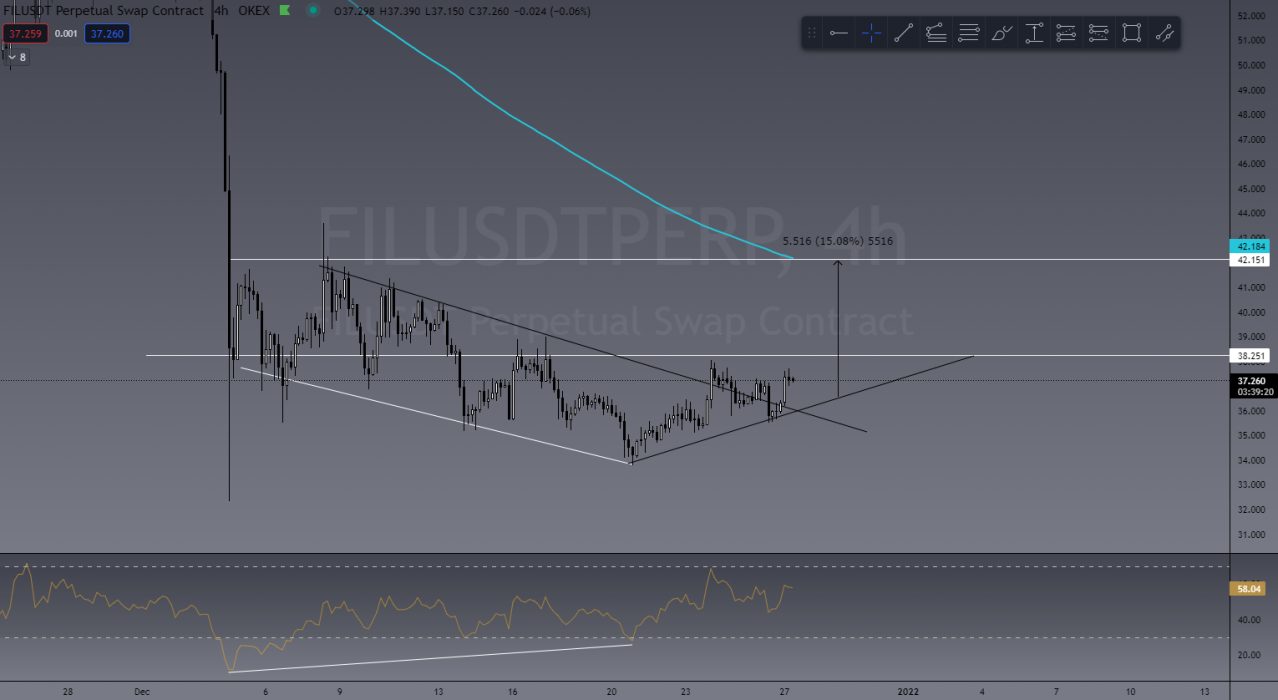
I’m currently watching FIL because it hasn’t yet reacted to the market the way many other ALTs have. I’m seeing a really large bullish divergence and a downtrend break. What I’m waiting to see is a break and test of US$38.00, or a retest on trend for an entry.
FIL/USDT

MANA/USDT

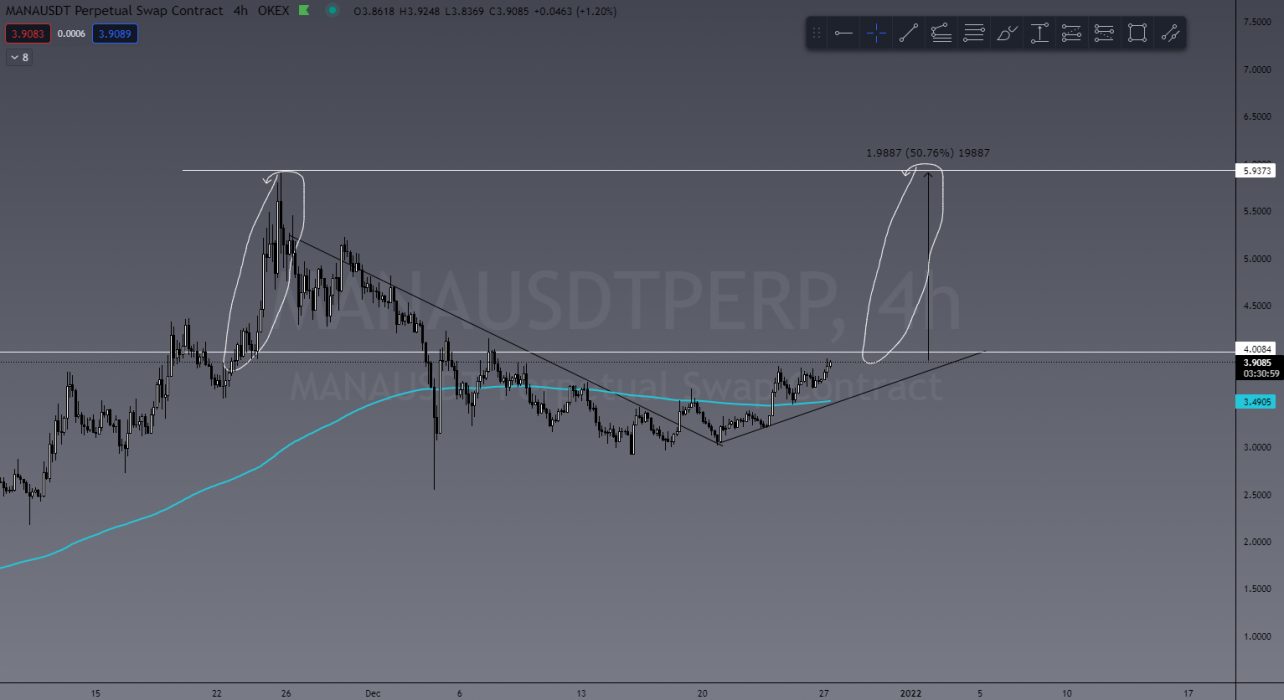
I’m actually already in a MANA trade and wanted to add this to the list due to its crazy potential. If this US$4.00 resistance breaks, I see potential here for MANA to do 50% or more.
MANA/USDT

Invite to Join our TradeRoom

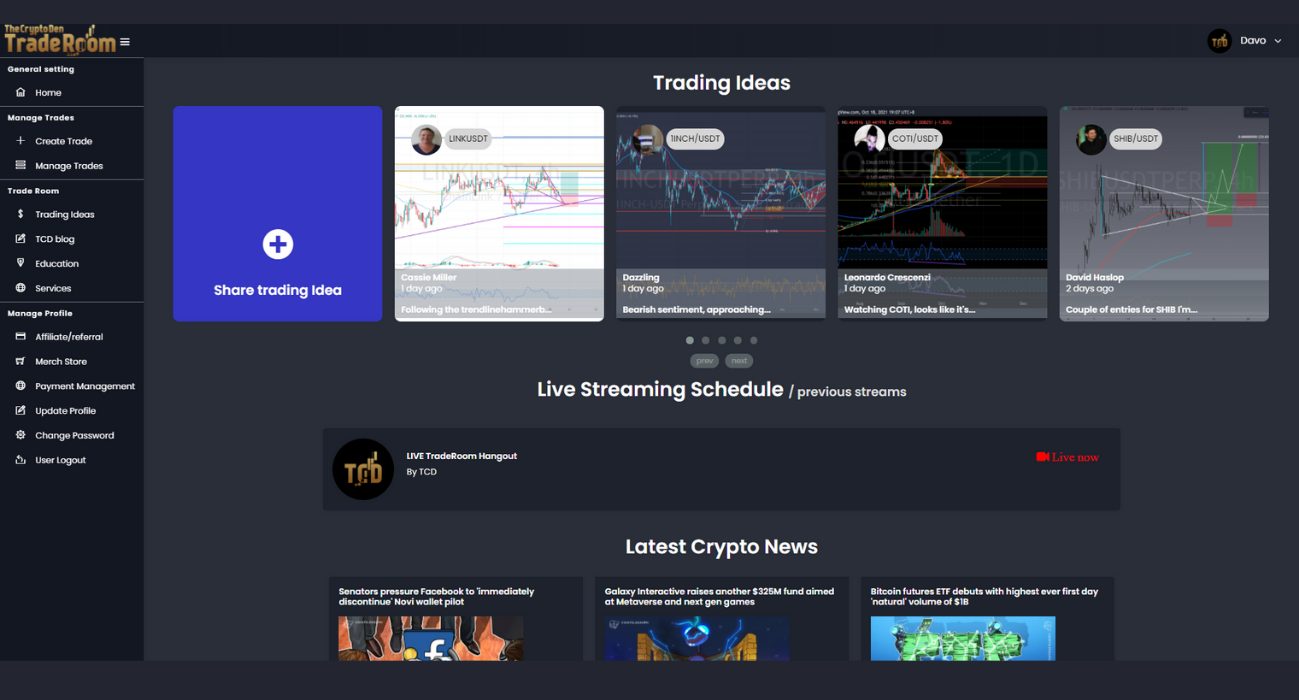
If you’d like to become a better trader, you’re invited to join our TradeRoom where we share daily charts and market analysis. In our community we strongly encourage and teach correct risk management strategies to keep our members safe in this new volatile crypto market.
Join our “Apprentice” plan now for your 7-day trial.

The Crypto Den was created in 2017 to help the rapidly growing crypto community learn and understand the fundamentals of digital currencies and how to trade them. 

Since then we have taught thousands of members the basics of technical analysis and trading strategies to further progress and perfect their trading abilities.

In the TradeRoom you will be included in a supportive environment which encourages personal growth, education and community support.

It’s a place to share your trading ideas and follow other experienced traders’ feeds to help keep your finger on the pulse of such a volatile market!

Categories
Market Analysis The Crypto Den

TradeRoom: Our Weekly Crypto Trades Analysis – Nov 22, 2021

Welcome to this weekly series from the TradeRoom. My name is Dave and I’m the founder of The Crypto Den, an Australian-based crypto trading and education community aiming to give you the knowledge to take your trading game to the next level.

Crypto Market Outlook

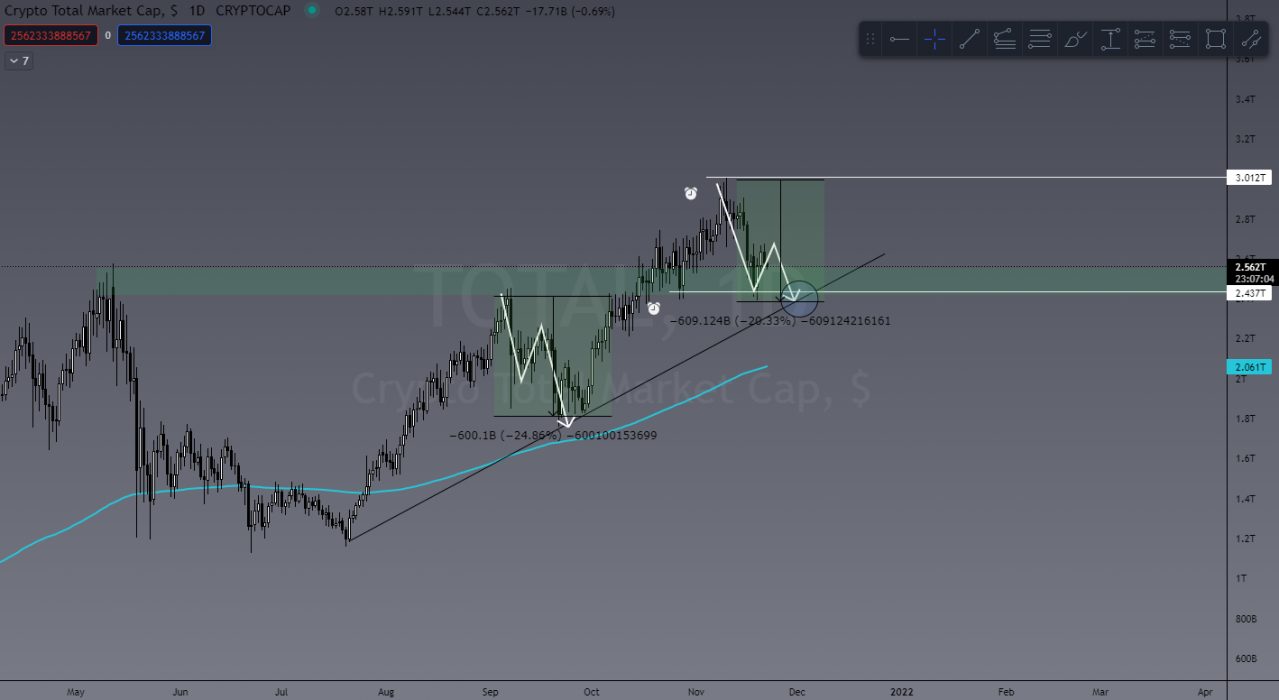
The crypto markets took a pretty decent hit after a US$500 billion sell-off in the past week. If you’re one of those people I’m seeing across all socials freaking out about this, DON’T STRESS!
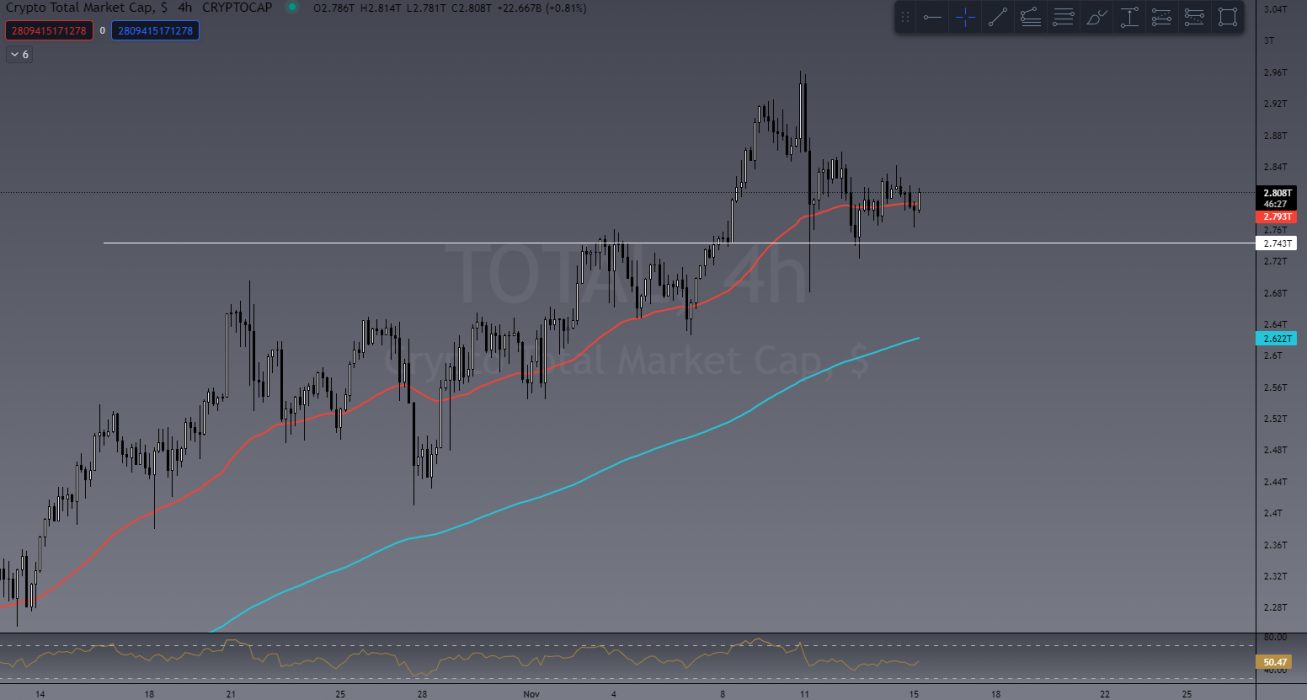
You can see in the TOTAL chart below that the entire crypto cap took a US$600 billion hit back in September and recovered quite well. At this point I’m expecting the same to happen again.

TOTAL Crypto market cap

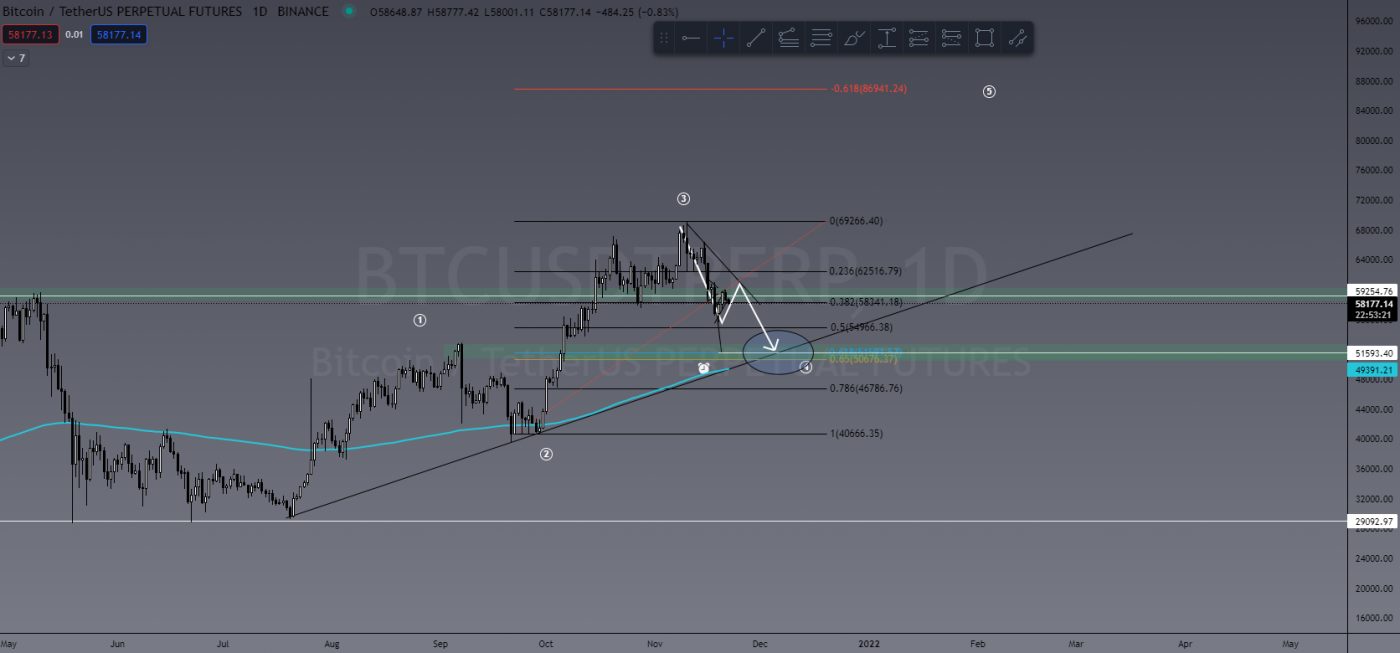
Looking at Bitcoin, we are seeing a bit of Elliott Wave Theory in play here. For those who don’t know what that is, it’s essentially investor psychology and sentiment presented as recurring patterns in the market – a 5 wave pattern, 3 waves up (impulse waves) and 2 waves down (corrective waves).

BTC is currently in the middle of wave 4 having a small bounce on the 50% Fibonacci level. We are expecting to to see further downside to a level of confluence between the current uptrend, 61.8% Fibonacci level and daily support level at US$51,500. All of which supports the Elliott Wave Theory.

BTC/USDT

Keep in mind wave 4 is a corrective wave. So this doesn’t mean doom and gloom. It would indicate BTC is simply having a healthy correction before the next leg up. I stand by our initial targets of US$78,000 as target 1 and US$87,000 as target 2.


Last Week’s Performance

MANA/USDT

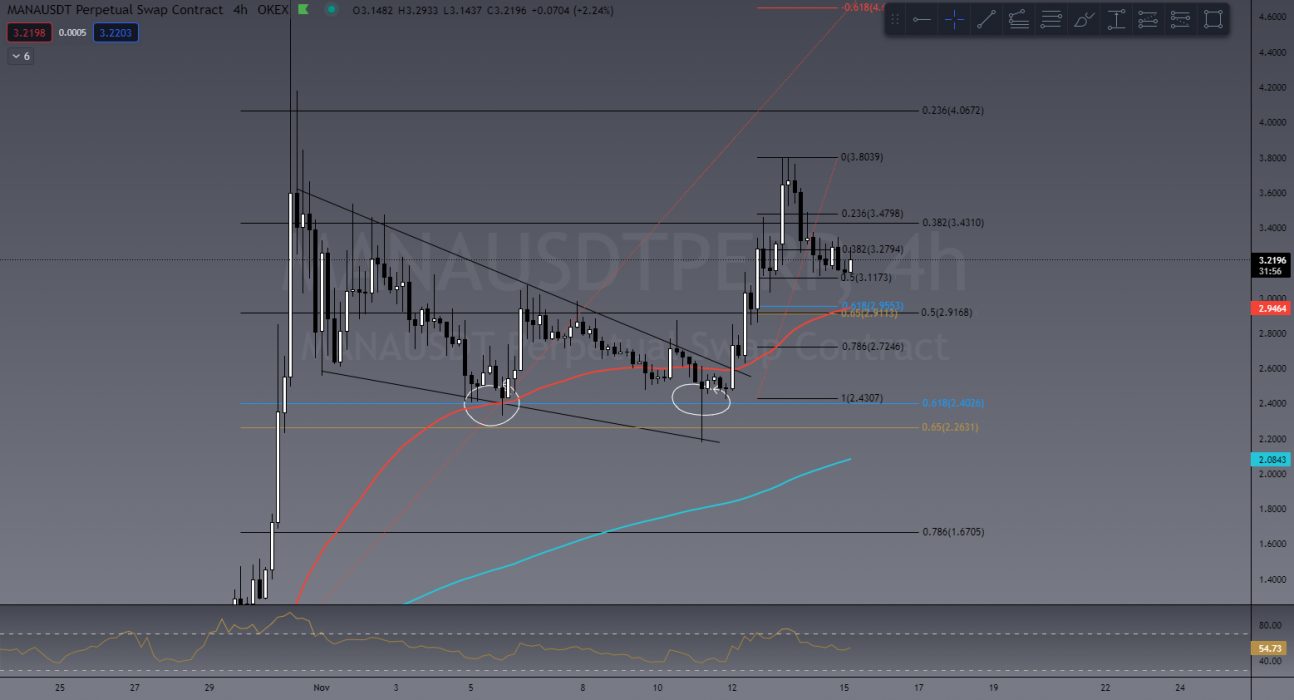
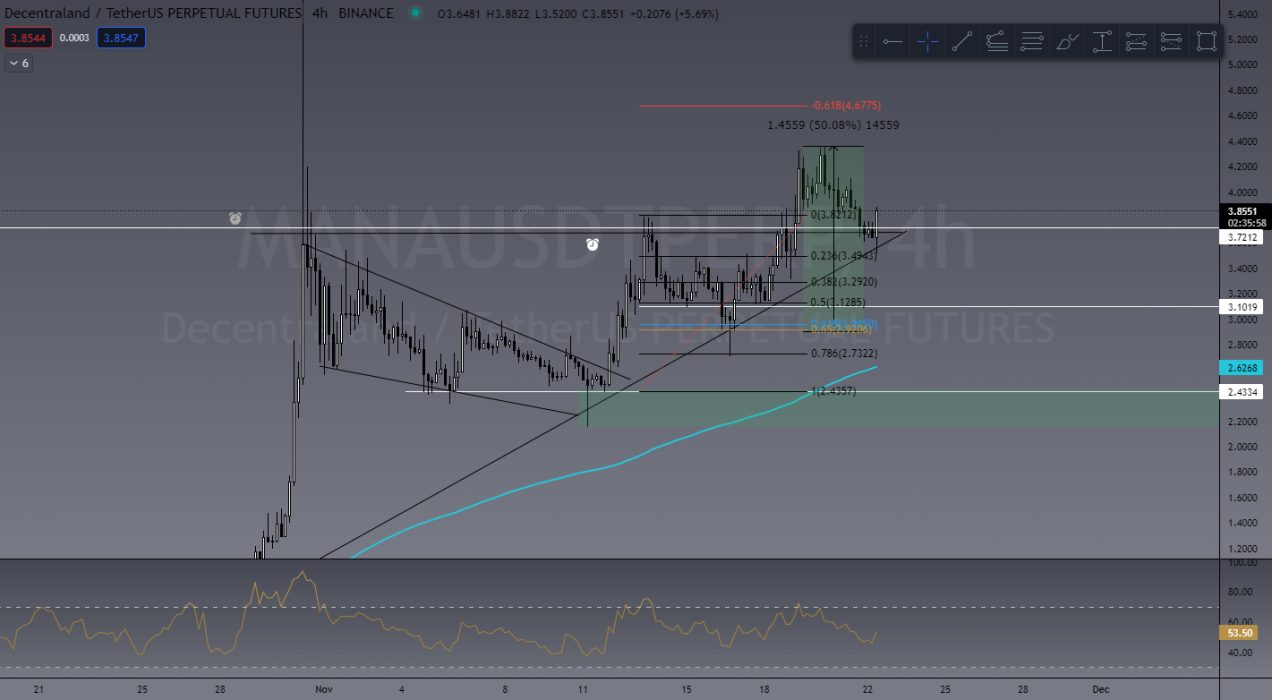
MANA has again made the list this week for top performers. In the TradeRoom, these metaverse tokens have been going crazy despite BTC itself seeing bearish action. In last week’s article I mentioned MANA would likely see a pullback into that 61.8% Fib level, which it did before a continuation up. It performed perfectly with a price increase of 50%.

MANA/USDT chart from last week’s article
Current MANA/USDT Chart


ENJ/USDT

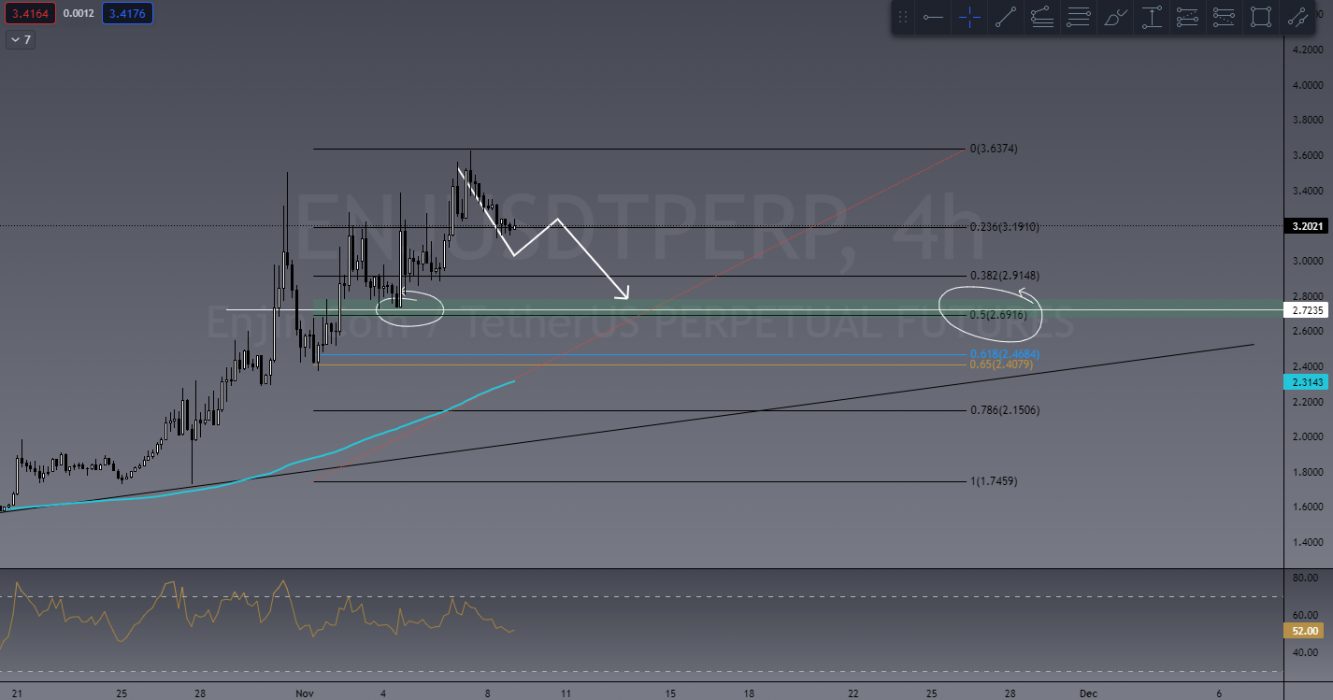
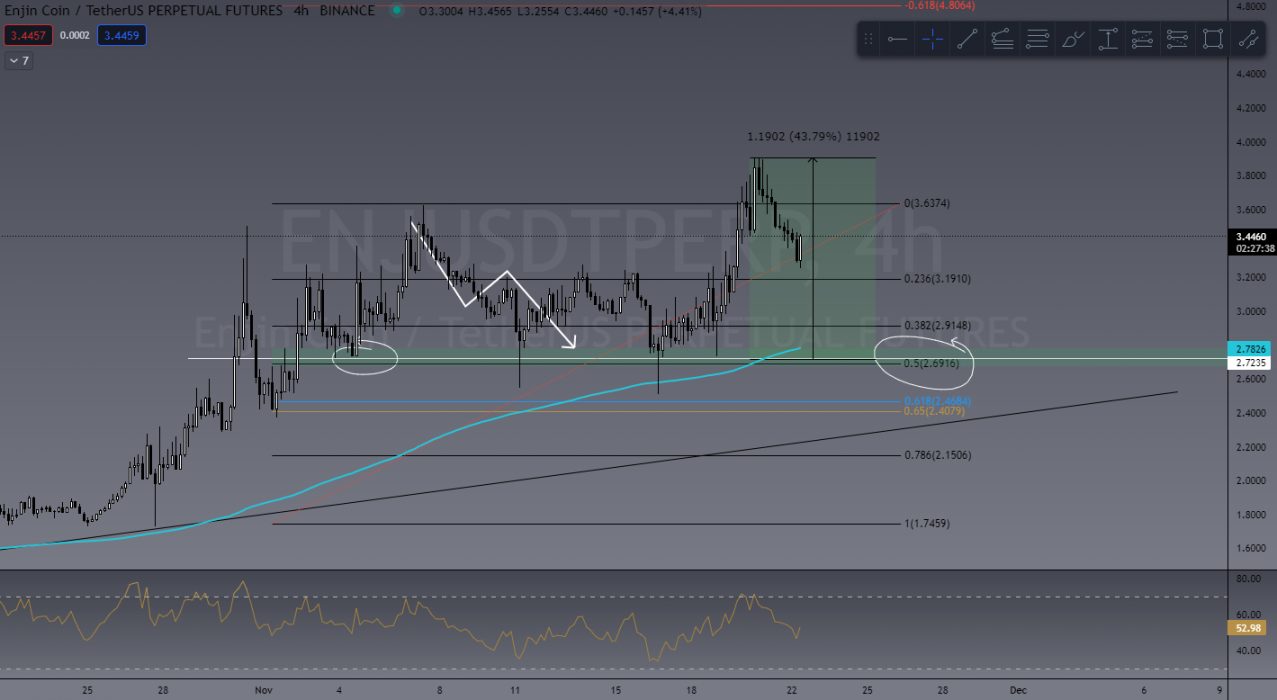
Another metaverse coin that performed well last week was Enjin: a nice clean pullback to a solid support level and the 50 Fib, and away she went with a nice 43% rise.

ENJ/USDT chart shared in our TradeRoom
ENJ/USDT Chart currently

This Week’s Trades

AXS/USDT

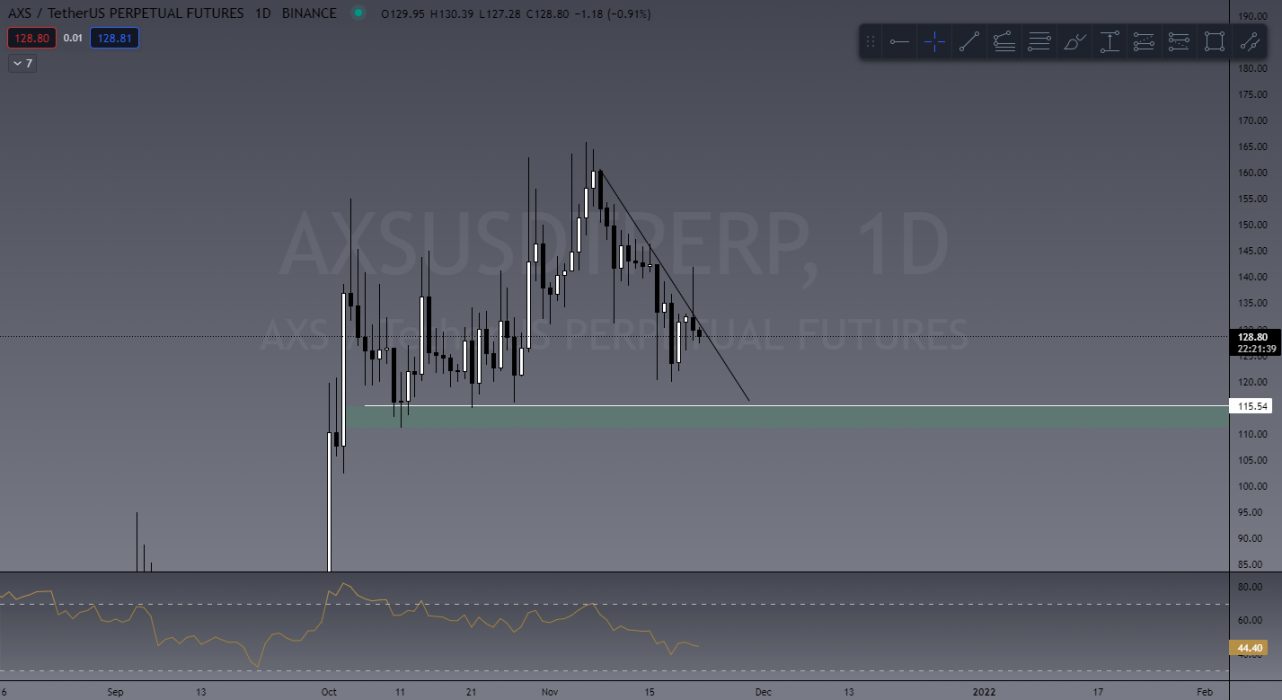
Sticking with the metaverse theme this week, we can’t go past AXS. Hoping to see a pullback to a good buy zone at the US$115 mark, where I’ll be looking for entries. If AXS continues to perform well with the BTC drops, who knows how high this beast can go?

AXS/USDT

SAND/USDT

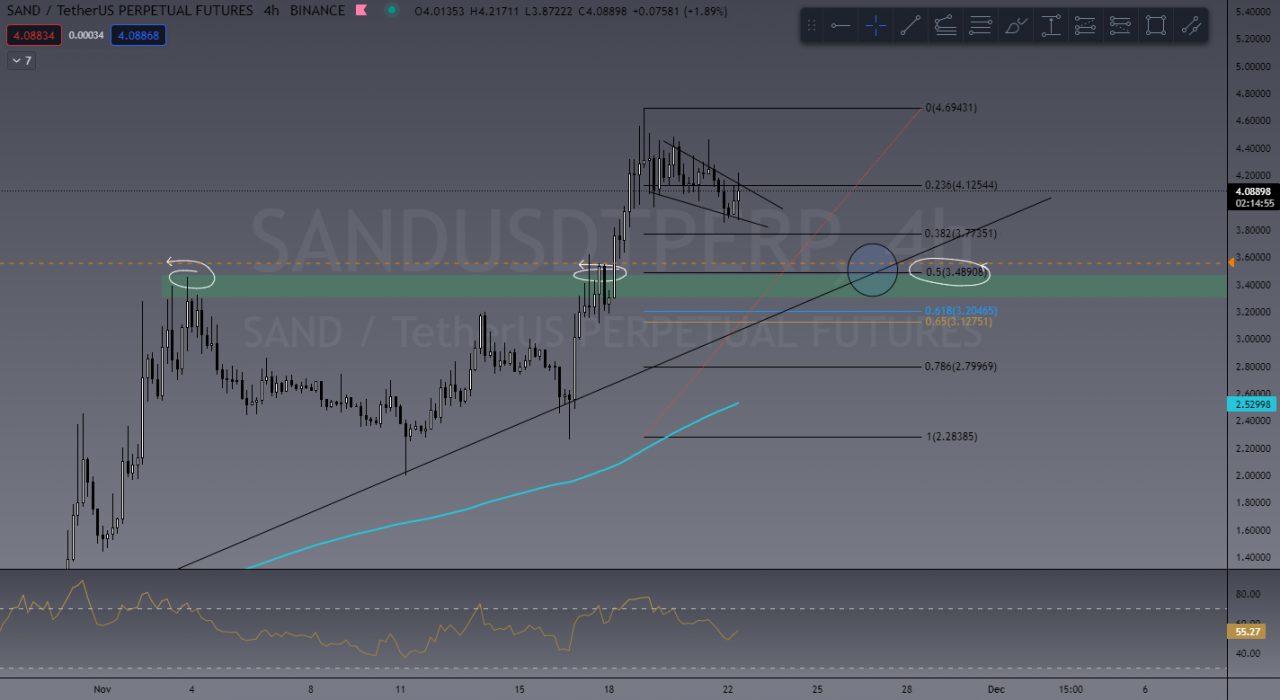
Again with the MV coins I know but hey, profit is profit. SAND is currently looking to be forming a bit of a bull pennant, however I’m personally hoping to see a bigger pullback into a healthier buy zone at around the US$3.48 area. Why? Well, it’s a good test on what will be a new level of support, test on current uptrend and the 50% Fib retrace.

LRC/USDT

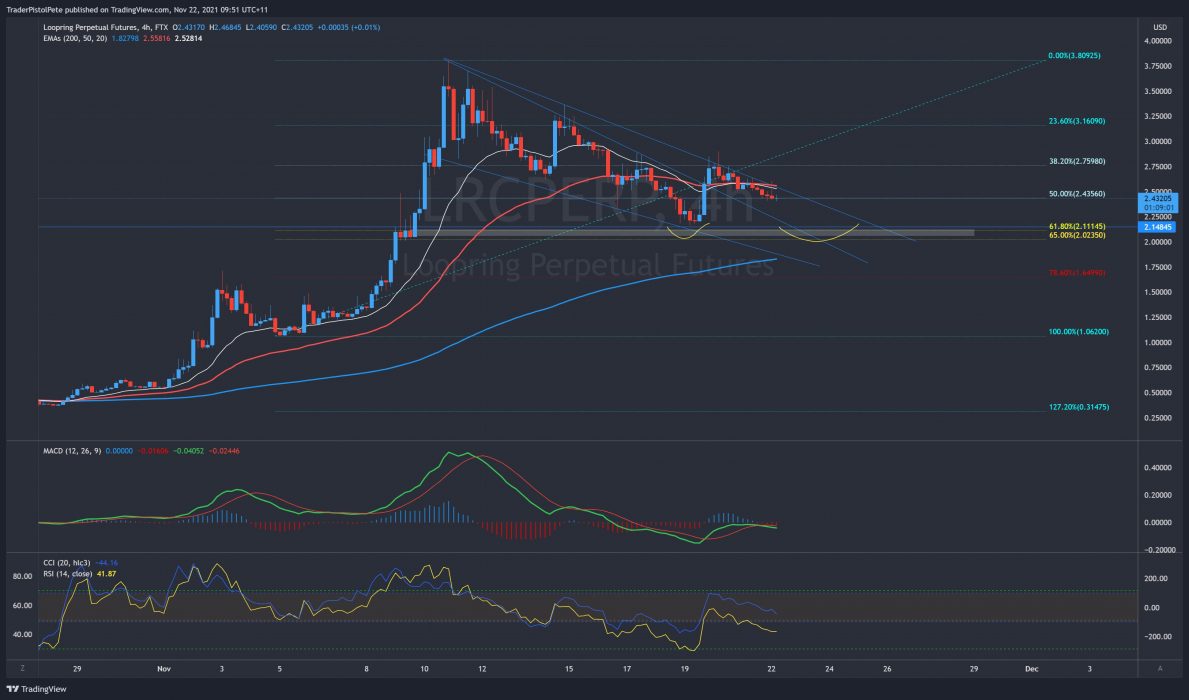
LRC is showing a really good pullback into a buy zone. In a chart posted in the TradeRoom by one of our team leaders, Pete, this morning you could see the buy zone clearly displayed in the 61.8% Fib level, which again is a common retracement level and Pete has also drawn a bullflag, which is a strong bullish continuation pattern. Target is US$2.10.

Pete’s LRC/USDT chart

Invite to Join our TradeRoom

If you’d like to become a better trader, you’re invited to join our TradeRoom where we share daily charts and market analysis. In our community we strongly encourage and teach correct risk management strategies to keep our members safe in this new volatile crypto market.

TCD’s TradeRoom

The Crypto Den was created in 2017 to help the rapidly growing crypto community learn and understand the fundamentals of digital currencies and how to trade them. 

Since then we have taught thousands of members the basics of technical analysis and trading strategies to further progress and perfect their trading abilities.

In the TradeRoom you will be included in a supportive environment which encourages personal growth, education and community support.

It’s a place to share your trading ideas and follow other experienced traders’ feeds to help keep your finger on the pulse of such a volatile market!

Categories
Events Market Analysis The Crypto Den

TradeRoom: Our Weekly Crypto Trades Analysis – Nov 15, 2021

Welcome to this weekly series from the TradeRoom. My name is Dave and I’m the founder of The Crypto Den, an Australian-based crypto trading and education community aiming to give you the knowledge to take your trading game to the next level.

Learn from the experts! Live Trading Course by The Crypto Den starts tonight at 7pm AEST! Register for the Live Trading Sessions

Crypto Market Outlook

We’ve seen a bit of a pullback in price action in the market over the past four days, which isn’t a bad thing. Last week the total crypto market cap reached US$3 trillion for the first time in history and has since pulled back to the US$2.7 trillion mark, which could be seen as a new level of “Support”. It’s currently sitting at US$2.8 trillion.

Total market cap sitting at US$2.8 trillion

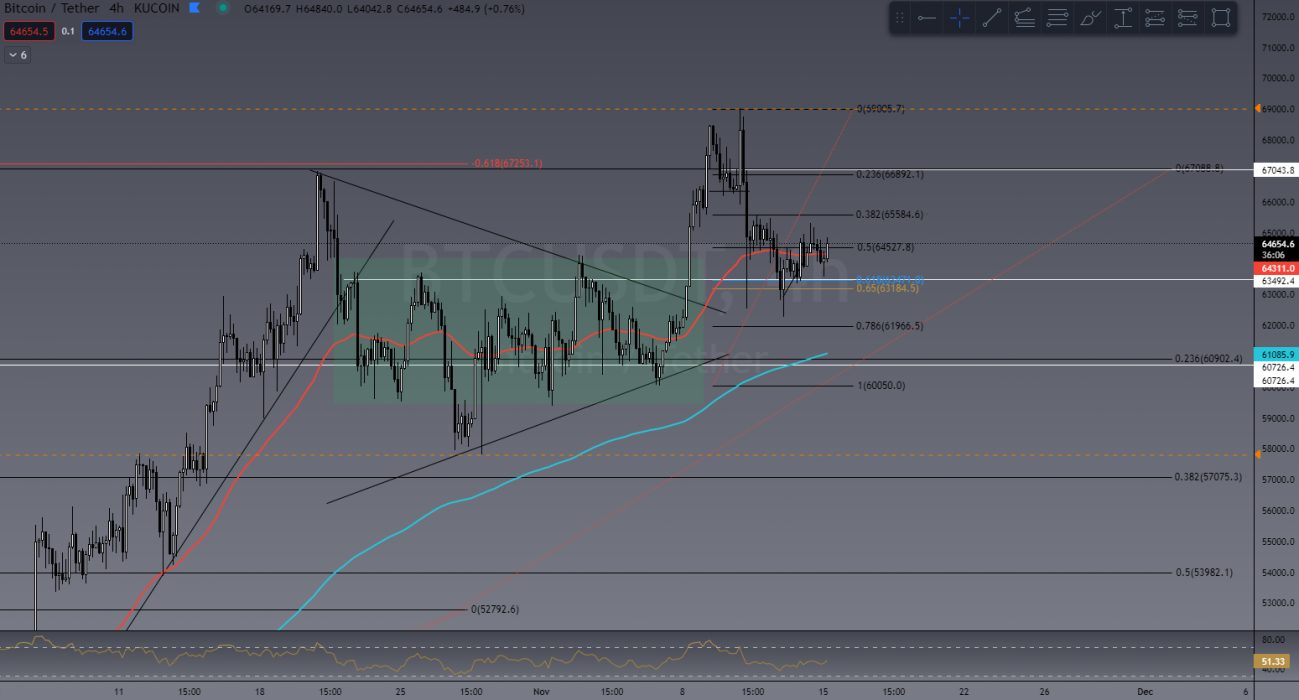
In last week’s article I mentioned BTC forming a symmetrical triangle which, as a general rule, has a 70% chance of breaking out to the upside. As you’ll see below, BTC did have a bullish break into a new all-time high (ATH) and has since reversed with some bearish price action to what we call a retest zone. What goes up, must come down … and that’s the same for financial markets. Nothing continues to go up without having some downs along the way.

BTC is retesting a new level of support after retracing in the 61.8% golden pocket. This is actually a bullish signal and could simply indicate a new market structure to launch from! We still expect BTC to reach US$78,000 soon.

BTC breaking out and now retesting support

Last Week’s Performance

MANA/USDT

Last week I mentioned the coin to watch was MANA (Decentraland) as the bullish momentum was just too good to ignore. It’s seen price action increase 57% and currently retracing. It seems to be bouncing from the 50% fib level at the time of writing and could see the 61.8% fib before a continuation up again. In the TradeRoom there’s been a lot of chatter around these Metaverse coins/tokens, and the sentiment is very bullish!

MANA breaking out and retracing

CHR/USDT

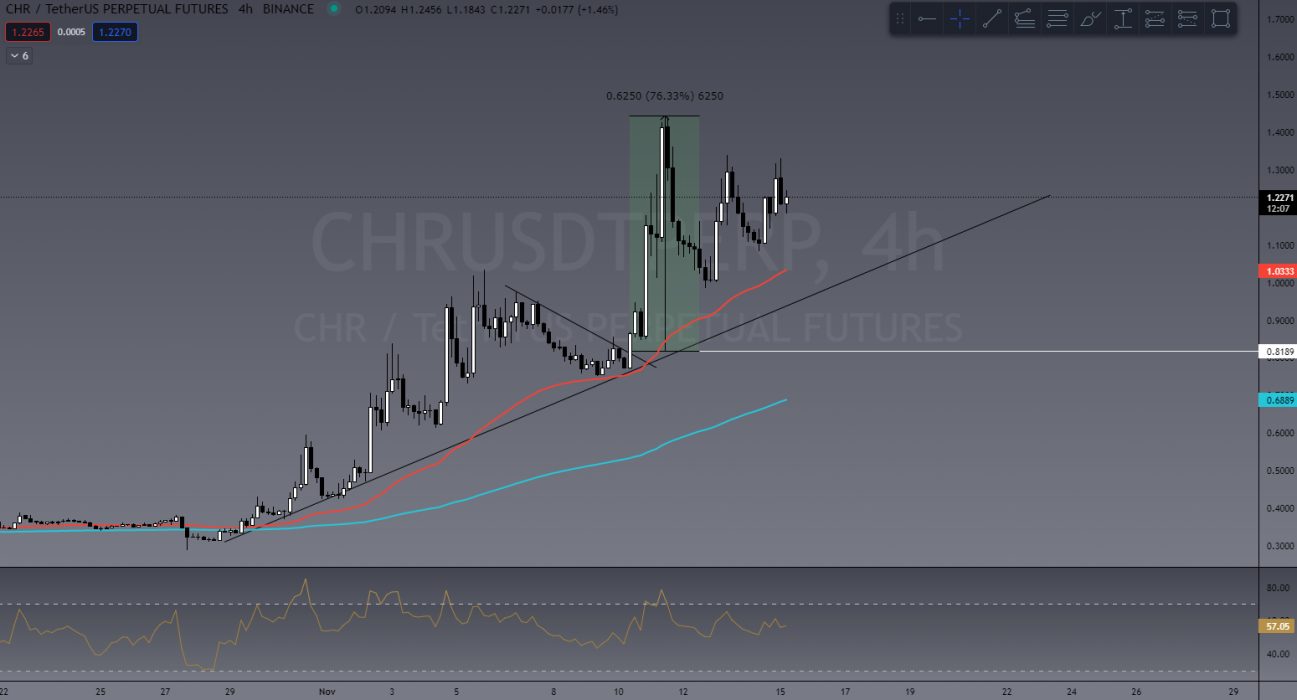
An amazing trade taken last week by one of our TradeRoom legends – “TypeGuy” – was on CHR (another Metaverse token). I’ve recreated his chart below. You can see see price action retraced to the trend line, then painted a bullish engulfing candle leading to a breakout. TypeGuy trades this on 10x leverage yielding him over 300% ROI. CHR did 76% on spot in only two days! That’s what I call a killer trade! TypeGuy has become an extremely consistent trader in TradeRoom after completing our trading course and shares a massive amount of his charts every week!

Massive 76% on CHR in only 2 days!

This Week’s Trades

BTC/USD

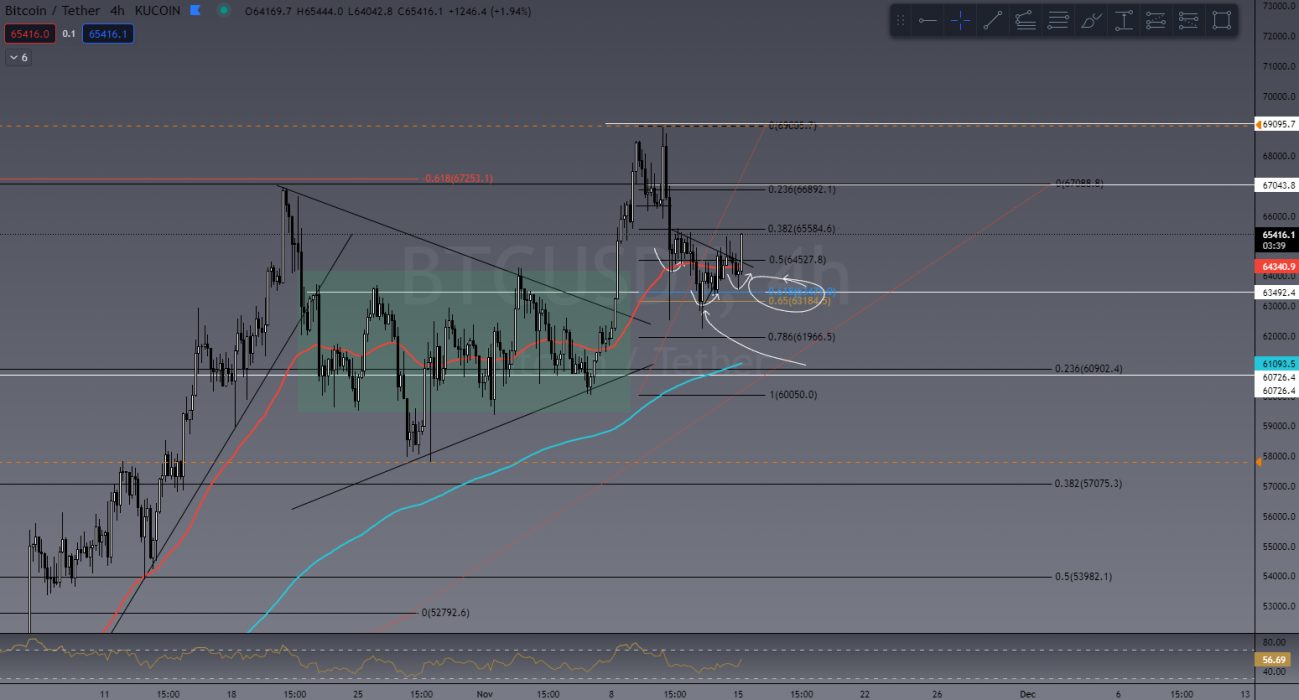
As mentioned above, BTC has seen a healthy pullback in price action and retraced back to that golden pocket. Forming a higher low (HL) on the 4H chart and breaking out the new market structure is VERY bullish so far. A big bullish engulfing candle was forming at the time of writing this and if this momentum can continue, we will surely see a break well above US$70,000 this week!

BTC breakout and retest

ETH/USD

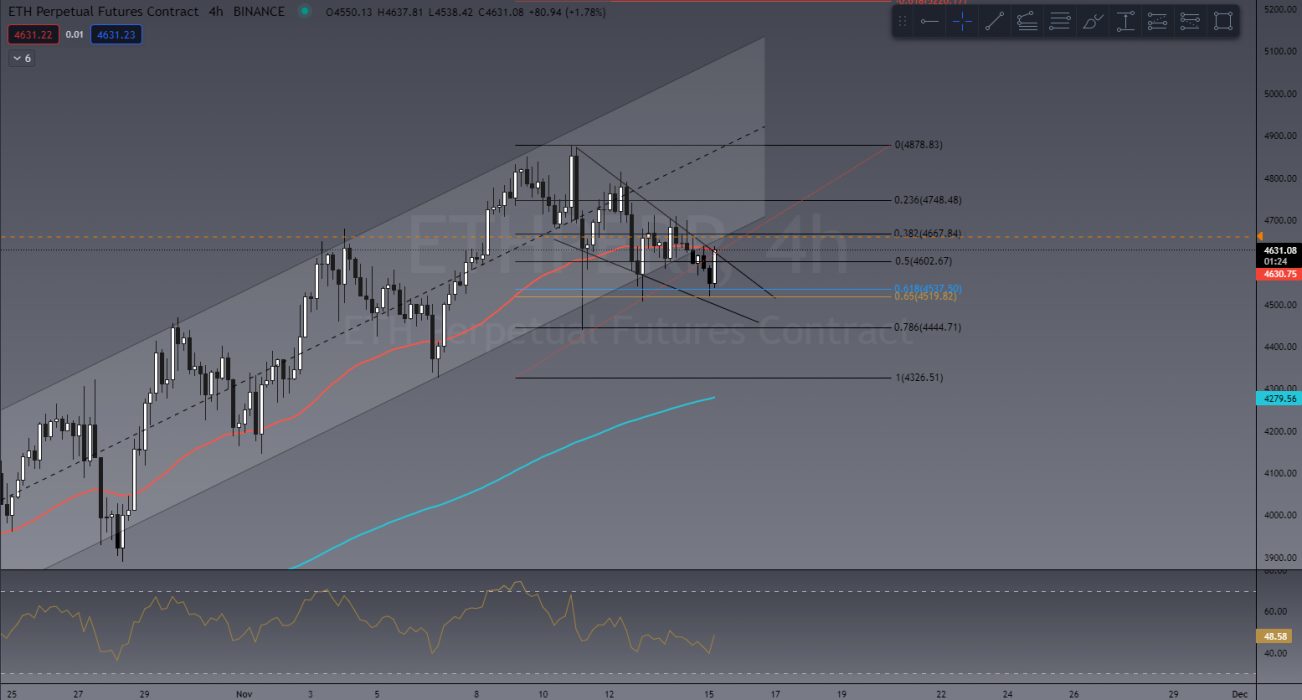
If BTC follows the bullish path, ETH won’t be far behind. Currently in a falling wedge (bullish continuation pattern) and having had a “triple bottom” in that golden pocket, ETH looks really bullish! We would expect to see US$5,000 ETH this week if this plays out well!

LTC/USD

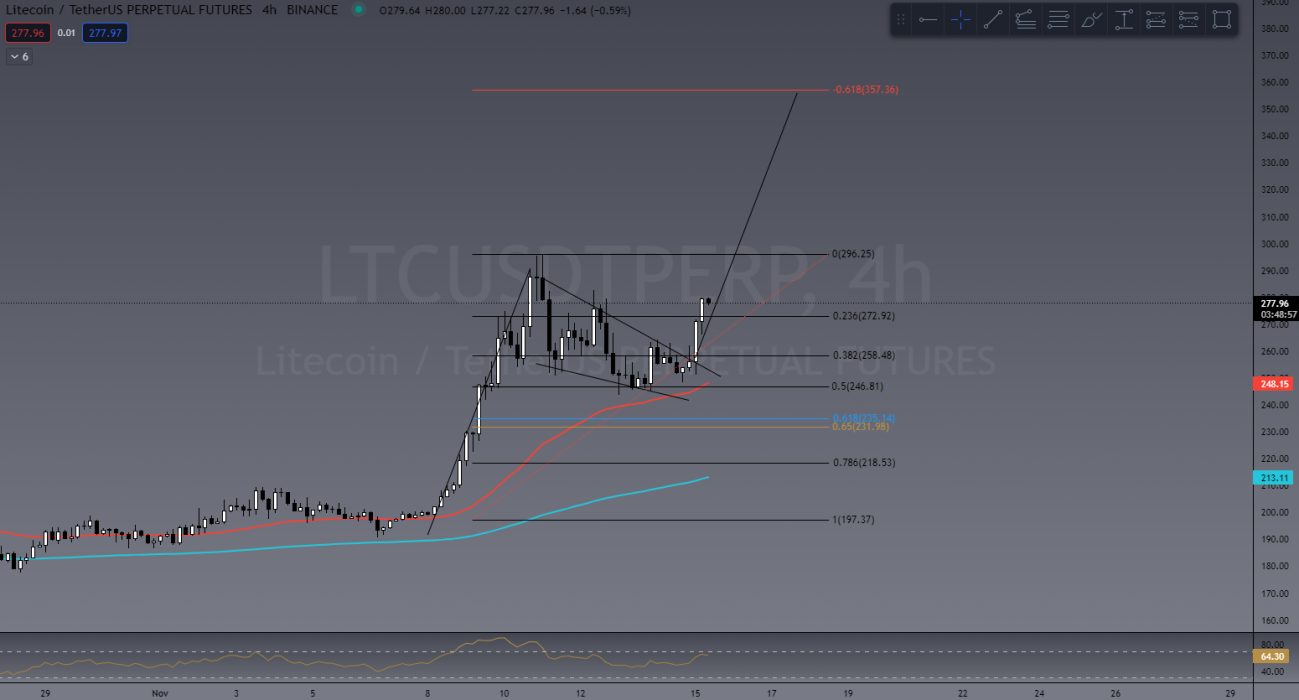
Another big top 10 to watch is LTC. Litecoin is usually either late to the party or early, but it’s rarely on time! What I mean by this is that sometimes it leads the way in price action, beating other top 10 coins to the punch, or it gets totally left behind to do its own thing and show up late again.

This time LTC has shown up early. Pushing out of the falling wedge we expect to see a slight and short-lived pullback before continuing up. I’m getting a Fibonacci target of US$350.

LTC breakout and target based on “flag pole” and Fibonacci

It’s important to remember that when trading ALT coins, their price action is heavily dependent on BTC. If BTC takes a bullish path, ALTs will likely follow. If BTC turns bearish, then ALTs will likely dump in price even harder!

If you’d like to become a better trader, you’re invited to join our TradeRoom where we share daily charts and market analysis. In our community we strongly encourage and teach correct risk management strategies to keep our members safe in this new volatile crypto market.

Live Trading Lessons – 6-Week Course

If you’d like to improve your trading, we teach you how to understand and implement all of the trading strategies we use in our 6-week Trading Fundamentals Course.

>> Register for the Live Trading Sessions – starts TONIGHT 7pm AEST!

Other ways to learn:

>> Take our Free Beginners’ Trading Course

>> Join our Trading Community for your 7-day free trial


The Crypto Den was created in 2017 to help the rapidly growing crypto community learn and understand the fundamentals of digital currencies and how to trade them. 

Since then we have taught thousands of members the basics of technical analysis and trading strategies to further progress and perfect their trading abilities.

In the TradeRoom you will be included in a supportive environment which encourages personal growth, education and community support.

It’s a place to share your trading ideas and follow other experienced traders’ feeds to help keep your finger on the pulse of such a volatile market!
Categories
Bitcoin Market Analysis Markets The Crypto Den Trading

TradeRoom: Our Weekly Crypto Trades Analysis – Nov 8, 2021

Welcome to this weekly series from the TradeRoom. My name is Dave and I’m the founder of The Crypto Den, an Australian-based crypto trading and education community aiming to give you the knowledge to take your trading game to the next level.

Crypto Market Outlook

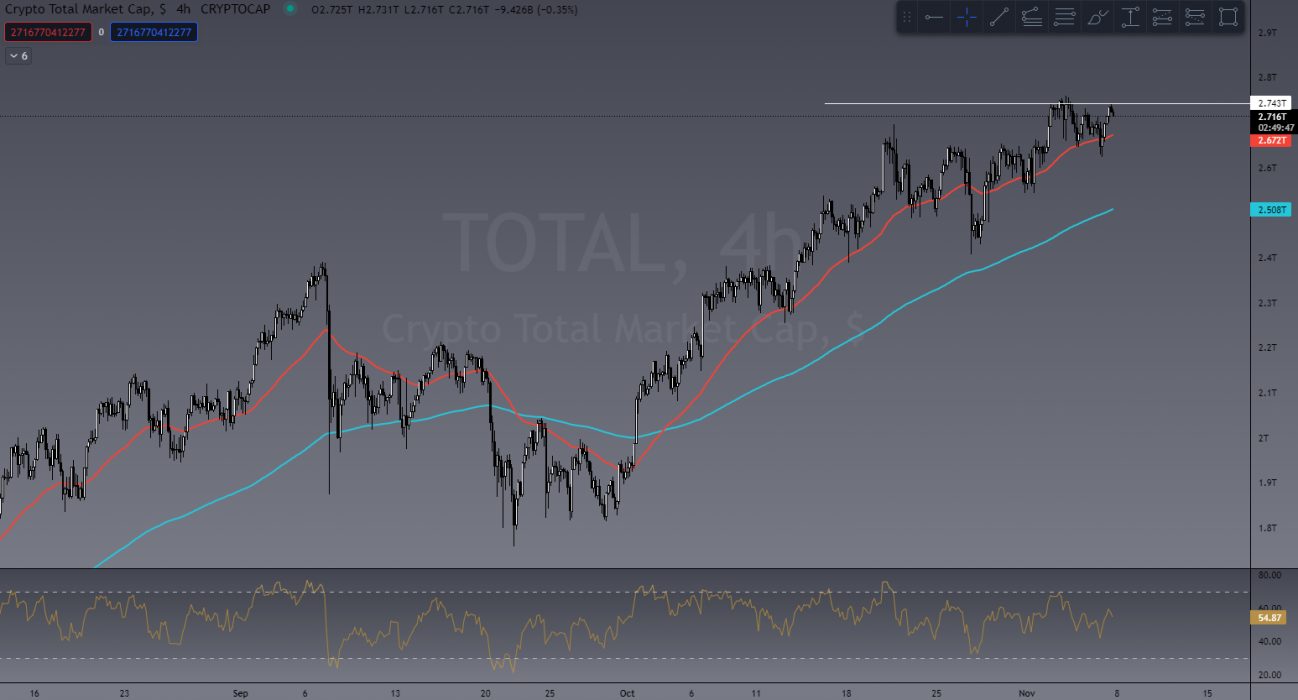
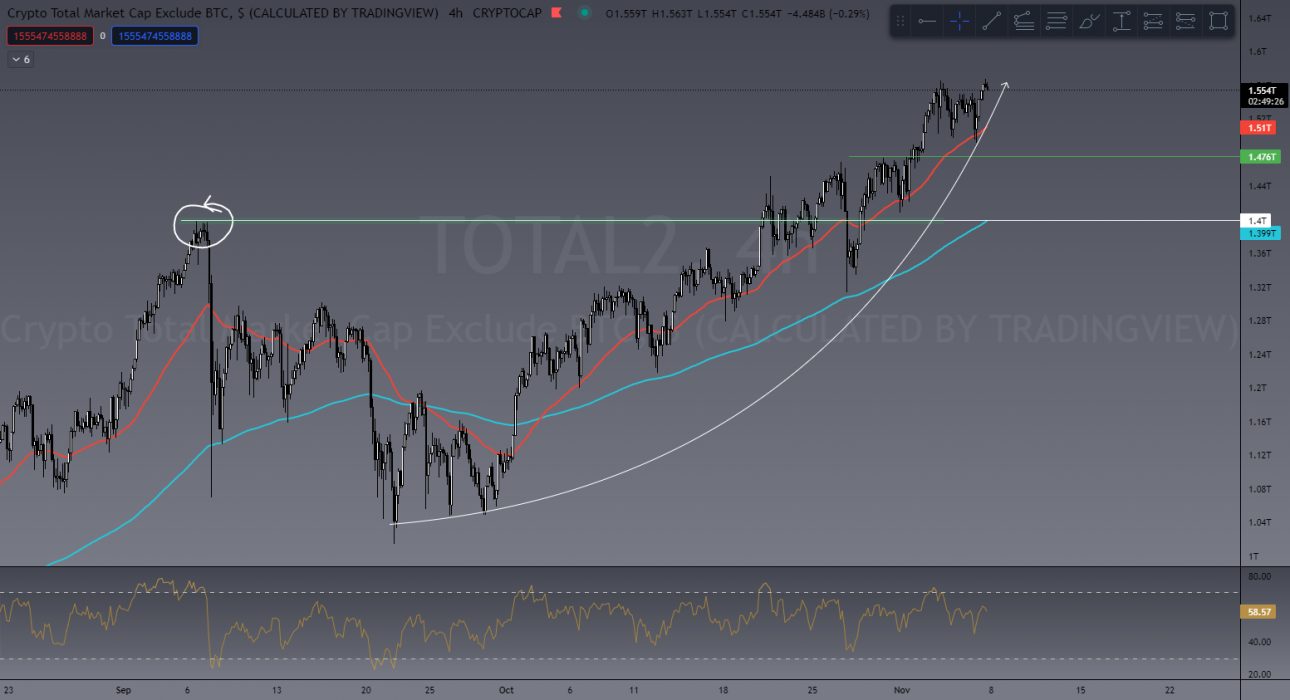
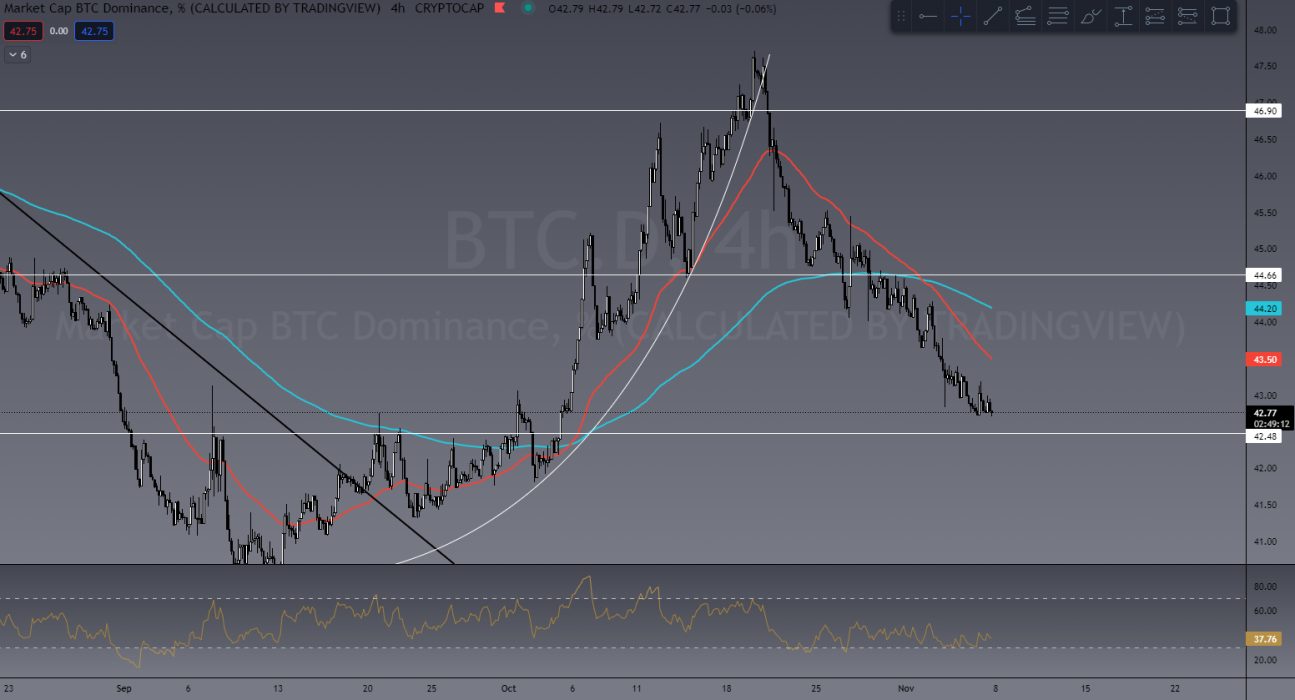
Last week the overall Crypto Market Cap (TOTAL) sat steady at the US$2.6 trillion area and this week is still holding strong, currently at US$2.7 trillion. The flow of money into ALTS has shown some serious bullish price action across the board all week with near perfect conditions as a trader.

Bitcoin dominance is still dropping. Over the past seven days it’s dropped from 44% to 42%, while the ALT market added almost US$100 billion (6% growth).

Total Crypto Marketcap
ALT coin Marketcap
BTC Dominance

Looking at BTC, we are seeing a few key points of interest.
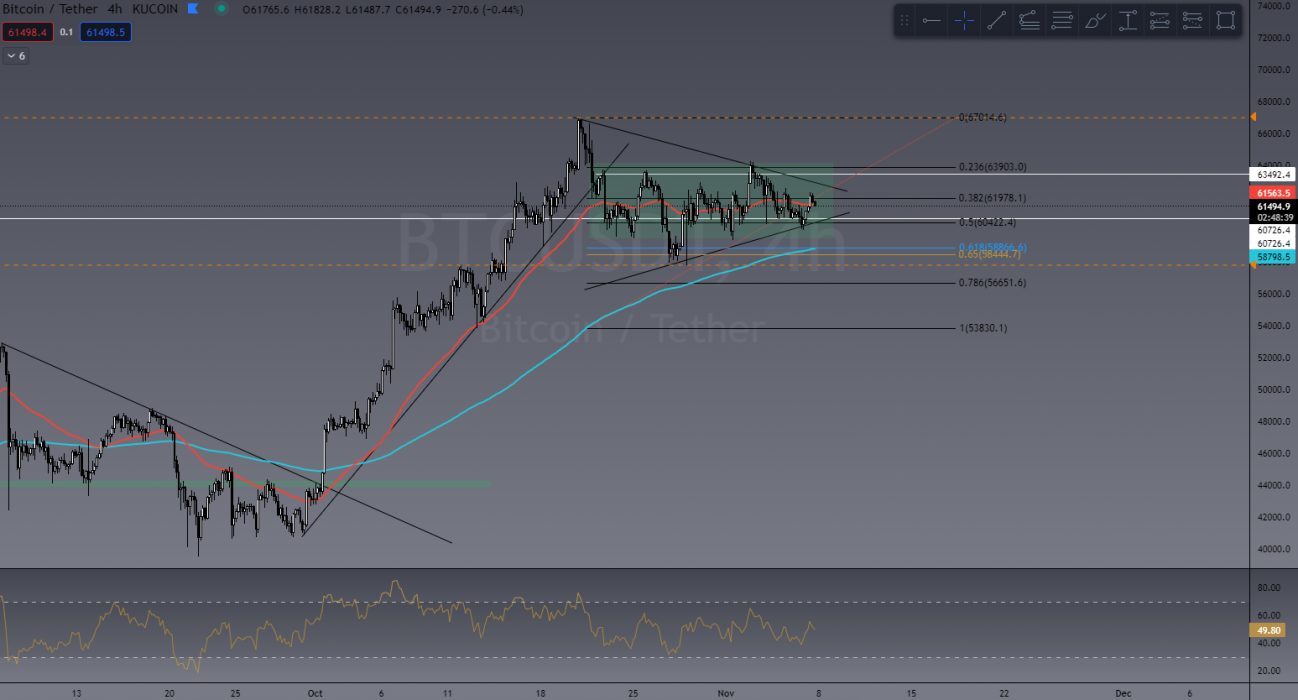
First, since last week BTC has been ranging. Despite the BTC.D dropping further, this isn’t a bad thing. Holding steady above US$60,000 and ranging up to US$64,000 shows a bit of consolidation.

After its ATH push, it’s retraced into a golden pocket (61.8% FIB) from its previous level of consolidation, with a series of Lower Highs (LH) and Higher Lows (HL) forming a symmetrical triangle (usually a bullish continuation pattern with a 70% chance of continuing with existing trend).

Our first target in the TradeRoom still sits at US$78,000. As traders we move with the market and change our bias to suit, and at the moment the general consensus is bullish!

BTC/USDT

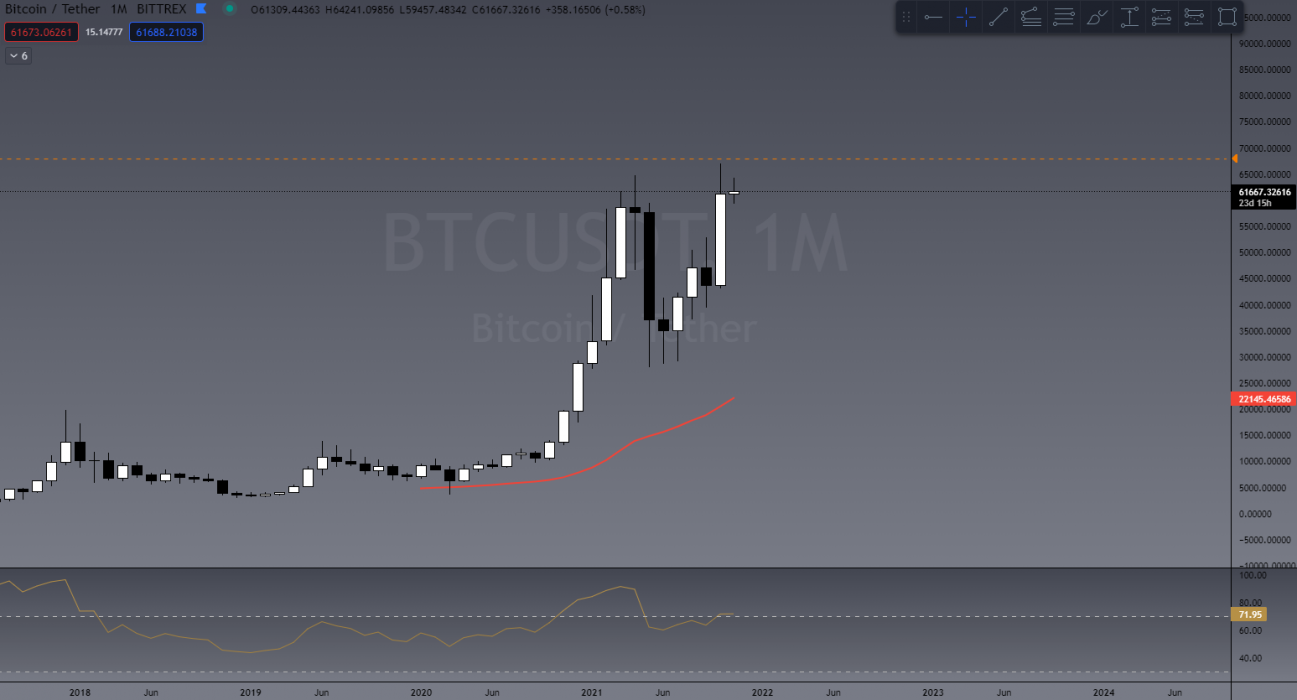
Something to keep an eye on, however, is the BTC monthly chart. At the moment it’s showing a bit of indecision (Doji Candle) and while there are still three weeks of the month to go, it’s worth keeping in mind. We expect this to change but it’s worth noting.

BTC monthly chart

Last Week’s Performance

SOL/USDT

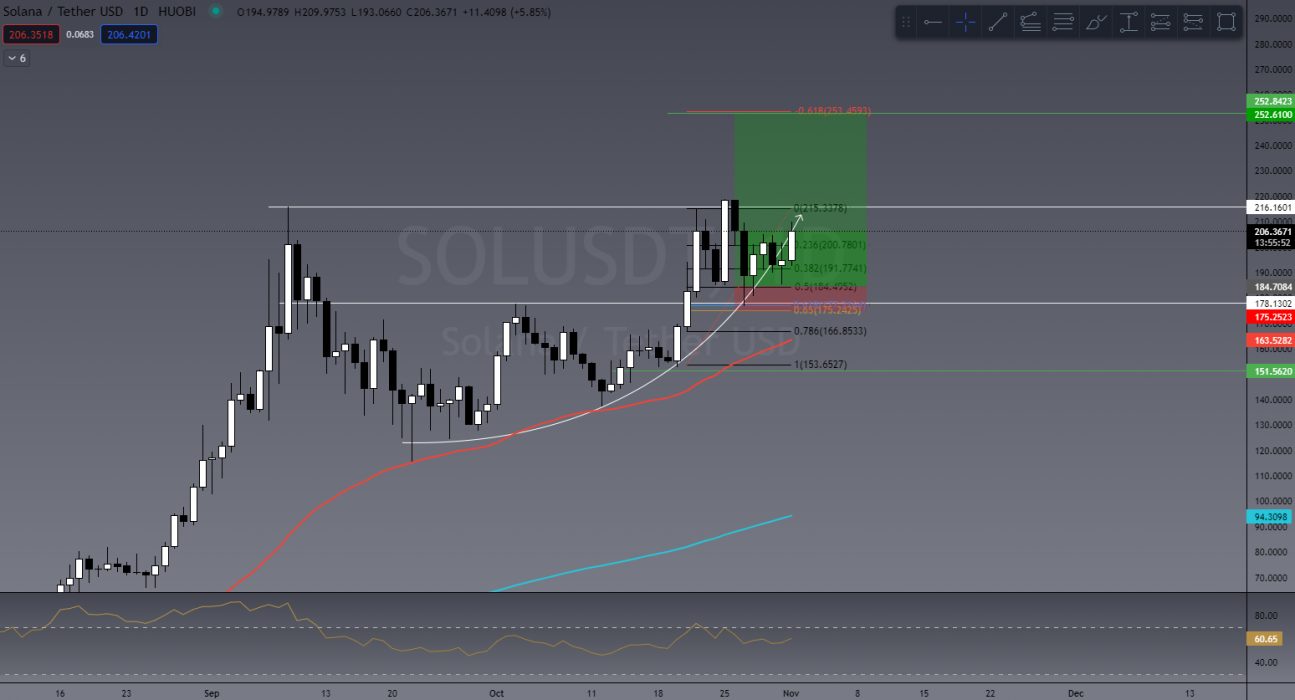
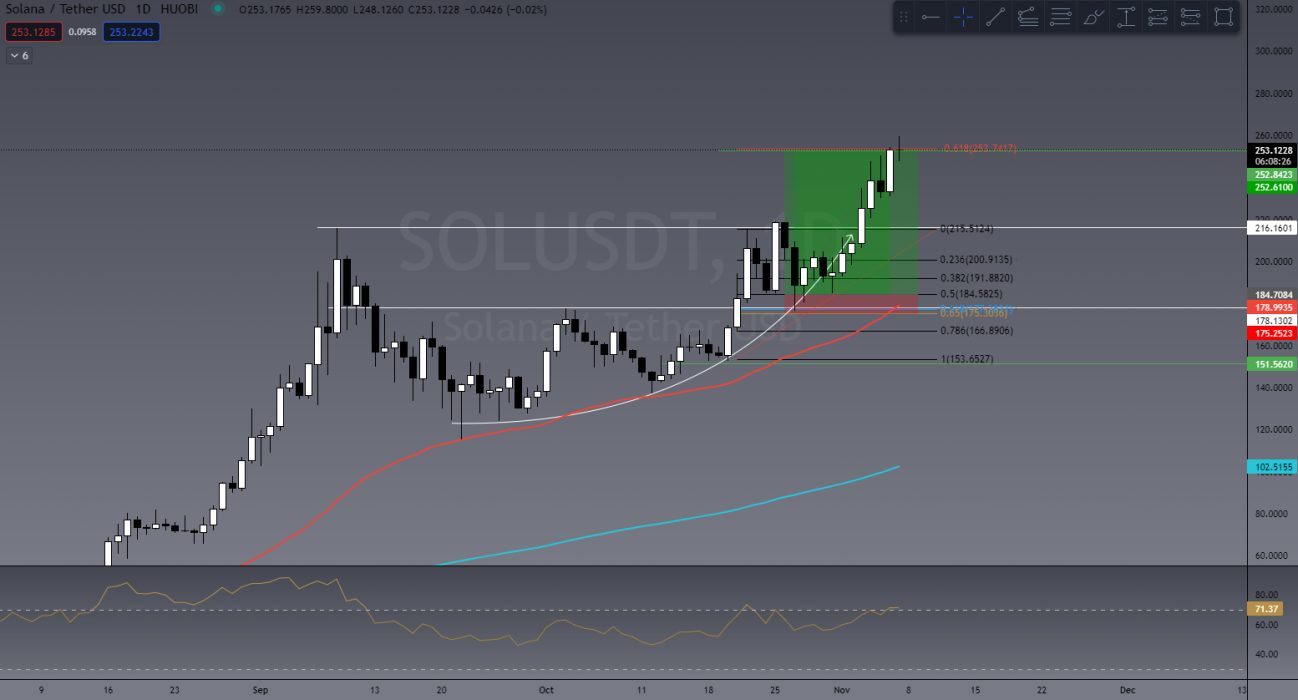
For the third week in a row, Solana (SOL) has made the top of my list. Why? Because it’s a money-making machine! With another 25% growth in the last week, there just seems to be no stopping it. Painting a bit of a daily Doji candle at the time of writing, however, if BTC does in fact take off I expect SOL won’t be far behind.

Chart I shared in last week’s article
SOL this week!

AXS/USDT

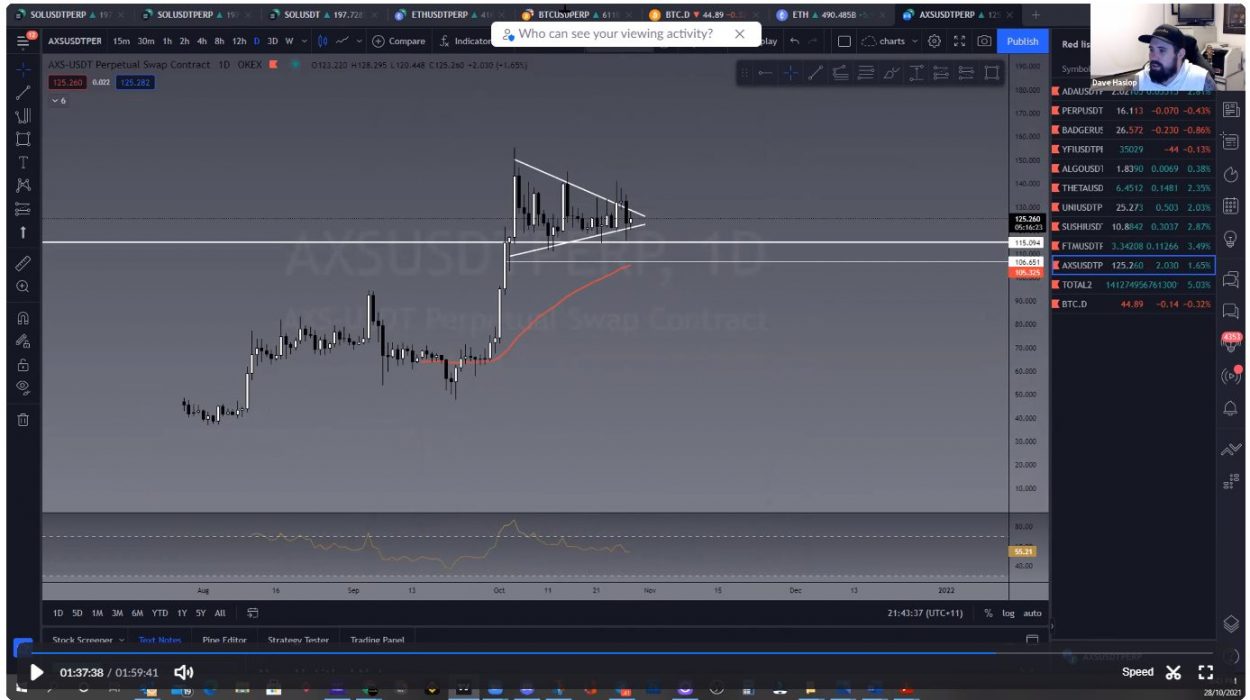
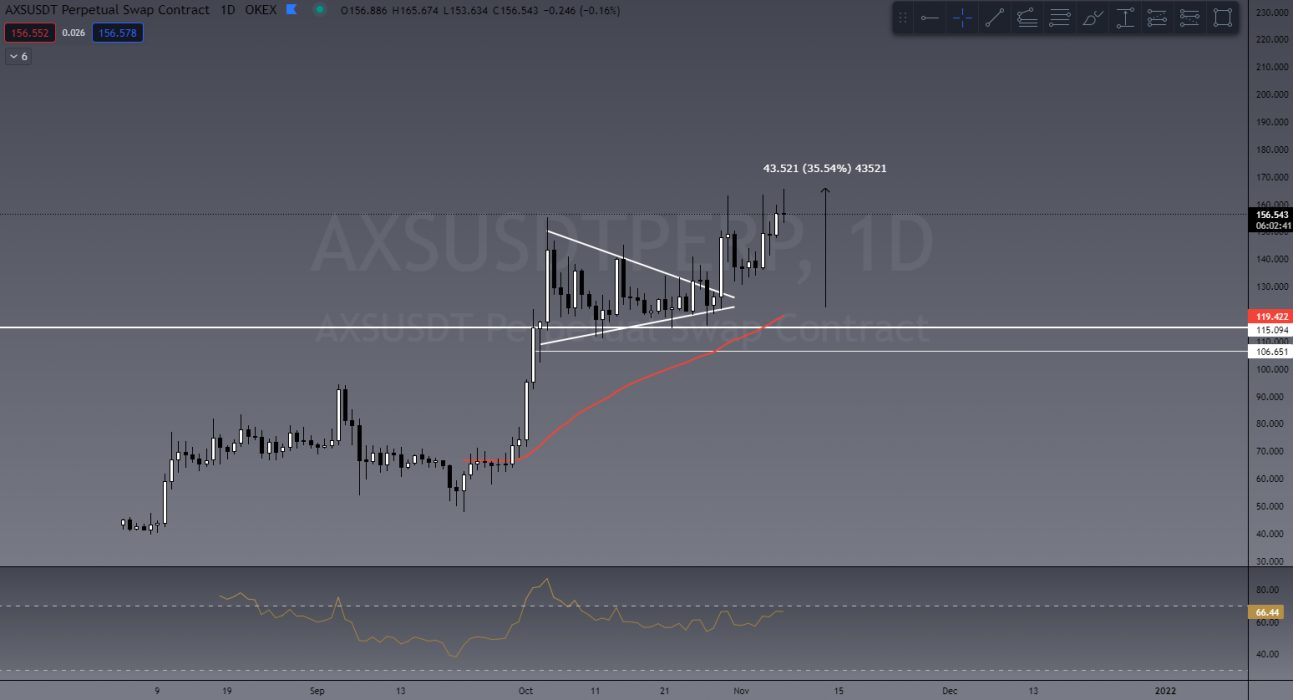
Another trade setup I mentioned in last week’s article is AXS. Since breaking out of its symmetrical triangle, AXS peaked out at 35%, which those of you who leverage trade will know is a significant move, even on a 10x trade.

Last week’s screenshot from a TradeRoom Market Scan
AXS breakout on daily chart

This Week’s Trades

BTC/USD

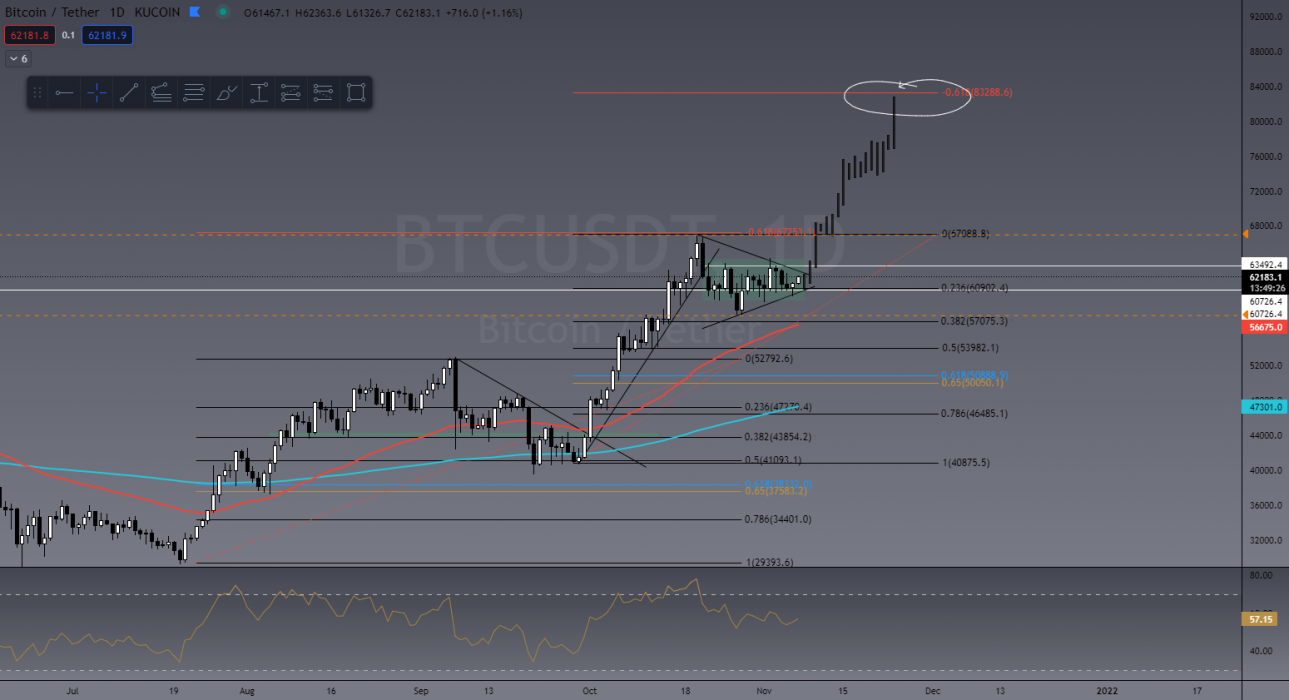
Let’s go back to BTC. If the bullish sentiment plays out, I’m expecting to see something like this:

Possible BTC target

You can see in its previous run up, BTC peaked at the “future 618” Fib (a common target fib) after retracing 50% of its last push before that. Now, it’s not uncommon for momentum to pick up and only see retraces of 38.2% in a continuation trade. If it follows the same pattern, a target of US$83,000 is likely. Our initial target for BTC is still US$78,000.

MANA/USDT

One of the biggest coins to watch for this week, I think, will be MANA (Decentraland). The momentum is too high to ignore and with all the hype around the metaverse tokens, this has been one nice little performer.

We charted this in the TradeRoom last week and collectively made over 1000% RIO in a matter of hours!

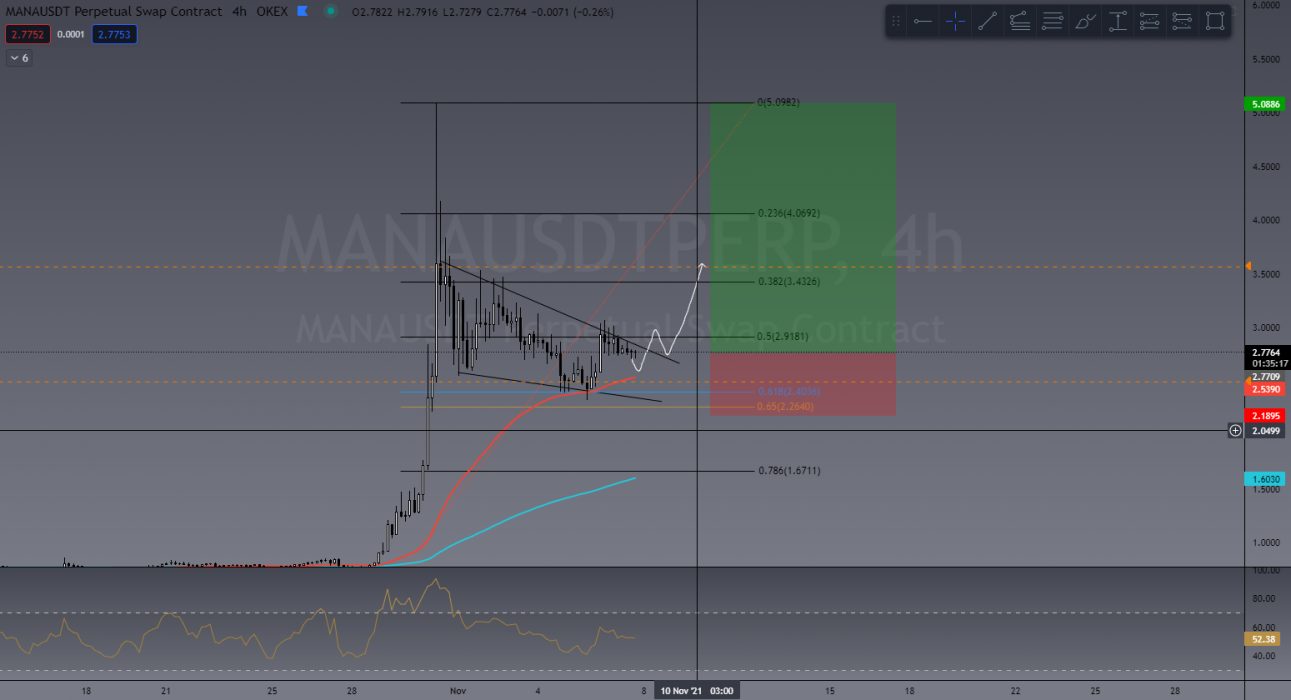
From a technical standpoint, MANA has retraced to the golden pocket (common retrace level based on Fibonacci), bounced off the pocket and the 50 Exponential Moving Average (EMA), and is currently in a descending wedge pattern. This is another bullish continuation pattern we teach in our trading course.

Expect to see something like this play out

It’s important to remember that when trading ALT coins, their price action is heavily dependent on BTC. If BTC takes a bullish path, ALTS will likely follow. If BTC turns bearish, then ALTS will likely dump in price even harder!

If you’d like to become a better trader, you’re invited to join our TradeRoom where we share daily charts and market analysis. In our community we strongly encourage and teach correct risk management strategies to keep our members safe in this new volatile crypto market.

>> Take our Free Beginners’ Trading Course

>> Join our Trading Community for your 7-day free trial

>> If you’d like to learn how to read and analyse charts, our LAST live trading course of the year starts Nov 15!


The Crypto Den was created in 2017 to help the rapidly growing crypto community learn and understand the fundamentals of digital currencies and how to trade them. 

Since then we have taught thousands of members the basics of technical analysis and trading strategies to further progress and perfect their trading abilities.

In the TradeRoom you will be included in a supportive environment which encourages personal growth, education and community support.

It’s a place to share your trading ideas and follow other experienced traders’ feeds to help keep your finger on the pulse of such a volatile market!
Categories
Bitcoin Crypto News Market Analysis The Crypto Den Trading

TradeRoom: Our Weekly Crypto Trades & Analysis – Nov 1st, 2021

Welcome to this weekly series from the TradeRoom. My name is Dave and I’m the founder of The Crypto Den, an Australian-based crypto trading and education community aiming to give you the knowledge to take your trading game to the next level.

In this article:

  1. Crypto Market Outlook
  2. Last Week’s Performance
  3. This Week’s Trades

Crypto Market Outlook

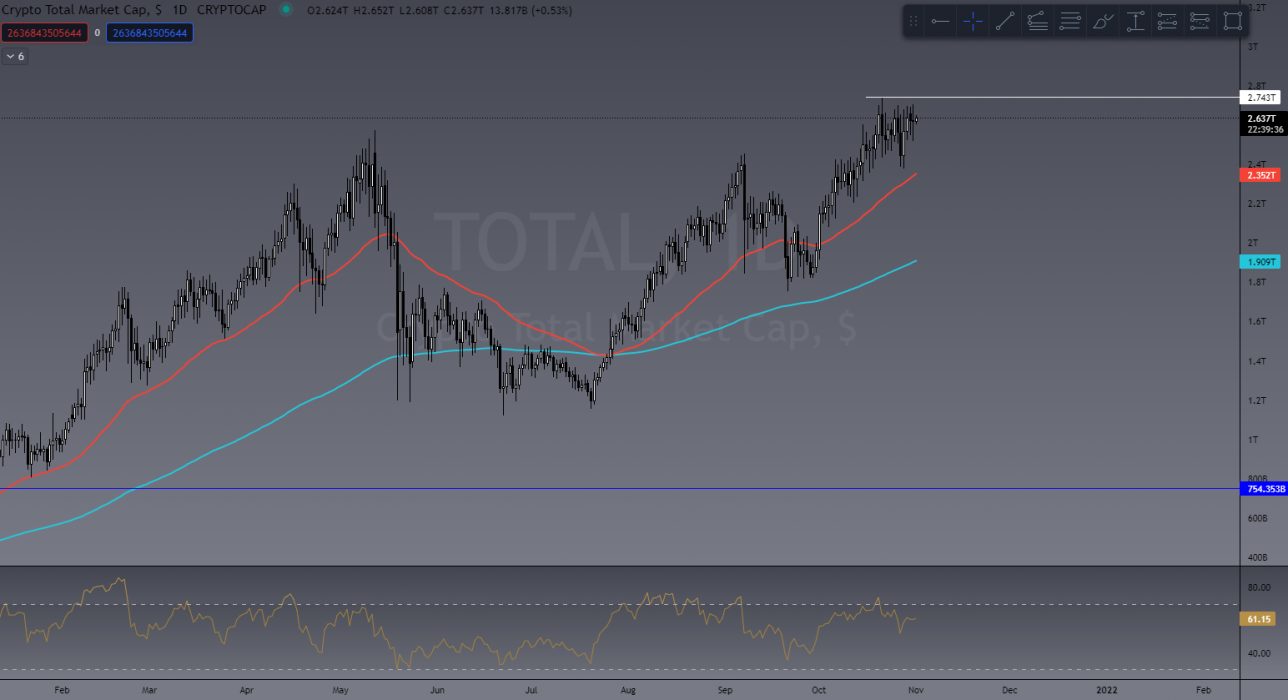
Despite BTC dropping 14% from its new all time high (ATH) last week the entire Crypto Market Cap (TOTAL) still looks very healthy sitting at US$2.64 Trillion area. Which is only a 4% drop since the new ATH of the market cap.

Total Crypto Market Cap

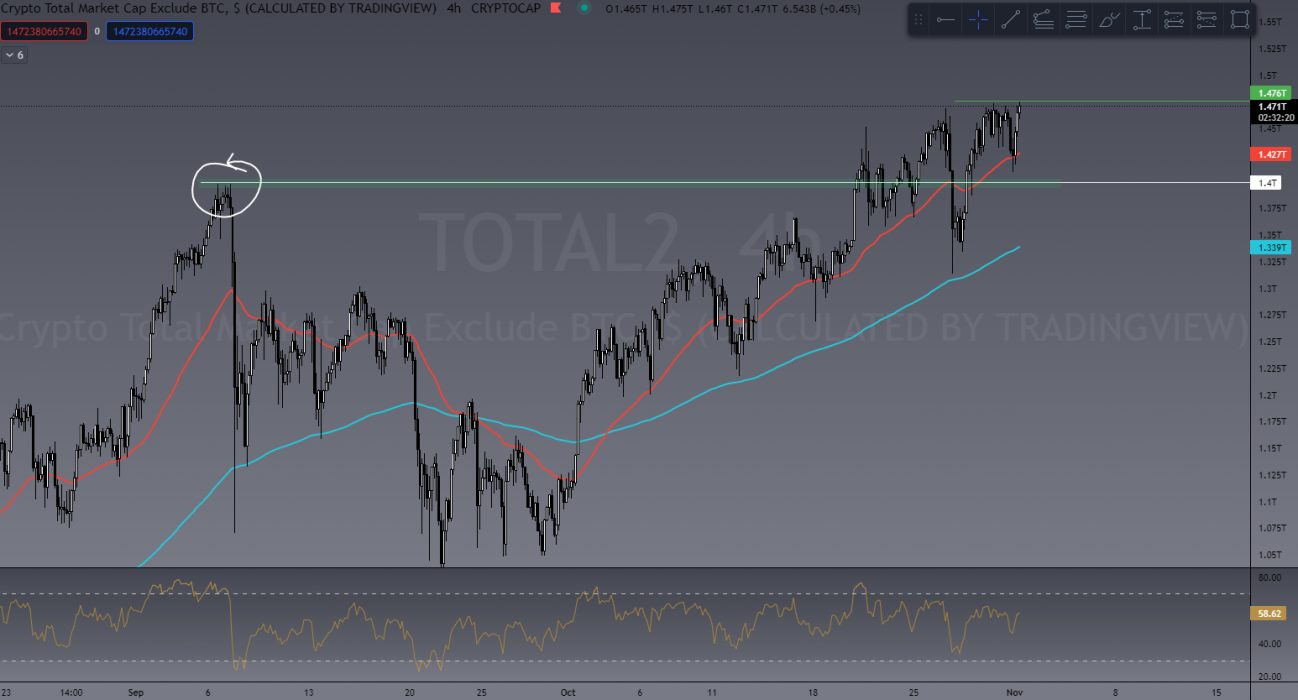
What we find really encouraging is the current position of the ALT coin market (TOTAL2) which has a total value of US$1.47 Trillion. Reaching new highs yet again this is extremely bullish, not just for ALTS, but show for BTC as well as its showing strong confidence in the overall market. Bitcoin Dominance (BTC.D) dropped with BTC recently and ALTS only seen rather minor reactions to this drop.

Total Crypto Market Cap EXCLUDING BTC

Even the total crypto cap excluding both BTC and ETH (TOTAL3) has reached new highs this week topping out at US$963 Billion. Which tells us that a lot of capital is confidently flowing into ALTS across the board and not just to the Crypto #2 Ethereum.

Now lets take a good look at Bitcoin.

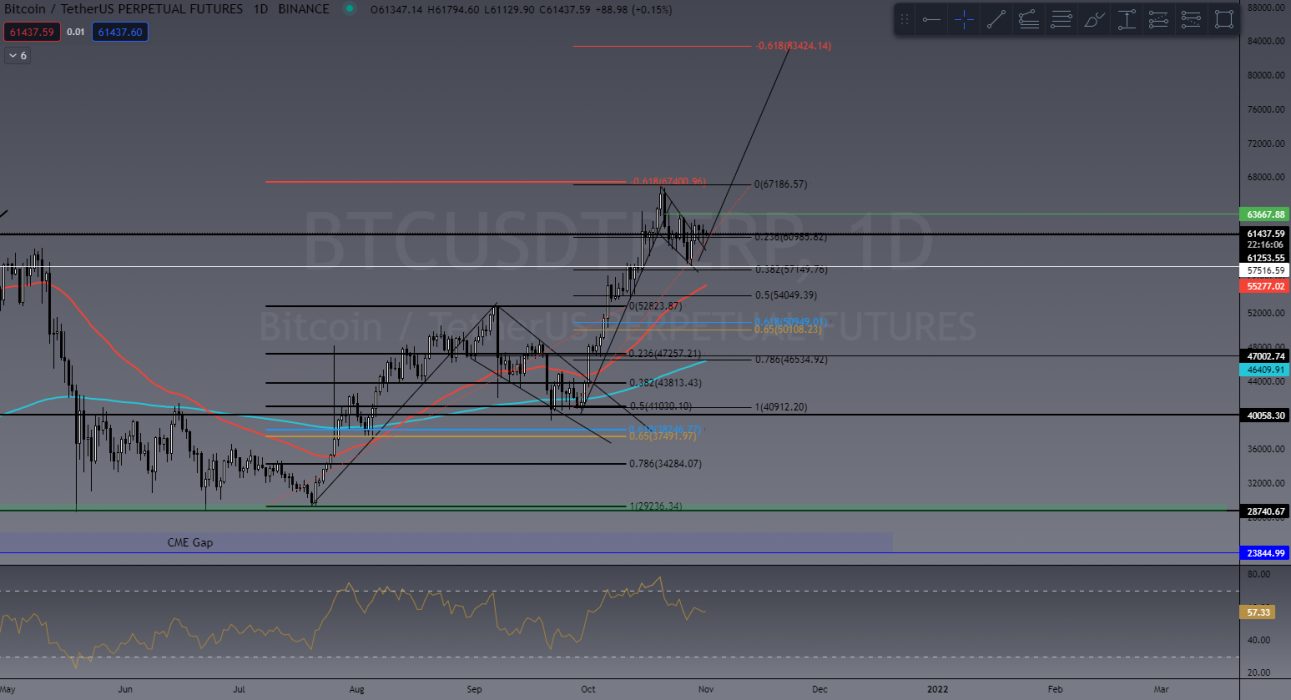
BTC pulled back to find daily support at US$57,500 after reaching a new ATH at US$67,000. We thought we would see a much stronger initial push high from BTC after achieving a new high however a pullback like this is NOT unhealthy. In fact quite the opposite.

Possible bullflag for BTC

BTC could simply be painting a daily bullflag! This is a bullish trend continuation pattern which shows a price projection (length of the flag pole) lining up perfectly to a future 618 Fibonacci level. We teach you all about chart patterns and Fibonacci in our Trading Course if you’d like to learn more on this!

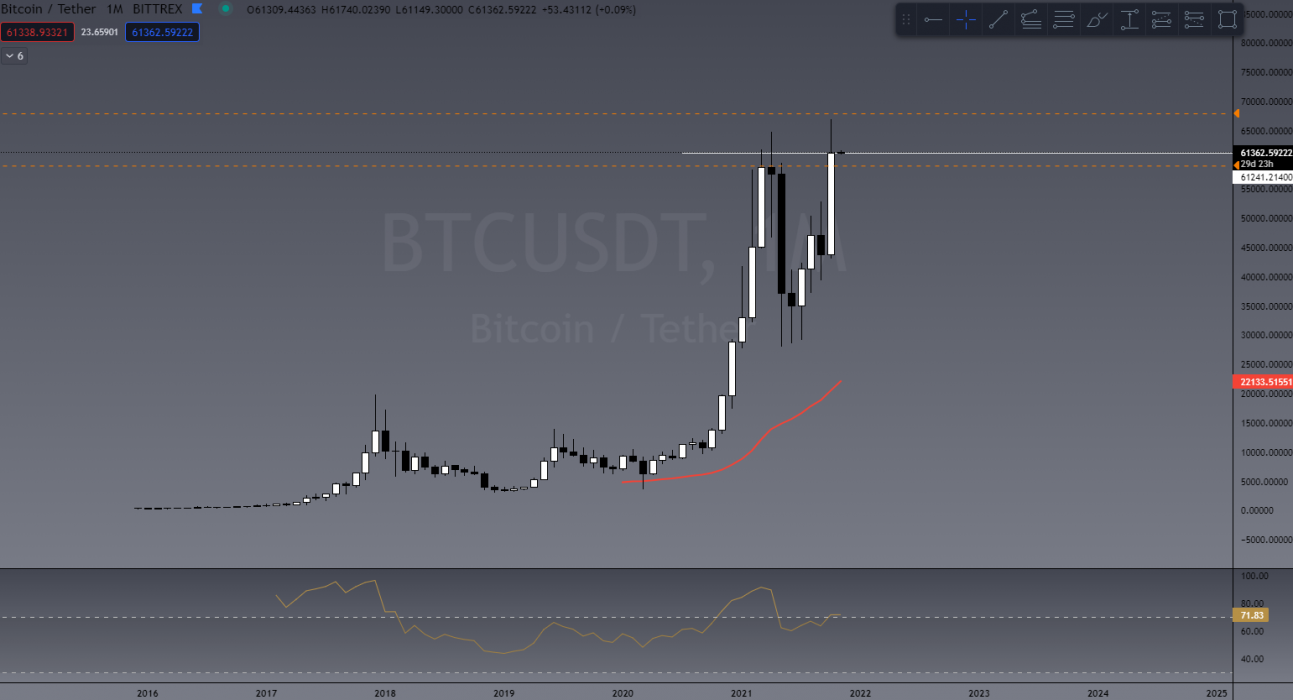
If we take a look at BTC on a monthly chart you’ll see its just had its highest monthly close ever! Another very bullish sign.

BTC highest ever monthly close

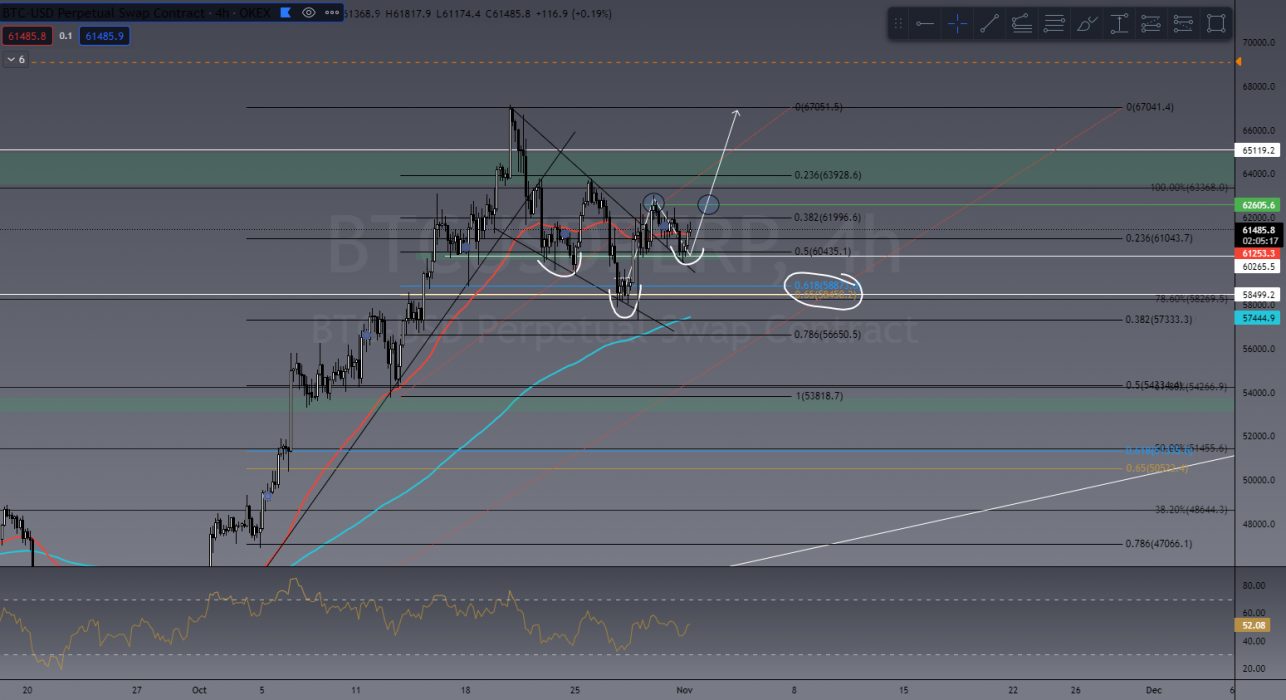
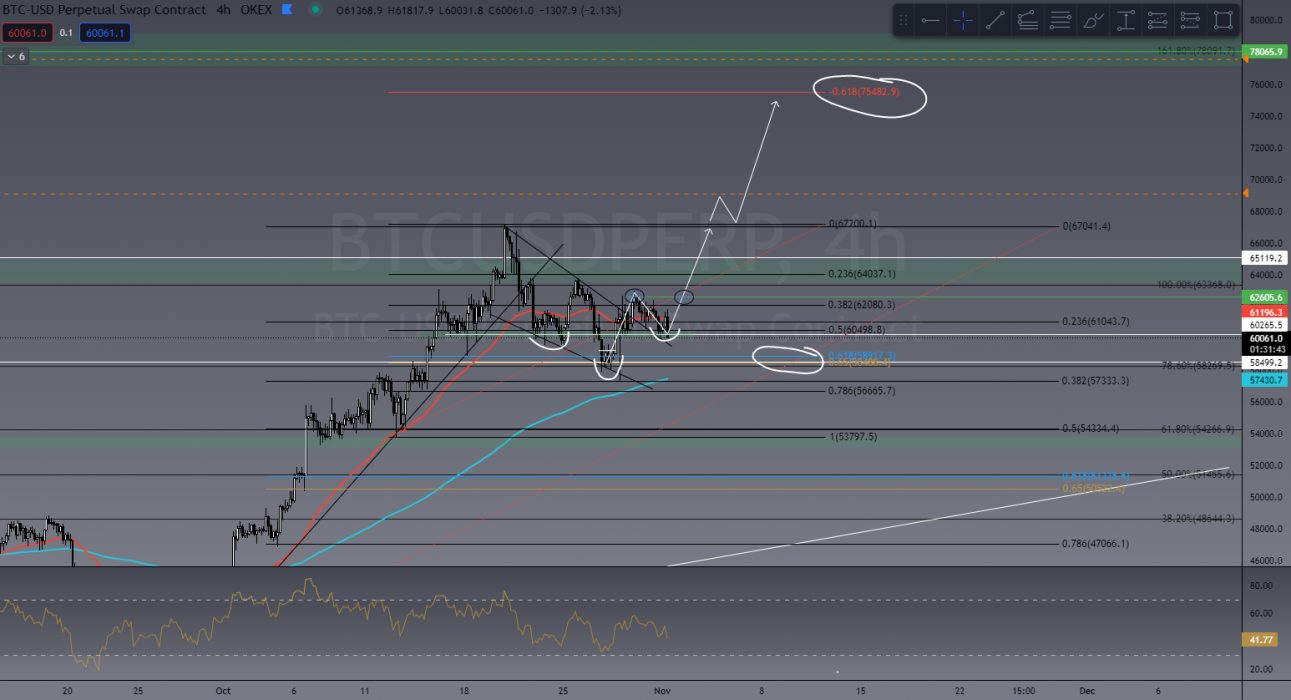
So what are we looking for in the TradeRoom next? Based on a 4 hour chart it shows BTC breaking out of the bull flag and retesting a level of both horizontal support and the local down trend. This restest forms a higher low (HL) which leads some pattern traders to see an inverse head and shoulders pattern (iH&S) which is a common reversal pattern preceding a recent trend down. The “head” also reached the common Fib retrace level of 61.8%. We are waiting to see a confirmation of this by breaking above US$62,605 (green line/circles). Once this is confirmed I see BTC approaching the new ATH with bullish strength behind it!
Overall market sentiment is high. The general consensus is that we will see the entire market make another move up. Be sure to mitigate any risk by ensuring stop losses are in place!
BTC breaking out and retesting bullflag

Last Week’s Performance

SOL/USDT

In my last article I touched on SOL being one of the key coins to watch. Even with BTC dropping that 14% I’m so impressed with how well SOL has held its own. Making a higher high (HH) on daily chart we still expect to see SOL reach new highs at around US$250

SOL/USDT

ETH/USD

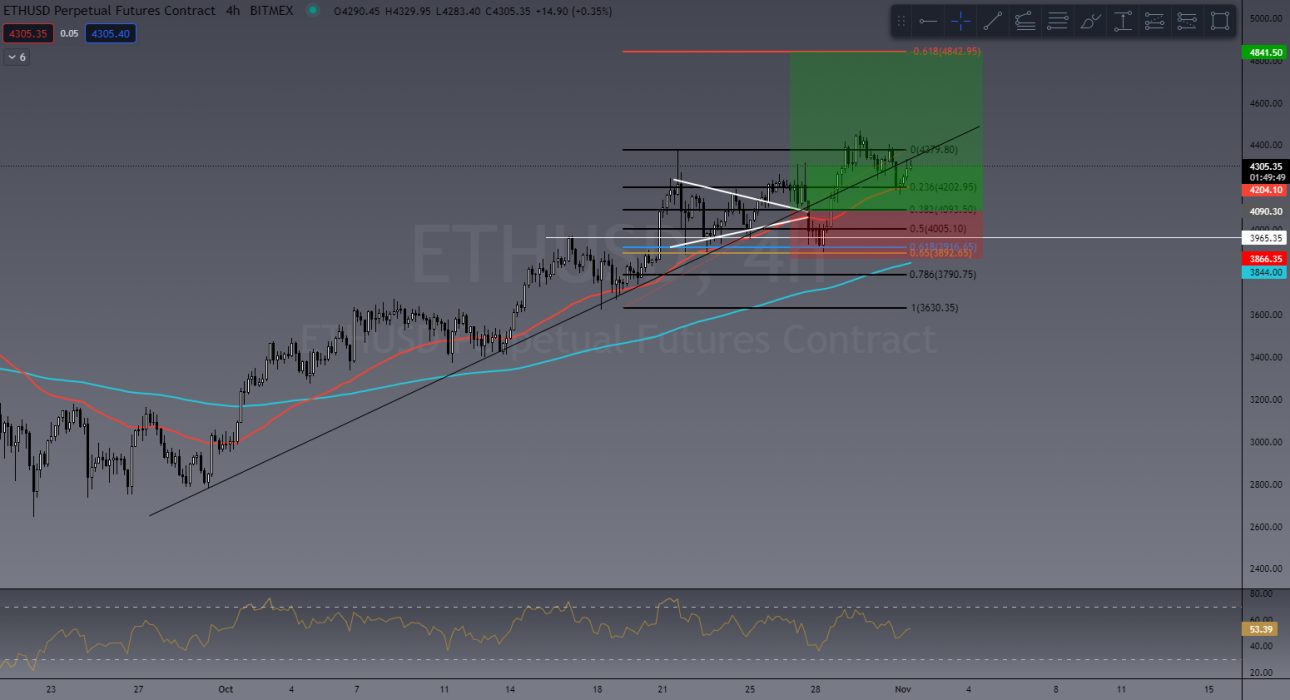
We also looked at ETH for a long position. As you can see in the chart below this trade was ALMOST stopped out when BTC pulled back however it wasn’t hit and we are still in the trade. Again, I’m expecting to see ETH hit close to US$5,000 soon!

ETH/USD

MANA/USDT

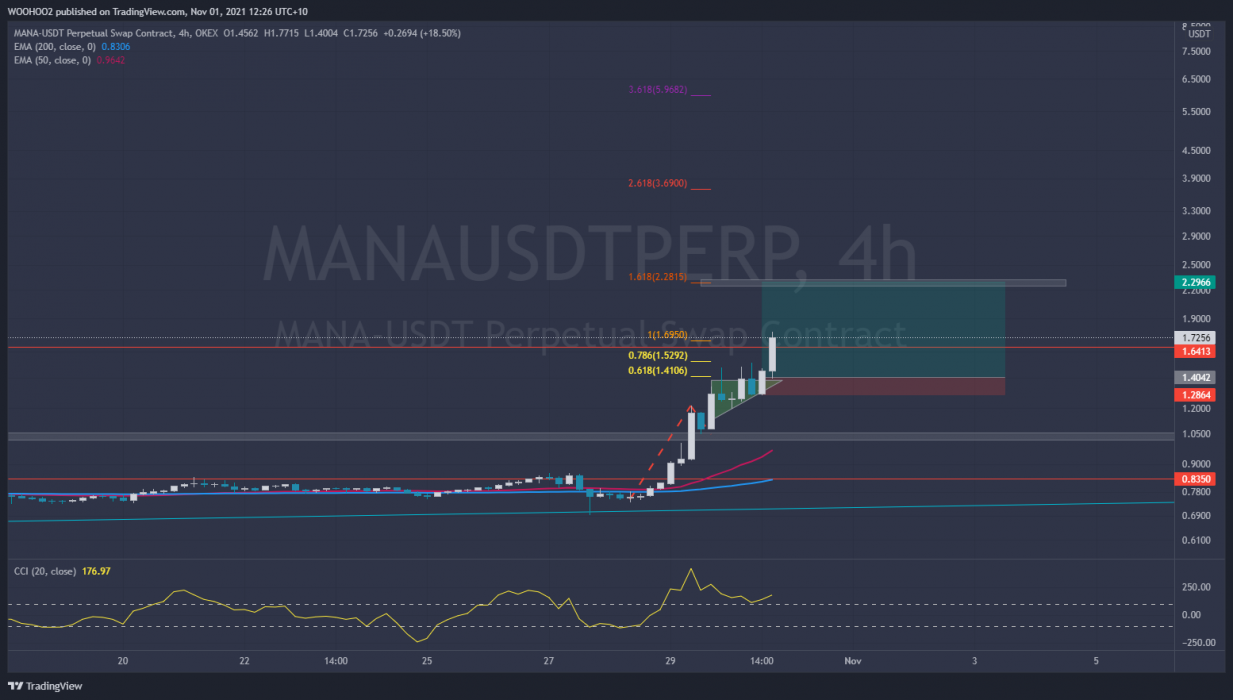
This trade was by one our our TradeRoom members and former students! Using Fibonacci as a project tool this trade played out better than expected!

MANA/USDT
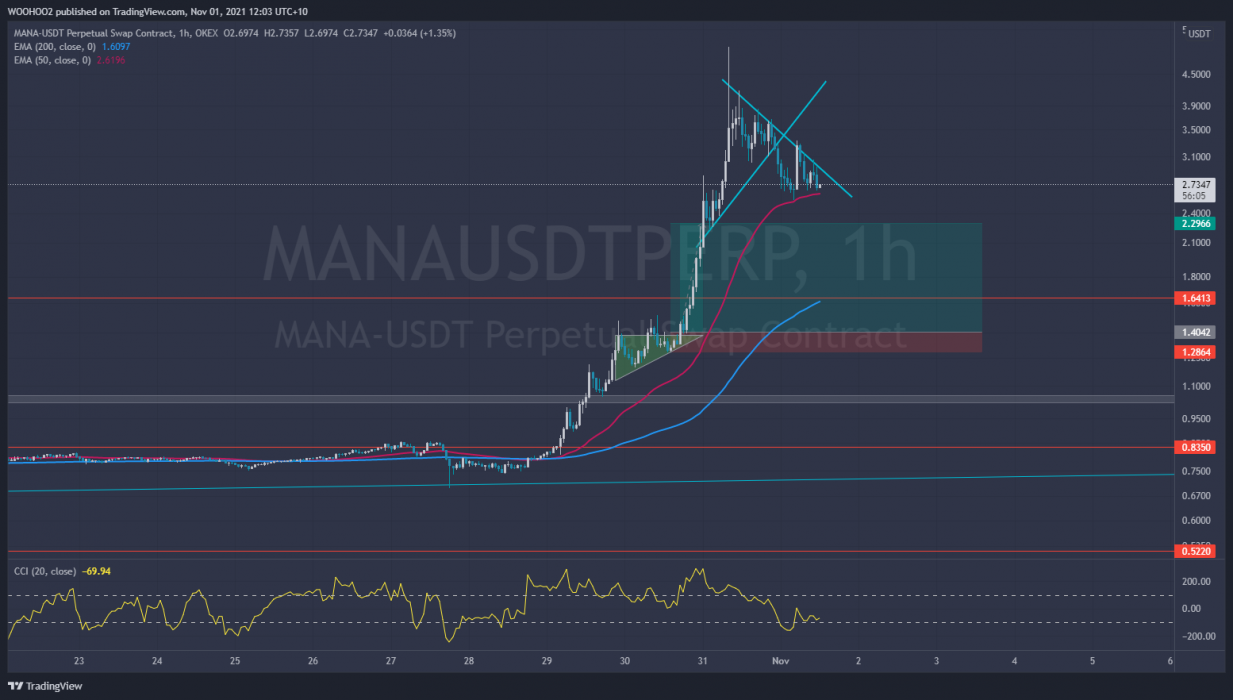
MANA/USDT

‘Dazzling’ as he’s known in the TradeRoom spotted this ascending triangle pattern (another bullish continuation pattern). After entering MANA did a massive 240% move. Daz entered into a leveraged trade yielding him over 1000% which is amazing! I’m sure everyone reading this from the TradeRoom can agree Daz is a TCD legend and always extremely helpful and supportive within the community! Nice work Daz!

NOTE: Daz has been trained to trade with leverage. Leverage trading should NOT be done by beginners. If you’d like to learn our Trading Fundamentals LIVE course starts in 2 weeks!


This Week’s Trades

BTC/USD

Lets look at BTC first. Can it follow the potential path addressed above and breaks the ATH at US$67,000 we will likely see US$75,000 – US$78,000 as a first target.

BTC/USD

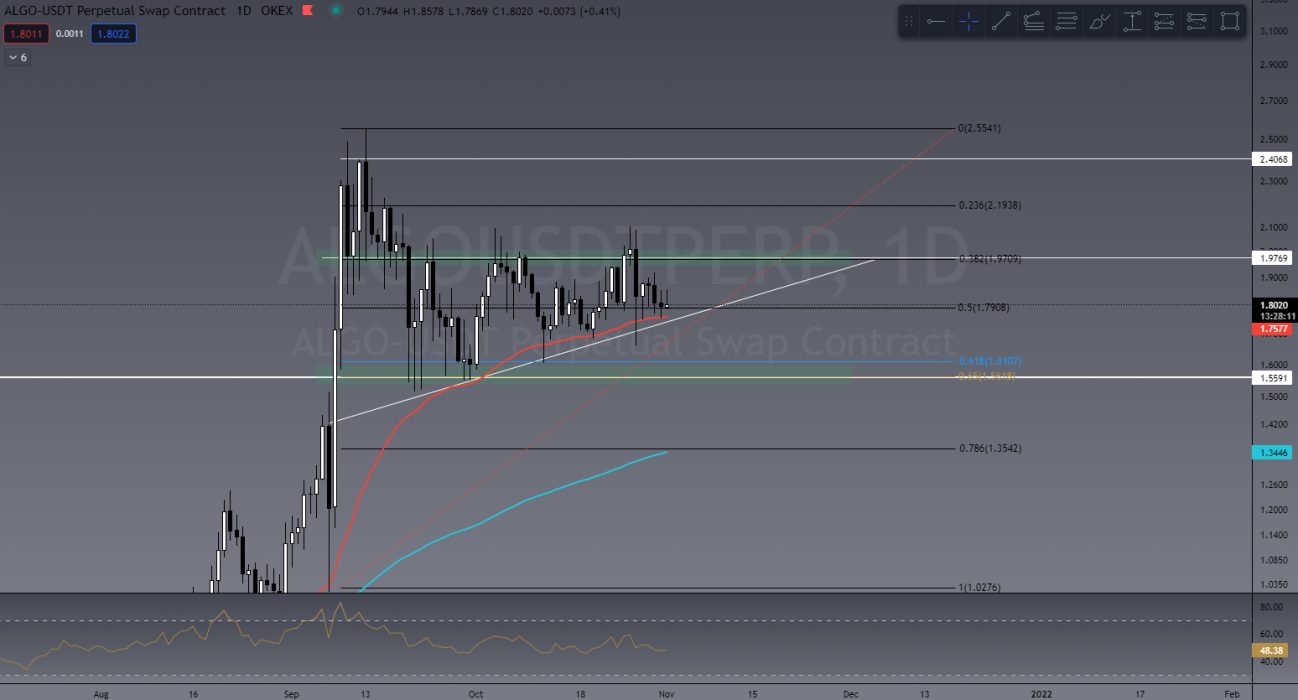
ALGO/USDT

An ALT showing some signs of strength amid the BTC pullback and one of the fan favourites in TradeRoom is ALGO.
Showing some daily Higher Lows (HL) with equal highs ALGO is one to watch this next week or so.

ALGO/USDT

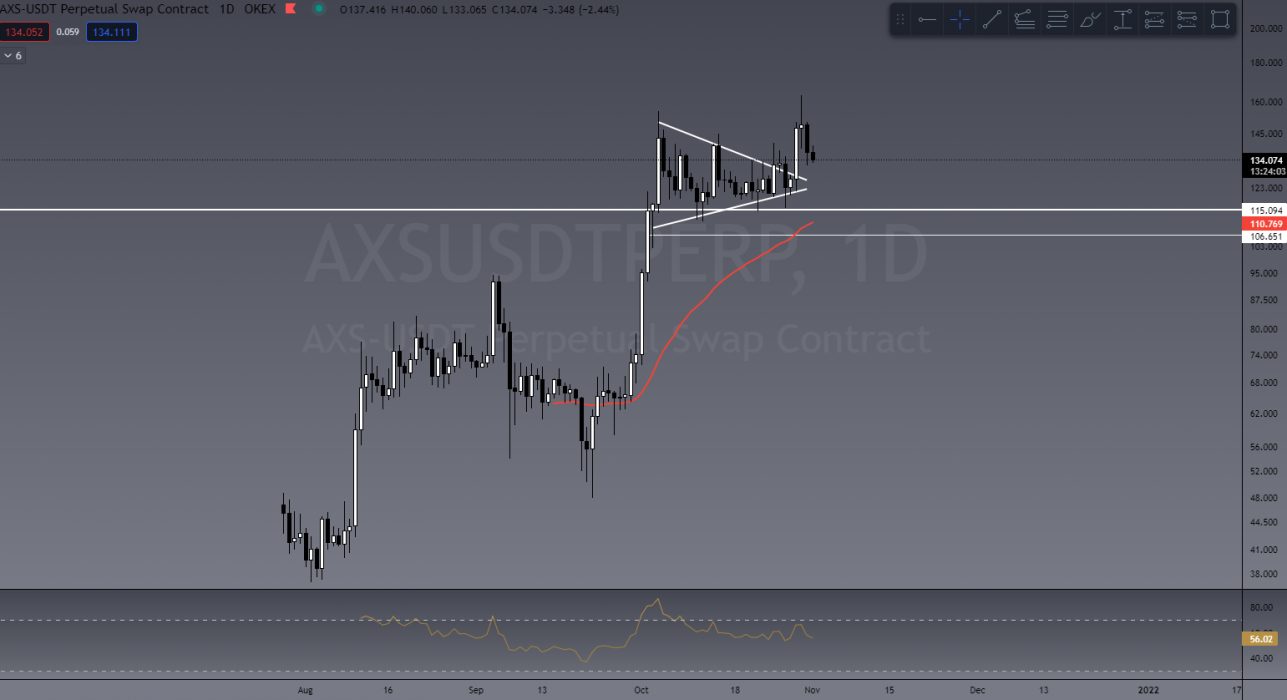
AXS/USDT

AXS is one we touched on in our market scan last Thursday as its be painting a daily symmetrical triangle. Again this shows good strength against BTC. AXS has since broken out and already achieved a 34% increase. Currently pulling back to test support and could present opportunity for a new entry.

Thursday TradeRoom Market scan
ALGO/USDT breaking out and retesting

Its important to remember that when trading ALT coins, their price action is heavily dependent on BTC. If BTC takes a bullish path ALTS will likely follow. If BTC turns bearish then ALTS will likely dump in price even harder!

If you would like to become a better trader, you are invited to join our TradeRoom where we share daily charts and market analysis. In our community we strongly encourage and teach correct risk management strategies to keep our members safe in this new volatile crypto market.

>> Take our Free Beginners’ Trading Course

>> Join our Trading Community for your 7 day free trial


The Crypto Den was created in 2017 to help the rapidly growing crypto community learn and understand the fundamentals of digital currencies and how to trade them. 

Since then we have taught thousands of members the basics of technical analysis and trading strategies to further progress and perfect their trading abilities.

In the TradeRoom you will be included in a supportive environment which encourages personal growth, education and community support.

It’s a place to share your trading ideas and follow other experienced traders’ feeds to help keep your finger on the pulse of such a volatile market!