Categories
Crypto News Market Analysis Ripple Trading

Breakout Analysis – XRP Pumps 69% in 7 days, here is why

The cryptocurrency XRP just went up over 69% in the past week. Let’s take a quick look at XRP, price analysis, and possible reasons for the recent breakout.

What is XRP?

Ripple (XRP) is one of the fastest and most scalable digital asset, enabling real-time global payments anywhere in the world.

XRP Price Analysis

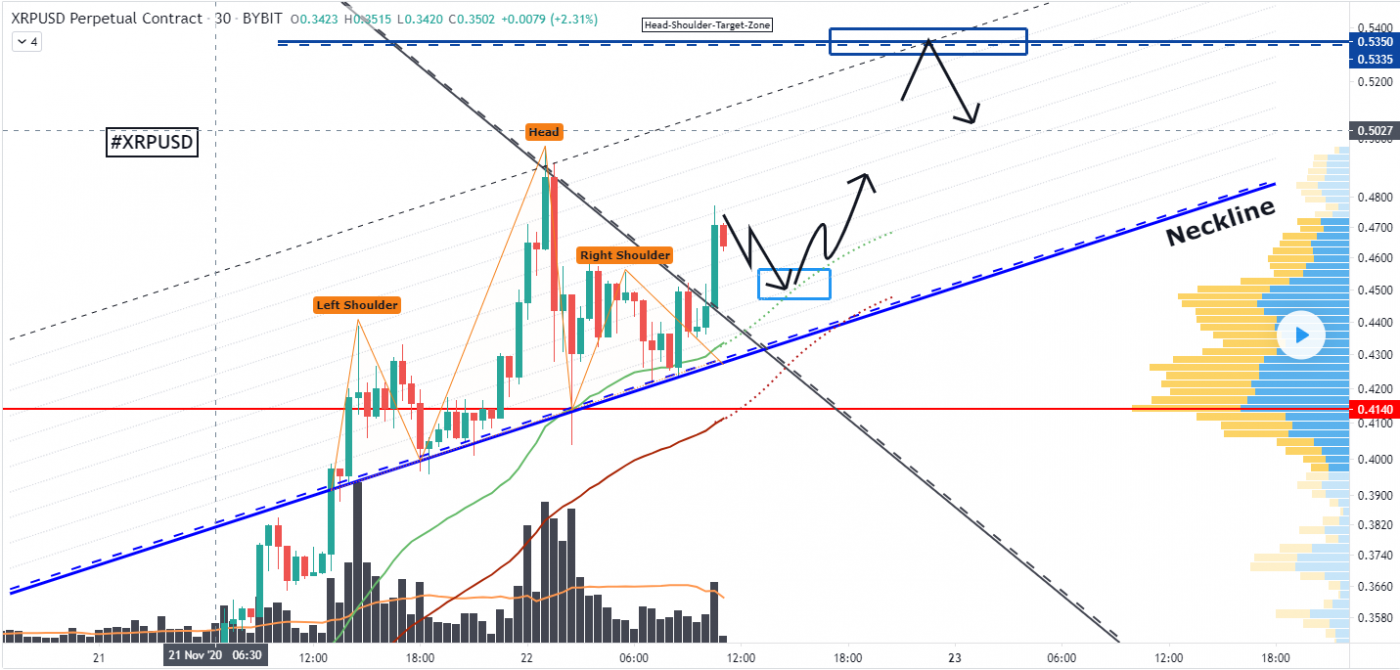
At the time of writing, XRP has ranked the 3rd cryptocurrency globally and the current price is $0.6266 AUD. This is a +69% increase since 11 November 2020 (12 days ago) as shown in the chart below.
Source: TradingView

For now, XRPUSD has formed some solid bullish signs not only on the higher timeframes but also on the 30-minute chart which is likely to be the origin for the suggested targets to reach within the upcoming schedule, the next times it is necessary to elevate how XRPUSD bounces within the blue cluster and emerges from there, when the bounce is solid and strong this will give a great origin for the upside targets to be reached, currently, XRPUSD is one of the greater bullish cryptocurrencies out there which is necessary to differentiate as the divergence between the currencies is increasing more and more.

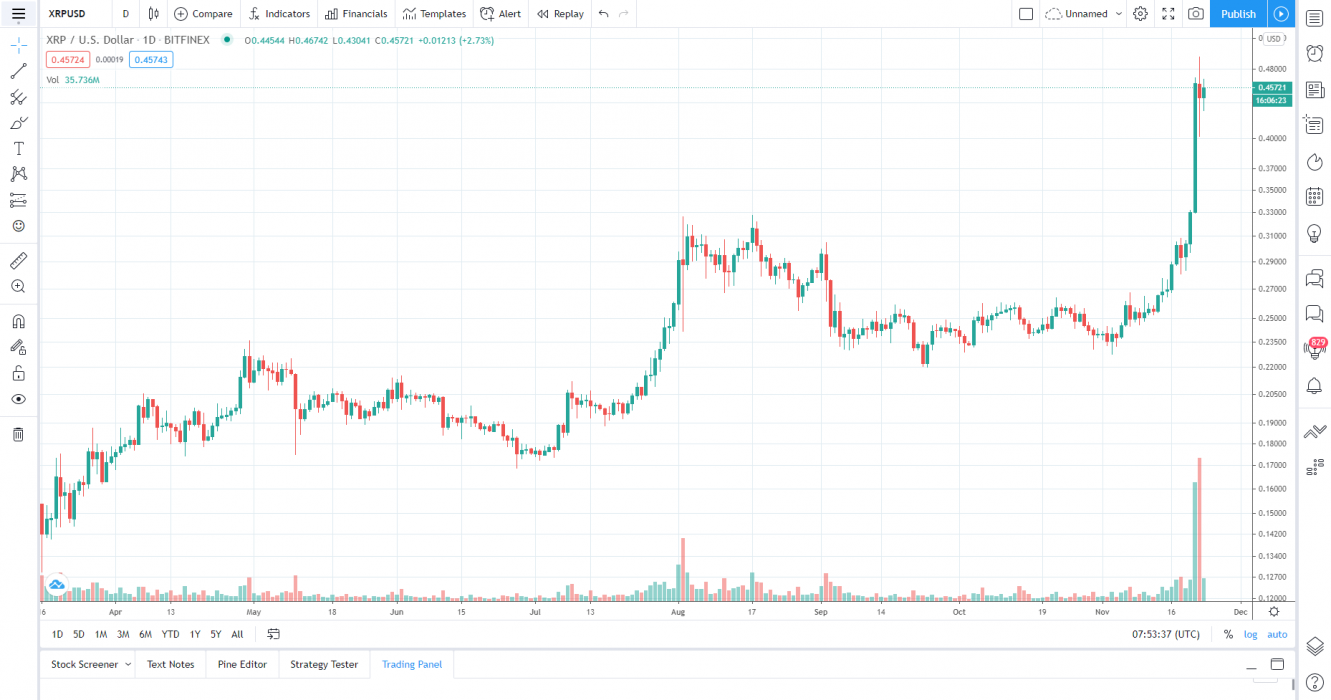
If we zoom out and take a look at the price over the past year or so with 1 day candle chart, we can see the recent breakout more clearly, the line is almost vertical which is insane.
Source: TradingView

So why did XRP breakout?

The recent rise in Bitcoin over 100% since the halving in May and then the suggested start of the Altcoin season could have contributed to the recent breakout. It could also be contributed to some of the recent events & news of XRP.

Ripple buybacks could be driving XRP price higher

During the third quarter of 2020, Ripple bought $45.5 million worth of XRP in a repurchasing program. The company described the initiative as a move to support healthy markets.

The sales summary listed on the Q3 2020 report detailed total purchases of $45.5 million. In previous quarters, Ripple did not repurchase XRP. The report reads:

“As indicated in the Q2 2020 XRP Markets Report, Ripple is purchasing – and may continue to purchase – XRP to support healthy markets.”

Recent XRP News & Events:

Where to Buy or Trade XRP?

XRP has the highest liquidity on Binance Exchange so that would help for trading XRP/USDT or XRP/BTC pairs. However, if you’re just looking at buying some quick and hodling then Swyftx Exchange is a popular choice in Australia.

Categories
Crypto News

WAVES Trading Analysis – Triple Breakout on WAVES/USDT Pair

Waves have already gone up over 134% this month, and the trading analysis suggests that there might be a third wave incoming. Let’s take a look at WAVES and what the charts are telling us.

What is Waves?

Waves is an open blockchain protocol and development toolset for Web 3.0 applications and decentralized solutions, aiming to raise the security, reliability, and speed of IT systems. It enables anyone to build their apps, fostering mass adoption of Blockchain

Waves Quick Stats

Symbol:WAVES
Global rank:32
Market cap:$1,010,711,125 AUD
Current price:$10.04 AUD
All time high price:$24.07 AUD
1 day:+15.25%
7 day:+67.71%
1 year:+1065.5%

Triple Breakout on WAVES/USDT Pair?

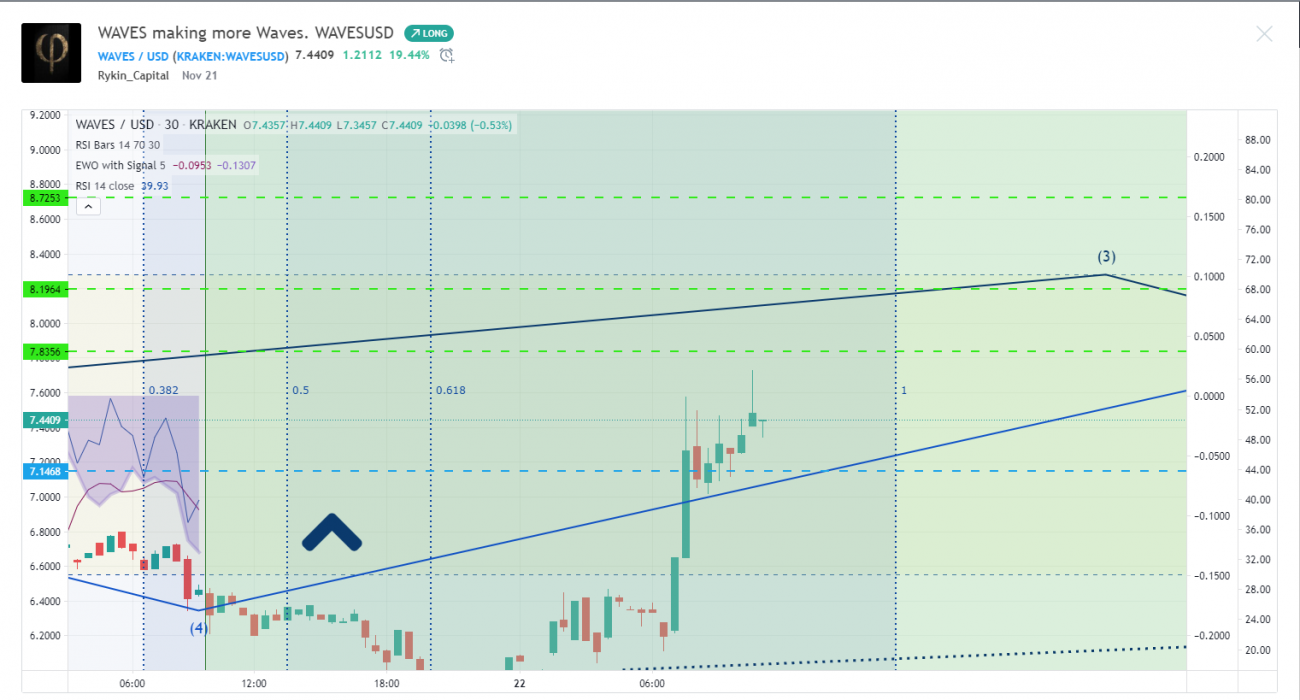
According to this chart, it looks like WAVES could be surpassing the triple breakout resistance on the USDT pair and the second major resistance is on the $8.07 price level.

TradingView chart by TG @CryptoCoinsCoach

This chart shows the parabolic trend of 30 min candle on the WAVES/USDT pair. The Price level at $8.7253 to be the final resistance for buyers.

The parabolic SAR indicator, developed by J. Wells Wilder, is used by traders to determine trend direction and potential reversals in price. … The parabolic SAR indicator appears on a chart as a series of dots, either above or below an asset’s price, depending on the direction the price is moving

Breaking $8.7253 Resistance Line Could Trigger the Third Wave

What do the technical indicators say?

The WAVES TradingView indicators (on the 1 day) mainly indicate WAVES as a Strong Buy, except the Oscillators which indicate WAVES as a Buy.

Recent WAVES News & Events

Where to Buy or Trade WAVES

WAVES has the highest liquidity on Binance Exchange so that would help for trading WAVES/USDT or WAVES/BTC pairs. However, if you’re just looking at buying some quick and hodling then Swyftx Exchange is a popular choice in Australia.

Conclusion

The trading charts suggest WAVES could be breaking the second major resistance on the USDT chart and the technical indicators suggest WAVES as a strong buy. The news about the cross-chain support on 3rd November was in hindsight a potential trigger of the first wave.

Categories
Crypto News

Bitcoin Dominance About to Break Support – XRP Leading the Way as Altcoin Season Starts

The altcoins have finally arrived at the Bull run party that Bitcoin initiated a couple of weeks ago, bringing back the memory of 2017.  Bitcoin’s bull rally started after the #1 BTC broke past the key resistance of $17,000 and $19,000 and is currently trading between $25,000 to $25,300 registering more than 18% gains over the week. Altcoins remained fairly quiet for the past weeks except for Litecoin which made 33% gains over the past week.

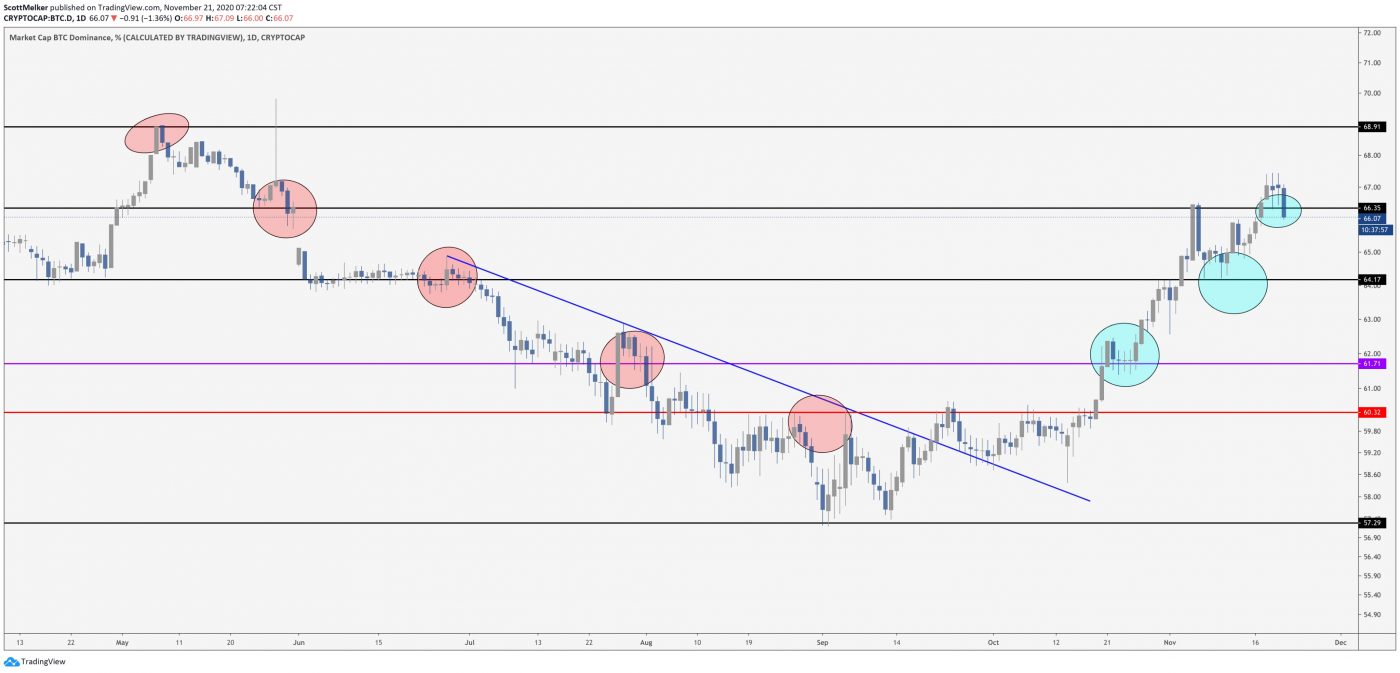
Bitcoin Dominance played a key factor in triggering the Alt Season where the Marketcap dominance of the Bitcoin broke below the key support of 66.37.

A Popular Twitter analyst who goes by the name of The Wolf of All Streets has predicted that if BTC breaks past its key support then it could be the Alt Season for 2020.

XRP Awakens From a Prolonged Winter Market

Source:- TradingView

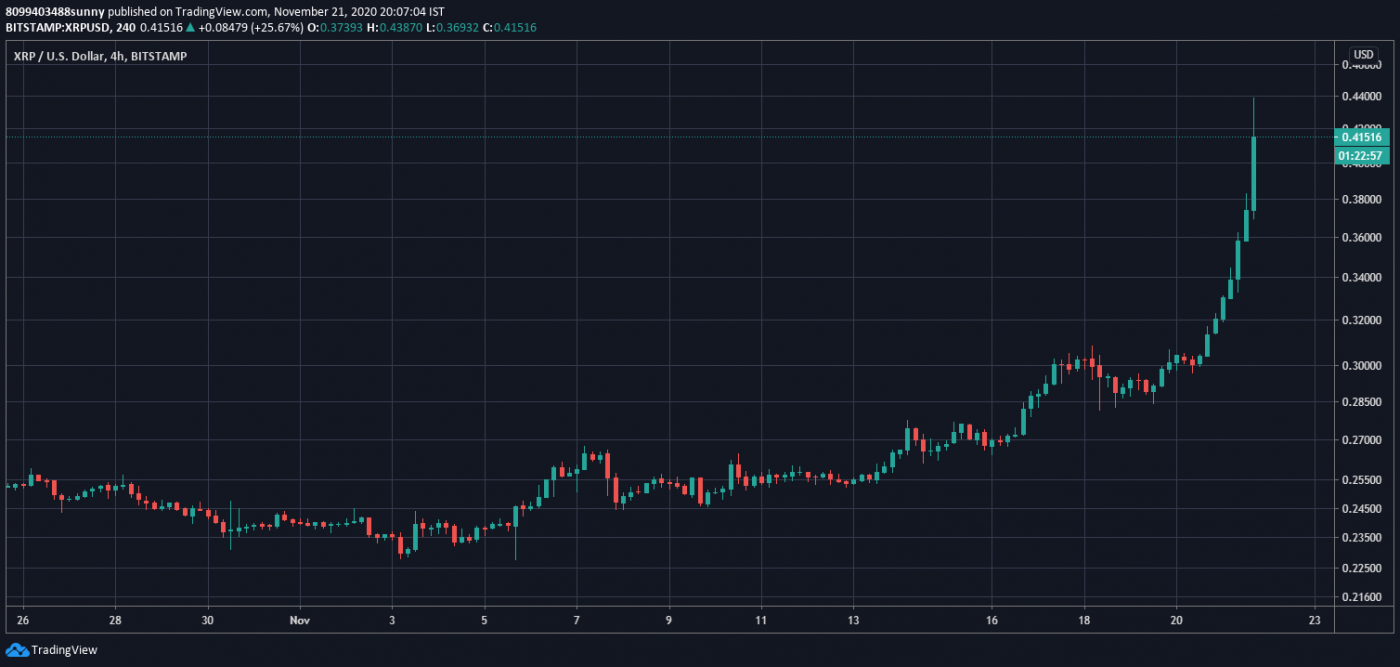
XRP, the third-largest cryptocurrency by market cap has become the biggest gainer for the day and even the week because of its mammoth rally of over 30% today to break past the key resistance of $0.40 to set a 52-week high of $0.4366.

What do the technical indicators say?

The  XRP TradingView indicators (on the 1 day) mainly indicate XRP as Strong Buy, except the Oscillators which indicate XRP as a buy.

This altcoin has remained quite inactive in terms of price movement over the past two years and failed to break past the psychological level of $0.30 even when other coins went through many price fluctuations. The third-largest cryptocurrency has made 53.25% gains over the past week.

Ethereum Price Peaks New Yearly Highs Other Altcoins Join The Bulls Too

Ethereum quite similar to bitcoin is recording new yearly highs after breaking past the key resistance of $500 and registering 2.5 years high. The second-largest cryptocurrency has even left bitcoin behind when it comes to year-to-date returns at over 284% returns against 155% for Bitcoin. Ethereum is currently trading at $531.02 with a 4.6% rise over the past 24-hours.

Apart from XRP and Ethereum, the biggest gainer among the top 10 coins is Cardano seeing a 16.1% rise over the past 24 hours followed by recently forked coin BCHABC with a 12.77% rise over the past 24 hours.

Where to Buy or Trade XRP?

XRP has the highest liquidity on Binance Exchange so that would help for trading XRP/USDT or XRP/BTC pairs. However, if you’re just looking at buying some quick and hodling then Swyftx Exchange is a popular choice in Australia.

Categories
Market Analysis Trading Waves

Breakout Analysis – WAVES Pumps 134% in 17 days, here is why

The cryptocurrency Waves just went up over 134% in the past couple of weeks. Let’s take a quick look at WAVES, price analysis and possible reasons for the recent breakout.

What is Waves?

Waves is an open blockchain protocol and development toolset for Web 3.0 applications allowing anyone to build their Blockchain decentralized apps (dapps).

Waves Price Analysis

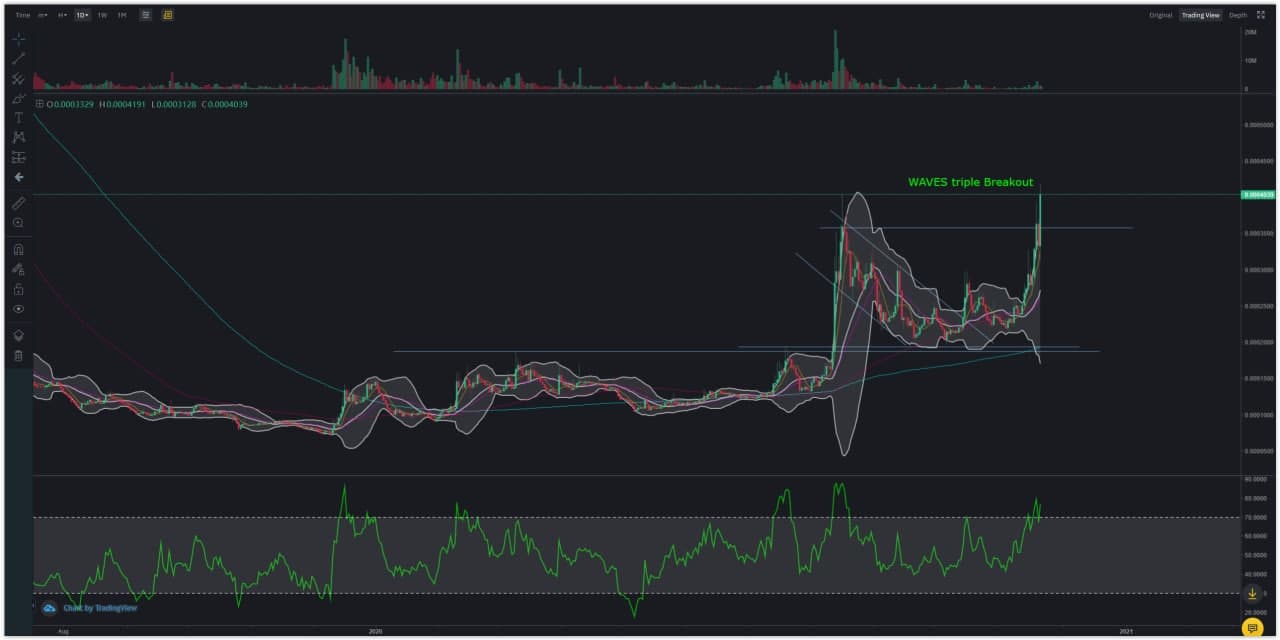
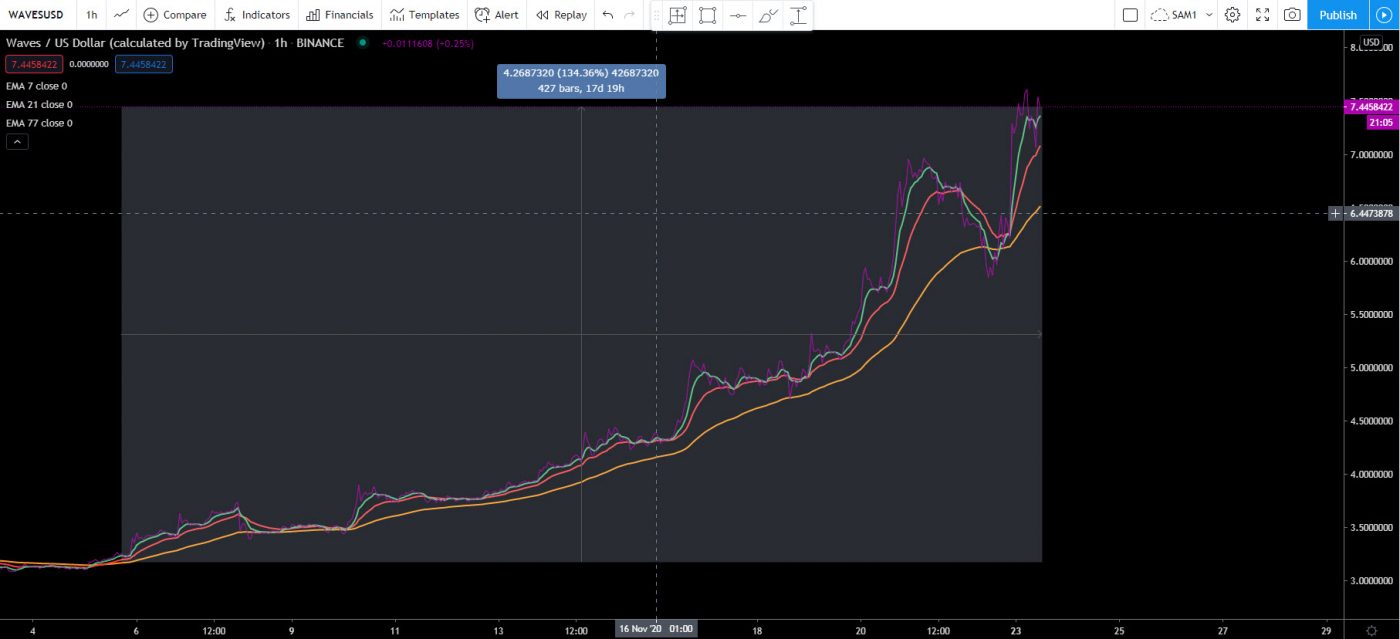
At the time of writing, WAVES is ranked the 32nd cryptocurrency globally and the current price is $10.21 AUD. This is a +134% increase since 05 November 2020 (17 days ago) as shown in the chart below.

Source: tradingview.com

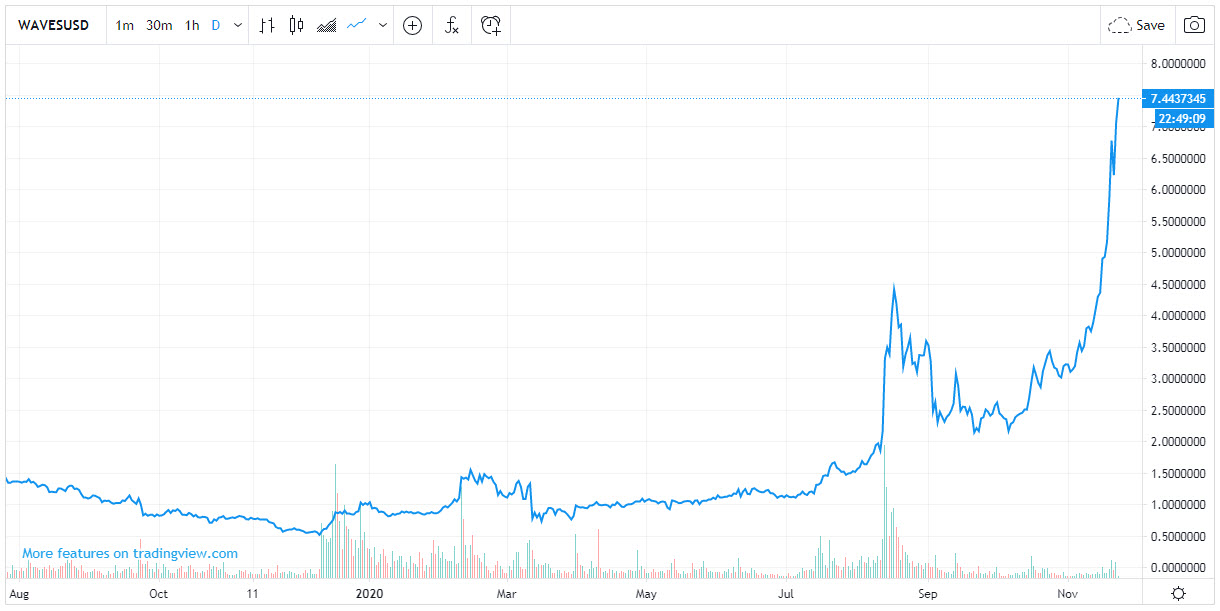
If we zoom out and take a look at the price over the past year or so, we can see the recent breakout more clearly, the line is almost vertical which is insane.

Source: tradingview.com

So Why did WAVES breakout?

​The recent rise in Bitcoin over 100% since the halvening in May and then the suggested start of the Altcoin season could have contributed to the recent breakout. It could also be contributed to some of the recent events where the WAVES project has made some partnerships and sidechain developments.

Recent WAVES News & Events:

The breakout started around 5th Nov, just 2 days after the news first surfaced on medium about the Blockchain IOST network is connecting the Gravity Network to support Cross-chain Functionality with Waves, Ethereum, and Tron.

The partnership with OKExChain announcement is pretty big news for the Waves protocol with regards to developing Distributed Ledger Tech (DLT) technology so this may have had an impact recently to keep the breakout going.

Where to Buy or Trade WAVES?

WAVES has highest liquidity on Binance Exchange so that would help for trading WAVES/USDT or WAVES/BTC pairs. However, if you’re just looking at buying some quick and hodling then Swyftx Exchange is a popular choice in Australia.


Categories
ChainLink Trading

ChainLink (LINK) Trading Analysis – Ascending Triangle Forming on LINKBTC

Chainlink [LINK] is a token based on Ethereum blockchain. The LINK Network provides smart contracts with data, bank payments and access to APIs. Let’s take a look at some current price analysis, indicator tools and trading techniques to form some hypothesis on whats happening.

ChainLink Quick Stats

Symbol:LINK
Global rank:5
Market cap:$7.3 Billion AUD
Current price:$18.85 AUD
All time high price:$27.21 AUD
1 day: +3.4%
7 day: +8.70%
1 year: +397%
Useful Links:Latest LINK News
Buy LINK on Swyftx
Trade LINK on Binance

Ascending Triangle Forming on LINKBTC?

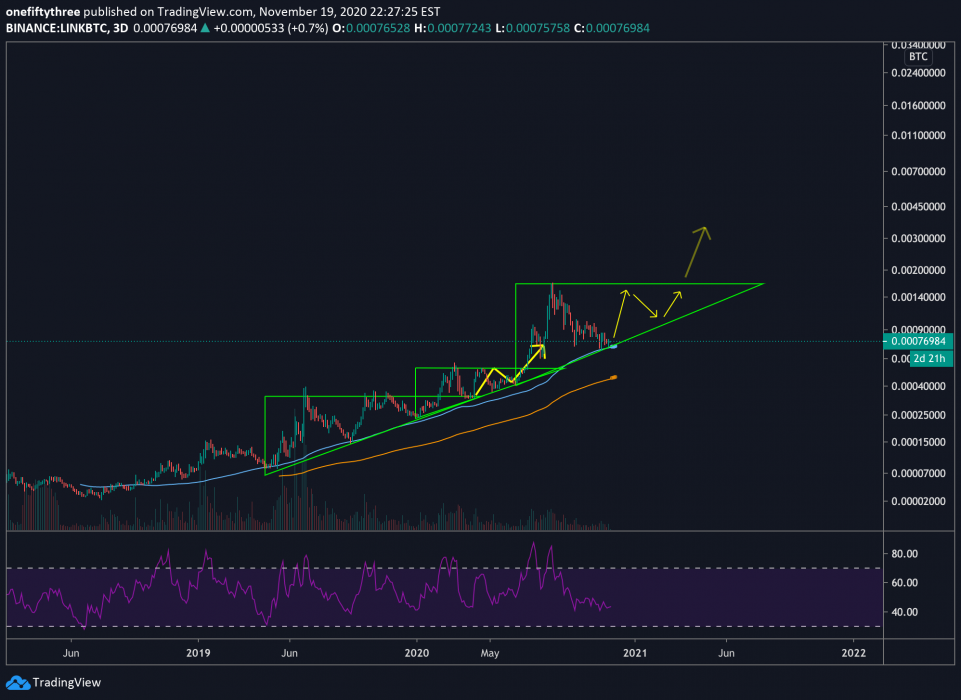
According to this chart, it looks like LINK could be forming another ascending triangle rise on the 3 day chart, resting on the 89 MA. An ascending triangle is a bullish chart pattern where the lines draw a triangle pattern in an uptrend.

Resistance Broken on LINKUSDT?

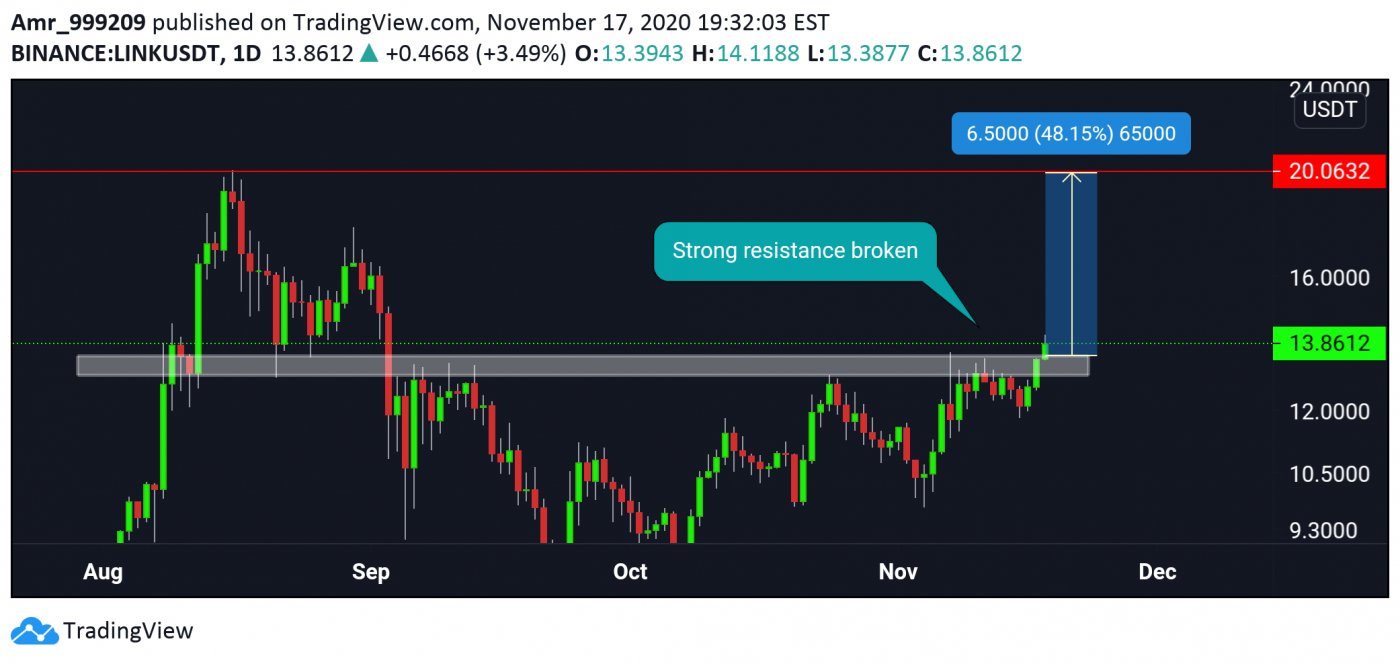
This chart shows LINK is to break strong resistance between at $13.5 and suggests it would go $20 USDT. A resistance line is where there is a growing number of sellers who wish to sell at that price.

What do the technical indicators say?

The LINK TradingView indicators (on the 1 day) mainly indicate LINK as a sell, except the Oscillators which indicate LINK as a buy.

Notable Recent ChainLink News

Where to Buy or Trade ChainLink

Buy LINK on Swyftx or Trade LINK on Binance

Conclusion

Some trading charts suggest LINK may go up, while some technical indicators suggest LINK may go down. The recent news on ChainLink is mostly positive which partnerships being made.