Categories
Crypto News Market Analysis Tezos Trading

Top 3 Coins To Watch Today: UNI, XTZ, BAND – September 2 Trading Analysis

Let’s take a closer look at today’s altcoins showing breakout signals. We’ll explain what the coin is, then dive into the trading charts and provide some analysis to help you decide.

1. Uniswap (UNI)

Uniswap UNI is a popular decentralised trading protocol known for its role in facilitating automated trading of decentralised finance (DeFi) tokens. Uniswap aims to keep token trading automated and completely open to anyone who holds tokens, while improving the efficiency of trading versus that on traditional exchanges. Uniswap creates more efficiency by solving liquidity issues with automated solutions, avoiding the problems which plagued the first decentralised exchanges.

UNI Price Analysis

At the time of writing, UNI is ranked the 11th cryptocurrency globally and the current price is A$41.28. Let’s take a look at the chart below for price analysis:

Source: TradingView

UNI‘s nearly 55% retracement from its early May high found a low near A$23.89 in late June before July’s bullish trend began. The price is currently approaching resistance at a swing high near A$43.57. If this level breaks, bulls might target the swing highs near A$47.19, A$48.67, and potentially up to A$50.22. Resistance near A$53.12 and A$56.81 could cap this move.

If the market remains bullish for the near term, bulls might buy at A$45.33. However, a stop run into A$37.74 could offer a higher probability entry. A steeper drop could reach below the swing low into possible support near A$34.17.

2. Tezos (XTZ)

Tezos XTZ is a blockchain network that’s based on smart contracts, in a way that’s not too dissimilar to Ethereum. However, there’s a big difference: Tezos aims to offer infrastructure that is more advanced – meaning it can evolve and improve over time without there ever being a danger of a hard fork. This is something both Bitcoin and Ethereum have suffered since they were created. People who hold XTZ can vote on proposals for protocol upgrades that have been put forward by Tezos developers.

XTZ Price Analysis

At the time of writing, XTZ is ranked the 34th cryptocurrency globally and the current price is A$7.24. Let’s take a look at the chart below for price analysis:

Source: TradingView

XTZ‘s chart paints a different picture to many other altcoins, with May’s high leading to a massive range before setting a low near A$3.15 in July.

The near 82% spike within two weeks at the beginning of August makes immediate bids questionable. However, the price may be finding support near A$6.89 and possibly near A$6.23. Since the price swept the impulse’s high at A$6.50, bulls might be waiting to enter near the swing low and gap near A$5.88, or slightly lower near A$5.12.

Little resistance lies overhead, although some might exist between A$7.55 and approximately A$7.79, just above the current price. A sweep and rejection of the high near A$8.27 would make most areas of possible support highly suspect and could mark the end of the bullish trend.

3. Band Protocol (BAND)

Band Protocol BAND is a cross-chain data oracle platform that is able to take real-world data and supply it to on-chain applications, while also connecting APIs to smart contracts to facilitate the exchange of information between on-chain and off-chain data sources. BAND is the native token of the Band Protocol ecosystem and is used as collateral by validators involved in fulfilling data requests, as well as being the main medium of exchange on BandChain, used to paying for private data.

BAND Price Analysis

At the time of writing, BAND is ranked the 156st cryptocurrency globally and the current price is A$13.29. Let’s take a look at the chart below for price analysis:

Source: TradingView

Like many other altcoins, BAND set a high around mid-April before retracing 83% to the low at A$7.89 in June.

Price broke through resistance near A$11.48, which may mark an area of possible support on a retracement. If this support fails, bulls might also step in near A$11.26. However, a drop this far increases the chances of a stop run to A$10.91 and possibly into support near A$10.23. For now, continuing bullish market conditions could help A$12.37 become support.

The swing high around A$15.66 gives bulls a reasonable first target, with A$15.84 also likely to draw the price upward. Higher-timeframe resistance beginning near A$16.58 or A$17.00 could cap the move or trigger consolidations. If bullish market conditions continue, bulls might test probable resistance near A$17.52.

Where to Buy or Trade Altcoins?

These coins have high liquidity on Binance Exchange, so that could help with trading on AUD/USDT/BTC pairs. And if you’re looking at buying and HODLing cryptos, then Swyftx Exchange is an easy-to-use popular choice in Australia.

Categories
Crypto News Ethereum Classic Market Analysis Stellar Trading

Top 3 Coins To Watch Today: WIN, ETC, XLM – September 1 Trading Analysis

Let’s take a closer look at today’s altcoins showing breakout signals. We’ll explain what the coin is, then dive into the trading charts and provide some analysis to help you decide.

1. Wink Link (WIN)

The first TRON ecosystem comprehensive oracle Wink Link WINK fully integrates the real world with the blockchain space. It will be able to provide reliable, unpredictable and verifiable random numbers, and fully restore trust and improve user experience by tapping into data, events, and payment systems, etc, from the real world. The WINK team completed the acquisition of justlink.io on April 26, 2021, and WINkLink becomes the first TRON ecosystem comprehensive oracle. WIN, a TRON-based TRC20 token, will be the governance token of the WINkLink oracle network.

WIN Price Analysis

At the time of writing, WIN is ranked the 134th cryptocurrency globally and the current price is A$0.0008757. Let’s take a look at the chart below for price analysis:

Source: TradingView

WIN‘s nearly 83% drop from its April highs found a low near A$0.0005285 in July before closing over a short-term high around A$0.0009247 last week.

This daily close over the high could signal a shift in market structure that may reach probable resistance near A$0.0009823. A sustained bullish move may target the swing high at A$0.001057. If this stop run occurs, a run beyond the high into probable resistance near A$0.001146 and A$0.001209 is possible.

Bulls could buy a retracement to possible support near A$0.0008176, just above the August monthly open. A bearish turn in the marketplace may propel the price toward possible support near A$0.0007644. 

However, relatively equal lows near A$0.0007296 and A$0.0006988 provide an attractive target for bears if the market resumes its bearish trend. A run on these lows might find support between A$0.0006735 and A$0.0006374.

2. Ethereum Classic (ETC)

Ethereum Classic ETC is a hard fork of Ethereum (ETH) that launched in July 2016. Its main function is as a smart contract network with the ability to host and support decentralised applications (DApps). Its native token is ETC. Since its launch, Ethereum Classic has sought to differentiate itself from Ethereum; Ethereum Classic’s main aim is to preserve the Ethereum blockchain as it originally was, without artificially countering the DAO hack.

ETC Price Analysis

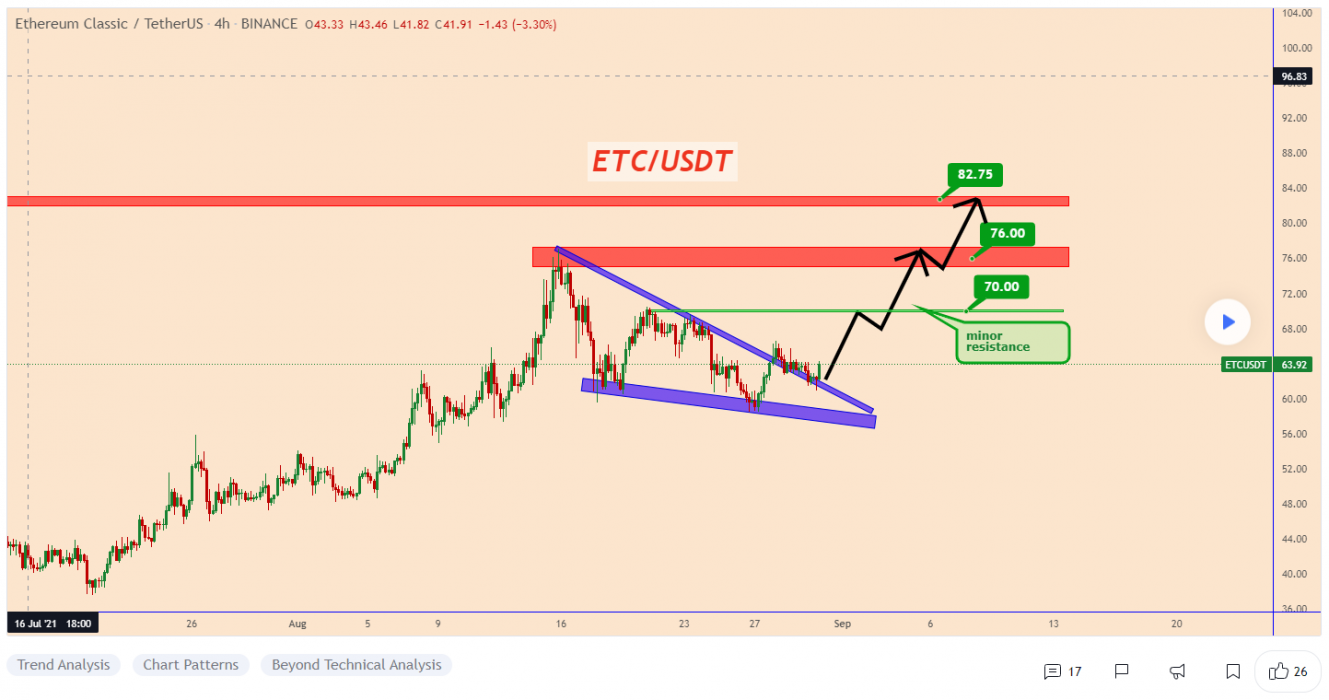
At the time of writing, ETC is ranked the 20th cryptocurrency globally and the current price is A$87.95. Let’s take a look at the chart below for price analysis:

Source: TradingView

ETC‘s massive May spike retraced near A$55.36 into the consolidation that began the impulse before bouncing to A$61.47.

This consolidation could provide support again, although bears would first have to push the price through possible support near A$83.25. The market’s structure may be shifting bearish, with A$78.14 likely to provide some resistance if this is the case. A sustained bearish move could reach the swing low near A$73.98 before finding support near A$68.29.

However, the bullish higher-timeframe trend may prevail, with relatively equal highs near A$98.66 potentially providing an attractive target to lure the price over the monthly open. If so, the price could reach for the midpoint of the massive May wick near A$108.63.

3. Stellar (XLM)

Stellar XLM is an open network that allows money to be moved and stored. When it was released in July 2014, one of its goals was boosting financial inclusion by reaching the world’s unbanked, but soon afterward its priorities shifted to helping financial firms connect with one another through blockchain technology. The network’s native token, lumens, serves as a bridge that makes it less expensive to trade assets across borders. All of this aims to challenge existing payment providers, who often charge high fees for a similar service.

XLM Price Analysis

At the time of writing, XLM is ranked the 21st cryptocurrency globally and the current price is A$0.484. Let’s take a look at the chart below for price analysis:

Source: TradingView

XLM set a high near A$0.9156 in May before retracing nearly 83% to find a low near A$0.3266. The price consolidated around this level before the strong bullish impulse during the past several weeks.

Probable resistance near A$0.4955 is slowing the bullish advance down. However, another leg might target the last swing high at A$0.5368 and relatively equal highs at A$0.5844. Resistance near A$0.6155 could cap the move before the second swing high. Beyond these levels, little stands in the bulls’ way before reaching the swing high near A$0.6514.

A retracement before a move higher may find support in the daily gap near A$0.4375, just above the August monthly open. Relatively equal lows near A$0.3845 could also provide support. Run-on stops at A$0.3597 and A$0.3359 might find support in the gap beginning near A$0.2815 or a high-timeframe level near A$0.3169.

Where to Buy or Trade Altcoins?

These coins have high liquidity on Binance Exchange, so that could help with trading on AUD/USDT/BTC pairs. And if you’re looking at buying and HODLing cryptos, then Swyftx Exchange is an easy-to-use popular choice in Australia.

Categories
Crypto News ICON Market Analysis Trading Zilliqa

Top 3 Coins To Watch Today: ICX, RAY, ZIL – August 31 Trading Analysis

Let’s take a closer look at today’s altcoins showing breakout signals. We’ll explain what the coin is, then dive into the trading charts and provide some analysis to help you decide.

1. ICON (ICX)

ICON ICX is a decentralised blockchain network focused on interoperability. With ICON’s “blockchain transmission protocol”, independent blockchains like Bitcoin and Ethereum can connect and transact with each other. This opens up cross-chain use cases that are impossible without an interoperability layer such as ICON. The ICON blockchain is powered by loopchain, a blockchain engine designed by ICONLOOP.

ICX Price Analysis

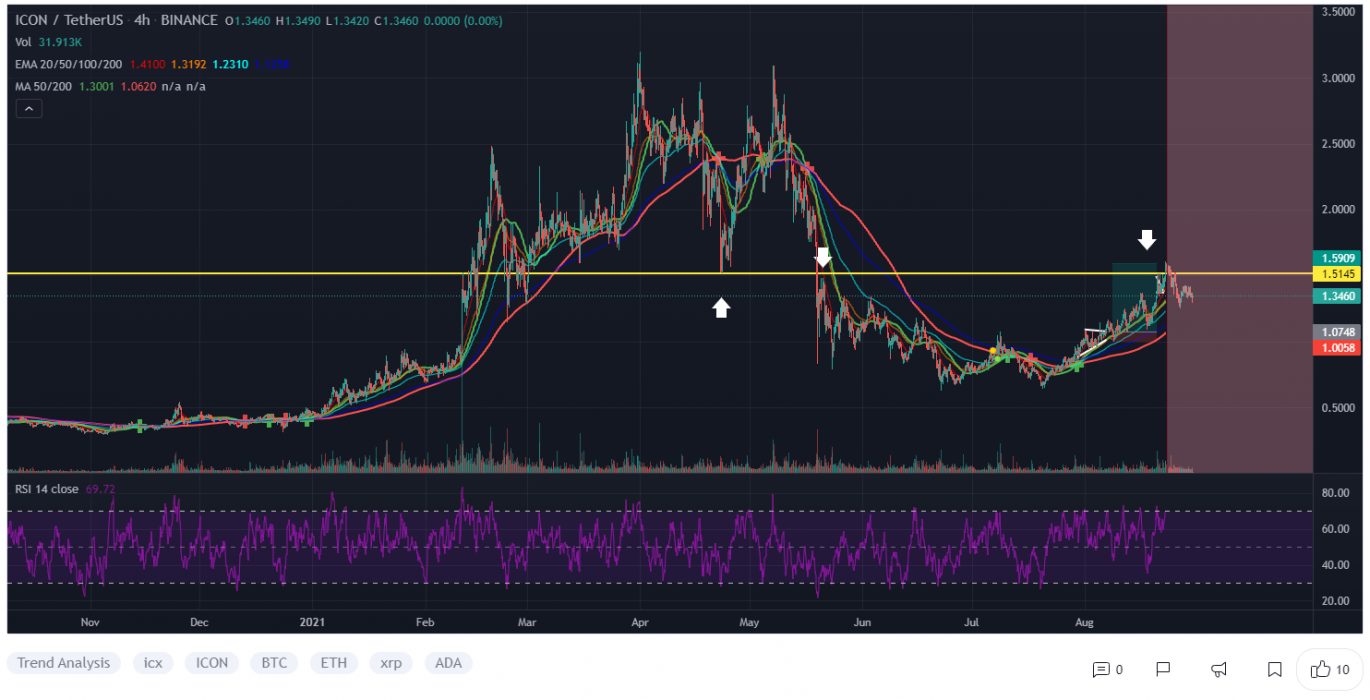
At the time of writing, ICX is ranked the 104th cryptocurrency globally and the current price is A$1.85. Let’s take a look at the chart below for price analysis:

Source: TradingView

During August, ICX broke several swing highs that could be the signal for a new bullish trend.

Last week’s break of the most recent swing low could suggest some downside in the short term. It formed probable resistance near A$1.93 and may target the swing low and possible support near A$1.72.

The swing low and possible support near A$1.48 could be the second bearish target if the move down continues. The relatively equal lows near A$1.38 and possible support underneath, near A$1.29, could provide more substantial support.

The last swing high near A$2.21 gives a near-term target if bullish continuation continues. However, resistance beginning around A$2.24 could cap this move. A break of this resistance might continue to probable resistance near A$2.93 and reach above the cluster of relatively equal highs near A$3.13.

2. Raydium (RAY)

Raydium RAY is an automated market maker AMM and liquidity provider built on the Solana blockchain for the Serum decentralised exchange DEX. Unlike any other AMMs, Raydium provides on-chain liquidity to a central limit orderbook, meaning that funds deposited into Raydium are converted into limit orders which sit on Serum’s orderbooks. This gives Raydium LPs access to all of Serum’s order flow as well as their existing liquidity.

RAY Price Analysis

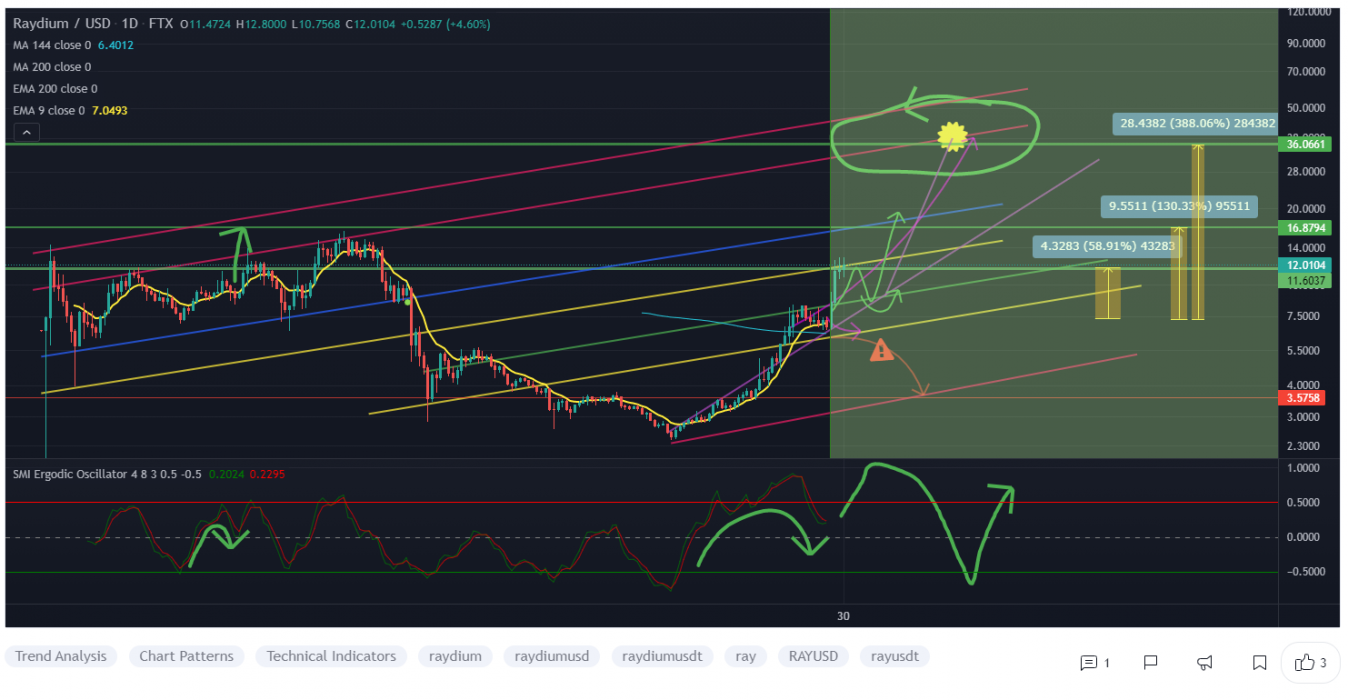
At the time of writing, RAY is ranked the 220th cryptocurrency globally and the current price is A$16.46. Let’s take a look at the chart below for price analysis:

Source: TradingView

Mid-July marked a turning point for RAY, with the price rocketing up almost 425% from its lows to probable resistance beginning near A$17.58.

The price is currently struggling with the area between A$11.75 and A$15.39. This region could provide support after a close above, or resistance after a close below. 

A retracement could reach into the daily gap and possible support around A$13.94. A more bearish shift in the marketplace will likely aim for the relatively equal lows near A$9.17, and the potential support just below that begins around A$8.88.

Continuation to the upside will likely target the all-time high near A$22.34. However, probable resistance beginning at A$17.58 and A$20.82 could cap or slow down this move.

3. Zilliqa (ZIL)

Zilliqa ZIL is a public, permissionless blockchain that is designed to offer high throughput with the ability to complete thousands of transactions per second. It seeks to solve the issue of blockchain scalability and speed by employing sharding as a second-layer scaling solution. The platform is home to many decentralised applications, and it also allows for staking and Yield farming. The native utility token of Zilliqa, ZIL, is used to process transactions on the network and execute smart contracts.

ZIL Price Analysis

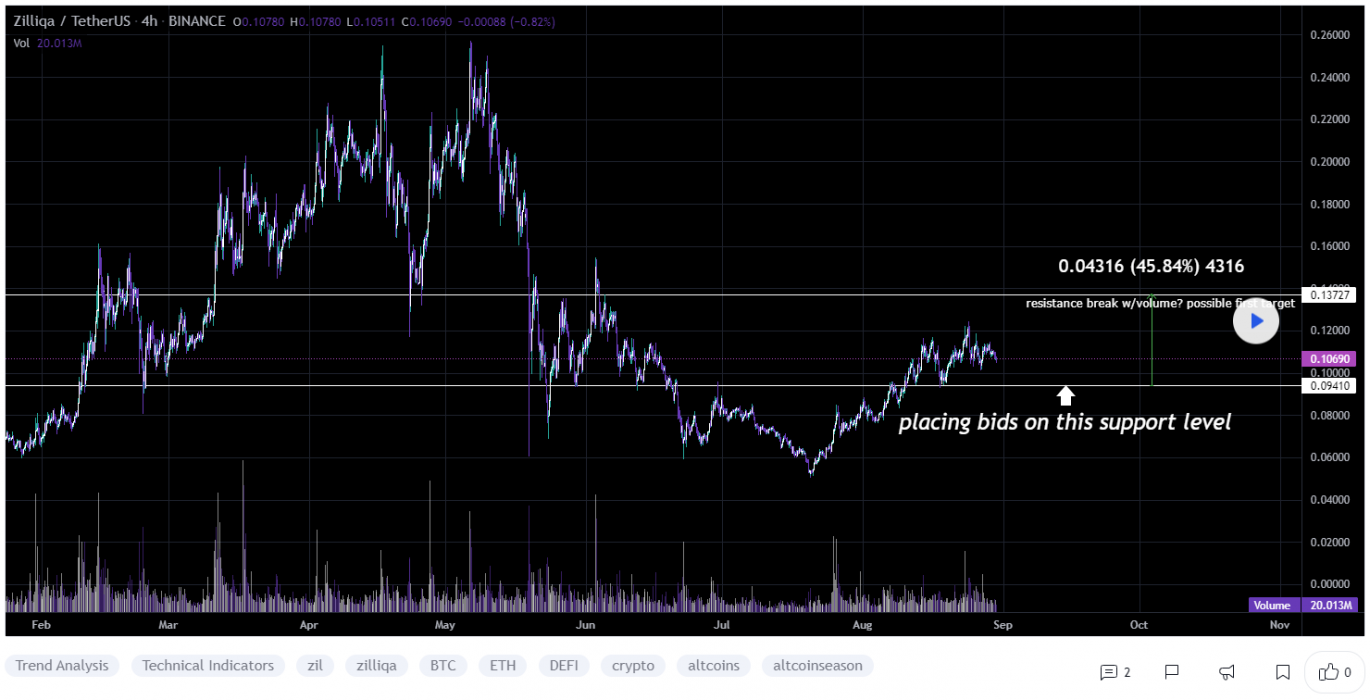
At the time of writing, ZIL is ranked the 84th cryptocurrency globally and the current price is A$0.1489. Let’s take a look at the chart below for price analysis:

Source: TradingView

In mid-July, ZIL also turned the corner, breaking a key swing high in early August. This move could suggest a longer-term bullish trend.

The swing high near A$0.2155 stands out as a bullish target and marks an area of probable resistance. Further continuation could reach into possible resistance starting near A$0.2603.

Even if the bullish trend continues, a stop run at the recent swing low near A$0.1473 into possible support beginning near A$0.1496 is reasonable. If the price reaches further down, the swing low and possible support near A$0.1154 might provide another downside target. 

The area near A$0.08936 could also provide support. However, a drop this far could suggest a stop run below the higher-timeframe relatively equal lows near A$0.07142 into possible support beginning around A$0.06199.

Where to Buy or Trade Altcoins?

These coins have high liquidity on Binance Exchange, so that could help with trading on AUD/USDT/BTC pairs. And if you’re looking at buying and HODLing cryptos, then Swyftx Exchange is an easy-to-use popular choice in Australia.

Categories
Crypto News Market Analysis Trading

MBOX Token Surges 160% After Listing on Binance Staking Launchpool

After the launch of MoBox on Binance Staking Launchpool, MBOX took a strong breakout with +160% gains in a week. Let’s take a quick look at MBOX, its price analysis, and possible reasons for the recent breakout.

What is MoBox?

MoBox MBOX is an NFT gaming ecosystem built on Binance Smart Chain, a community-driven platform empowering users by rewarding them for their engagement and enjoyment. It combines yield farming in DeFi with gaming NFTs, creating a free-to-play, play-to-earn gaming model. MOBOX Platform combines DeFi and Gaming NFT, creating a truly free-to-play and play-to-earn ecosystem.

MBOX Price Analysis

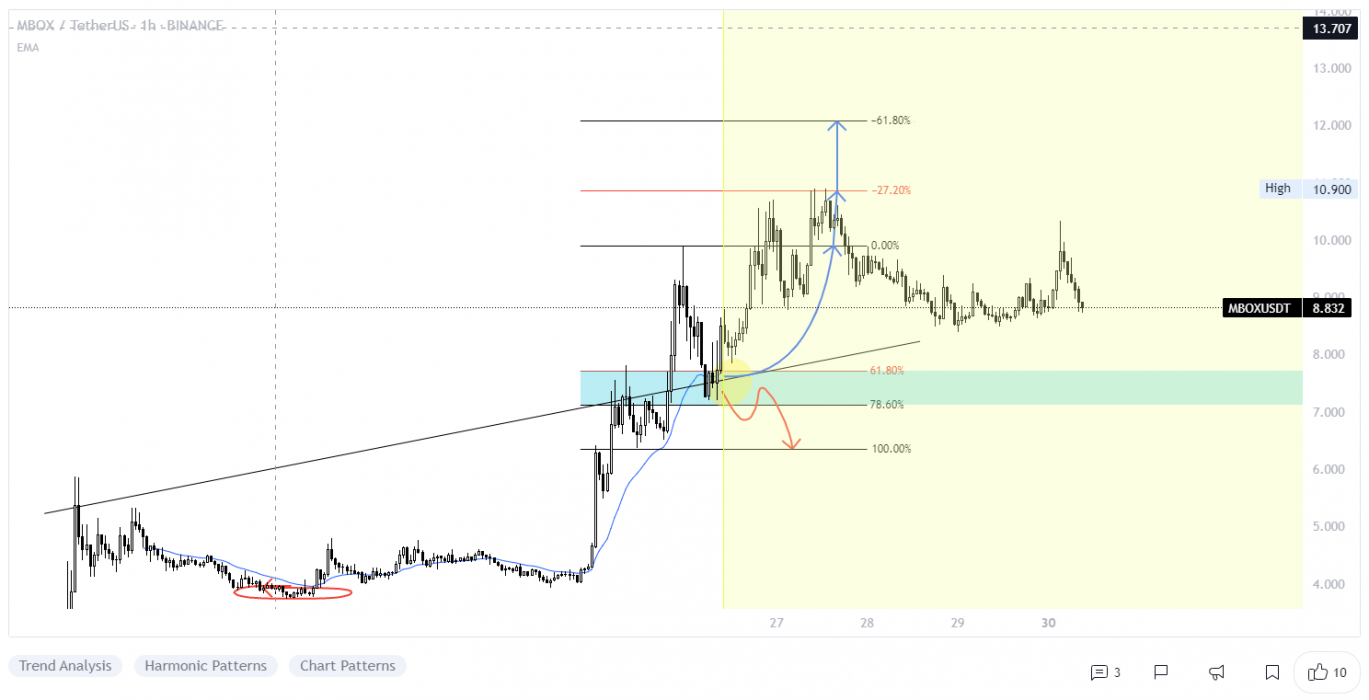
At the time of writing, MBOX is ranked the 219th cryptocurrency globally and the current price is A$12.21. This represents a +760% increase since the launch of its ICO at Binance Launchpad on (August 21, 2021). Have a look at the chart below for price analysis.

Source: TradingView

After the launch of MBOX on Binance Staking Launchpool, it pumped up to A$13.80 having +160% gains in a week, and the initial opening price of MBOX was A$2.74 at Binance Exchange with many different trading pairs such as MBOX/BTC, MBOX/USDT, and MBOX/BNB.

Currently, MBOX is trading at A$12.25 price levels after breaking out the squeeze resistance in its sideways trend and is now heading towards its all-time high price.

What Do the Technical Indicators Say?

The MBOX TradingView indicators (on the 1 day) mainly indicate MBOX as a strong buy, except the Moving Averages which indicate MBOX as a buy.

So Why Did MBOX Breakout?

After the MBOX opening at Binance Staking Launchpool, mostly ICOs pump after going live on exchange for trade, and general market sentiment seems to suggest cryptos are hopefully turning back bull run season after recent massive price corrections. And then the suggested start of the Altcoins season could have contributed to the recent breakout. It could also be attributed to some recent news regarding the Binance Launchpool Listing.

Where to Buy or Trade MBOX?

MoBox has the highest liquidity on Binance Exchange, so that would help for trading MBOX/BTC, MBOX/BNB, or MBOX/USDT pairs. However, you can also buy MBOX from different exchanges listed on Coinmarketcap.

Categories
Aion Crypto News Market Analysis Trading

Top 3 Coins To Watch Today: AION, REN, SUSHI – August 30 Trading Analysis

Let’s take a closer look at today’s altcoins showing breakout signals. We’ll explain what the coin is, then dive into the trading charts and provide some analysis to help you decide.

1. Aion (AION)

AION is the token used to secure and access the Open Application Network (OAN). The OAN is a public network available to everyone. Managed by The Open Foundation, a registered not-for-profit organisation, OAN aims to give the public an environment to create Open Apps. By making the AION token the core of the network, OAN enables users to execute smart contracts, store data and share it between different networks.

AION Price Analysis

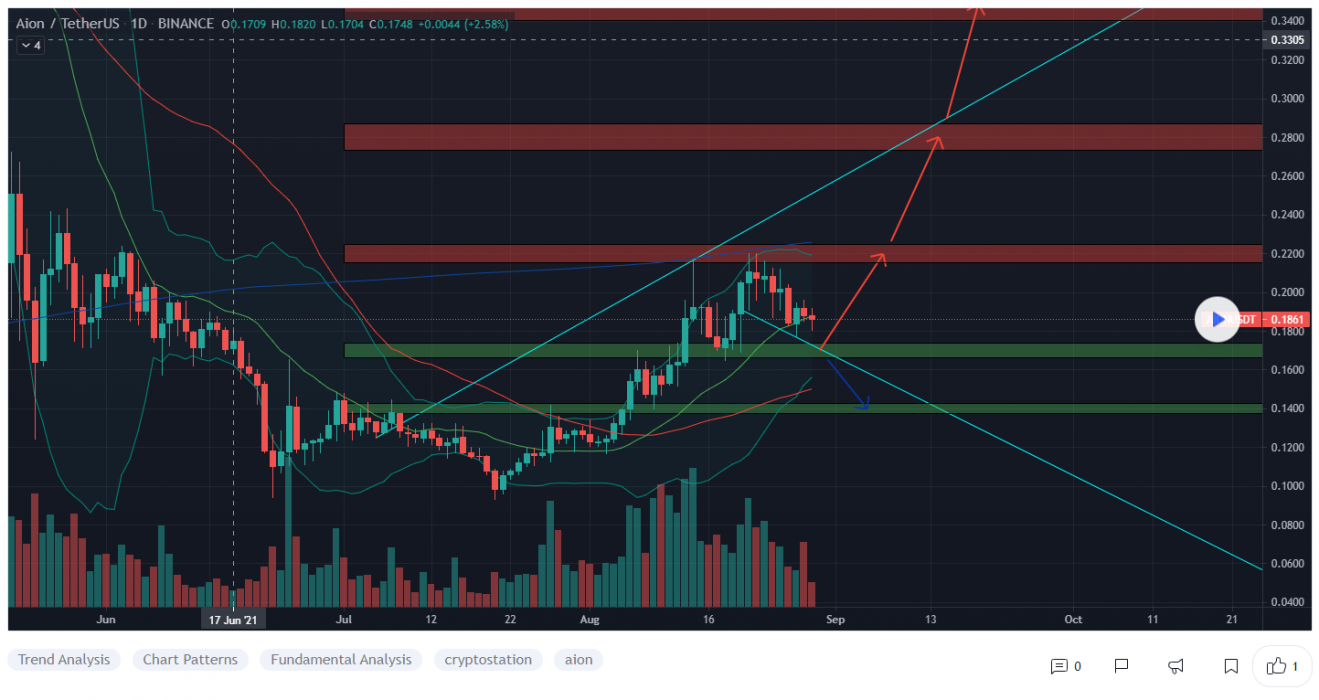
At the time of writing, AION is ranked the 394th cryptocurrency globally and the current price is A$0.2542. Let’s take a look at the chart below for price analysis:

Source: TradingView

After a 61% decline from May to June, AION has ranged between A$0.2471 and A$0.1833.

The recent rally is approaching probable resistance near A$0.3347 but could be aiming for stops above the relatively equal highs near A$0.2849. Continuation of the bullish move could target the daily gap near A$0.3095.

Aggressive bulls might add to positions near A$0.2411 and A$0.2347. Price action near A$0.2041 may be more likely to provide support – if the price reaches that mark – during any retracements.

Relatively equal lows clustered around A$0.1800 seem likely to be swept if the bearish trend resumes. If this move occurs, the price might find support at the significant higher-timeframe level near A$0.1638.

2. Ren (REN)

REN is an open protocol built to provide interoperability and liquidity between different blockchain platforms. The protocol’s native token, REN, functions as a bond for those running nodes which power RenVM, known as Darknodes. Ren aims to expand the interoperability, and hence accessibility, of decentralised finance (DeFi) by removing hurdles involved in liquidity between blockchains.

REN Price Analysis

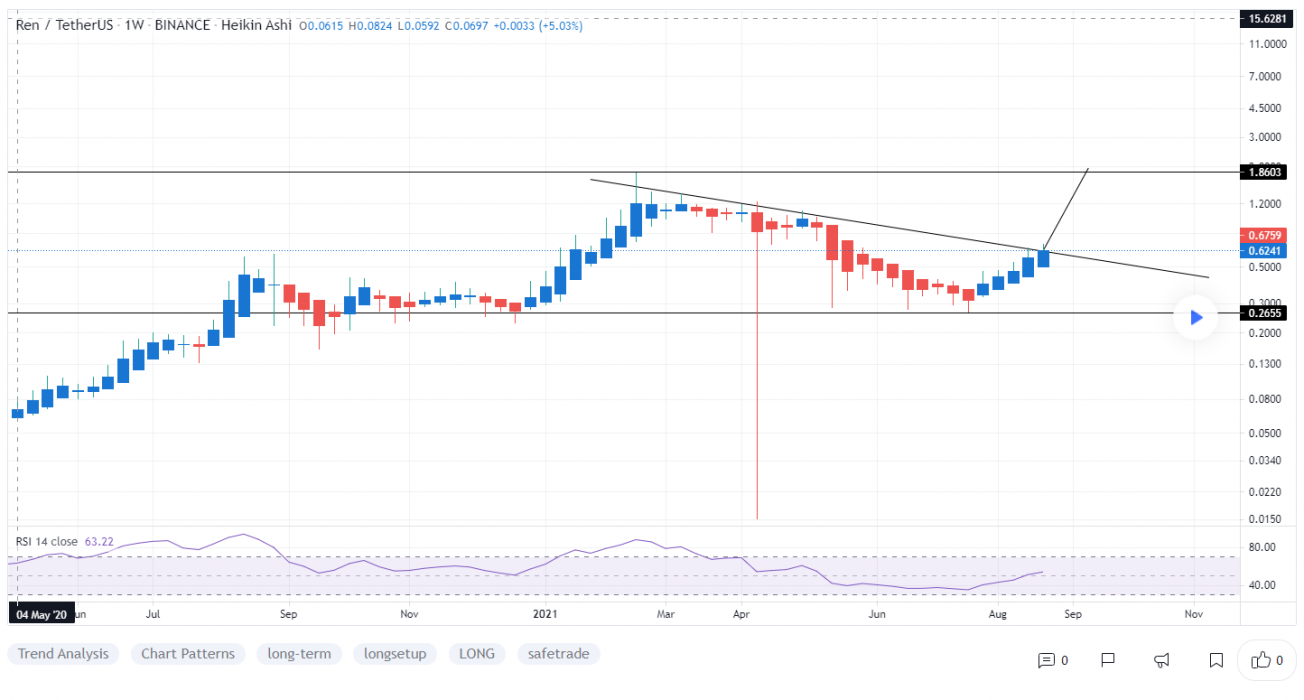
At the time of writing, REN is ranked the 114th cryptocurrency globally and the current price is A$0.9304. Let’s take a look at the chart below for price analysis:

Source: TradingView

REN’s 82% retracement from its February highs set a low near A$0.4287 during its consolidation that began in mid-June.

Relatively equal highs near $0.9956 could be the current target if the price breaks through resistance beginning near A$1.08. Bullish continuation might reach through the next significant swing high near A$1.18 into the daily gap near A$1.25.

If bullish strength continues, the zones just below the monthly open near A$1.34 and A$1.42 could halt any retracement. 

A bearish shift in the market might seek the relatively equal lows near A$0.8944 into possible support near A$0.8256. If this down move occurs, the swing low near A$0.7759 and possible support near A$0.7106 may be the primary objective.

3. SushiSwap (SUSHI)

SushiSwap SUSHI is an example of an automated market maker (AMM). An increasingly popular tool among cryptocurrency users, AMMs are decentralised exchanges that use smart contracts to create markets for any given pair of tokens. SushiSwap aims to diversify the AMM market and also add features not previously present on Uniswap, such as increased rewards for network participants via its in-house token, SUSHI.

SUSHI Price Analysis

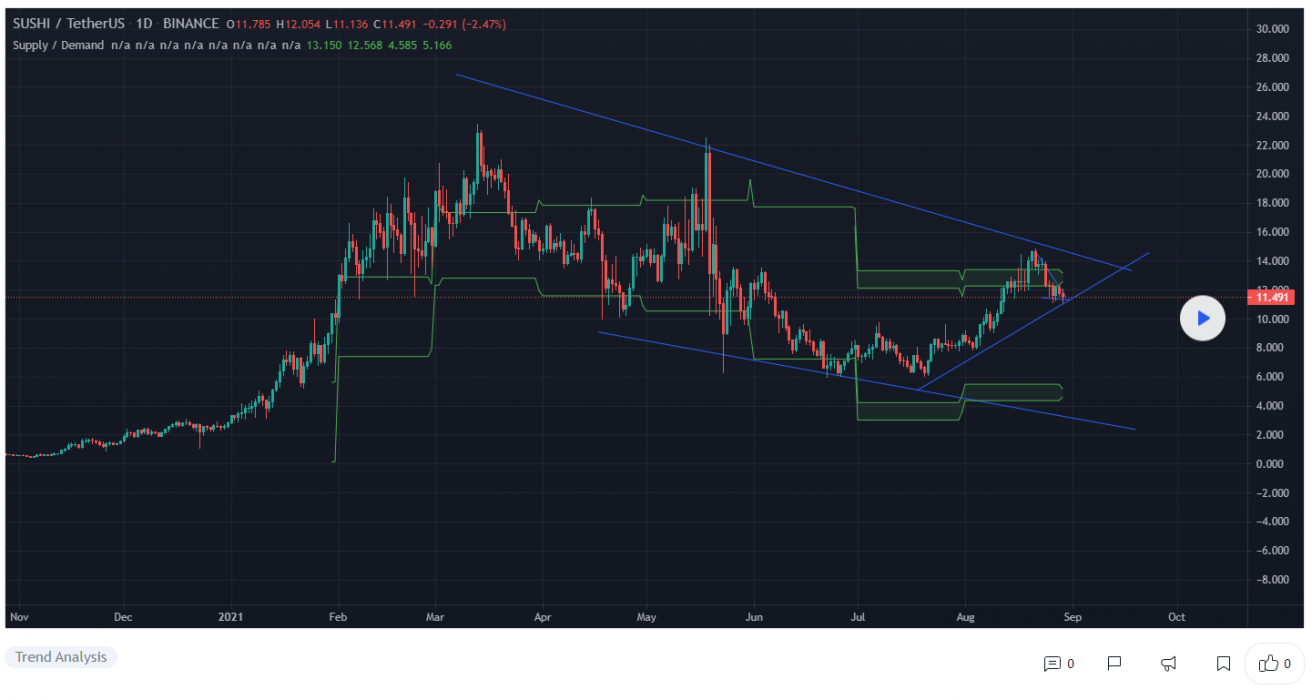
At the time of writing, SUSHI is ranked the 73rd cryptocurrency globally and the current price is A$15.70. Let’s take a look at the chart below for price analysis:

Source: TradingView

After retracing nearly 75% from its May high, SUSHI set a low near A$10.59 as it formed its current range.

Last week, the price swept highs near A$19.24, which now also marks the August monthly high. Relatively equal daily highs near A$21.68 provide a reasonable target, although resistance beginning near A$22.47 could cap the move. A break of this resistance is likely to target the swing high near A$23.18 into higher-timeframe resistance beginning near A$25.09.

The current area near A$14.17 could provide support, although bulls may be more likely to buy near the price fractal near A$13.27 if a retracement reaches this level. A break of this area could continue down to sweep the July low near A$12.08 into possible support beginning near A$10.95.

Where to Buy or Trade Altcoins?

These coins have high liquidity on Binance Exchange, so that could help with trading on AUD/USDT/BTC pairs. And if you’re looking at buying and HODLing cryptos, then Swyftx Exchange is an easy-to-use popular choice in Australia.

Categories
Crypto News Kucoin Market Analysis Trading

Top 3 Coins To Watch Today: MATIC, COTI, KCS – August 27 Trading Analysis

Let’s take a closer look at today’s altcoins showing breakout signals. We’ll explain what the coin is, then dive into the trading charts and provide some analysis to help you decide.

1. Polygon (MATIC)

Polygon MATIC is the first well-structured, easy-to-use platform for Ethereum scaling and infrastructure development. Its core component is Polygon SDK, a modular, flexible framework that supports building multiple types of applications. Using Polygon, one can create optimistic rollup chains, ZK rollup chains, stand-alone chains, or any other kind of infra required by the developer. The MATIC token will continue to exist and will play an increasingly important role, securing the system and enabling governance.

MATIC Price Analysis

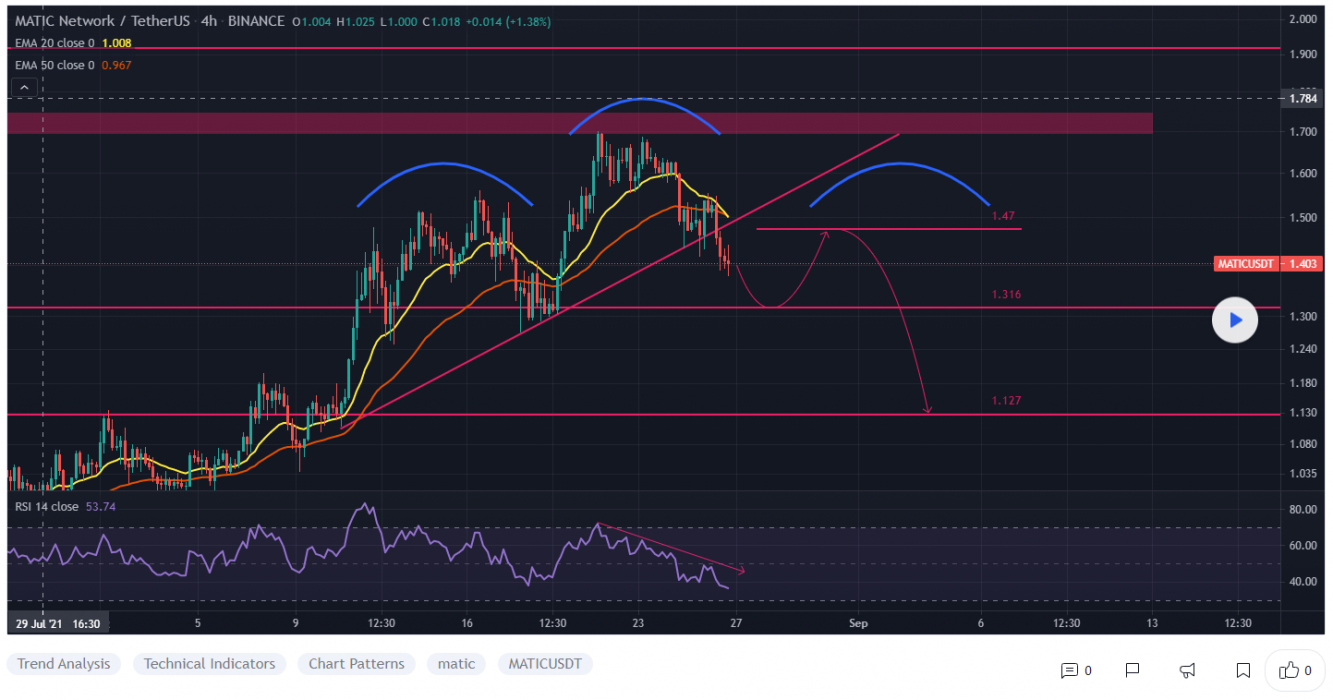
At the time of writing, MATIC is ranked the 18th cryptocurrency globally and the current price is A$1.93. Let’s take a look at the chart below for price analysis:

Source: TradingView

After a stunning 85% drop since early June, MATIC seems to have entered an accumulation phase.

The last few days have found resistance in the weekly level near A$2.28, which may continue to hold the price down. The daily chart also shows resistance near A$2.21, while the swing high at A$2.13 gives a likely target if this resistance fails. A run above this level may reach the weekly gap with a high near A$2.06.

The consolidation around A$1.84 has provided support and could do so again. However, relatively equal daily lows near A$1.77 are a tempting target for bears. Below this level, little exists to provide explicit support on the chart.

2. Coti (COTI)

COTI markets itself as the first enterprise-grade fintech platform that empowers organisations to build their own payment solutions as well as digitise any currency to save time as well as money. COTI is one of the world’s first blockchain protocols that is optimised for decentralised payments and designed for use by merchants, governments, payment DApps, and stablecoin issuers.

COTI Price Analysis

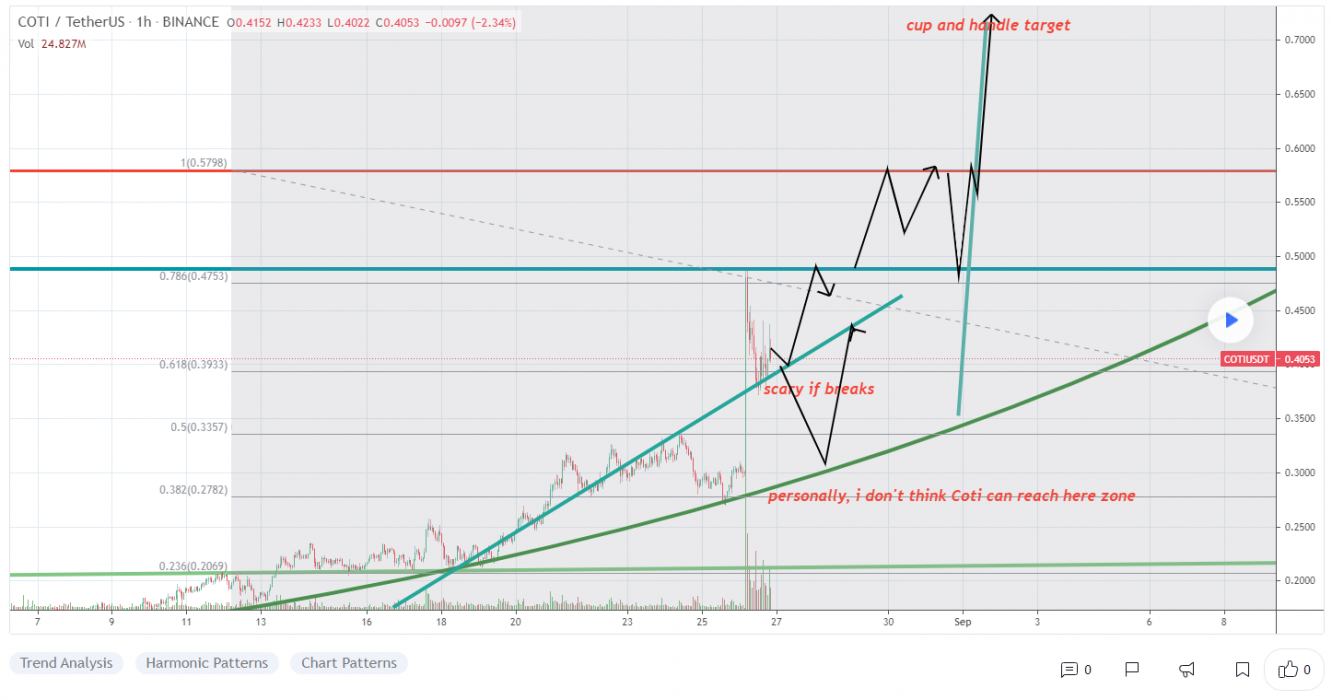
At the time of writing, COTI is ranked the 150th cryptocurrency globally and the current price is A$0.5541. Let’s take a look at the chart below for price analysis:

Source: TradingView

COTI‘s nearly 57% drop since May found a low in late July, with price action now trending upward through a higher-timeframe range reaching its all-time high.

The area beginning near A$0.6439 has provided strong resistance and may do so again. However, relatively equal highs near A$0.6682 offer a tempting target for bulls. A run of these highs may reach up into the daily gap near A$0.7055.

Aggressive bulls might add to their positions near A$0.5147. If the price breaks through this level, it may be reaching for the cluster of swing lows near A$0.4835 and A$0.4701. A more substantial move down may run stops below the relatively equal May lows, around A$0.4255, into the daily gap at this level.

3. KuCoin Token (KCS)

KCS is the native token of KuCoin, which was launched in 2017 as a profit-sharing token that allows traders to draw value from the exchange. It was issued as an ERC-20 token running on the Ethereum network and was supported by most Ethereum wallets. The total supply of KCS was set at 200 million, and there is a planned buyback and burn until just 100 million KCS remain. Sooner or later, as the KuCoin decentralised trading solution goes live, KCS will be the native asset of KuCoin’s decentralised financial services as well as the governance token of the KuCoin community in the future.

KCS Price Analysis

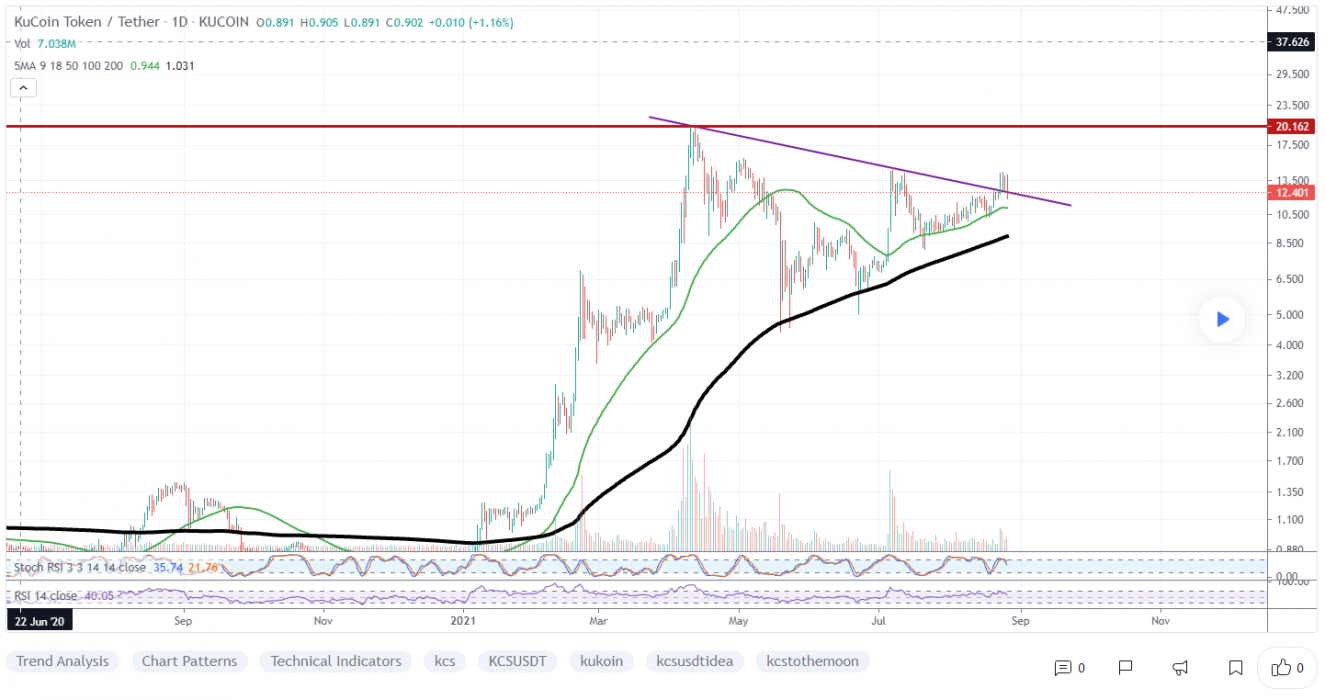
At the time of writing, KCS is ranked the 89th cryptocurrency globally and the current price is A$16.72. Let’s take a look at the chart below for price analysis:

Source: TradingView

KCS has been trading through a massive range since July, with the price showing mild bullishness during August.

Bulls bought near A$14.26. The weekly level and daily gap near A$15.20 could prompt buyers to step in again as the price challenges the swing high and resistance around A$16.32. A strong move and acceptance above this level may reach for the swing highs at A$18.75 and A$20.66, which marks another area of resistance.

However, rejection from the current area may send the price down to retest support near A$14.05. Relatively equal lows around A$13.48 provide a rich target for a stop run. Sustained bearishness may reach the low near A$11.96 and possibly as low as A$10.53 into higher-timeframe support.

Where to Buy or Trade Altcoins?

These coins have high liquidity on Binance Exchange, so that could help with trading on AUD/USDT/BTC pairs. And if you’re looking at buying and HODLing cryptos, then Swyftx Exchange is an easy-to-use popular choice in Australia.
Categories
Crypto News Market Analysis Trading

ATA Surges +195% in a Single Day as ATA is now Supported on Coin98 Wallet with a $2500 in Giveaway

Automata ATA is trading in an uptrend, like many other Altcoins. The cryptocurrency ATA just went up +195% in a single day by breaking a rising wedge pattern with strong buying volume on multiple exchanges and surges over +230% in a week.

What is Automata?

Automata Network ATA is a decentralised service protocol that provides privacy middleware for dApps across multiple blockchains. It enables versatile use-cases such as Anonymous Voting, Miner Extractable Value (MEV) minimisation, and No-tracking Indexing by leveraging on the latest cryptography and privacy-preserving algorithms, along with trust computing technologies.

ATA Price Analysis

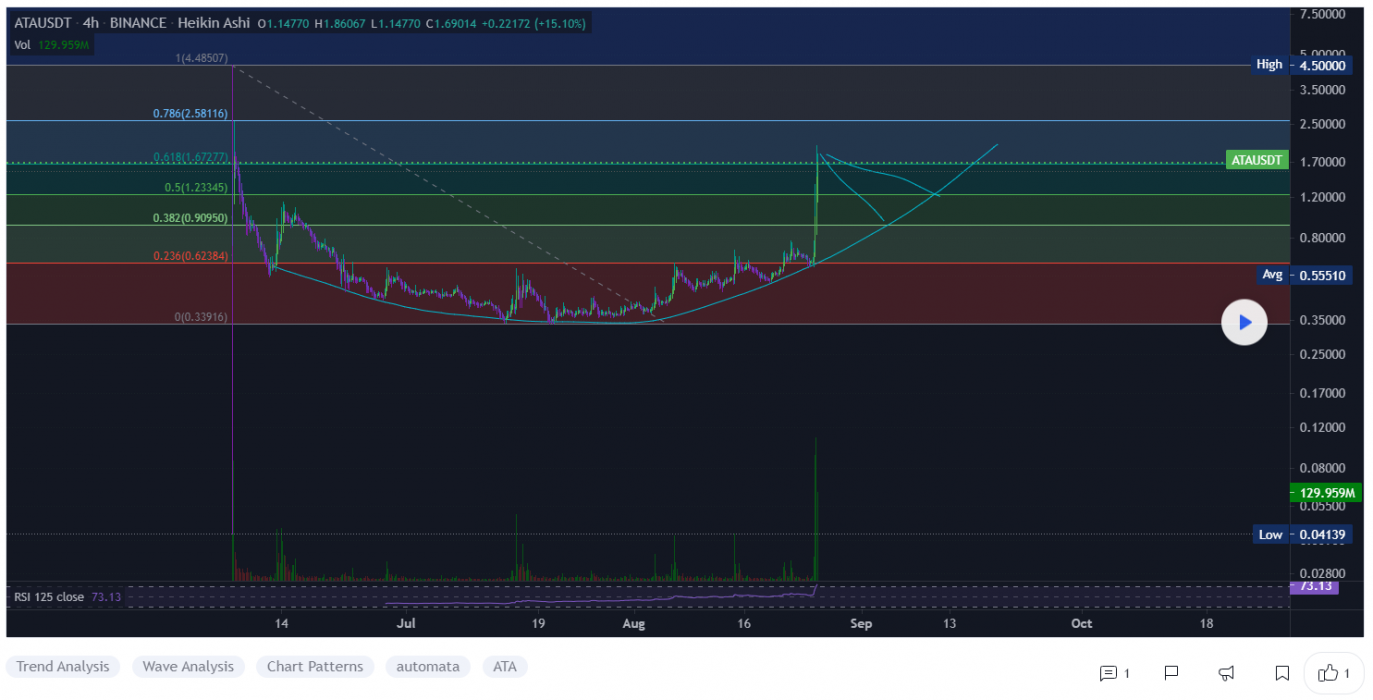
At the time of writing, ATA is ranked the 247th cryptocurrency globally and the current price is A$2.44. Let’s take a look at the chart below for price analysis:

Source: TradingView

After looking at the above 4-Hour candle chart, we can clearly see that ATA was trading inside the rising wedge pattern on the ATA/USDT pair. The first resistance was on the A$1.47 price level, which ATA broke with a strong bullish trend buying volume and is now heading towards the recent high price at A$2.49. Seeing that many Altcoins are holding a strong position this week after the recent bitcoin price recovery, ATA may continue to increase in the uptrend if traders keep buying with high volume.

“The Rising Wedge is a bearish pattern that begins wide at the bottom and contracts as prices move higher and the trading range narrows. As a reversal pattern, the rising wedge will slope up and with the prevailing trend.”

What Do the Technical Indicators Say?

The ATA TradingView indicators (on the 1 day) mainly indicate ATA as a Buy, except the Oscillators which indicate ATA as a Neutral.

So Why Did ATA Breakout?

General market sentiment seems to suggest cryptos are hopefully turning back bull run season after recent massive price corrections. Another reason for this sudden pump in price could be whales secretly buying ATA for the next Altcoins rally. Recent news was also announced regarding a Giveaway of $2500 ATA in total for 25 winners to celebrate ATA on coin98 Wallet.

Where to Buy or Trade ATA?

ATA has the highest liquidity on Binance Exchange so that would help for trading ATA/BTC, ATA/BNB, or ATA/USDT pairs. However, you can also buy ATA from different exchanges listed on Coinmarketcap.

Categories
Crypto News Market Analysis Trading VeChain Zcash

Top 3 Coins To Watch Today: MANA, VET, ZEC – August 26 Trading Analysis

Let’s take a closer look at today’s altcoins showing breakout signals. We’ll explain what the coin is, then dive into the trading charts and provide some analysis to help you decide.

1. Decentraland (MANA)

Decentraland MANA defines itself as a virtual reality platform powered by the Ethereum blockchain that allows users to create, experience, and monetise content and applications. Decentraland uses two tokens: MANA and LAND. MANA is an ERC-20 token that must be burned to acquire non-fungible ERC-721 LAND tokens. MANA tokens can also be used to pay for a range of avatars, wearables, names and more on the Decentraland marketplace.

MANA Price Analysis

At the time of writing, MANA is ranked the 70th cryptocurrency globally and the current price is A$1.28. Let’s take a look at the chart below for price analysis:

Source: TradingView

After dropping nearly 70% in May, MANA found a low just above the monthly gap near A$0.9541. Since then, the price has been consolidating in a range between A$1.35 and A$1.15.

The weekly level near A$1.22 may continue to provide support during a run on the local swing lows. The monthly gap beginning near A$1.06 will likely give the next higher-timeframe support if this level fails.

The price is currently chewing into potentially strong resistance near A$1.32. A sweep of the relatively equal highs near A$1.38, and a daily close above this level, could signal a move to the next set of relatively equal highs near A$1.45. 

Just above these highs, probable resistance rests near A$1.53, which may cap the price until the market moves out of consolidation. However, any significant bullish shift in market conditions during the next few weeks could help bulls reach the swing high near A$1.59, running stops into probable resistance near A$1.67.

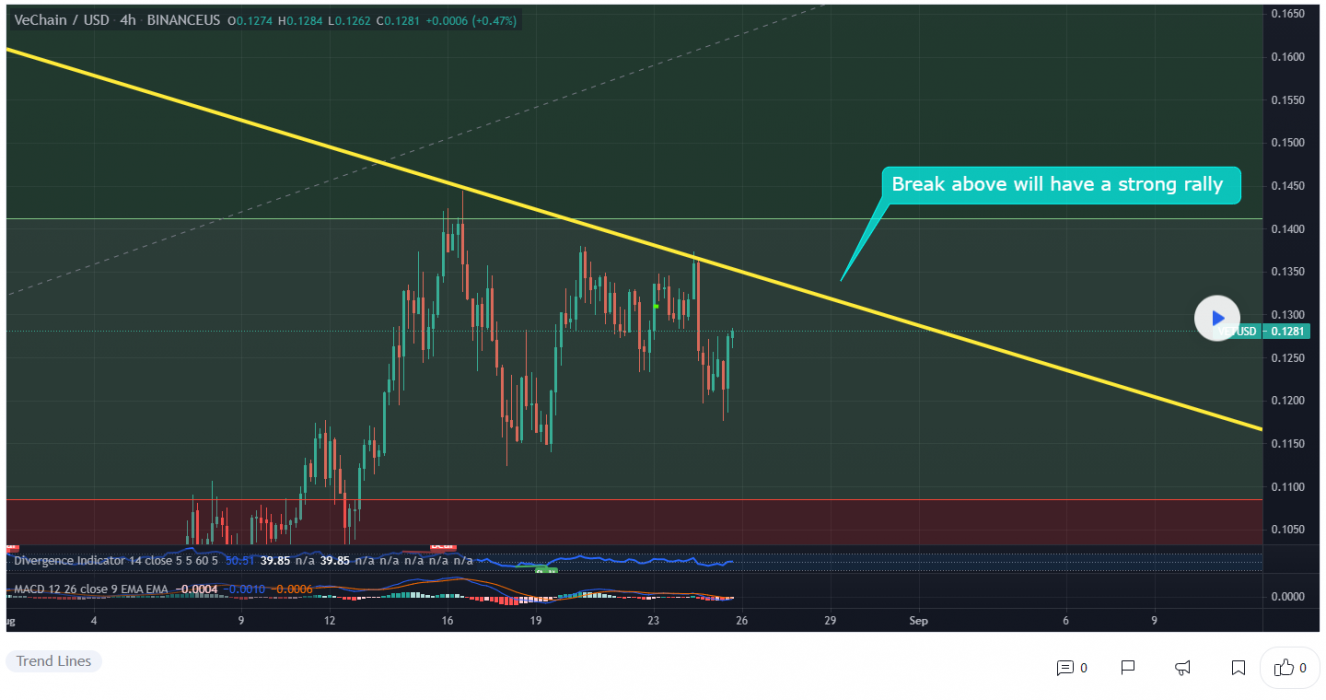
2. VeChain (VET)

VeChain VET is a blockchain-powered supply chain platform. Begun in 2015 and launched in June 2016, VeChain aims to use distributed governance and Internet of Things (IoT) technology to create an ecosystem that solves some of the major problems with supply chain management. The platform uses two in-house tokens, VET and VTHO, to manage and create value based on its VeChainThor public blockchain. The idea is to boost the efficiency, traceability and transparency of supply chains while reducing costs and placing more control in the hands of individual users.

VET Price Analysis

At the time of writing, VET is ranked the 24th cryptocurrency globally and the current price is A$0.1772. Let’s take a look at the chart below for price analysis:

Source: TradingView

VET accompanied the rest of the market in the mid-Q2 drop, falling nearly 83% from its May high until it found a low late in June.

Price action in late June formed a weekly support level near A$0.1126, which has so far held up the price. The most recent swing low inside this range, near A$0.1573, might be the target for any future stop runs. After this low, the swing low near A$0.1612 and the gap beginning near A$0.1688 marks possible higher-timeframe support.

The price is currently battling with significant higher-timeframe resistance levels, with the closest probable resistance resting near A$0.1879, just over the June monthly open. A sweep of the relatively equal highs above this resistance might find sellers near A$0.2056, but could reach as high as A$0.2385.

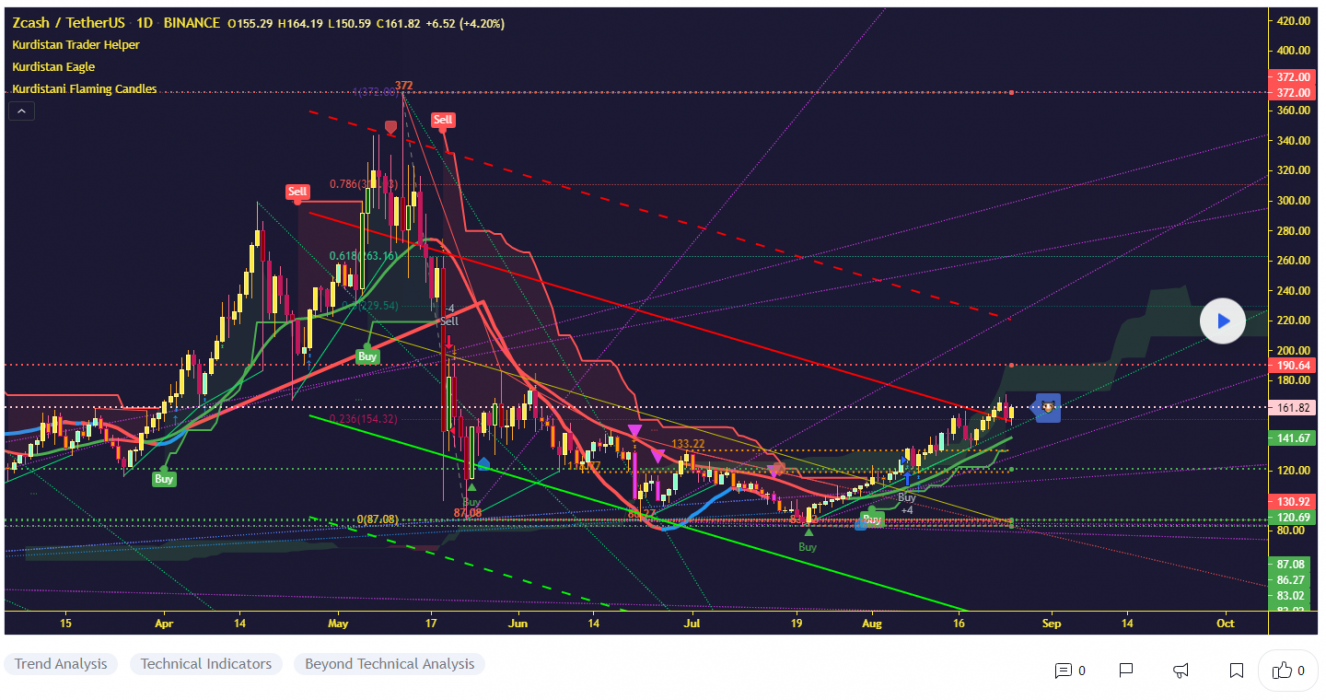
3. Zcash (ZEC)

Zcash ZEC is a decentralised cryptocurrency focused on privacy and anonymity. It uses the zk-SNARK zero-knowledge proof technology that allows nodes on the network to verify transactions without revealing any sensitive information about those transactions. Zcash transactions, on the other hand, still have to be relayed via a public blockchain, but unlike pseudonymous cryptocurrencies, ZEC transactions by default do not reveal the sending and receiving addresses or the amount being sent. There is an option, however, to reveal this data for the purposes of auditing or regulatory compliance.

ZEC Price Analysis

At the time of writing, ZEC is ranked the 64th cryptocurrency globally and the current price is A$224.36. Let’s take a look at the chart below for price analysis:

Source: TradingView

ZEC has been trading through a massive range since July, with the price showing mild bullishness during August.

The breaks of the swing highs at A$237 and A$240 led to support forming near A$225. Some bulls will likely wait for a more favourable entry on a potential stop run that could reach near A$221.

If the support near A$230 continues to hold, the recent swing high at A$240 is likely the next short-term target. This potential bullish swing might end with a run on short stops up to A$269 and A$282. 

Higher-timeframe resistance between A$295 and A$312 may cap any move upwards until the overall market becomes more bullish. However, any significant bearish move in bitcoin will likely push the price down toward the low and possible support near A$215.

Where to Buy or Trade Altcoins?

These coins have high liquidity on Binance Exchange, so that could help with trading on AUD/USDT/BTC pairs. And if you’re looking at buying and HODLing cryptos, then Swyftx Exchange is an easy-to-use popular choice in Australia.

Categories
Crypto News Market Analysis Trading

Coin98 Surges +95% in a Single Day Amid C98 Farming Pool Official Launch

After the launch of Coin98 Farming Pool, C98 took a strong breakout with +95% gains in a single day. Let’s take a quick look at C98, price analysis, and possible reasons for the recent breakout.

What is Coin98?

Coin98 is a decentralised finance (DeFi) solution that allows users access to cross-chain swaps, staking, and yield farming. The Coin98 exchange describes itself as a multi-chain liquidity aggregator that supports assets across a variety of blockchains, including but not limited to Ethereum, Binance Smart Chain, Solana, and Tron. Coin98 also has a wallet among its offerings, which supports more than 20 networks on both its mobile and desktop platforms.

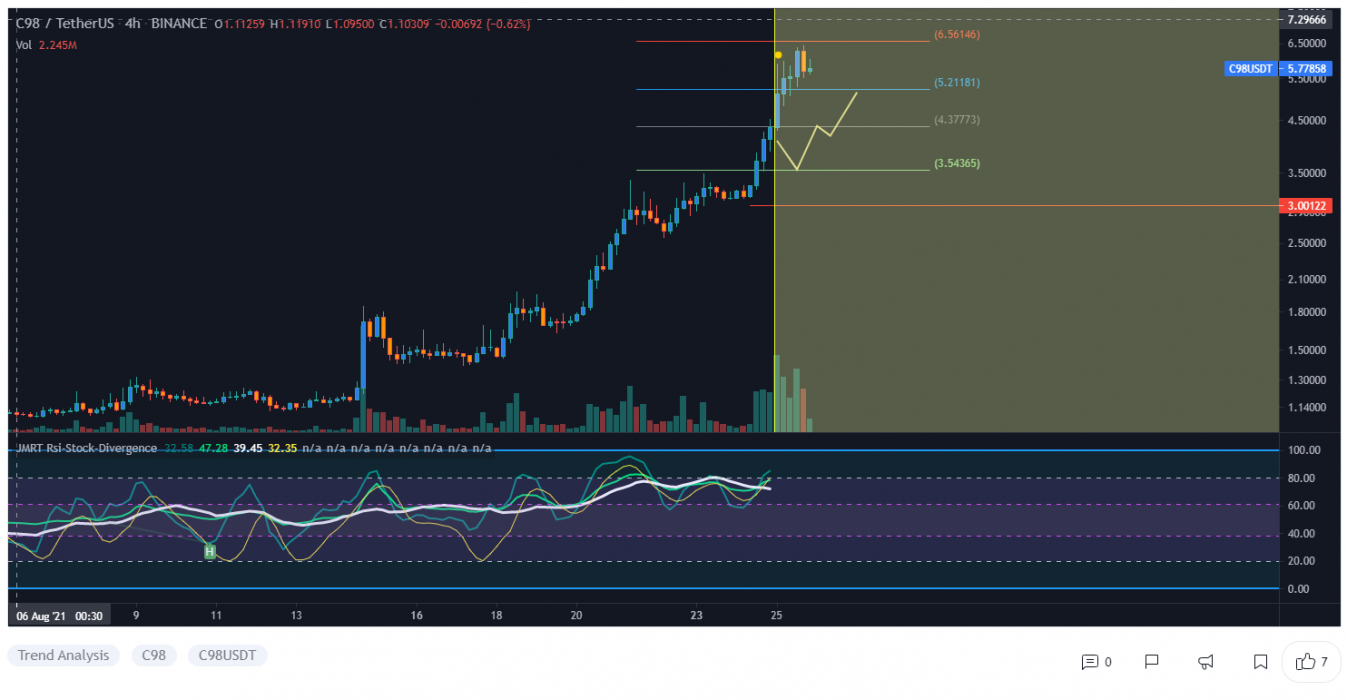
C98 Price Analysis

At the time of writing, C98 is ranked 214th cryptocurrency globally and the current price is A$7.95. Have a look at the chart below for price analysis.

Source: TradingView

After looking at the above 4-Hour candle chart, we can clearly see that C98 was trading inside the rising wedge pattern on the C98/USDT pair. The first resistance was on the A$4.89 price level, which C98 broke with a strong bullish trend buying volume and is now heading towards the recent high prices at A$8.63. Seeing many Altcoins are holding a strong position this week after the recent bitcoin price recovery, C98 may continue to increase in the uptrend if traders keep buying with high volume.

“The Rising Wedge is a bearish pattern that begins wide at the bottom and contracts as prices move higher and the trading range narrows. As a reversal pattern, the rising wedge will slope up and with the prevailing trend.”

What Do the Technical Indicators Say?

The Coin98 TradingView indicators (on the 1 day) mainly indicate C98 as a strong buy, except the Oscillators which indicate C98 as a Buy.

So Why Did Coin98 Breakout?

After the C98 opening at Binance Launchpad, mostly ICOs pump after going live on exchange for trade and general market sentiment seems to suggest cryptos are hopefully turning back bull run season after recent massive price corrections. The suggested start of the Altcoins season could have contributed to the recent breakout. It could also be attributed to some recent news of MoonFarm announcing that C98 Farming Pool has officially launched.

Where to Buy or Trade Coin98?

Coin98 has the highest liquidity on Binance Exchange so that would help for trading C98/BTC, C98/BUSD or C98/USDT pairs. However, you can also buy C98 from different exchanges listed on Coinmarketcap.

Categories
Aion Crypto News Market Analysis Trading

Top 3 Coins To Watch Today: KEEP, SLP, AION – August 25 Trading Analysis

Let’s take a closer look at today’s altcoins showing breakout signals. We’ll explain what the coin is, then dive into the trading charts and provide some analysis to help you decide.

1. Keep Network (KEEP)

Keep Network KEEP is an incentivised network for storing and encrypting private data on the public blockchain. The network is made of off-chain containers for private data known as keeps, while the KEEP work token enables it to be completely permissionless. Keep solves the main problem holding back blockchain adoption – that data on public blockchains are public. With Keep, developers can finally build fully decentralised apps. KEEP is the network’s native work token with dividends and a slashing model. It provides the Sybil resistance that allows the Keep network to be censorship-resistant and permissionless.

KEEP Price Analysis

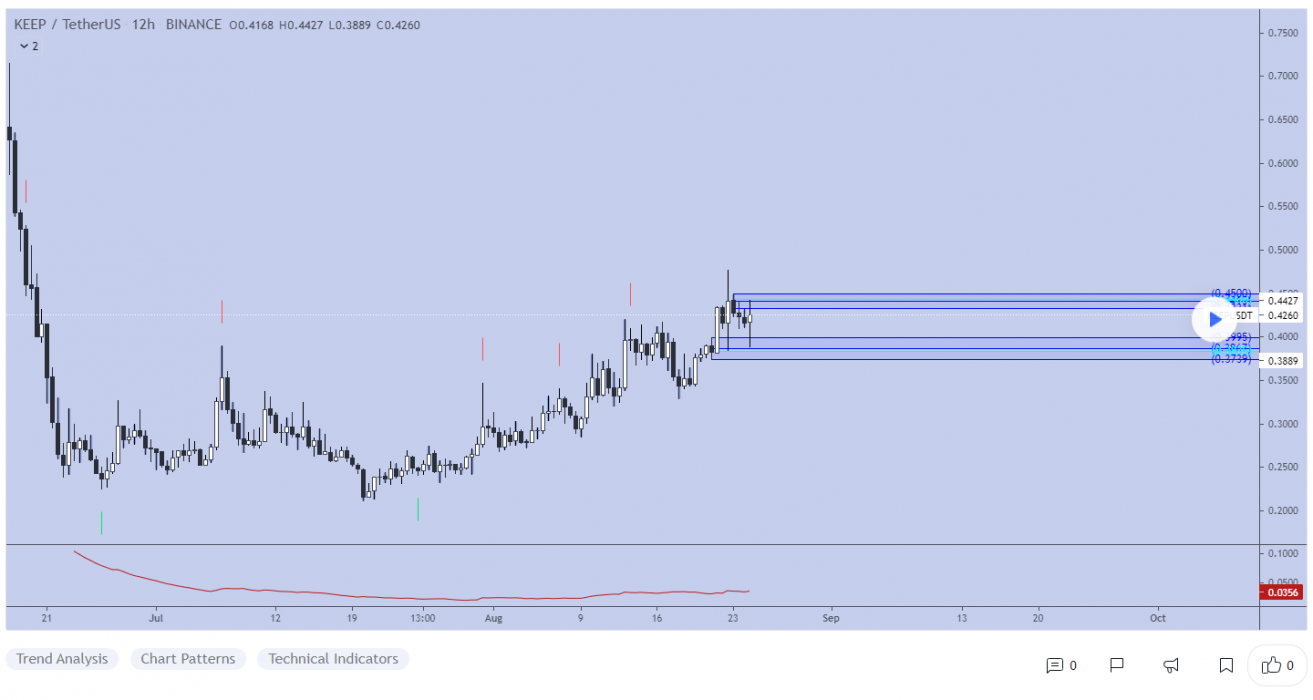
At the time of writing, KEEP is ranked the 250th cryptocurrency globally and the current price is A$0.5795. Let’s take a look at the chart below for price analysis:

Source: TradingView

KEEP retraced nearly 85% from its high before finding a low in late July. Since then, the price has been sweeping stops on both sides of its local range as the current consolidation sets up the next move.

Aggressive bulls might bid near A$0.4712, although a sweep of the stops near A$0.4538 could reach below the next swing low into possible support near A$0.4288. A continued downtrend might run into the weekly gap near A$0.3967.

Some bears might add more shorts near A$0.5492, although a push to A$0.6244 is reasonable. A daily candle close over the swing high near A$0.6935 could suggest that a longer-term trend reversal may be in play, with bulls possibly entering on a retracement near A$0.7851.

2. Small Love Potion (SLP)

Small Love Potion SLP tokens are earned by playing the Axie Infinity game. This digital asset serves as a replacement for experience points. SLP is unique because of how it has become one of the few in-game tokens to be listed by Binance in its Innovation Zone. The exchange has reserved this trading category for assets “that are likely to have higher volatility and pose a higher risk than other tokens”.

SLP Price Analysis

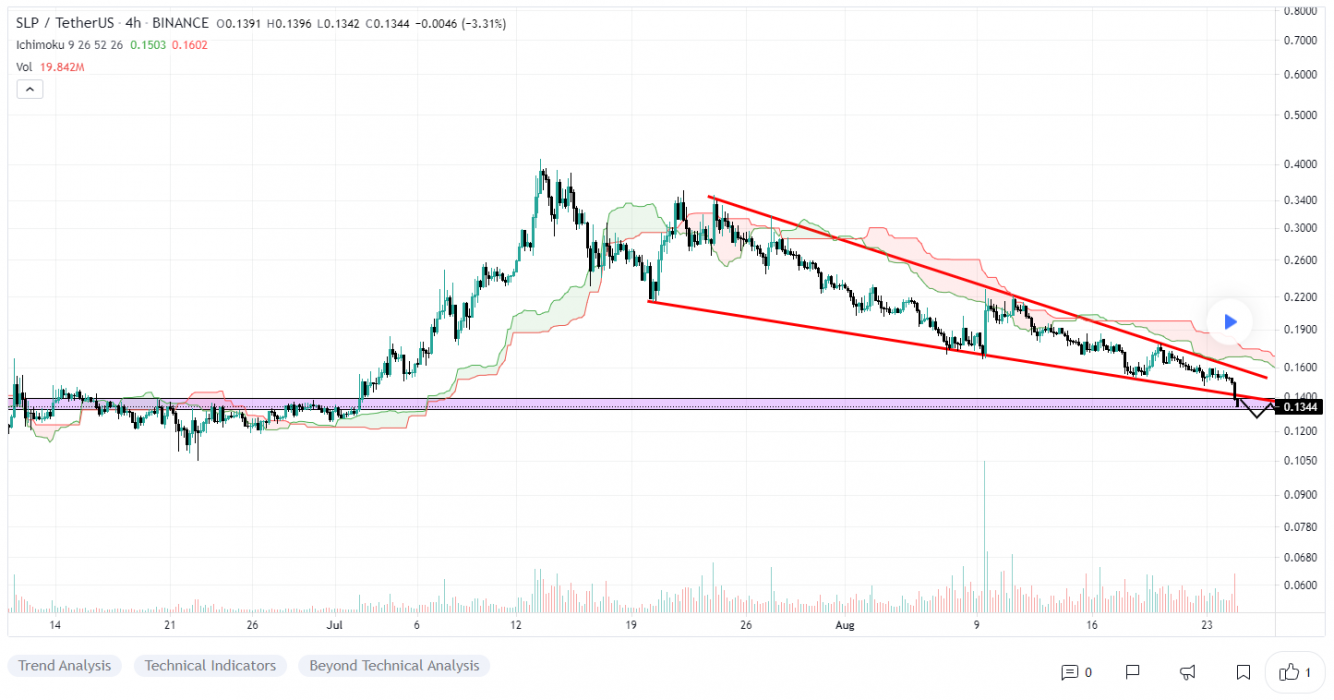
At the time of writing, SLP is ranked the 187th cryptocurrency globally and the current price is A$0.1943. Let’s take a look at the chart below for price analysis:

Source: TradingView

SLP‘s nearly 80% retracement continues to make lower lows while showing no definitive signs of bullish reversal.

Stops below the swing low near A$0.1745 mark the next likely bearish target, with the daily gap near A$0.1690 providing some chance of a short-term bounce. Swing lows near A$0.1613 and A$0.1587 are the next likely targets if this gap fails, with both lows marking areas of possible support.

A sweep of the most recent swing highs near A$0.2387 might find resistance beginning near A$0.2540, with a more substantial move reaching up to A$0.2635. Closing above this level could hint at a longer-term trend reversal and form the range high of any following consolidation.

3. Aion (AION)

AION is the token used to secure and access The Open Application Network (OAN). Launched in 2018 in Canada, The OAN is a public network available to everyone. Managed by The Open Foundation, a registered not-for-profit organisation, The OAN aims to give the public an environment to create Open Apps. The main purpose of The OAN is to facilitate interoperability between different blockchains, thus allowing users and developers to create a variety of applications. By making the AION token the core of the network, OAN enables users to execute smart contracts, store data, and share it between different networks.

AION Price Analysis

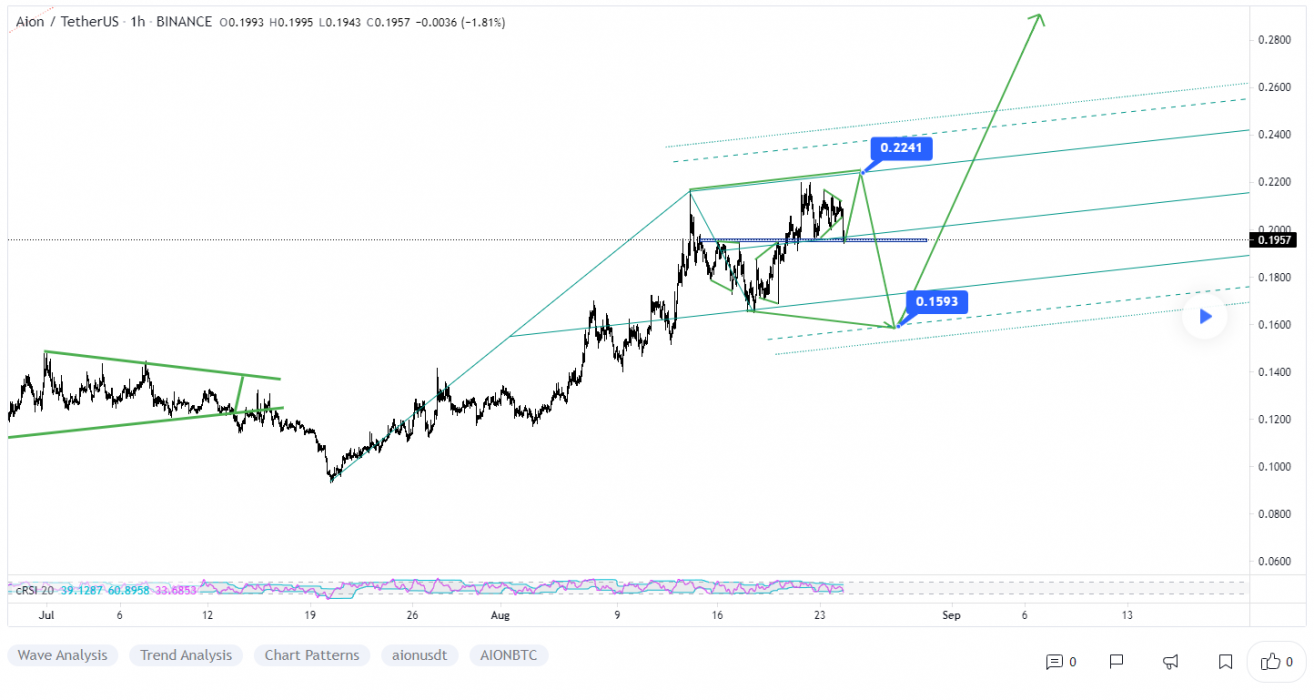
At the time of writing, AION is ranked the 387th cryptocurrency globally and the current price is A$0.2612. Let’s take a look at the chart below for price analysis:

Source: TradingView

After dropping almost 75% from recent highs, AION has been consolidating in a range for the second half of Q2.

The recent sweep of the lows near A$0.2487 could set the stage for at least a short rally higher, with bulls possibly buying near A$0.2558 for a move toward the relatively equal highs near A$0.2849. A close over these highs might hint at a longer-term move toward probable resistance near A$0.3496, likely following a retracement.

Rejection from possible resistance near A$0.2741, potentially including a sweep of the highs around A$0.2785, could signal a run to the swing low near A$0.2366. If this move occurs, bears might target the swing low and support near A$0.1976.

Where to Buy or Trade Altcoins?

These coins have high liquidity on Binance Exchange, so that could help with trading on AUD/USDT/BTC pairs. And if you’re looking at buying and HODLing cryptos, then Swyftx Exchange is an easy-to-use popular choice in Australia.