Categories
Crypto News GMT Token iExec RLC Market Analysis Solana Trading

Top 3 Coins to Watch Today: GMT, SOL, RLC – August 29 Trading Analysis

Let’s take a closer look at today’s altcoins showing breakout signals. We’ll explain what the coin is, then dive into the trading charts and provide some analysis to help you decide.

1. STEPN (GMT)

Stepn GMT is a self-styled “Web3 lifestyle app” with GameFi elements on the Solana blockchain. It combines aspects of a play-to-earn game with a fitness app to create a new category called “move-to-earn”. Users buy NFT sneakers, which they can use to earn in-game currency while walking, running, or jogging. STEPN aims to revolutionise the market of fitness applications by incentivising millions of users to follow a healthier lifestyle. The app solves several problems like “proof of movement” – proving that users really exercised – and a functioning GPS system. Moreover, STEPN incentivises users financially and plans to introduce social rewards elements and successfully contribute to carbon neutrality. 

GMT Price Analysis

At the time of writing, GMT is ranked the 82nd cryptocurrency globally and the current price is US$0.6884. Let’s take a look at the chart below for price analysis:

Source: TradingView

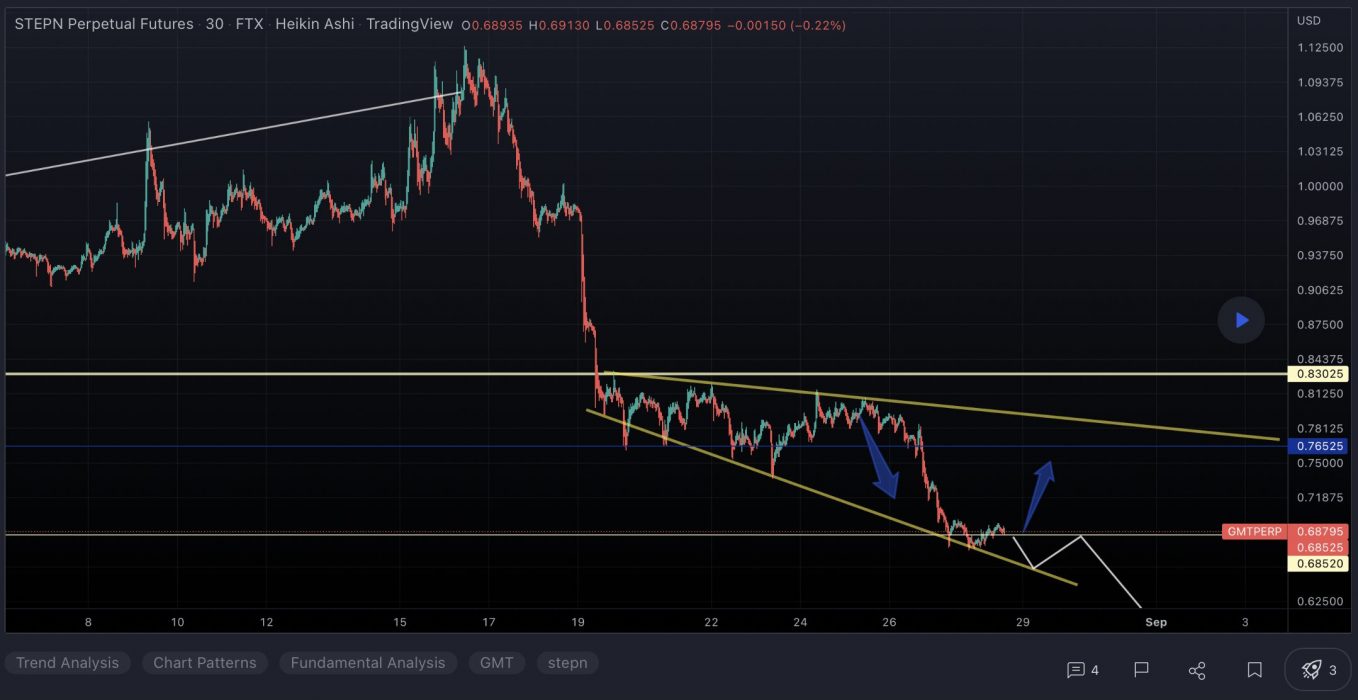
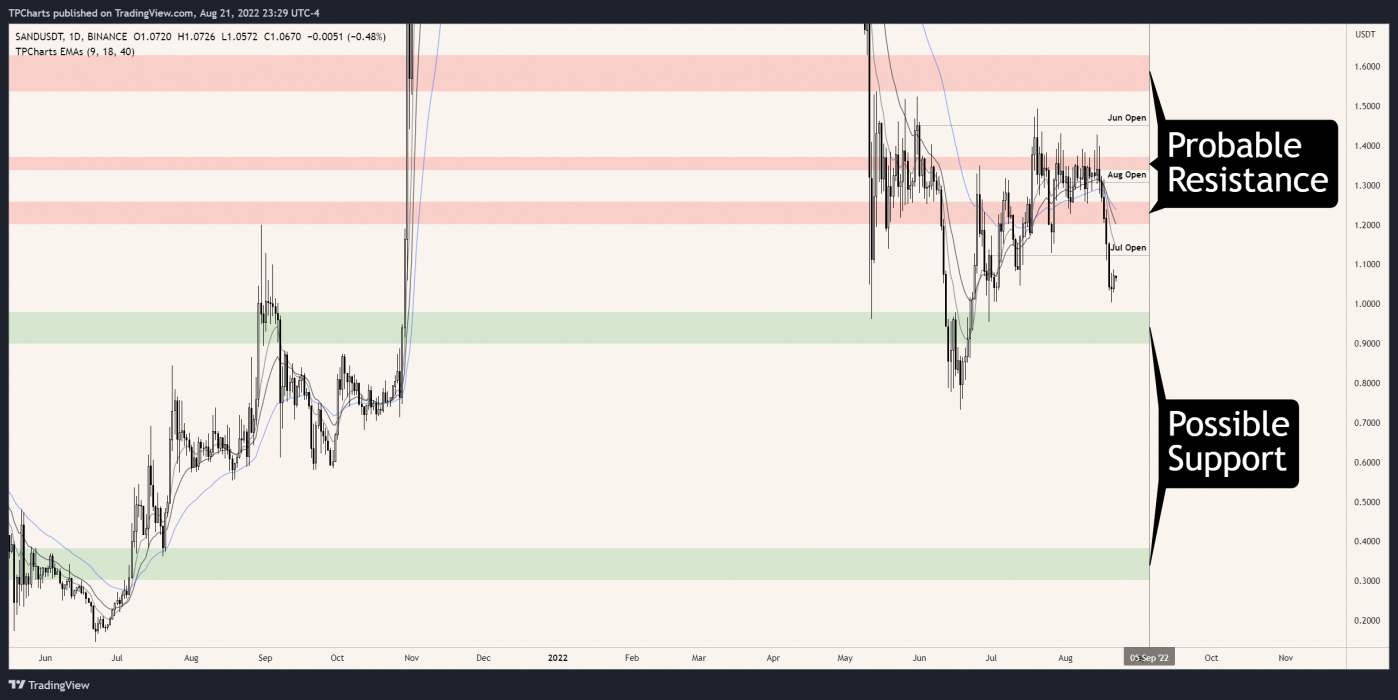
GMT has retraced much of 2022’s parabolic run. It dropped 85% from its April high before rallying in mid-June.

Bulls are testing $0.6718 to see if it can hold as support. This area shows inefficient trading on the daily chart. It’s also near the top of early July’s accumulation before the most recent rally.

Even if the price eventually moves higher, it may first drop under the July monthly open to an area near $0.6029. Bulls rejected bears in early July at this level. It also overlaps with an area of accumulation in late June.

If the market sees it as bearish, a retest of $0.7614 could prove this level as resistance. Bears already rejected bulls once here. This level also contains the 40 EMA and is inefficiently traded on the daily chart.

A break through this resistance could retest an old area of inefficient trading, near $0.8432. The target would likely be bulls’ stops above highs at $0.8830 and $0.9517. 

If the price reaches this level, it may go one step further and retest the June monthly open near $1.10. This level is at the low end of inefficient trading on the monthly chart. It’s also the origin of early June’s sudden breakdown.

Yet, while the market remains bearish, traders may want to focus on bearish scenarios. Rejection from any resistance might reach near $0.5813. This area shows inefficient trading on the daily chart. Bulls also rejected bears here on the weekly chart before starting June’s rally.

Below this level, $0.5146 may be the next target if the bearish trend continues. This area shows inefficient trading on the daily and weekly charts. It’s also just below relative equal lows, formed in mid-June. Bulls’ stops under these lows offer attractive targets to bears.

2. Solana (SOL)

Solana SOL is a highly functional open-source project that banks on blockchain technology’s permissionless nature to provide decentralised finance (DeFi) solutions. The Solana protocol is designed to facilitate decentralised app (DApp) creation. It aims to improve scalability by introducing a proof-of-history (PoH) consensus combined with the underlying proof-of-stake (PoS) consensus of the blockchain.

SOL Price Analysis

At the time of writing, SOL is ranked the 9th cryptocurrency globally and the current price is US$31.79. Let’s take a look at the chart below for price analysis:

Source: TradingView

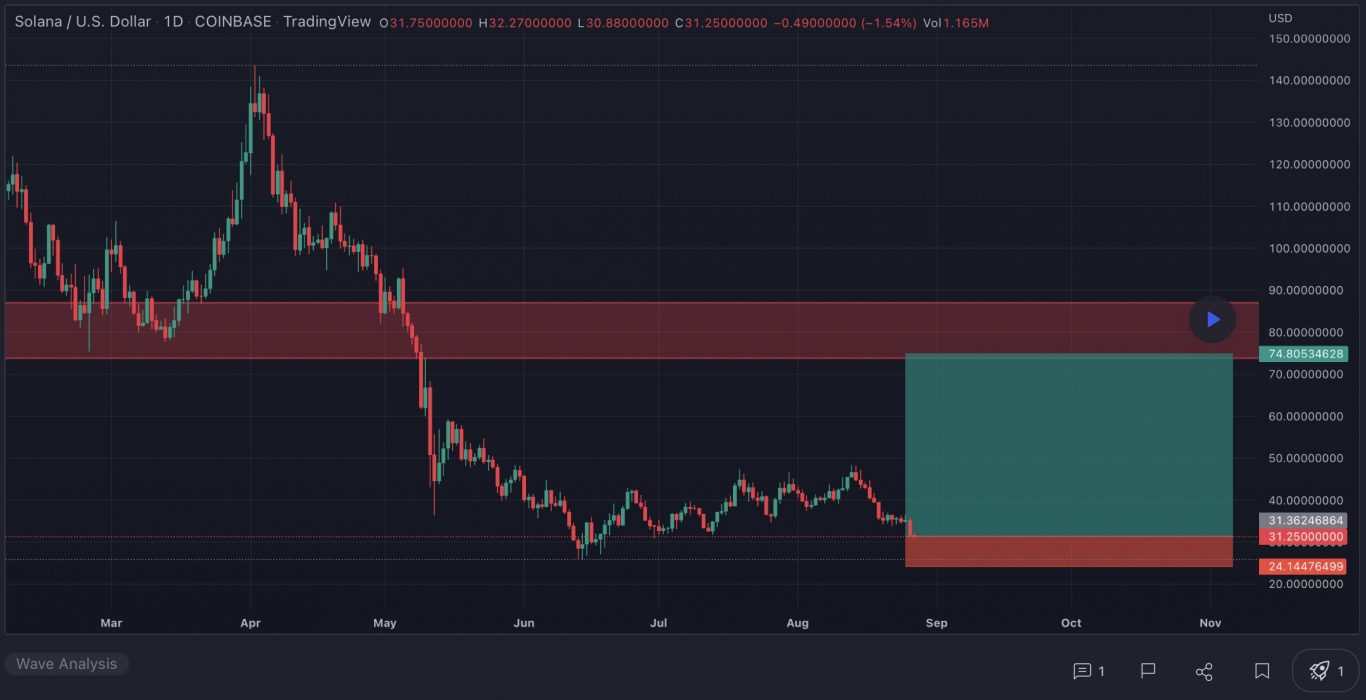
SOL has retraced 87% from its Q2 highs and reached possible support near $28.34. Resistance might begin near $37.64, which has confluence with the 9 and 18 EMAs.

A more substantial rally might reach near the swing high at $44.23 and the 40 EMA. This high is less likely to break if bears plan to continue the downtrend without a lengthier consolidation.

While not highly probable in the current market conditions, a more animated move upward could reach a wide resistance area between $48.12 and $52.94. This zone is where the last movement down accumulated positions before breaking down. 

Possible support rests near $30.54, which showed sensitivity on the last test. While it could provide support again, the higher-timeframe bearish trend is more likely to propel the price into an inefficient area between $26.10 and $23.54. If the price reaches this zone, the Q1 2021 swing high near $20.87 may mark a more sensitive level.

3. iExec Rlc (RLC)

iExec RLC claims to have developed the first decentralised marketplace for cloud computing resources. Blockchain technology is used to organise a market network where users can monetise their computing power, applications and datasets. By providing on-demand access to cloud computing resources, iExec is reportedly able to support compute-intensive applications in fields such as AI, big data, healthcare, rendering, or FinTech.

RLC Price Analysis

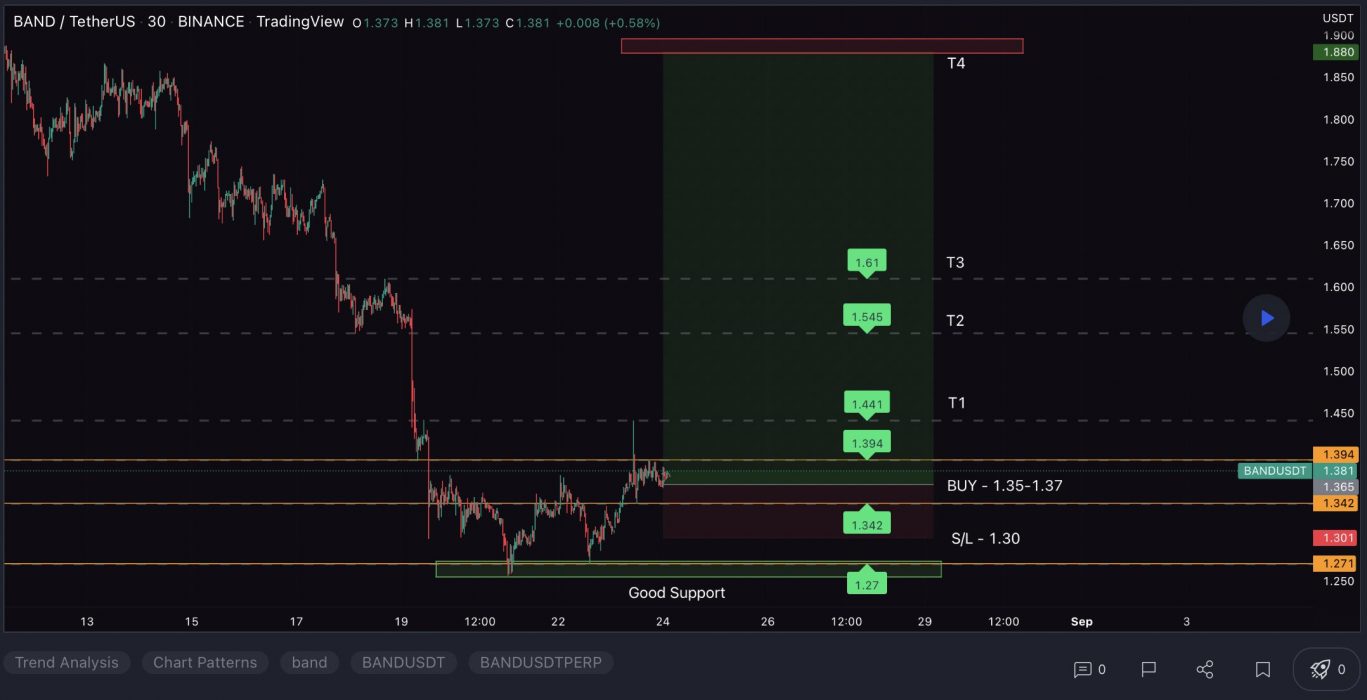
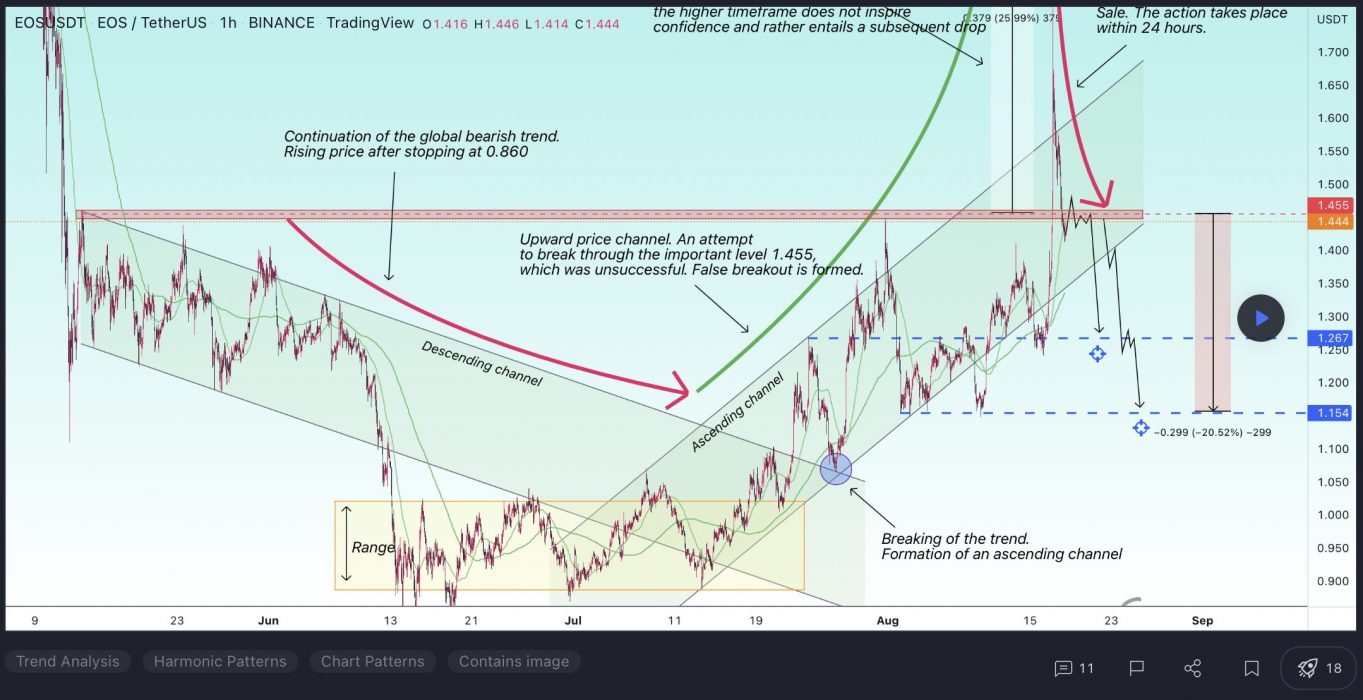
At the time of writing, RLC is ranked 183rd cryptocurrency globally and the current price is US$1.27. Let’s take a look at the chart below for price analysis:

Source: TradingView

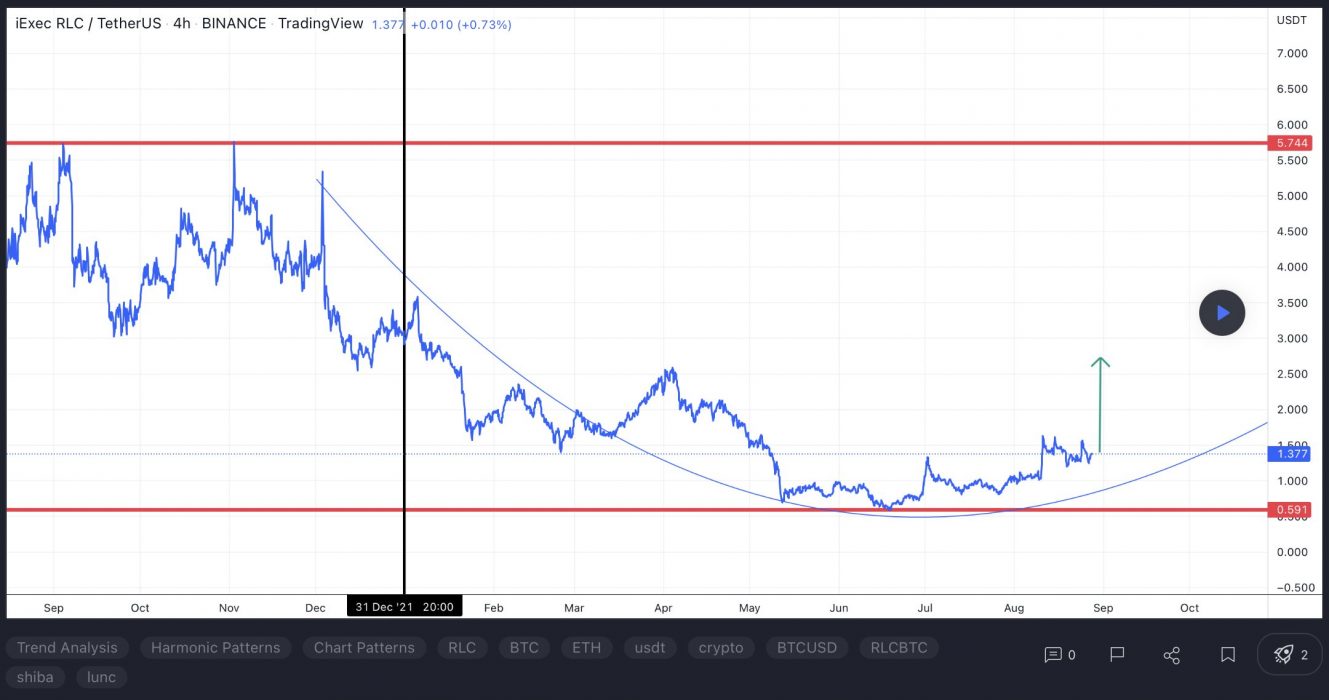
RLC printed nearly 50% gains during Q1. After this move, the price has been consolidating for the past few weeks around a monthly level near $1.12.

Overlapping support zones should provide bullish strength, with the current region beginning at $1.25 providing a reasonable entry accompanied by a wide stop. Relatively equal daily lows near $1.15 could prompt a stop run that provides a better entry, maybe as low as the next overlapping support area near $1.03.

Last month’s high near $1.38 provides the highest probability target, with the next swing high inside resistance at $1.45 giving another target and potential short-term reversal area.

A strong move through this level into resistance beginning at $1.52 is likely to target the monthly high at $1.60, potentially reaching the next monthly high near $1.85.

Learn How to Trade Live!

Join Dave and The Crypto Den Crew and they’ll show you live on a webinar how to take your crypto trading to the next level.

Where to Buy or Trade Altcoins?

These coins have high liquidity on Binance Exchange, so that could help with trading on AUD/USDT/BTC pairs. And if you’re looking at buying and HODLing cryptos, then Swyftx Exchange is an easy-to-use popular choice in Australia.

Categories
Crypto News DeFiChain Elrond Market Analysis Oasis Network Trading

Top 3 Coins to Watch Today: EGLD, DFI, ROSE – August 26 Trading Analysis

Let’s take a closer look at today’s altcoins showing breakout signals. We’ll explain what the coin is, then dive into the trading charts and provide some analysis to help you decide.

1. Elrond (EGLD)

Elrond EGLD is a blockchain protocol that seeks to offer extremely fast transaction speeds by using sharding. The project describes itself as a technology ecosystem for the new internet, which includes fintech, decentralised finance, and the Internet of Things. Its smart contracts execution platform is reportedly capable of 15,000 transactions per second, six-second latency, and a $0.001 transaction cost. The blockchain has a native token known as eGold, or EGLD, used for paying network fees, staking, and rewarding validators.

EGLD Price Analysis

At the time of writing, EGLD is ranked the 42nd cryptocurrency globally and the current price is US$57.54. Let’s take a look at the chart below for price analysis:

Source: TradingView

EGLD‘s 65% rally during Q1 reversed with many other coins in Q2, retracing nearly 50%. Just above the current price and near the June monthly open, $69.20 could provide resistance before a downward move. This level has confluence with the 18 EMA.

Bears may consider $74.94 as a higher probability resistance to hunt shorts for a longer swing downward. However, higher-timeframe charts suggest that the price could reach $82.45 at the top of an inefficiently traded area before any future bearish breakdowns.

Resistance might also rest near $86.45, above the recent monthly open. However, the price is less likely to reach this level unless the overall market starts a bullish swing.

The price is finding support between $45.30 and $40.86. This zone may continue to hold, while overlapping higher-timeframe levels from $37.44 to $34.81 could provide the most substantial support inside this area. 

2. DeFiChain (DFI)

DeFiChain DFI is a blockchain platform built with the mission of maximising the full potential of DeFi within the Bitcoin (BTC) ecosystem. The software platform is supported by a distributed network of computers and is designed to facilitate fast and transparent transactions. The development team positions DeFiChain as an innovative blockchain project and offers solutions to problems like scalability, security, and decentralisation.

DFI Price Analysis

At the time of writing, DFI is ranked the 215th cryptocurrency globally and the current price is US$0.9492. Let’s take a look at the chart below for price analysis:

Source: TradingView

DFI collapsed 80% from its April high before beginning an uptrend in early July.

Bulls broke the market structure to the upside across Q2. This break resulted in a 64% climb ending with a large spike during June. Inside this spike, $1.22 could provide the first resistance. It overlaps with a small area of inefficient trading in mid-June and is near the 40 EMA.

A move higher may retest July’s high, near $1.30. This area shows inefficient trading on the daily and weekly charts. It’s also near the top of inefficient trading on the monthly chart. 

If the rally continues, bulls should find support near $1.08. A narrow pocket under this level, from $1.06 to $1.02, could provide more sensitivity. This pocket shows inefficient trading on the daily and overlaps with old highs. It’s also near the 9 and 18 EMAs.

If the downtrend resumes, a wide area from $0.9133 to $0.07532 may spawn the following bullish setup. This zone shows inefficient trading on the monthly chart.

3. Oasis Network (ROSE)

The Oasis Network ROSE is the first privacy-enabled blockchain platform for open finance and a responsible data economy. Combined with its high throughput and secure architecture, the Oasis Network is able to power private, scalable DeFi, revolutionising Open Finance and expanding it beyond traders and early adopters to a mass market. Its unique privacy features can not only redefine DeFi but also create a new type of digital asset called Tokenised Data that can enable users to take control of the data they generate and earn rewards for staking it with applications – creating the first-ever responsible data economy.

ROSE Price Analysis

At the time of writing, ROSE is ranked the 100th cryptocurrency globally and the current price is US$0.06918. Let’s take a look at the chart below for price analysis:

Source: TradingView

ROSE climbed 40% from its Q1 low, then dropped nearly 63% into support last month. The price is currently testing this resistance, near $0.1043. It may also provide support again and has confluence with the 61.8% and 78.6% retracements.

Resistance begins just above, at $0.09537. This inefficiently traded area, which reaches slightly beyond $0.1186, contains the previous monthly highs, a bearish market structure break on the daily chart, and the 9, 18 and 40 EMAs. 

These confluences often provide strong resistance. Since this resistance is close to the $0.1215 support, the price may enter consolidation before breaking out to the next move.

If the price breaks this resistance, bulls could eye an area of old rejection, near $0.1320, as their next target. Continuation through this level may target another area of bearish rejection on the weekly chart, near the 27% extension from $0.1359 to $0.1387.

A more significant bearish turn in the market may reach for bulls’ stops under the Q2 lows, down to an area of old support in an inefficiently traded area between $0.06341 and $0.05217.

Learn How to Trade Live!

Join Dave and The Crypto Den Crew and they’ll show you live on a webinar how to take your crypto trading to the next level.

Where to Buy or Trade Altcoins?

These coins have high liquidity on Binance Exchange, so that could help with trading on AUD/USDT/BTC pairs. And if you’re looking at buying and HODLing cryptos, then Swyftx Exchange is an easy-to-use popular choice in Australia.

Categories
Crypto News IoTeX Market Analysis Monero Trading Zilliqa

Top 3 Coins to Watch Today: XMR, ZIL, IOTX – August 25 Trading Analysis

Let’s take a closer look at today’s altcoins showing breakout signals. We’ll explain what the coin is, then dive into the trading charts and provide some analysis to help you decide.

1. Monero (XMR)

Monero XMR allows transactions to take place privately and with anonymity. Even though it’s commonly thought that BTC can conceal a person’s identity, it’s often easy to trace payments back to their original source because blockchains are transparent. On the other hand, XMR is designed to obscure senders and recipients alike through the use of advanced cryptography. The team behind Monero says privacy and security are its biggest priorities, with ease of use and efficiency coming second. It aims to provide protection to all users, irrespective of how technologically competent they are.

XMR Price Analysis

At the time of writing, XMR is ranked the 28th cryptocurrency globally and the current price is US$151.23. Let’s take a look at the chart below for price analysis:

Source: TradingView

XMR is rallying to fill in pockets of inefficient trading left during its June decline. The closest resistance is at $172.80. This area of inefficient trading on the weekly and daily charts is near the 61.8% retracement of June’s move. It rejected the price on August 7, but the price is rechallenging it.

If it breaks, the next pocket of inefficient trading from $179.60 to $183.10 may be the following target. This zone is also near the high of inefficient trading on the weekly and the 78.6% retracement of June’s move.

In the longer term, bulls could be targeting bears’ stops above the significant weekly swing high near $206.50. This zone also shows inefficient trading on the monthly chart. If this resistance breaks, the next bullish target may be another area of inefficient trading on the weekly chart from $232.50 to $227.80.

The closest support could be near the current price, from $160.40 to $150.03. This area is at the end of July’s accumulation high. If this level breaks, a drop under the August monthly open may find more buyers near $142.30. This area shows accumulation, would run bulls’ stops under recent swing lows, and fill in a tiny pocket of inefficient trading. It also has confluence with the high of previous inefficient trading on the weekly chart.

A steeper drop may reach inefficient trading on the weekly chart, from $134.70 to $125.80. This zone is also near the bottom of previous inefficient trading from June and lines up with old swing lows from Q1 2022.

2. Zilliqa (ZIL)

Zilliqa ZIL is a public, permissionless blockchain designed to offer high throughput with the ability to complete thousands of transactions per second. It seeks to solve the issue of blockchain scalability and speed by employing sharding as a second-layer scaling solution. The platform is home to many decentralised applications, and it also allows for staking and yield farming. The native utility token of Zilliqa, ZIL, is used to process transactions on the network and execute smart contracts.

ZIL Price Analysis

At the time of writing, ZIL is ranked the 77th cryptocurrency globally and the current price is US$0.03883. Let’s take a look at the chart below for price analysis:

Source: TradingView

ZIL‘s 85% drop found a low near $0.03168 before closing over a weekly high around $0.04382. This daily close over the high could signal a shift in market structure that may reach probable resistance near $0.04732.

A sustained bullish move could target the swing high at $0.05620. If this stop run occurs, a run beyond the high into probable resistance near $0.06184 and $0.06745 is possible.

Bulls could buy a retracement to possible support near $0.03528, just above the weekly open. A bearish turn in the marketplace may propel the price toward possible support near $0.03126. 

However, relatively equal lows near $0.02914 and $0.02854 provide an attractive target for bears if the market resumes its bearish trend. A run on these lows may find support between $0.02715 and $0.02569.

3. IoTeX (IOTX)

IoTeX IOTX has built a decentralised platform with the aim of empowering the open economics for machines – an open ecosystem where people and machines can interact with guaranteed trust, free will, and under properly designed economic incentives. IoTeX is the decentralised backbone for machine economics, which serves machines ranging from smart home devices to autonomous vehicles.

IOTX Price Analysis

At the time of writing, IOTX is ranked the 108th cryptocurrency globally and the current price is US$0.03144. Let’s take a look at the chart below for price analysis:

Source: TradingView

By late Q2, IOTX had retraced 80% from its November high as it created relatively equal lows near $0.02506. Just above these lows, the price is testing possible support near $0.03145. This level saw accumulation in early August and could support at least a short move upward.

If this level instead breaks and the price drops, bears could be aiming for an inefficiently traded area between $0.02915 and $0.02827. This area is under multiple relatively equal lows that have been in place since late Q3 2021, providing an appealing target for bears. 

However, a move into probable resistance near $0.03825 could occur first, even if the price later breaks down. This level is a range high for a significant amount of trading during Q1 2022.

If this resistance breaks, the price could reach the next probable resistance near $0.04516, where it consolidated before mid-Q2’s breakdown.

Learn How to Trade Live!

Join Dave and The Crypto Den Crew and they’ll show you live on a webinar how to take your crypto trading to the next level.

Where to Buy or Trade Altcoins?

These coins have high liquidity on Binance Exchange, so that could help with trading on AUD/USDT/BTC pairs. And if you’re looking at buying and HODLing cryptos, then Swyftx Exchange is an easy-to-use popular choice in Australia.

Categories
Band Protocol Crypto News Market Analysis Ravencoin Trading Waves

Top 3 Coins to Watch Today: BAND, WAVES, RVN – August 24 Trading Analysis

Let’s take a closer look at today’s altcoins showing breakout signals. We’ll explain what the coin is, then dive into the trading charts and provide some analysis to help you decide.

1. Band Protocol (BAND)

Band Protocol BAND is a cross-chain data oracle platform that is able to take real-world data and supply it to on-chain applications, while also connecting APIs to smart contracts to facilitate the exchange of information between on-chain and off-chain data sources.

BAND is the native token of the Band Protocol ecosystem and is used as collateral by validators involved in fulfilling data requests, as well as being the main medium of exchange on BandChain, used for paying for private data.

BAND Price Analysis

At the time of writing, BAND is ranked the 394th cryptocurrency globally and the current price is US$1.40. Let’s take a look at the chart below for price analysis:

Source: TradingView

Like many other altcoins, BAND set a high around April before retracing 80% to the low at $1.20 in Q3.

Price broke through resistance near $1.45, which may mark an area of possible support on a retracement. If this support fails, bulls may also step in near $1.34. However, a drop this far increases the chances of a stop run to $1.25 and possibly into support near $1.19. For now, continuing bullish market conditions could help $1.40 become support.

The swing high around $1.73 gives bulls a reasonable first target, with $1.98 also likely to draw the price upward. Higher-timeframe resistance beginning near $2.10 or $2.19 could cap the move or trigger consolidations. If bullish market conditions continue, bulls might test probable resistance near $2.30.

2. Waves (WAVES)

WAVES is a multi-purpose blockchain platform that supports various use cases, including decentralised applications (DApps) and smart contracts. The platform has undergone various changes and added new spin-off features to build on its original design.

Waves’ native token is WAVES, an uncapped supply token used for standard payments such as block rewards. Waves initially set out to improve on the first blockchain platforms by increasing speed, utility, and user-friendliness.

WAVES Price Analysis

At the time of writing, WAVES is ranked the 72nd cryptocurrency globally and the current price is US$5.02. Let’s take a look at the chart below for price analysis:

Source: TradingView

WAVES has dropped almost 95% from its late-March high and over 64% from its early June high. The price is now rallying toward the middle of its local range.

Bulls may find their first support between $5.00 and $4.80. This area shows inefficient trading on the daily chart inside June 21’s strong bullish impulse. It’s also just below the 9 and 18 EMAs.

The price may be seeking probable resistance near $6.40. This level shows consolidation on the daily chart over the current range’s midpoint. Weekly candle bodies also show that bears rejected bulls near January’s swing lows around this area.

This potential rally could continue over the June monthly open to $7.32. Candle bodies on the weekly and monthly charts show that bulls rejected bears at this level in late January. This area also shows inefficient trading on the weekly chart, which may need a revisit.

Yet relative equal lows near $4.56 offer a very tempting target for bears. The price could find some support under these lows, down to $4.13. This area shows inefficient trading on the weekly and monthly charts. It’s also near the high of September 2020’s consolidation.

A longer bearish move may continue through these possible supports to a zone from $3.87 to $3.45. If the price moves this low, it may be targeting bulls’ stops below weekly swing lows near $3.15. The bottom of this zone also shows inefficient trading on the monthly chart.

3. Ravencoin (RVN)

Ravencoin RVN is a digital peer-to-peer (P2P) network that aims to implement a use case-specific blockchain designed to efficiently handle one specific function – the transfer of assets from one party to another. Built on a fork of the Bitcoin code, Ravencoin aims to solve the problem of assets transfer and trading over the blockchain. Previously, if someone created an asset on the Bitcoin blockchain, it could be accidentally destroyed when someone traded the coins it was created with. RVN coins are designed as internal currency within the network and must be burnt in order to issue token assets on the Ravenchain.

RVN Price Analysis

At the time of writing, RVN is ranked the 104th cryptocurrency globally and the current price is US$0.03178. Let’s take a look at the chart below for price analysis:

Source: TradingView

Since the November high, RVN‘s 70% drop marks the current range as a reasonable area to expect accumulation.

The recent bearish flip of the 9, 18 and 40 EMAs may cause bulls to be less aggressive in bidding. However, possible support near $0.03045 and $0.02738 – between the 61.8% and 78.6% retracements – could see at least a short-term bounce. 

Last year’s long-term consolidation suggests that the areas near $0.04846 and $0.05178 may be more likely to cause a longer-term trend reversal.

Bears are likely to add to their shorts at probable resistance beginning near $0.05412, which has confluence with the 18 EMA. A fast break of this resistance could trigger more selling near $0.05729, the start of the bearish move.

If an aggressive bullish move does appear, trapped buyers in the probable resistance beginning near $0.06045 may provide a ceiling for this impulse.

Learn How to Trade Live!

Join Dave and The Crypto Den Crew and they’ll show you live on a webinar how to take your crypto trading to the next level.

Source: TradingView

Where to Buy or Trade Altcoins?

These coins have high liquidity on Binance Exchange, so that could help with trading on AUD/USDT/BTC pairs. And if you’re looking at buying and HODLing cryptos, then Swyftx Exchange is an easy-to-use popular choice in Australia.

Categories
Audius Crypto News ICP Market Analysis The Sandbox Trading

Top 3 Coins to Watch Today: AUDIO, ICP, SAND – August 23 Trading Analysis

Let’s take a closer look at today’s altcoins showing breakout signals. We’ll explain what the coin is, then dive into the trading charts and provide some analysis to help you decide.

1. Audius (AUDIO)

Audius AUDIO is a decentralised music-sharing and streaming protocol that facilitates direct transactions between listeners and creators, giving everyone the freedom to distribute, monetise, and stream any audio content. Audius aims to align the interests of artists, fans and node operators through its platform powered by its native AUDIO token. Artists can upload music, stored and distributed by content and discovery nodes, that fans can listen to for free.

AUDIO Price Analysis

At the time of writing, AUDIO is ranked the 122nd cryptocurrency globally and the current price is US$0.2989. Let’s take a look at the chart below for price analysis:

Source: TradingView

AUDIO has been consolidating between approximately $0.509 and $0.282 since early May 2022. The high end of this range, from $0.496 to $0.563, could provide significant resistance. A rally to this level would partially fill an area of inefficient trading on the monthly, weekly, and daily charts. It would also run bears’ stops above the summer’s consolidation.

The swing high near $0.440 could provide a closer resistance. If the price can reach this level, it will run bears’ stops above the recent sharp move downward. It’s also near the June monthly open.

The closest resistance may be an area between $0.352 and $0.377. This level shows buying before August 11’s run on bears’ stops, contains the 40 EMA, and has inefficient trading on the daily chart.

Currently, the price is testing possible support near $0.306. At this level, bulls rejected bears in mid-June near the bottom of inefficient trading on the monthly chart. The price has already swept some bulls’ stops as it creates relative equal lows. 

These relative equal lows may suggest that this level will later break. Yet, in the short term, it could prompt a rally toward resistance.

If the price breaks down from its consolidation range, $0.215 may provide the next higher-timeframe support. Here, the weekly chart shows accumulation before early 2021’s rally.

A sustained downtrend could reach $0.077 or below, where the monthly chart shows inefficient trading. Higher-timeframe support below this level is unclear due to a lack of historical price action.

2. Internet Computer (ICP)

The Internet Computer ICP is the world’s first blockchain that runs at web speed with unbounded capacity. It also represents the third major blockchain innovation alongside Bitcoin and Ethereum. The Internet Computer scales smart contract computation and data, runs them at web speed, processes and stores data efficiently, and provides powerful software frameworks to developers. By making this possible, it enables the complete re-imagination of software, providing a revolutionary new way to build tokenised internet services, pan-industry platforms, decentralised financial systems, and even traditional enterprise systems and websites.

ICP Price Analysis

At the time of writing, ICP is ranked the 35th cryptocurrency globally and the current price is US$6.22. Let’s take a look at the chart below for price analysis:

Source: TradingView

ICP has consolidated since mid-May and is approaching the bottom of this range. An area near $5.95 could provide support. It’s below relative equal lows, offering bears an attractive target, and shows inefficient trading on the daily chart.

A run to this level may drop slightly lower, near $5.54, to touch the midpoint of accumulation on the weekly chart. No historical price action exists to suggest support below this area. The 50% extension on late July’s bullish impulse could hint at possible support and a bearish target near $4.25.

The closest resistance might exist between $7.17 and $7.60. This area shows inefficient trading on the daily chart above the midpoint of the recent drop. It also contains the 18 and 40 EMAs. If the price does break through this level, it could retest the August monthly open near $8.99. Bears rejected bulls here on all timeframes.

A more substantial rally may run bears’ stops above relative equal highs near $9.80. This potential move could reach into an area of inefficient trading on the monthly and weekly charts above, up to $11.28. Stronger resistance might begin near $10.24, where the daily chart showed brief distribution on May 10.

3. The Sandbox (SAND)

The Sandbox SAND is a blockchain-based virtual world allowing users to create, build, buy and sell digital assets in the form of a game. By combining the powers of decentralised autonomous organisations (DAOs) and non-fungible tokens (NFTs), the Sandbox creates a decentralised platform for a thriving gaming community. The Sandbox employs the powers of blockchain technology by introducing the SAND utility token, which facilitates transactions on the platform.

SAND Price Analysis

At the time of writing, SAND is ranked the 38th cryptocurrency globally and the current price is US$1.02. Let’s take a look at the chart below for price analysis:

Source: TradingView

SAND has also been consolidating since mid-May and is retesting its range lows. An area between $0.9798 and $0.8995 offers the highest odds of holding if bulls want to keep the price in its range. This area near the range’s lows is the upper half of accumulation on the weekly chart. It also ran stops under early May’s swing low. 

If the downtrend resumes, the price may reach as low as $0.3827. This area shows inefficient trading formed on the weekly chart as July 2021’s rally kicked off. The price has not yet indicated that it will head for this level.

Inefficient trading near $1.2026 may provide the first resistance. This area contains the 18 and 40 EMAs and overlaps with old swing lows.

Bears rejected bulls in late July and early August near $1.3384. This area, just above the August monthly open, could provide resistance again.

An area of inefficient trading from $1.5373 to $1.6298 offers an attractive target to bulls and could provide significant resistance. Reaching this gap would allow bulls to run many bears’ stops above the summer’s range highs.

Learn How to Trade Live!

Join Dave and The Crypto Den Crew and they’ll show you live on a webinar how to take your crypto trading to the next level.

Where to Buy or Trade Altcoins?

These coins have high liquidity on Binance Exchange, so that could help with trading on AUD/USDT/BTC pairs. And if you’re looking at buying and HODLing cryptos, then Swyftx Exchange is an easy-to-use popular choice in Australia.

Categories
Avalanche Axie Infinity Cosmos Crypto News Market Analysis Trading

Top 3 Coins to Watch Today: AXS, ATOM, AVAX – August 22 Trading Analysis

Let’s take a closer look at today’s altcoins showing breakout signals. We’ll explain what the coin is, then dive into the trading charts and provide some analysis to help you decide.

1. Axie Infinity (AXS)

Axie Infinity AXS is a blockchain-based trading and battling game that is partially owned and operated by its players. The Axie Infinity ecosystem has its own unique governance token, known as Axie Infinity Shards AXS. These are used to participate in key governance votes and give holders a say in how funds in the Axie Community Treasury are spent.

AXS Price Analysis

At the time of writing, AXS is ranked the 44th cryptocurrency globally and the current price is US$14.39. Let’s take a look at the chart below for price analysis:

Source: TradingView

AXS‘s relatively small 20% range could suggest that a recovery is setting up in August. Aggressive bulls could look for entries at the most recent area of support formed near $13.34. However, equal lows near $12.32 make a tempting target for a stop run into this support. This move could reach support near $11.90. 

A decisive move to the downside could run stops below the second set of relatively equal lows near $10.80, possibly reaching support at an old swing high and a daily gap near $10.00.

A recent level near $18.84 provided resistance and caused a swing high to form near $22.88, offering first targets. A move through this high may arrive at new monthly high levels near $24.40 and $26.13.

2. Cosmos (ATOM)

Cosmos ATOM bills itself as a project that solves some of the “hardest problems” facing the blockchain industry. It aims to offer an antidote to “slow, expensive, unscalable and environmentally harmful” proof-of-work protocols, like those used by Bitcoin, by offering an ecosystem of connected blockchains. ATOM tokens are earned through a hybrid proof-of-stake algorithm and they help to keep the Cosmos Hub, the project’s flagship blockchain, secure. This cryptocurrency also has a role in the network’s governance.

ATOM Price Analysis

At the time of writing, ATOM is ranked the 26th cryptocurrency globally and the current price is US$10.60. Let’s take a look at the chart below for price analysis:

Source: TradingView

ATOM has been consolidating in a range around Q1 2022’s high. Q2 2022 saw the start of a smaller range inside this larger range. Near the current price, $10.00 or $8.60 could support at least a small move upward. This area is near the local range low, inefficiently traded, and the site of a stop run.

Just above the current price, the 9, 18 and 40 EMAs may provide resistance near $11.86. This level saw consolidation before last week’s downward move.

A move back toward the local range highs could reach possible resistance near $12.65, where bears rejected the recent rally. This level is just above the May monthly open.

A more extended move by bulls may reach the larger range’s rejection area near $13.81. However, a move this far is less likely unless the overall market rallies.

Below the higher timeframe’s range, $8.25 to $7.80 could provide more substantial support to start a longer-term bullish trend. This level is near the 78.6% retracement of the July 2021 to September 2021 rally, shows inefficient trading on higher-timeframe charts, especially between $7.05 and $6.70, and provides a reasonable stop run target.

3. Avalanche (AVAX)

Avalanche AVAX is the fastest smart contracts platform in the blockchain industry, as measured by time-to-finality, and has the most validators securing its activity of any proof-of-stake protocol. Avalanche is also low-cost, and green. Any smart contract-enabled application can outperform its competition on Avalanche.

AVAX is the native token of Avalanche. It is a hard-capped, scarce asset that is used to pay for fees, secure the platform through staking, and provide a basic unit of account between the multiple subnets created on Avalanche.

AVAX Price Analysis

At the time of writing, AVAX is ranked the 15th cryptocurrency globally and the current price is US$22.83. Let’s take a look at the chart below for price analysis:

Source: TradingView

AVAX‘s gains in Q2 ended with an almost 80% retracement as the rest of the altcoin market dropped after May. Bulls stepped in near the 62.8% retracement of Q2’s move, creating a consolidation that ended with the bullish impulse to resistance near $27.30.

With the 9, 18 and 40 EMAs stacked bullish and a bullish higher-timeframe trend, it’s reasonable to anticipate retracement to possible support before further bullish expansion. 

Near the 40 EMA, a broad zone from $21.35 to $19.30 could see interest from bulls before further expansion. Bears may capitalise on any sharp moves down in Bitcoin, aiming for possible support near the 75% retracement, at $17.10, and potentially lower to a higher-timeframe support zone between $16.70 and $15.22.

If the higher-timeframe recovery trend resumes and the current resistance near $29.64 breaks, the wicks near $35.14 and the new monthly highs may see profit-taking.

Learn How to Trade Live!

Join Dave and The Crypto Den Crew and they’ll show you live on a webinar how to take your crypto trading to the next level.

Where to Buy or Trade Altcoins?

These coins have high liquidity on Binance Exchange, so that could help with trading on AUD/USDT/BTC pairs. And if you’re looking at buying and HODLing cryptos, then Swyftx Exchange is an easy-to-use popular choice in Australia.

Categories
Crypto News Enjin Coin EOS HedgeTrade Market Analysis Uniswap

Top 3 Coins to Watch Today: EOS, ENJ, UNI – August 19 Trading Analysis

Let’s take a closer look at today’s altcoins showing breakout signals. We’ll explain what the coin is, then dive into the trading charts and provide some analysis to help you decide.

1. Eos (EOS)

EOS is a platform designed to allow developers to build decentralised apps. The project’s goal is relatively simple: to make it as straightforward as possible for programmers to embrace blockchain technology and ensure the network is easier to use than rivals. As a result, tools and a range of educational resources are provided to support developers who want to build functional apps quickly. EOS also aims to improve the experience for users and businesses. While the project tries to deliver greater security and less friction for consumers, it also vies to unlock flexibility and compliance for enterprises.

EOS Price Analysis

At the time of writing, EOS is ranked the 40th cryptocurrency globally and the current price is US$1.45. Let’s take a look at the chart below for price analysis:

Source: TradingView

EOS has plummeted nearly 75% from its April 2022 highs and almost 90% from its May 2021 all-time high.

The closest resistance overlaps with the 8 EMA near $1.60, where the daily chart shows inefficient trading. This level rejected the price’s first retest on May 13.

Slightly higher, $1.78 offers the next noteworthy resistance. This area was inefficiently traded and overlaps with the last significant swing low in mid-March.

Last week, the price bounced from support near $1.30, which could provide support again. This level shows inefficient trading on the monthly chart and is near the midpoint of September 2017’s accumulation.

If this support breaks, bulls could find support near $1.24. This level is at the bottom of an inefficiently traded area on the monthly and weekly charts. It’s also the high point of October 2017’s accumulation range. However, eager bidders should be cautious as a move this low may be targeting bulls’ stops under the swing low at $1.12.

2. Enjin Coin (ENJ)

Enjin Coin ENJ is a project of Enjin, a company that provides an ecosystem of interconnected, blockchain-based gaming products. Enjin’s flagship offering is the Enjin Network, a social gaming platform through which users can create websites and clans, chat, and host virtual item stores. Enjin Coin is a digital store of value used to back the value of blockchain assets such as non-fungible tokens (NFTs).

ENJ Price Analysis

At the time of writing, ENJ is ranked the 75th cryptocurrency globally and the current price is US$0.6509. Let’s take a look at the chart below for price analysis:

Source: TradingView

ENJ spent Q2 ranging between 31% over and 23% below. The price is currently consolidating between adjacent resistance and support at $0.6045 with no clear higher-timeframe trend. A strong move over the monthly open could signal a run to resistance beginning near $0.7295. 

This move would likely target the swing high at $0.7612 and relatively equal highs near $0.8349. A sustained bullish trend could reach up to the monthly high near $0.9032.

Bulls may see a sweep of the relatively equal lows near $0.5532 as a chance to buy at a discount. If this level fails to hold, the next significant area for the price to find buyers is likely near the consolidation around $0.4835 and $0.4150.

3. Uniswap (UNI)

Uniswap UNI is a popular decentralised trading protocol known for its role in facilitating the automated trading of decentralised finance (DeFi) tokens. Uniswap aims to keep token trading automated and completely open to anyone who holds tokens while improving the efficiency of trading versus that on traditional exchanges. Uniswap creates more efficiency by solving liquidity issues with automated solutions, avoiding the problems that plagued the first decentralised exchanges.

UNI Price Analysis

At the time of writing, UNI is ranked the 17th cryptocurrency globally and the current price is US$7.91. Let’s take a look at the chart below for price analysis:

Source: TradingView

UNI‘s 70% retracement from its Q2 highs set a low near $4.20 during its consolidation that began in early June.

Relatively equal highs near $8.00 could be the current target if the price breaks through resistance beginning near $8.67. Bullish continuation may reach through the next significant swing high near $9.35 into the daily gap near $10.50.

If bullish strength continues, the zones just below the monthly open near $10.88 and $11.35 could halt any retracement. 

A bearish shift in the market might seek the relatively equal lows near $6.90 into possible support near $6.12. If this down move occurs, the swing low near $5.20 and possible support near $4.80 may be the primary objective.

Learn How to Trade Live!

Join Dave and The Crypto Den Crew and they’ll show you live on a webinar how to take your crypto trading to the next level.

Where to Buy or Trade Altcoins?

These coins have high liquidity on Binance Exchange, so that could help with trading on AUD/USDT/BTC pairs. And if you’re looking at buying and HODLing cryptos, then Swyftx Exchange is an easy-to-use popular choice in Australia.

Categories
Chiliz Crypto News Filecoin Horizen Market Analysis Trading

Top 3 Coins to Watch Today: FIL, CHZ, ZEN – August 18 Trading Analysis

Let’s take a closer look at today’s altcoins showing breakout signals. We’ll explain what the coin is, then dive into the trading charts and provide some analysis to help you decide.

1. Filecoin (FIL)

Filecoin FIL is a decentralised storage system that aims to “store humanity’s most important information”. The project was first described back in 2014 as an incentive layer for the Interplanetary File System (IPFS), a peer-to-peer storage network. Filecoin is an open protocol backed by a blockchain that records commitments made by the network’s participants, with transactions using FIL, the blockchain’s native currency. The blockchain is based on both proof-of-replication and proof-of-space-time.

FIL Price Analysis

At the time of writing, FIL is ranked the 33rd cryptocurrency globally and the current price is US$8.22. Let’s take a look at the chart below for price analysis:

Source: TradingView

FIL has dropped 85% from its Q2 highs, finding support near $5.16 before starting a consolidation range. This level, near the lows, could continue to provide support. A year-long consolidation from 2019 to 2020 pivoted around this level many times. It’s also near the middle of the last down candle before 2020’s massive rally. A retest of this level would run bulls’ stops under swing lows formed in late June and early July.

The price is testing a closer area of possible support near $7.83. Bulls rejected bears many times in early July at this level. It’s also in the upper part of July’s swing low candle. The closest resistance is likely near $8.65. This area, up to $9.40, shows inefficient trading on the daily chart. It also contains the 9 and 18 EMAs.

If the price breaks through this level, it may aim for bears’ stops above $9.72. Even if it doesn’t reach these stops, the area between $9.96 and $10.18 could provide a bearish setup. Here, bears rejected bulls near the bottom of an area of inefficient trading on the weekly chart.

If the market turns more bullish, a rally beginning in this range may be aiming for the new monthly highs, near $10.40. This level is near the bottom of an area of inefficient trading on the daily chart.

2. Chiliz (CHZ)

Chiliz CHZ is the leading digital currency for sports and entertainment, powering the world’s first blockchain-based fan engagement and rewards platform, Socios.com. Here, fans can purchase and trade branded fan tokens as well as having the ability to participate, influence, and vote in club-focused surveys and polls. Founded in Malta in 2018, the company states its vision is to bridge the gap between active and passive fans, providing millions of sports fanatics with a fan token that acts as a tokenised share of influence.

CHZ Price Analysis

At the time of writing, CHZ is ranked the 46th cryptocurrency globally and the current price is US$0.2196. Let’s take a look at the chart below for price analysis:

Source: TradingView

CHZ‘s stunning rally to $0.2550 plummeted over 13% to sweep consolidation lows at $0.1925. This could set the stage for a new bullish cycle to begin. 

The price is currently balancing around the monthly open. A quick stop run into support beginning near $0.1820 could set the stage for a move into the daily gap beginning near $0.1735, potentially reaching resistance near $0.2437.

A sweep of the highs near $0.2558, followed by a sharp sell-off, hints that bulls are preparing to run the swing high near $0.2647. This run could find the next resistance around $0.2846 in the candle wick that created the monthly high. If the market remains bullish, the price will likely reach into possible resistance near $0.3028.

3. Horizen (ZEN)

Horizen ZEN is an interoperable blockchain system supported by a decentralised node infrastructure. Its sidechain platform focuses on scalable data privacy, and as such enables businesses as well as developers to build private or public blockchains using the unique sidechain technology known as Zendoo. Horizen claims to be completely decentralised, fully customisable with privacy features, and supports low costs associated with building blockchains with configurable revenue models and an unlimited number of tokens and digital assets.

ZEN Price Analysis

At the time of writing, ZEN is ranked the 126th cryptocurrency globally and the current price is US$20.98. Let’s take a look at the chart below for price analysis:

Source: TradingView

ZEN saw an energetic run during Q1, climbing approximately 70% before cooling off into resistance beginning near $32.85 that pinned down last month’s attempt to rally, which is likely to retest possible support near $15.64.

A deeper marketwide retracement could take out the relatively equal lows below the weekly open and support near $18.23. This move may offer entries near probable support between $17.47 and $16.78.

However, more bullish market conditions may prompt a rally to the relatively equal highs near $24.67 into resistance beginning at $26.46. If the price reaches this level, the last high at $29.58 gives the next likely target before price discovery begins.

Learn How to Trade Live!

Join Dave and The Crypto Den Crew and they’ll show you live on a webinar how to take your crypto trading to the next level.

Where to Buy or Trade Altcoins?

These coins have high liquidity on Binance Exchange, so that could help with trading on AUD/USDT/BTC pairs. And if you’re looking at buying and HODLing cryptos, then Swyftx Exchange is an easy-to-use popular choice in Australia.

Categories
Algorand Burger Swap Crypto News Market Analysis Qtum Trading

Top 3 Coins to Watch Today: BURGER, QTUM, ALGO – August 17 Trading Analysis

Let’s take a closer look at today’s altcoins showing breakout signals. We’ll explain what the coin is, then dive into the trading charts and provide some analysis to help you decide.

1. Burger Swap (BURGER)

BurgerSwap BURGER is one of the first democratised, decentralised automated market makers (AMMs) on the Binance Smart Chain (BSC). It was built without the control of any centralised authorities through the use of smart contracts. BURGER token staking allows any user to create proposals and influence the adjustment of transaction fees, block rewards, and other system parameters of the Burger Swap exchange via voting.

BURGER Price Analysis

At the time of writing, BURGER is ranked the 470th cryptocurrency globally and the current price is US$1.56. Let’s take a look at the chart below for price analysis:

Source: TradingView

After a 45% retracement from its June highs, BURGER found a temporary low near $1.45. A recent move above $1.70 could be the first sign of a bullish shift but could also be a stop run before the next drop lower. 

If the market adopts a more bullish tone, the price could run through the most recent swing high. If this bounce occurs, it would likely find some resistance near $1.93, possibly reaching up to $2.10.

However, a move below the closest support near $1.40 makes stop runs on the swing lows near $1.35 and $1.26 likely. A confluence of several levels near $1.15 could provide a temporary bounce. Still, a sustained bullish market will likely target $2.00 and even $2.07.

2. Quantum (QTUM)

Quantum QTUM is a proof-of-stake (PoS) smart contract open-source blockchain platform and value transfer protocol, aiming to bring together the strengths of Bitcoin and Ethereum in one chain. QTUM is built on Bitcoin’s UTXO transaction model, with the added functionality of smart contract execution and DApps. Recently, the platform added support for DeFi applications. 

QTUM Price Analysis

At the time of writing, QTUM is ranked the 99th cryptocurrency globally and the current price is US$4.02. Let’s take a look at the chart below for price analysis:

Source: TradingView

QTUM retraced 70% from its Q2 highs before forming a new low near a cluster of older relatively equal lows in late June.

Last week’s sharp rally reached probable resistance near $4.67. This level is near the 61.8% and 78.6% retracements of the last significant move upward.

Possible support rests just below the monthly open, near $3.80. This area saw significant consolidation in late July. It remains to be seen whether this is a run on bears’ stops before a more substantial move down, or a bullish shift in market structure that could lead to a more significant rally.

With the overall market being bearish and significant numbers of equal lows enticing bears below, traders may want to watch possible support near $3.65. This area is inefficiently traded and borders the last accumulation before Q1’s stunning rally.

Suppose this is the start of a more significant rally. In which case bulls might target $4.38, where higher timeframes show an inefficiently traded area near multiple bearish rejections during December 2021. A powerful bullish swing could reach up to $5.20, where early December saw inefficient trading and the bulk of Q3 2021’s trading took place.

3. Algorand (ALGO)

The Algorand ALGO blockchain is a permissionless, pure proof-of-stake blockchain protocol. Unlike proof-of-work (PoW) blockchains, where the root block must be validated by randomly selected validators (using computing power), in the pure proof-of-stake approach all of the validators are known to one another and only have to agree on the next block in order to create a new block. Algorand was invented to speed up transactions and improve efficiency in response to the slow transaction times of Bitcoin and other blockchains.

ALGO Price Analysis

At the time of writing, ALGO is ranked the 30th cryptocurrency globally and the current price is US$0.3545. Let’s take a look at the chart below for price analysis:

Source: TradingView

After creating a second equal low during last month, ALGO gained nearly 20% into resistance that starts near $0.4022.

Swing traders looking for a continuation to the nearest cluster of relatively equal highs around $0.4712 might look for bids near $0.5326. More significant resistance rests above, near $0.5925. A group of significant swing highs at $0.6310 and $0.6518 provide possible targets if this resistance breaks.

A stop run on the recent low at $0.3071 into possible support beginning near $0.2430 might see stronger bidding. This area also has a confluence with the recent monthly lows.

Learn How to Trade Live!

Join Dave and The Crypto Den Crew and they’ll show you live on a webinar how to take your crypto trading to the next level.

Where to Buy or Trade Altcoins?

These coins have high liquidity on Binance Exchange, so that could help with trading on AUD/USDT/BTC pairs. And if you’re looking at buying and HODLing cryptos, then Swyftx Exchange is an easy-to-use popular choice in Australia.

Categories
Crypto News Market Analysis Seedify.fund Trading Unifi Protocol DAO

Top 3 Coins to Watch Today: UNFI, SFUND, LUFFY – August 16 Trading Analysis

Let’s take a closer look at today’s altcoins showing breakout signals. We’ll explain what the coin is, then dive into the trading charts and provide some analysis to help you decide.

1. Unifi Protocol DAO (UNFI)

Unifi Protocol UNFI is a revolutionary approach to decentralised finance (DeFi). Launched in 2020, the network aims to bring modern technology to the financial world. By employing the innate security and decentralisation features of blockchain technology, and the automation of smart contracts, Unifi Protocol DAO offers users the ability to develop DeFi solutions for their enterprise. This project combines the power of several blockchains and relies on the foundation of Ethereum DApp and DeFi development.

UNFI Price Analysis

At the time of writing, UNFI is ranked the 386th cryptocurrency globally and the current price is US$12.82. Let’s take a look at the chart below for price analysis:

Source: TradingView

UNFI has been in a massive consolidation for the past year. Something prompted a 1,595% gain within two days on June 6 yet the price completely retraced this abnormal move, making it less significant when studying the chart.

The 9 and 18 EMAs are near $10.405, which may offer the closest support. This area shows inefficient trading on the daily chart and saw distribution last December on the weekly chart.

A stronger drop could reach the base of the most recent rally, near $7.423 or $6.569. This move would sweep bulls’ stops under early August’s consolidation into the upper part of high-timeframe accumulation. If this move occurs, it may signal an end to the current bullish trend and require waiting for the start of a new trend.

Relative equal swing highs near $13.500 provide the first target and may act as resistance. It’s also at the high point of the current range’s candle bodies. Just above, $15.500 to $16.723 may also draw the price over these highs. It shows previous inefficient trading on the daily, weekly, and monthly charts.

A more sustained bullish trend may reach near $19.014. Bears rejected early June’s massive price spike here. It also shows inefficient trading on the weekly chart and was the origin of a late April 2021 rally.

2. Seedify.fund (SFUND)

Seedify.fund is a blockchain innovation ecosystem, with a community-driven Seed Stage Fund, Decentralised Incubator, and Launchpad. Seedify.fund cross-bridges a community-driven DAO with an incubator/seed fund to provide seed investments to projects selected by community votings.

SFUND Price Analysis

At the time of writing, SFUND is ranked the 290th cryptocurrency globally and the current price is US$2.68. Let’s take a look at the chart below for price analysis.

Source: TradingView

SFUND has had a long, steady downtrend since late December 2021. It created a bullish market structure break in late July on the weekly chart and is now retracing part of its previous downtrend.

The price is dropping into an area of inefficient trading on the daily chart. This area, down to $2.3204, may offer support. It overlaps with the August monthly open and may soon contain the 40 EMA.

A sharper drop could sweep the nearest swing low into another area of inefficient trading, from approximately $2.0278 to $1.8307. This level has confluences with previous and new regions of inefficient trading on the weekly chart. 

The nearest resistance has shown itself at $2.9766. This level is just above the high of inefficient trading on the monthly chart and may not hold on a retest.

If it breaks, bulls may target the swing high at $3.2930. The weekly chart shows inefficient trading from this level up to $3.4504.

Continuation could reach further into an area from approximately $3.6165 to $3.9400. This zone is in the upper half of inefficient trading on the monthly chart. It also shows inefficient trading on the weekly chart and distribution on the daily chart.

3. Luffy (LUFFY)

LUFFY is a community-driven token that was first built on the most secure and well-established blockchain, “The Ethereum Network”, allowing investors and fans to stay decentralised. Due to the growth of the BNB Chain, Luffy Team has decided to develop the ETH/BNB Bridge. Luffy is creating a safe and exciting space for investors and fans alike with modernised tooling, advanced DeFi platforms, education, P2E gaming, metaverse innovations and world-class artwork, as well as helping underpaid anime and manga artists.

LUFFY Price Analysis

At the time of writing, LUFFY is ranked the 2780th cryptocurrency globally and the current price is US$0.000004456. Let’s take a look at the chart below for price analysis:

Source: TradingView

LUFFY has been consolidating inside a range it formed in mid-June. During August, it made an aggressive move toward this range’s high.

The price is testing what may become the closest support at $0.000004347, near the 18 EMA. Here, August 9 saw a partial rebalance of inefficient trading on the daily chart. The price could rally after retesting this range. If so, it may sweep August 9’s swing low first.

A sweep of the August 9 low could reach slightly lower, near $0.000003781. This area also shows inefficient trading, is the origin of the last rally, and has confluence with the July and August monthly opens. Should the market turn significantly more bearish, it may revisit the range lows near $0.000002910.

If today’s high doesn’t reach past $0.000004785, this area could offer the closest resistance. It would show inefficient trading on the daily chart. It also overlaps with the 9 EMA.

A more significant resistance may rest near $0.000005380. Bears have rejected bulls here multiple times. It also shows inefficient trading on the weekly chart. Since the swing highs in this area offer a tempting target for bulls, this weekend’s VC announcement could help propel the price to or beyond this level.

If the rally continues, $0.000006800 is the next higher-timeframe point of interest. Bears rejected bulls here on the monthly chart. The weekly and daily charts show distribution here, and the daily chart shows inefficient trading.

Learn How to Trade Live!

Join Dave and The Crypto Den Crew and they’ll show you live on a webinar how to take your crypto trading to the next level.

Where to Buy or Trade Altcoins?

These coins have high liquidity on Binance Exchange, so that could help with trading on AUD/USDT/BTC pairs. And if you’re looking at buying and HODLing cryptos, then Swyftx Exchange is an easy-to-use popular choice in Australia.