Categories
Crypto News Market Analysis Trading

Fantom FTM Coin pumps +73% in a Single Day amid Collaboration with YFI Yearn Finance

Fantom FTM is trading in an uptrend here like many other altcoins. The Cryptocurrency FTM just went up +73% in a single day by breaking a Falling wedge pattern with strong buying volume and surges over +272% in a week.

What is Fantom?

Fantom is a directed acyclic graph DAG smart contract platform providing decentralized finance DeFi services to developers using its own bespoke consensus algorithm.

Together with its in-house token FTM, Fantom aims to solve problems associated with smart-contract platforms, specifically transaction speed, which developers say they have reduced to under two seconds.

FTM Quick Stats

SYMBOL:FTM
Global rank:44
Market cap:$2,450,093,091 AUD
Current price:$1.02 AUD
All time high price:$1.12 AUD
1 day:+73.38%
7 day:+272.96%
1 year:+11172.81%

FTM Price Analysis

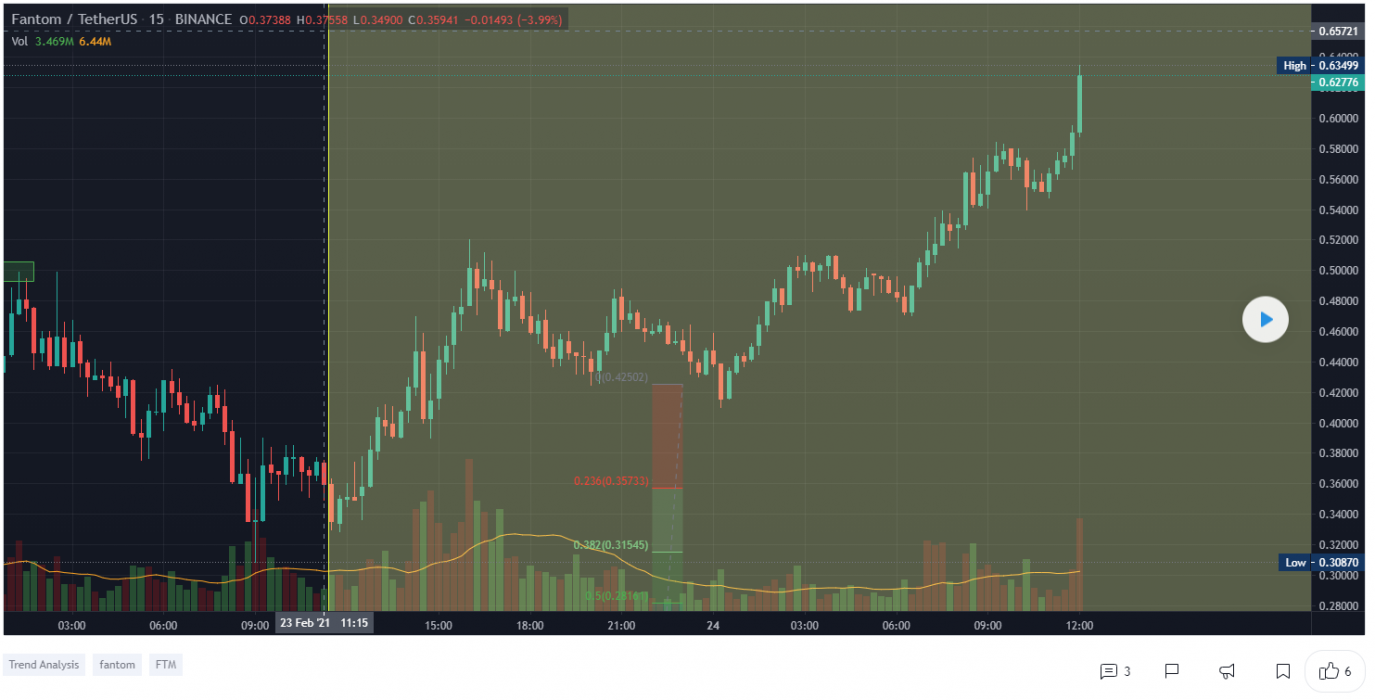
At the time of writing, FTM is ranked 44th cryptocurrency globally and the current price is $1.02 AUD. This is a +272.96% increase since 19th February 2021 (7 days ago) as shown in the chart below.
Source: TradingView

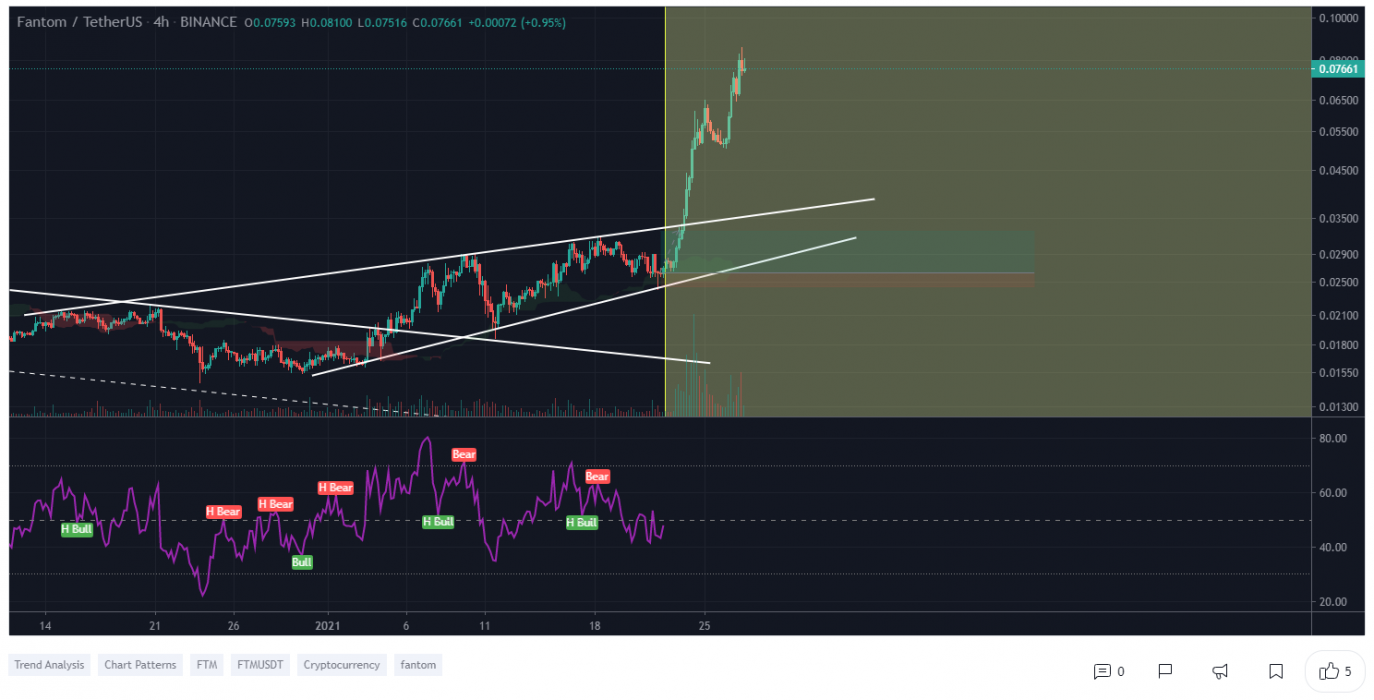
After looking at the above candle chart, we can clearly see that FTM was trading inside the falling wedge pattern on the FTM/USD pair. The first resistance was on the $0.5672 AUD price levels which FTM broke with a strong bullish trend buying volume and is now heading towards the all-time high price in AUD. Seeing that many altcoins are crashing this week, FTM is likely to continue to increase in the uptrend.

“The Falling Wedge is a bullish pattern that begins wide at the top and contracts as prices move lower. This price action forms a cone that slopes down as the reaction highs and reaction lows converge.”

What do the Technical indicators say?

The Fantom FTM TradingView indicators (on the 1 day) mainly indicate FTM as a buy, except the Oscillators which indicate FTM as a sell

So Why did FTM Breakout?

General market sentiment suggests we are in the middle of the bull run season which could have contributed to the recent breakout. Another reason for this sudden pump in price could be the whales secretly buying FTM for the next Altcoins rally & it could also be contributed to some of the recent news of the following 3 reasons why FTM price continues to surge high:

  • Yearn. Finance helps facilitate a cross-chain bridge to Ethereum
  • On-chain governance boosts community involvement
  • Fantom plans to integrate staking and DeFi features

Recent FTM News & Events:

Where to Buy or Trade FTM?

Fantom has the highest liquidity on Binance Exchange so that would help for trading FTM/BTC or FTM/USDT pairs. However, if you’re just looking at buying some quick and hodling then Swyftx Exchange is a popular choice in Australia.

Categories
Crypto News Dogecoin Market Analysis Trading

3 Coins that Might Breakout this Week: DOGE, NPXS, SCRT – Altcoins Trading Analysis

For today’s trading news, we’re looking at three Altcoins that might breakout this week by showing bullish trends in the charts.

1. Dogecoin (DOGE)

Dogecoin (DOGE) is based on the popular “Doge” Internet meme and features a Shiba Inu on its logo. The open-source digital currency was created by Billy Markus from Portland, Oregon, and Jackson Palmer from Sydney, Australia, and was forked from Litecoin in December 2013. Dogecoin’s creators envisaged it as a fun, light-hearted cryptocurrency that would have greater appeal beyond the core Bitcoin audience since it was based on a dog meme. Tesla CEO Elon Musk posted several tweets on social media that Dogecoin is his favorite coin.

Dogecoin Price Analysis

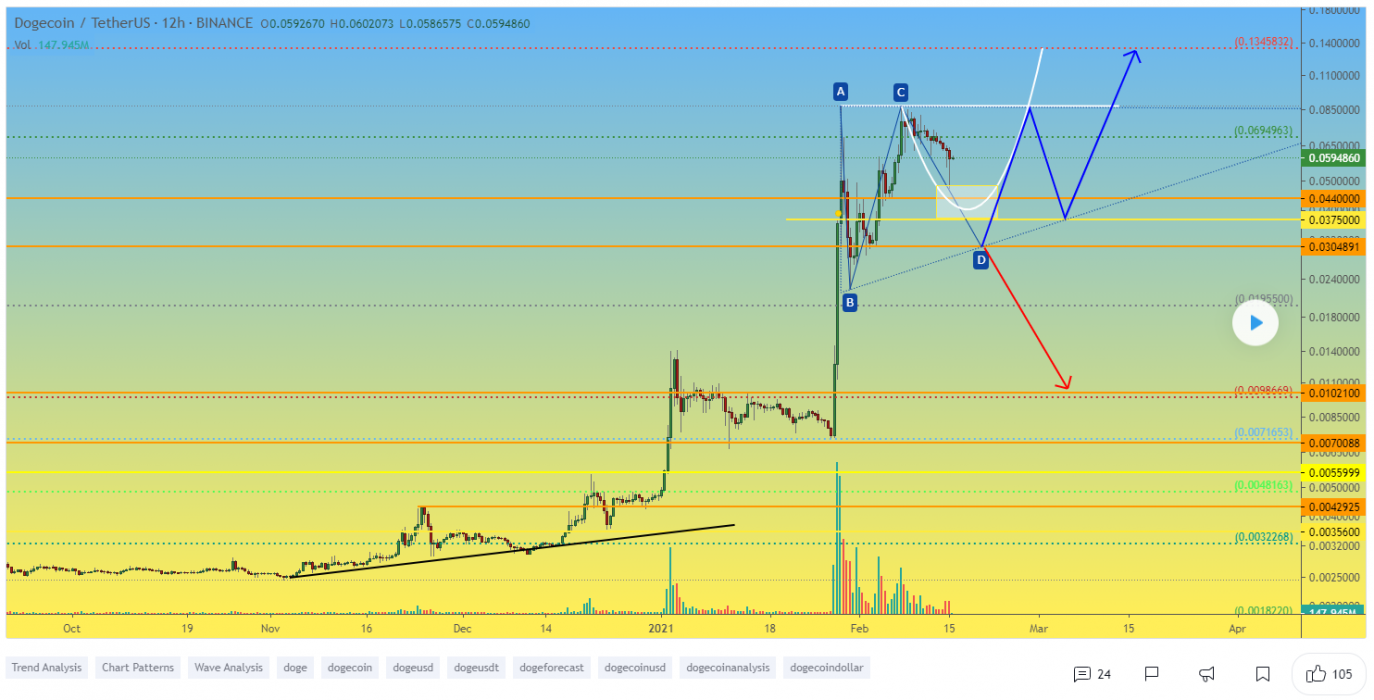
At the time of writing, DOGE is ranked 12th cryptocurrency globally and the current price is $0.0751 AUD. Let’s take a look at the chart below for price analysis.

Source: TradingView

Last week retested the high of DOGE’s +1100% January pump to $0.1092 AUD.

Despite highly manipulated price action, traders could still hunt for lower-timeframe longs. Monday’s retest of the area between $0.0643 AUD and $0.0589 AUD showed some signs of support.

The area between $0.0532 AUD and $0.0498 AUD contains a gap that overlaps with the 0.705 retracement, which increases its chances of giving support. The level near $0.0468 AUD could also form support, although with a higher risk of breaking on a retrace to January’s open.

While the higher-timeframe market structure remains bullish, probable resistance has formed between $0.0713 AUD and $0.0856 AUD, Traders satisfied with their profits could look to exit here if the price returns to this level.

More hopeful bulls could aim for the highs near $0.0985 AUD. If the price breaks through this level, it could reach the 0.27 extension near $0.1253 AUD, with a sustained breakout possibly touching the 1.0 extension near $0.1752 AUD.

2. PundiX (NPXS)

Pundi X is a leading developer of blockchain-powered devices with the aim of transforming retail businesses with its blockchain-based point of sale solution. The solution allows retail merchants and consumers to conduct instantaneous in-store transactions on its blockchain.

The company, which has its headquarters in Singapore, has shipped its XPOS solution and devices to over 25 markets including the United States, Spain, Argentina, Korea, Australia, Colombia, Spain, and Taiwan.

NPXS Price Analysis

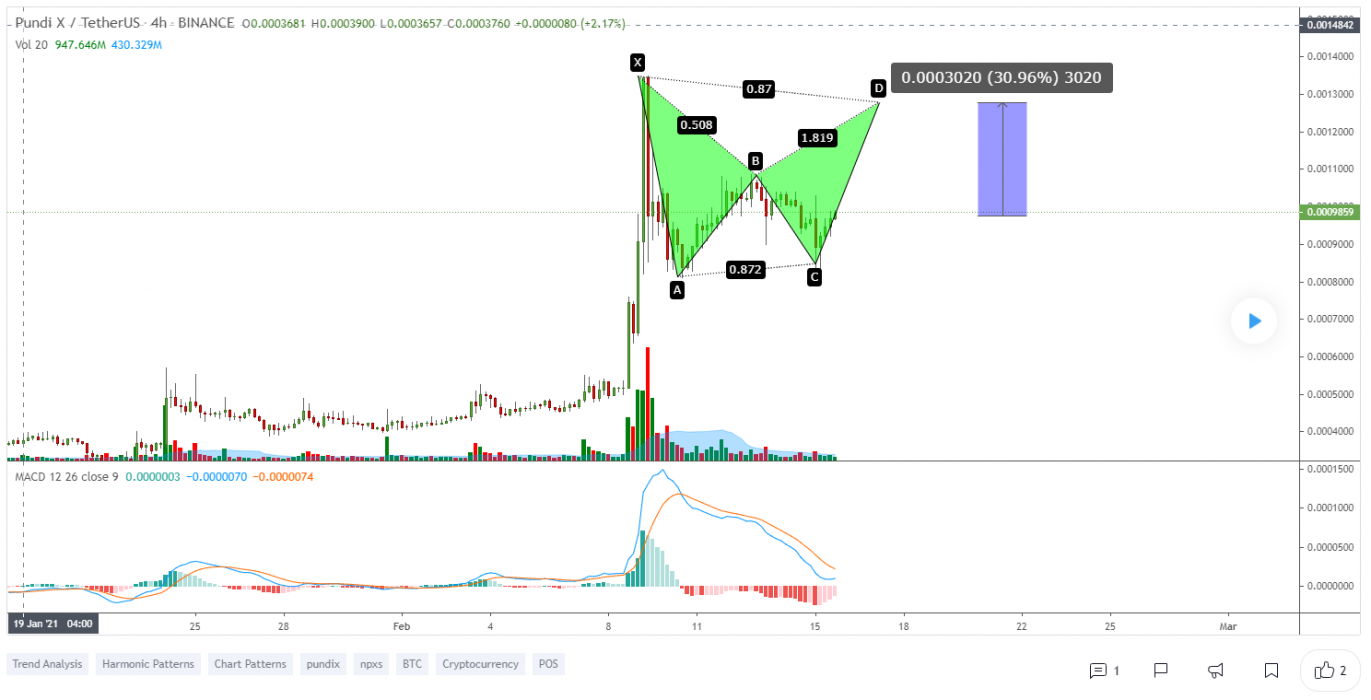
At the time of writing, NPXS is ranked 124th cryptocurrency globally and the current price is $0.0012 AUD. Let’s take a look at the chart below for price analysis.

Source: TradingView

February provided NPXS holders with a respectable +233% return before the price returned to a range around $0.001 to consolidate.

Monday retested a lower-timeframe 0.62 retracement level, which overlaps with a gap beginning at $0.00081 AUD. This level could provide support during the consolidation and potentially offer an aggressive entry on a local lows retest.

The gap near $0.00065 AUD provides a lower risk-reward entry, while a full retrace of January’s move could reach probable support near $0.00048 AUD, just above the February monthly open.

The recent equal highs near $0.00109 AUD cap a resistance area down to $0.00102 AUD while providing a likely near-term target. Probable resistance technically reaches up to the last significant swing high at $0.00175 AUD. Still, a break of this resistance could reach the 0.27 extension at $0.00195 AUD and potentially the 1.0 extension at $0.00253 AUD.

3. Secret (SCRT)

Secret is the native coin of the Secret Network, a decentralized network for private/secure computation. Nodes on the network (known as secret nodes) can perform generalizable computations over encrypted data, which allows smart contracts (known as secret contracts) to use private and sensitive data as inputs. Our focus is on computational privacy, not just transactional privacy. Developers can build decentralized, privacy-preserving “Secret Apps” on the network. The privacy functionality of the Secret Network is critical for many fields, including decentralized finance, Web3, machine learning, access control, and many more.

SCRT Price Analysis

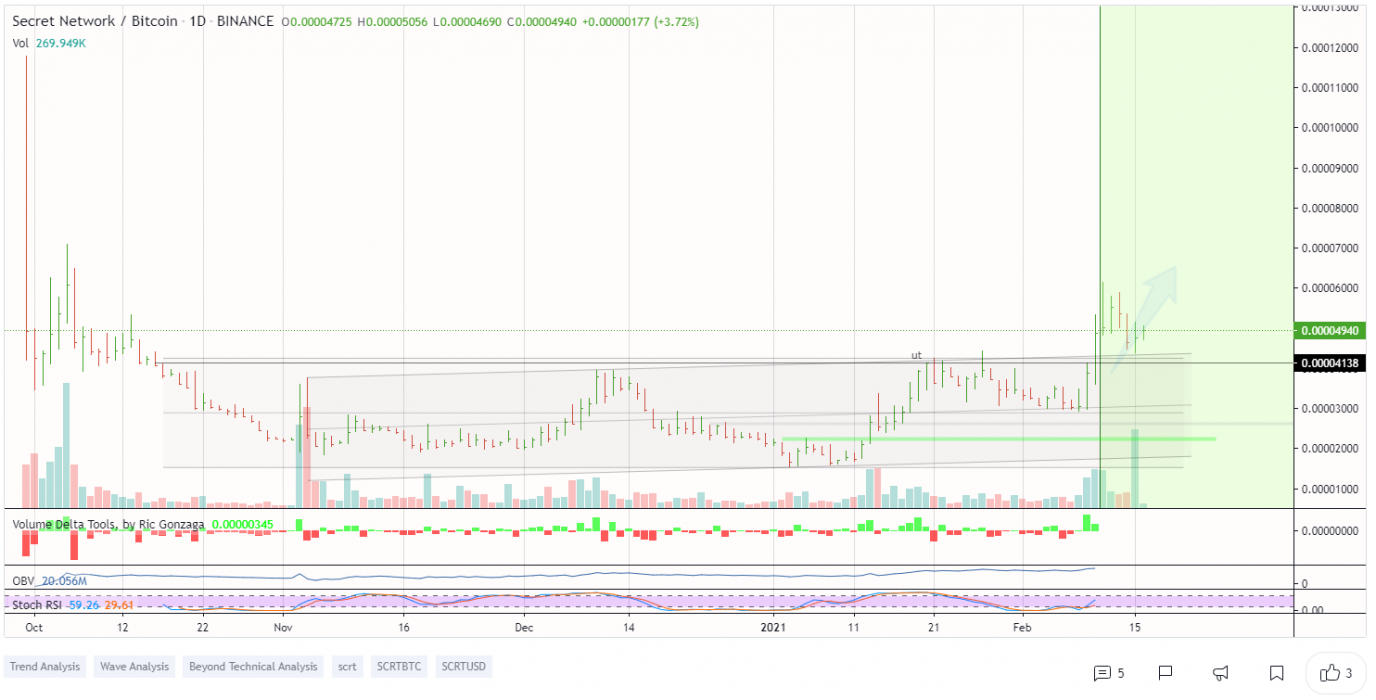
At the time of writing, SCRT is ranked 151st cryptocurrency globally and the current price is $3.12 AUD. Let’s take a look at the chart below for price analysis.

Source: TradingView

SCRT launched nearly +180% upward during February before retracing on Monday to the gap beginning near $2.86 AUD.

Below this gap, the next likely areas of support begin at $2.24 AUD and $1.95 AUD in the consolidation that spawned February’s bullrun.

Equal highs near $2.98 AUD, over the resistance beginning near $2.613 AUD, provide a tempting first target. February’s swing high near $3.65 AUD gives a second target. A move through these levels could reach the .27 extension near $3.78 AUD

If the current support holds, overlapping extensions near $3.95 AUD and $4.36 AUD could hint at the next resistance areas.

Where to Buy or Trade Altcoins?

These 3 Altcoins have the highest liquidity on Binance Exchange so that would help for trading on USDT or BTC pairs. However, if you’re just looking at buying some quick and hodling then Swyftx Exchange is a popular choice in Australia.

Categories
Binance Coin Crypto News Market Analysis Trading

Binance Coin pumps +148% Parabolic High, amid New E-wallet Payment Options in Southeast Asia

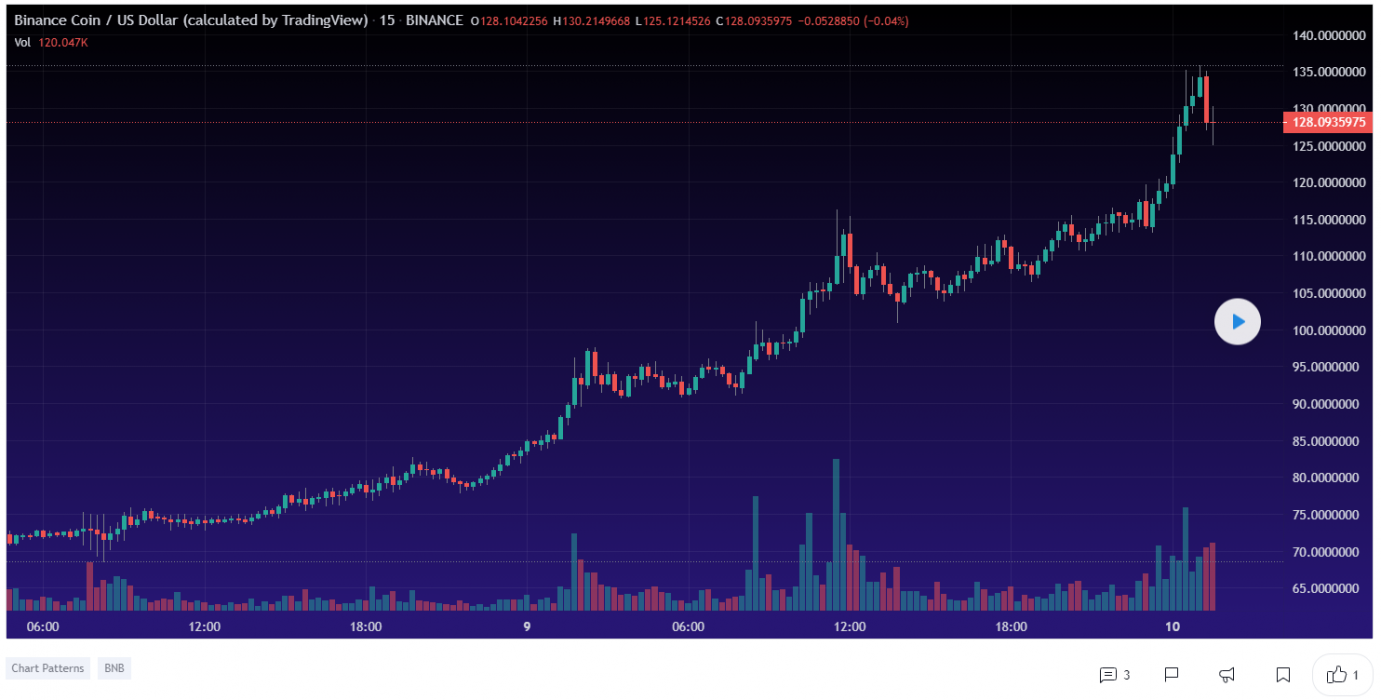
Binance Coin (BNB), the in-house token of cryptocurrency exchange Binance, saw its price hit a new all-time high at $191.62 AUD this week, passing Bitcoin Cash by market capitalization.

BNB took a parabolic Breakout with +148% gains in a week. Let’s take a quick look at BNB, price analysis, and possible reasons for the recent breakout.

What is Binance Coin?

Binance Coin (BNB) is the cryptocurrency of the Binance trading platform exclusively for cryptocurrencies. The name “Binance” is a combination of binary and finance. The BNB token is used for reducing trading fees on the platform.

BNB Quick Stats

SYMBOL:BNB
Global rank:7
Market cap:$25,496,690,411 AUD
Current price:$168.02 AUD
All-time high price:$191.62 AUD
1 day:+29.26%
7 day:+148.70%
1 year:+409.74%

BNB Price Analysis

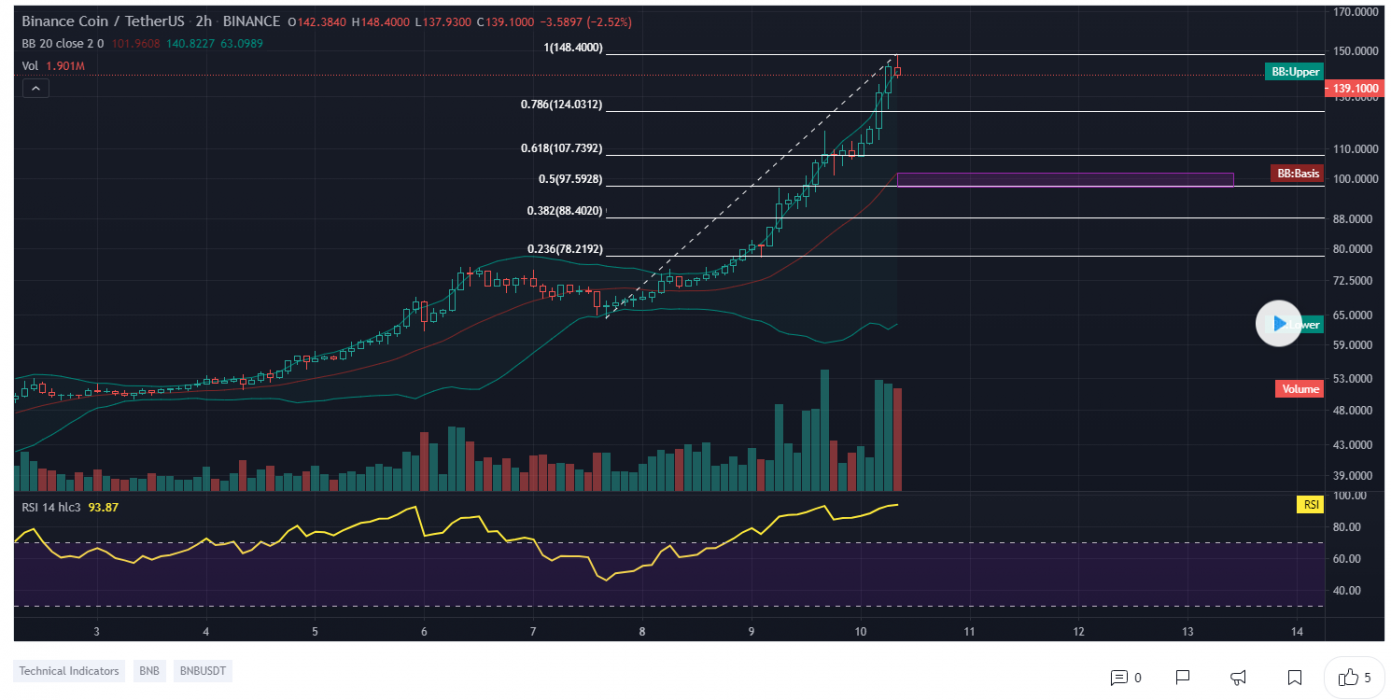
At the time of writing, BNB is ranked 7th cryptocurrency globally and the current price is $168.02 AUD. This is a +148.70% increase from the last 7 days (4th February 2021). Have a look at the chart below for price analysis.

Source: TradingView

After looking at the above 2-hour candle chart, we can clearly see that BNB was trading inside the rising wedge pattern on the BNB/USDT pair. The first resistance was on the $112 AUD price levels which BNB broke with a strong bullish trend buying volume and is now heading towards the all-time high price. Seeing that many altcoins are waking up bullish this week, BNB is likely to continue to increase in the uptrend.

“The Rising Wedge is a bearish pattern that begins wide at the bottom and contracts as prices move higher and the trading range narrows. In contrast to symmetrical triangles, which have no definitive slope and no bullish or bearish bias, rising wedges definitely slope up and have a bearish bias.”

Source: TradingView

What do the Technical indicators say?

The Binance Coin TradingView indicators (on the 1 day) mainly indicate BNB as a buy, except the Oscillators which indicate BNB as a sell.

So Why did BNB Breakout?

Performance appeared buoyed by record volume on Binance itself as trading gathered pace as part of a long-awaited return of “alt season.”

The action was led by Dogecoin surging thanks to tweets by Elon Musk, which Binance CEO Changpeng Zhao used to promote trading on the platform. 

“All-time high on system traffic again. In fact, 3 ATHs in the last 15 minutes,” he revealed on Thursday.

Another reason for this sudden pump in price could be the whales secretly buying BNB for the next Altcoins rally & it could also be contributed to some of the recent news of New E-wallet Payment Options in Southeast Asia at Binance.

Recent BNB News & Events:

Where to Buy or Trade BNB?

Binance Coin has the highest liquidity on Binance Exchange so that would be the best place to buy and for trading BNB/BTC, BNB/USDT, BNB/AUD pairs.

Categories
Crypto News Initial Coin Offering Market Analysis Trading

LIT Pumps +146% Amid listing on Binance Launchpad – Litentry Breakout Analysis

After the launch of Litentry on Binance Launchpad today, LIT took a strong Breakout with +146% gains in a single day. Let’s take a quick look at LIT, price analysis, and possible reasons for the recent breakout.

What is Litentry?

Decentralized identity authentication and user activity data management Infrastructure. Build on Substrate, Ready for Polkadot. Litentry is helping support change that is in favor of a user-centric network with the blockchain. Litentry includes an identity-based network and related tools, features an identity matching and identity staking mechanism, as a whole it consists of decentralized identity and user activity data management infrastructure.

Litentry Quick Stats

SYMBOL:LIT
Global rank:240
Market cap:$168,710,752 AUD
Current price:$11.41 AUD
All-time high price:$12.25 AUD
1 day:+146.26%
7 day:+160.70%
1 year:+160.74%

Litentry Price Analysis

At the time of writing, LIT is ranked 240th cryptocurrency globally and the current price is $11.41 AUD. This is a +160% increase since the launch of its ICO at Binance Launchpad on (4th February 2021). Have a look at the chart below for price analysis.

Source: TradingView

After the launch of Litentry on Binance Launchpad, It pumped up to $12.41 AUD having +394% gains in just a few minutes and the initial opening price of LIT was $2.85 AUD at Binance Exchange with many different trading pairs like LIT/BTC, LITL/USDT, and LIT/BUSD.

Currently, LIT is trading at $11.50 AUD price levels after breaking out the squeeze resistance in its sideways trend & now heading towards its all-time high price.

What do the technical indicators say?

The Litentry TradingView indicators (on the 1 day) mainly indicate LIT as a strong buy, except the Oscillators which indicate LIT as a neutral.

So Why did Litentry Breakout?

After the opening at Binance Launchpad, mostly ICO’s pumps after going live on exchange for trade and, the recent rise in Bitcoin over +300% since the halving in May and then the suggested start of the Altcoin season could have contributed to the recent breakout. It could also be contributed to some recent news of Exchange Listings.

Where to Buy or Trade Litentry?

Litentry has the highest liquidity on Binance Exchange so that would help for trading LIT/BTC or LIT/USDT pairs. However, you can also buy LIT from different exchanges listed on Coinmarketcap.

Categories
Crypto News Ethereum Market Analysis Trading

3 Coins that Might Breakout this Week: ETH, RLC, TOMO – Altcoins Trading Analysis

For today’s trading news, we’re looking at three Altcoins that might breakout this week by showing bullish trends in the charts.

1. Ethereum (ETH)

Ethereum is a decentralized open-source blockchain system that features its own cryptocurrency, Ether. ETH works as a platform for numerous other cryptocurrencies, as well as for the execution of decentralized smart contracts.

Ethereum was first described in a 2013 whitepaper by Vitalik Buterin. Buterin, along with other co-founders, secured funding for the project in an online public crowd sale in the summer of 2014 and officially launched the blockchain on July 30, 2015.

ETH Price Analysis

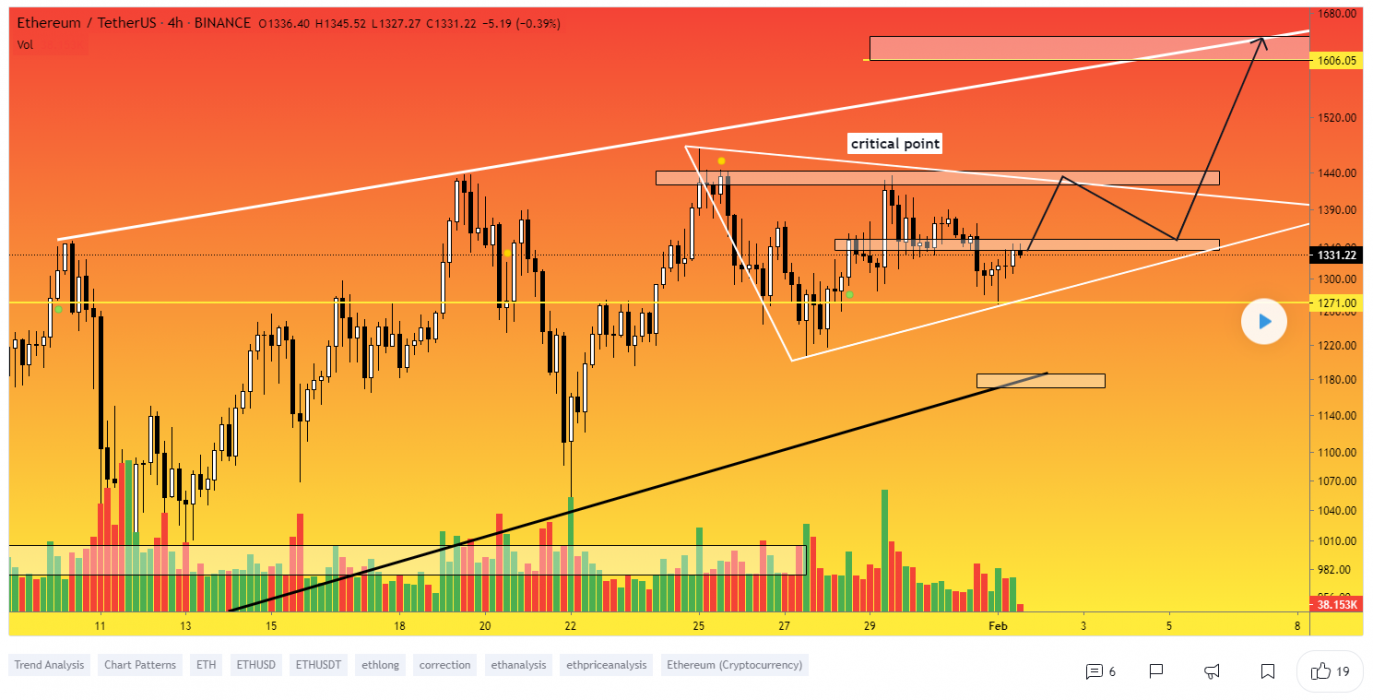
At the time of writing, ETH is ranked 2nd cryptocurrency globally and the current price is $1,812 AUD. Let’s take a look at the chart below for price analysis.

Source: TradingView

ETH’s bullrun met resistance near the beginning of January, with a brief spike above its all-time high being forced back down into support on January 25th.

The current support between $1,492 AUD and $1,407 AUD could form a higher low before a surge above the all-time high, offering aggressive bulls an entry in the current region.

However, a deeper retracement across the crypto market could drop the price to support near $1,330 AUD, possibly creating a wick to fill the gap between $1,090 AUD and $987 AUD and giving longer-term bulls an excellent entry.

If the price breaks resistance between $1,848 AUD and $1,939 AUD, it’s likely to take out the high at $1,975 AUD. The extension near $1,985 AUD provides a reasonable first target, with the extensions at $1,894 AUD, $2,202 AUD, and $2,417 AUD providing reasonable take profit zones.

2. iExec Rlc (RLC)

iExec RLC claims to have developed the first decentralized marketplace for cloud computing resources. Blockchain technology is used to organize a market network where users can monetize their computing power, applications, and datasets. By providing on-demand access to cloud computing resources, iExec is reportedly able to support compute-intensive applications in fields such as AI, big data, healthcare, rendering, or FinTech.

RLC Price Analysis

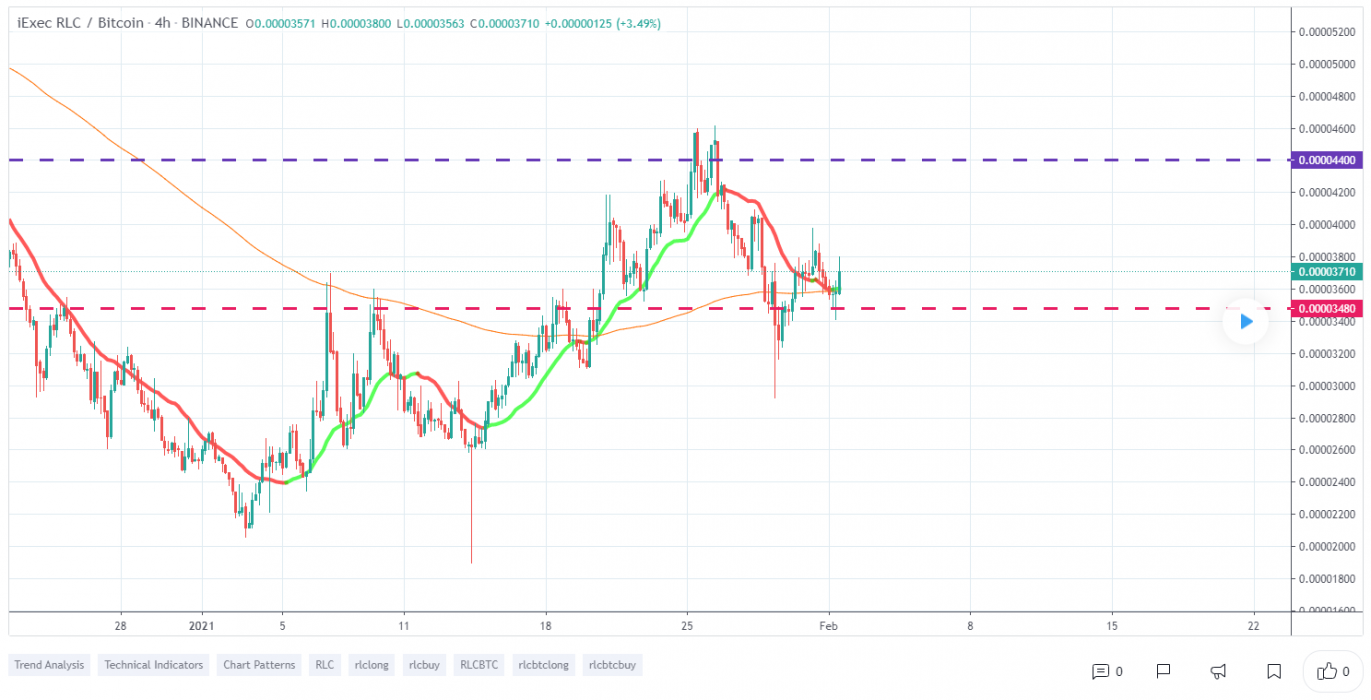
At the time of writing, RLC is ranked 142nd cryptocurrency globally and the current price is $1.66 AUD. Let’s take a look at the chart below for price analysis.

Source: TradingView

RLC printed nearly +164% gains by January 25th. After this move, the price has been consolidating for the last week around a monthly level near $1.55 AUD.

Overlapping support zones should provide bullish strength, with the current region beginning at $1.38 AUD providing a reasonable entry accompanied by a wide stop. Relatively equal daily lows near $1.15 AUD could prompt a stop run that provides a better entry, maybe as low as the next overlapping support area near $0.95 AUD.

January’s high near $1.82 AUD provides the highest probability target, with the next swing high inside resistance at $1.73 AUD giving another target and potential short-term reversal area.

A strong move through this level into resistance beginning at $1.97 AUD is likely to target the monthly high at $2.29 AUD, potentially reaching the next monthly high near $2.95 AUD.

3. TomoChain (TOMO)

TomoChain is a scalable blockchain-powered via Proof-of-Stake Voting consensus which is used commercially by companies globally. Its mission is to accelerate the onboarding of millions of users by empowering today’s applications with technology that masks the friction of Blockchain, all while retaining its underlying benefits. TomoChain’s technology and DeFi-focused flagship products include: Fast & Near-Zero Fees: 2000 TPS, 2-second blocktime, ~$0 gas fees, and EVM compatible. An array of original features and protocols is designed to support speed, privacy, usability, and liquidity needs all in one platform.

TOMO Price Analysis

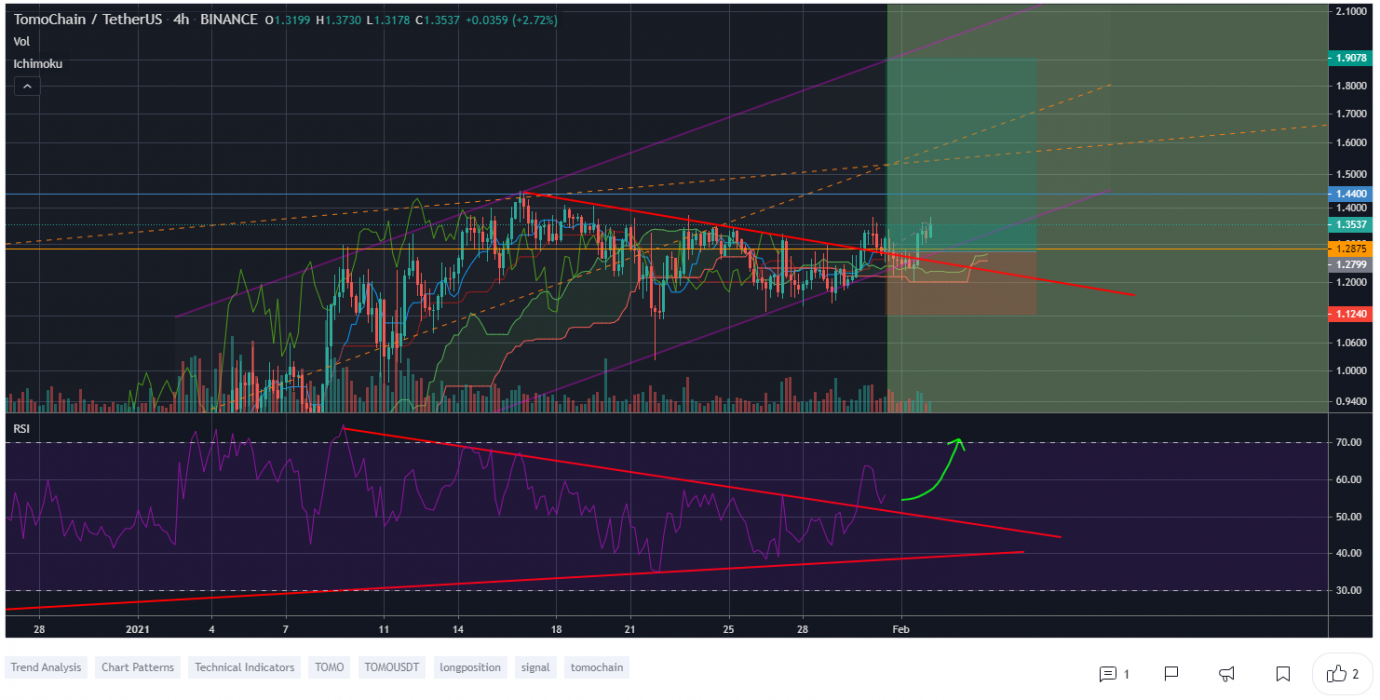
At the time of writing, TOMO is ranked 135th cryptocurrency globally and the current price is $1.78 AUD. Let’s take a look at the chart below for price analysis.

Source: TradingView

January brought a +125% pump at TOMO’s price, almost filling in the bowl-shaped structure between the current price and August’s high.

Bulls can look for entries to form in the current region to ride a parabolic run beyond August’s highs. The previous swing high near $1.52 AUD provided support, although a deeper market-wide retracement could drop the price into the weekly gap between $1.25 AUD and $1.34 AUD.

This region has confluence with a structure from mid-October, making it a highly probable support zone. If January’s move retraces, a similar scenario could appear at the daily gap beginning at $0.92 AUD and support structure near $0.99 AUD.

The resistance beginning at $1.98 AUD contains two swing highs at $2.10 AUD and $2.18 AUD, which provide the first probable targets. Beyond this level, the extension at $2.26 AUD provides a reasonable target for this leg of the move. The extensions at $2.45 AUD and $2.60 AUD also provide rational take-profit levels.

Where to Buy or Trade Altcoins?

These 3 Altcoins have the highest liquidity on Binance Exchange so that would help for trading on USDT or BTC pairs. However, if you’re just looking at buying some quick and hodling then Swyftx Exchange is a popular choice in Australia.

Categories
Crypto News Dogecoin Market Analysis Trading

DOGE coin gains +300% in a Single Day amid Elon Musk Reddit Frenzy PUMP – Breakout Analysis

Dogecoin is trading in an active uptrend here like many other altcoins. The Cryptocurrency DOGE just went up +346% in a single day and surges over +539% in a week and +1,971% in a year . Let’s take a quick look at the Dogecoin price analysis and possible reasons for the recent breakout.

What is Dogecoin?

Dogecoin (DOGE) is based on the popular “Doge” Internet meme and features a Shiba Inu on its logo. The open-source digital currency was created by Billy Markus from Portland, Oregon, and Jackson Palmer from Sydney, Australia, and was forked from Litecoin in December 2013. Dogecoin’s creators envisaged it as a fun, light-hearted cryptocurrency that would have greater appeal beyond the core Bitcoin audience since it was based on a dog meme. Tesla CEO Elon Musk posted several tweets on social media that Dogecoin is his favorite coin.

DOGE Quick Stats

SYMBOL:DOGE
Global rank:11
Market cap:$8,948,508,697 AUD
Current price:$0.0724 AUD
All time high price:$0.1165 AUD
1 day:+346.94%
7 day:+539.13%
1 year:+1971.01%

DOGE Price Analysis

At the time of writing, DOGE is ranked 11th cryptocurrency globally and the current price is $0.0724 AUD. This is a +346% increase since 23rd January 2021 (7 days ago) as shown in the chart below.

Source: TradingView

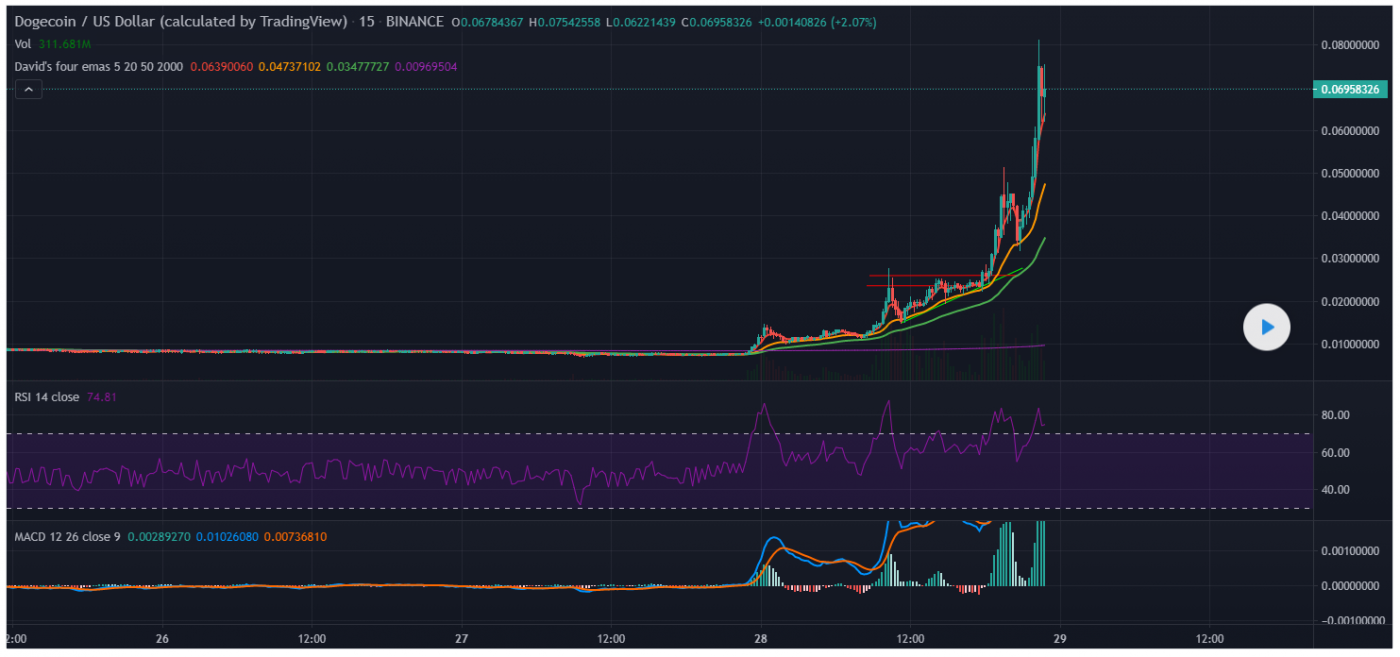
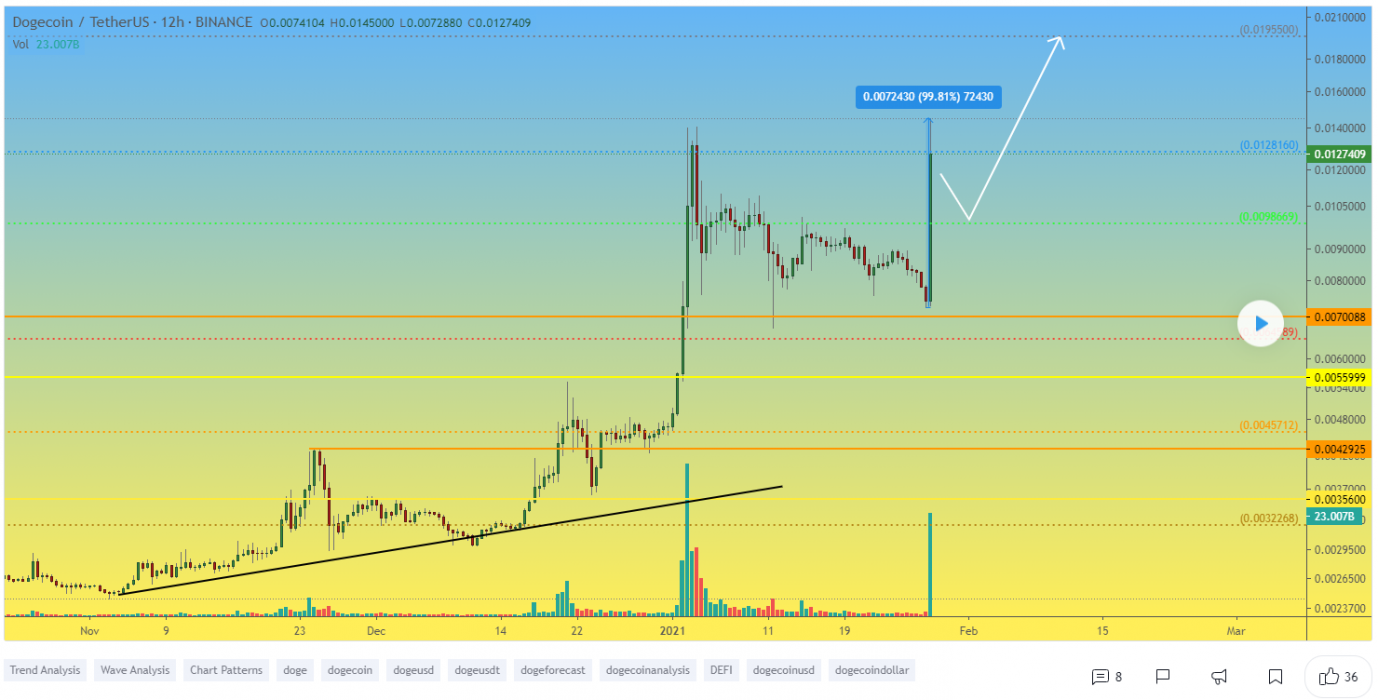
After looking at the above 1-hour candle chart, we can clearly see that Dogecoin was trading sideways on a DOGE/USDT pair. The first resistance was on the $0.0315 AUD price levels which DOGE broke with a strong bullish trend buying volume and is now heading towards the next resistance at $0.0748 AUD & $0.0882 AUD respectively after making a new all-time high price today. Seeing that many altcoins are waking up bullish today, DOGE is likely to continue the uptrend with its hype going around.

Source: TradingView

Yesterday and today DOGE continues to the hype, becoming part of the Defi sector. Dogecoin is now available as renDOGE on the Ethereum network, opening up a whole new world of opportunities for the crypto community. The Dogecoin community can now hold DOGE while spending and participating in DeFi.

What do the Technical Indicators say?

The  Dogecoin TradingView indicators (on the 1 day) mainly indicate DOGE as a buy, except the Oscillators which indicate DOGE as a neutral.

So Why did DOGE Breakout?

The recent rise in Bitcoin over +300% since the halving in May and then the suggested start of the Altcoin season could have contributed to the recent breakout. Another reason could be the whales, secretly stacking up DOGE to their portfolio for this Altcoins rally to me new all-time high prices.

Doge’s resurgence in the last few hours has been due to enthusiasm from a Reddit group called SatoshiStreetBets.

It could also be contributed to some of the recent Elon Musk’s Tweet about DOGE  a photo of a fake magazine cover titled “Dogue” instead of “Vogue.”

Recent DOGE News & Events:

Where to Buy or Trade Dogecoin?

Dogecoin has the highest liquidity on Binance Exchange so that would help for trading DOGE/USDT or DOGE/BTC pairs. However, if you’re just looking at buying some quick then Swyftx Exchange is a popular choice in Australia.

Categories
Crypto News Market Analysis Trading

Fantom Breakout Analysis – FTM Pumps +54% in a Single Day with Active Uptrend

Fantom FTM is trading in uptrend here like many other altcoins. The Cryptocurrency FTM just went up +54% in a single day by breaking a Falling wedge pattern with strong buying volume and surges over +195% in a week.

What is Fantom?

Fantom is a directed acyclic graph DAG smart contract platform providing decentralized finance DeFi services to developers using its own bespoke consensus algorithm.

The Fantom Foundation, which oversees the Fantom product offering, was originally created in 2018, with the launch of OPERA, Fantom’s mainnet, coming in December 2019.

FTM Quick Stats

SYMBOL:FTM
Global rank:95
Market cap:$261,832,939 AUD
Current price:$0.1012 AUD
All time high price:$0.1294 AUD
1 day:+54.38%
7 day:+195.96%
1 year:+759.81%

FTM Price Analysis

At the time of writing, FTM is ranked 95th cryptocurrency globally and the current price is $0.1012 AUD. This is a +195.96% increase since 21st January 2021 (7 days ago) as shown in the chart below.

Source: TradingView

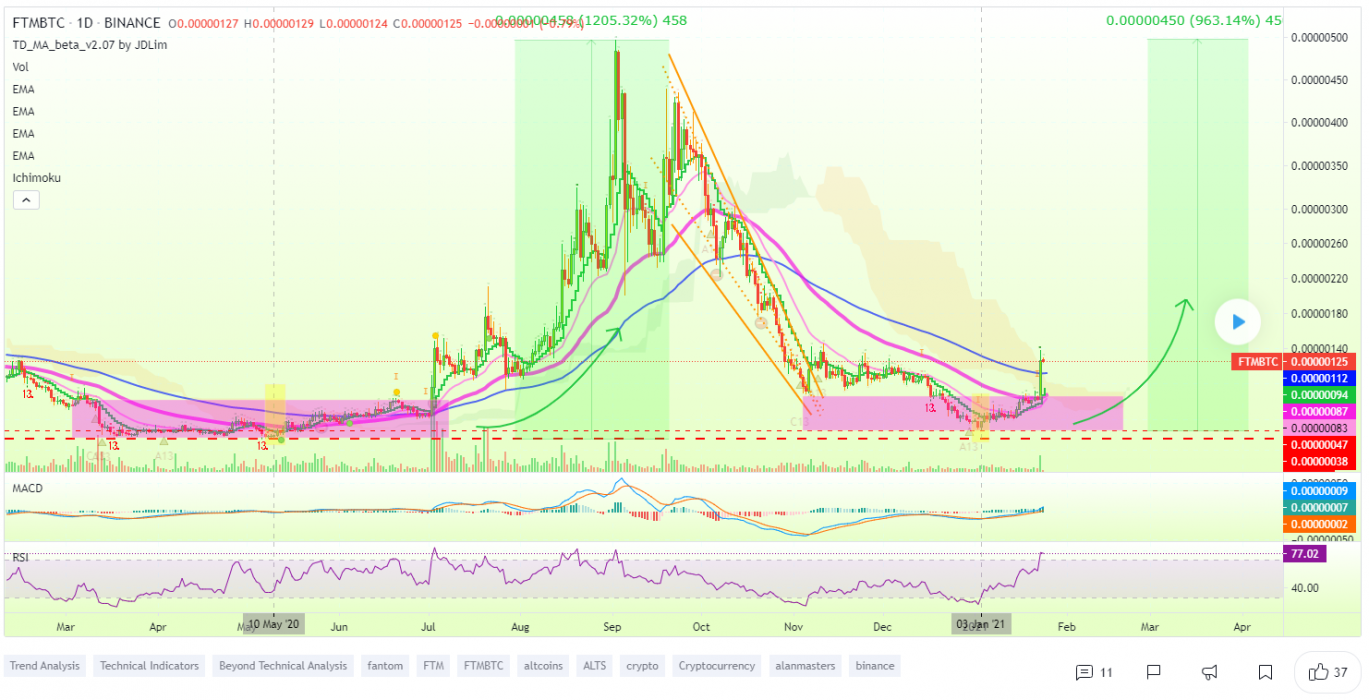
After looking at the above 1-day candle chart, we can clearly see that FTM was trading inside the falling wedge pattern on the FTM/BTC pair. The first resistance was on the $0.0684 AUD price levels which FTM broke with a strong bullish trend buying volume and is now heading towards the all-time high price in AUD. Seeing that many altcoins are waking up bullish this week, FTM is likely to continue to increase in the uptrend.

“The Falling Wedge is a bullish pattern that begins wide at the top and contracts as prices move lower. This price action forms a cone that slopes down as the reaction highs and reaction lows converge.”

Source: TradingView

What do the Technical indicators say?

The Fantom FTM TradingView indicators (on the 1 day) mainly indicate FTM as a buy, except the Oscillators which indicate FTM as a sell.

So Why did FTM Breakout?

The recent rise in Bitcoin over +300% since the halving in May and then the suggested start of the Altcoin season could have contributed to the recent breakout. Another reason for this sudden pump in price could be the whales secretly buying FTM for the next Altcoins rally & it could also be contributed to some of the recent news of Ideal Infrastructure for CDBC.

Recent FTM News & Events:

Where to Buy or Trade FTM?

Fantom has the highest liquidity on Binance Exchange so that would help for trading FTM/BTC or FTM/USDT pairs. However, if you’re just looking at buying some quick and hodling then Swyftx Exchange is a popular choice in Australia.
Categories
Crypto News Market Analysis Trading

Elrond Breakout Analysis – EGLD Pumps +34% in a Single Day with Active Uptrend

Elrond EGLD is trading in uptrend here like many other altcoins. The Cryptocurrency EGLD just went up +34% in a single day by breaking a Rising wedge pattern with strong buying volume and surges over +52% in a week.

What is Elrond?

Elrond is a blockchain protocol that seeks to offer extremely fast transaction speeds by using sharding. The project describes itself as a technology ecosystem for the new internet, which includes fintech, decentralized finance, and the Internet of Things. Its smart contracts execution platform is reportedly capable of 15,000 transactions per second, six-second latency, and a $0.001 transaction cost.

Elrond Quick Stats

SYMBOL:EGLD
Global rank:48
Market cap:$1,104,958,674 AUD
Current price:$64 AUD
All time high price:$80 AUD
1 day:+34.38%
7 day:+52.96%
1 year:+127.81%

Elrond Price Analysis

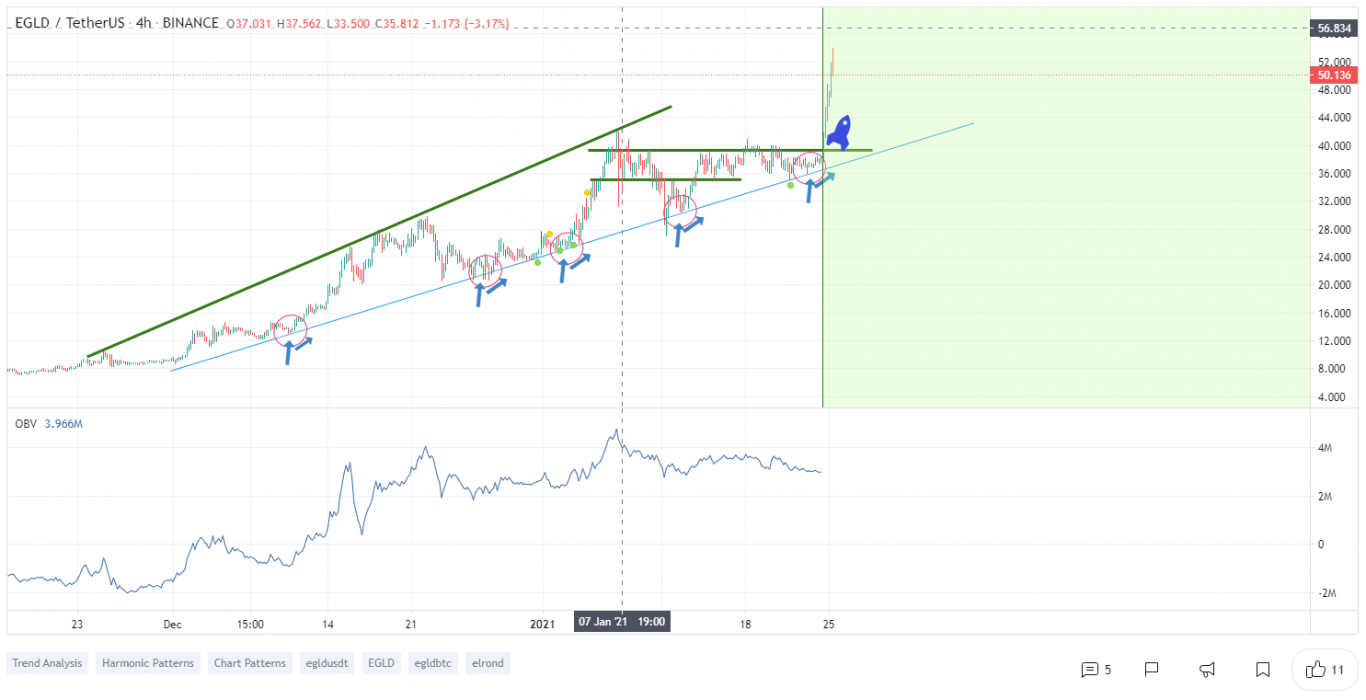
At the time of writing, EGLD is ranked 48th cryptocurrency globally and the current price is $64 AUD. This is a +52.96% increase since 19th January 2021 (7 days ago) as shown in the chart below.

Source: TradingView

After looking at the above 4-hour candle chart, we can clearly see that EGLD was trading inside the Rising wedge pattern on the EGLD/USDT pair. The first resistance was on the $45.05 AUD price levels which EGLD broke with a strong bullish trend buying volume and is now heading towards the next all-time high price. Seeing that many altcoins are waking up bullish this week, EGLD is likely to continue to increase in the uptrend.

“The Rising Wedge is a bearish pattern that begins wide at the bottom and contracts as prices move higher and the trading range narrows. In contrast to symmetrical triangles, which have no definitive slope and no bullish or bearish bias, rising wedges definitely slope up and have a bearish bias.”

Source: TradingView

What do the Technical indicators say?

The EGLD TradingView indicators (on the 1 day) mainly indicate EGLD as a buy, except the Oscillators which indicate EGLD as a neutral.

So Why did EGLD Breakout?

The recent rise in Bitcoin over +300% since the halving in May and then the suggested start of the Altcoin season could have contributed to the recent breakout. Another reason for this sudden pump in price could be the whales secretly buying EGLD for the next Altcoins rally & it could also be contributed to some of the recent news of Smart Chain Integration.

Recent EGLD News & Events:

Where to Buy or Trade EGLD?

Elrond has the highest liquidity on Binance Exchange so that would help for trading EGLD/BTC or EGLD/USDT pairs. However, if you’re just looking at buying some quick and hodling then Swyftx Exchange is a popular choice in Australia.
Categories
Crypto News Market Analysis Trading Verge

Altcoins Trading Analysis – 3 Coins that Might Breakout this Week: AVAX, EGLD, XVG

For today’s trading news, we’re looking at three Altcoins that might breakout this week by showing bullish trends in the charts.

1. Avalanche (AVAX)

Avalanche is an umbrella platform for launching decentralized finance (DeFi) applications, financial assets, trading, and other services.

It aims to be something of a global assets exchange, allowing anyone to launch or trade any form of asset and control it in a decentralized manner using smart contracts and other cutting-edge technologies.

AVAX Price Analysis

At the time of writing, AVAX is ranked 44th cryptocurrency globally and the current price is $15.09 AUD. Let’s take a look at the chart below for price analysis.

Source: TradingView

January saw a nearly +430% rise in AVAX’s price, but the bulls might have more room to run.

Last week, the price ran into resistance at $13.69 AUD before sweeping lows and dropping near the four-hour chart’s 62% retracement level near $11.70 AUD.

This move created potential support beginning near $11.32 AUD, with a lower time frame support possibly forming at $12.28 AUD to give aggressive bulls an entry.

The highs near $15 AUD and $15.69 AUD provide two first probable targets. If the support beginning near $10.89 AUD continues to hold, bulls could use this retracement’s extensions to anticipate take-profit zones near $20.81 AUD and $26.93 AUD. The extensions near $18.85 AUD, $24.97AUD, and $28.58 AUD are also likely to provide intermediate-term targets.

2. Elrond (EGLD)

Elrond is a blockchain protocol that seeks to offer extremely fast transaction speeds by using sharding. The project describes itself as a technology ecosystem for the new internet, which includes fintech, decentralized finance, and the Internet of Things. Its smart contracts execution platform is reportedly capable of 15,000 transactions per second, six-second latency, and a $0.001 transaction cost.

EGLD Price Analysis

At the time of writing, EGLD is ranked 48th cryptocurrency globally and the current price is $61.09 AUD. Let’s take a look at the chart below for price analysis.

Source: TradingView

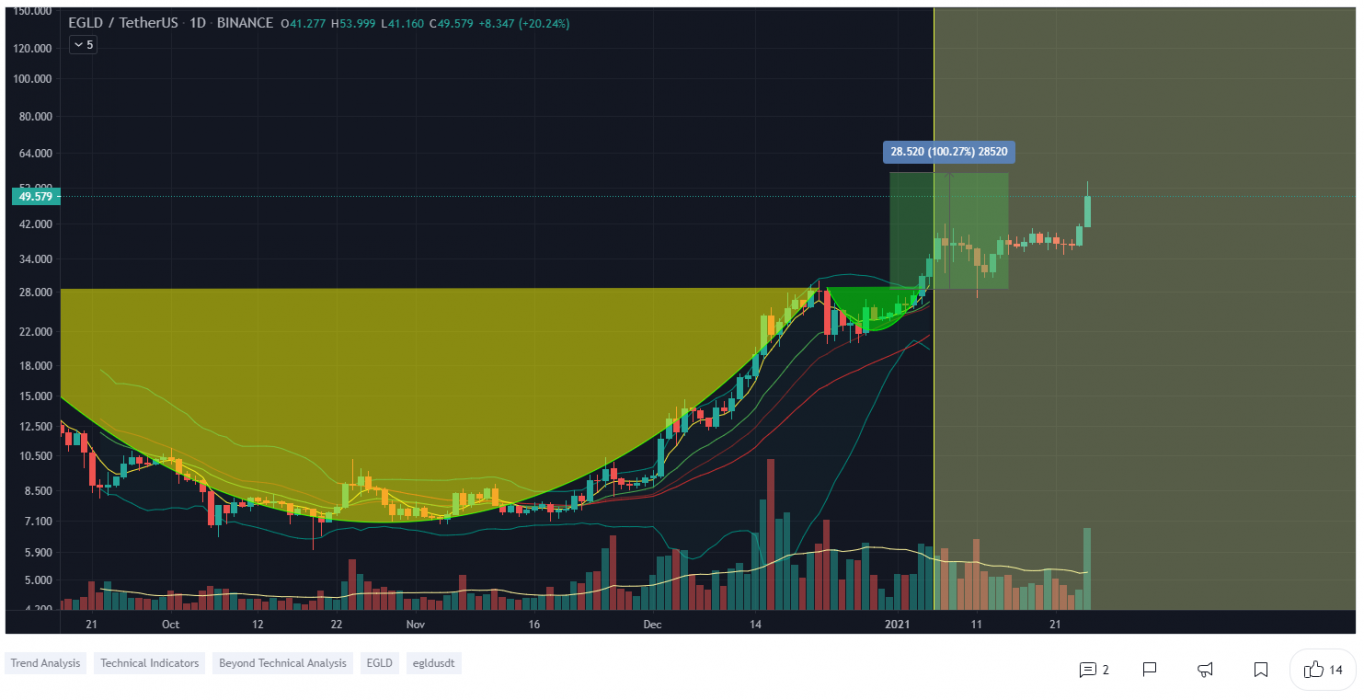
EGLD has been in a strong bull trend since the beginning of Q4 2020, giving bottom-buyers nearly +660% returns to date.

This Monday, the price broke out from the accumulation range high at $60 AUD after sweeping lows near $45.64 AUD, potentially signaling the start of the next significant move upward.

Bulls could wait for a retracement near probable support beginning at $48.90 AUD, with the daily gap’s midpoint near $39.72 AUD providing a higher risk-reward entry. The relatively equal daily lows near $35 AUD could also attract a stop run, providing an attractive entry area in the broad support region between $36.34 AUD and $31.67 AUD.

The extensions near $68.35 AUD and $74.70 AUD provide probable targets, with the minor extensions near $86.47 AUD, and $98.46 AUD providing intermediate take-profit zones.

3. Verge (XVG)

Verge is a privacy-focused cryptocurrency and blockchain that seeks to offer a fast, efficient, decentralized payments network that improves upon the original Bitcoin (BTC) blockchain. It includes additional privacy features including integrating the anonymity network Tor into its wallet, called vergePay, and providing the option of sending transactions to stealth addresses.

XVG Price Analysis

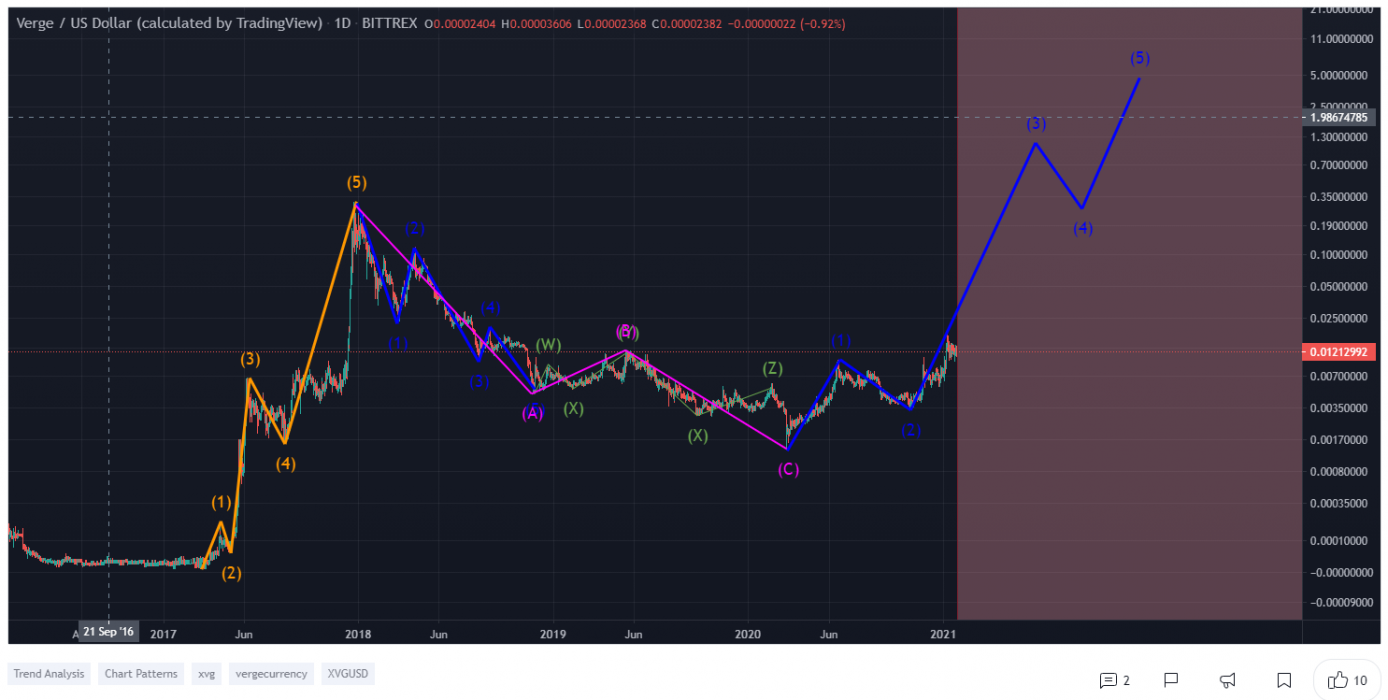
At the time of writing, XVG is ranked 96th cryptocurrency globally and the current price is $0.0154 AUD. Let’s take a look at the chart below for price analysis.

Source: TradingView

XVG’s +172% January rally has retraced to the move’s 70.5% retracement before spending the second half of the month accumulating above support beginning near $0.01 AUD.

Last week’s dip to retest the 70.5% retracement created potential support near $0.0117 AUD, with the early part of this week testing the weekly level at $0.0122 AUD as support. A quick dip in this region could give bulls an excellent entry targeting the first probable resistance at $0.0165 AUD.

A break of this level might run to the resistance and last swing high at $0.0182 AUD. If the swing high breaks, monthly highs at $0.0202 AUD and $0.0284 AUD provide the next likely targets. Beyond $0.0284 AUD, the price could see a parabolic move to the next monthly high near $0.0437 AUD.

Traders taking regular profits could use the extensions at $0.0271 AUD, $0.0371 AUD, and $0.0407 AUD for probable intermediate resistance zones.

Categories
Crypto News Market Analysis Trading

Sandbox Breakout Analysis – Parabolic Breakout on SAND with +115% Gains in a Single Day

The Sandbox SAND just pumped up to +115% in a single day with a strong breakout on Binance & other Exchanges. Let’s take a quick look at the SAND price analysis and possible reasons for the recent breakout.

What is Sandbox?

The Sandbox claims to be a virtual world where players can build, own, and monetize their gaming experiences in the Ethereum blockchain using SAND, the platform’s utility token. It is claimed that players can create digital assets (Non-Fungible Tokens, aka NFTs), upload them to the marketplace, and drag-and-drop them to create game experiences with The Sandbox Game Maker. It is further claimed that The Sandbox has secured over 50 partnerships including Atari, Crypto Kitties, and Shaun the Sheep to build a fun, creative “play-to-earn” Gaming platform, owned and made by players. The Sandbox aims to bring blockchain into mainstream gaming, attracting both crypto and non-crypto game enthusiasts by offering the advantages of true-ownership, digital scarcity, monetization capabilities, and interoperability.

SAND Quick Stats

SYMBOL:SAND
Global rank:252
Market cap:$106,223,142 AUD
Current price:$0.1364 AUD
All time high price:$0.1902 AUD
1 day:+115.84%
7 day:+163.12%
1 year:+184.27%

SAND Price Analysis

At the time of writing, SAND is ranked 252nd cryptocurrency globally and the current price is $0.1364 AUD. This is a +163.12% increase since 16th January 2021 (7 days ago) as shown in the chart below.

Source: TradingView

If we see the above 1-day candle chart, SAND did a strong parabolic breakout from the falling wedge pattern while trading sideways from the last few days around $0.0624 AUD price levels & is now heading towards its previous major resistance which is $0.1578 AUD. After BTC made a slight correction in its price this week and few Altcoins are also following this downtrend but, SAND looks well-positioned to hit the next high price levels with strong buying volume.

“The Falling Wedge is a bullish pattern that begins wide at the top and contracts as prices move lower. This price action forms a cone that slopes down as the reaction highs and reaction lows converge.”

Source: TradingView

What do the technical indicators say?

The Sandbox TradingView indicators (on the 1 day) mainly indicate SAND as a buy, except the Oscillators which indicate SAND as a sell.

So Why did SAND Breakout?

The recent rise in Bitcoin over +300% since the halving in May and then the suggested start of the Altcoin season could have contributed to the recent breakout. Another reason for this sudden pump in price could be the whales secretly buying SAND for the next Altcoins rally & it could also be contributed to some of the recent news of the 2021 Ambassador Program.

Recent SAND News & Events:

Where to Buy or Trade SAND?

The Sandbox SAND has the highest liquidity on Binance Exchange so that would help for trading SAND/USDT, SAND/BTC, or SAND/ETH pairs. However, if you’re just looking at buying some quick and hodling then Swyftx Exchange is a popular choice in Australia.