Categories
Crypto News Market Analysis NEO Trading

Altcoins Trading Analysis – 3 Coins that Might Breakout this Week: CRO, NEAR, NEO

For today’s trading news, we’re looking at three Altcoins that might breakout this week by showing bullish trends in the charts.

1. Crypto Coin (CRO)

Crypto.com Coin (CRO) is the native cryptocurrency token of Crypto.com Chain — a decentralized, open-source blockchain developed by the Crypto.com payment, trading, and financial services company. Crypto.com Chain is one of the products in Crypto.com’s lineup of solutions designed to accelerate the global adoption of cryptocurrencies as a means of increasing personal control over money, safeguarding user data, and protecting users’ identities. The CRO blockchain serves primarily as a vehicle that powers the Crypto.com Pay mobile payments app.

CRO Price Analysis

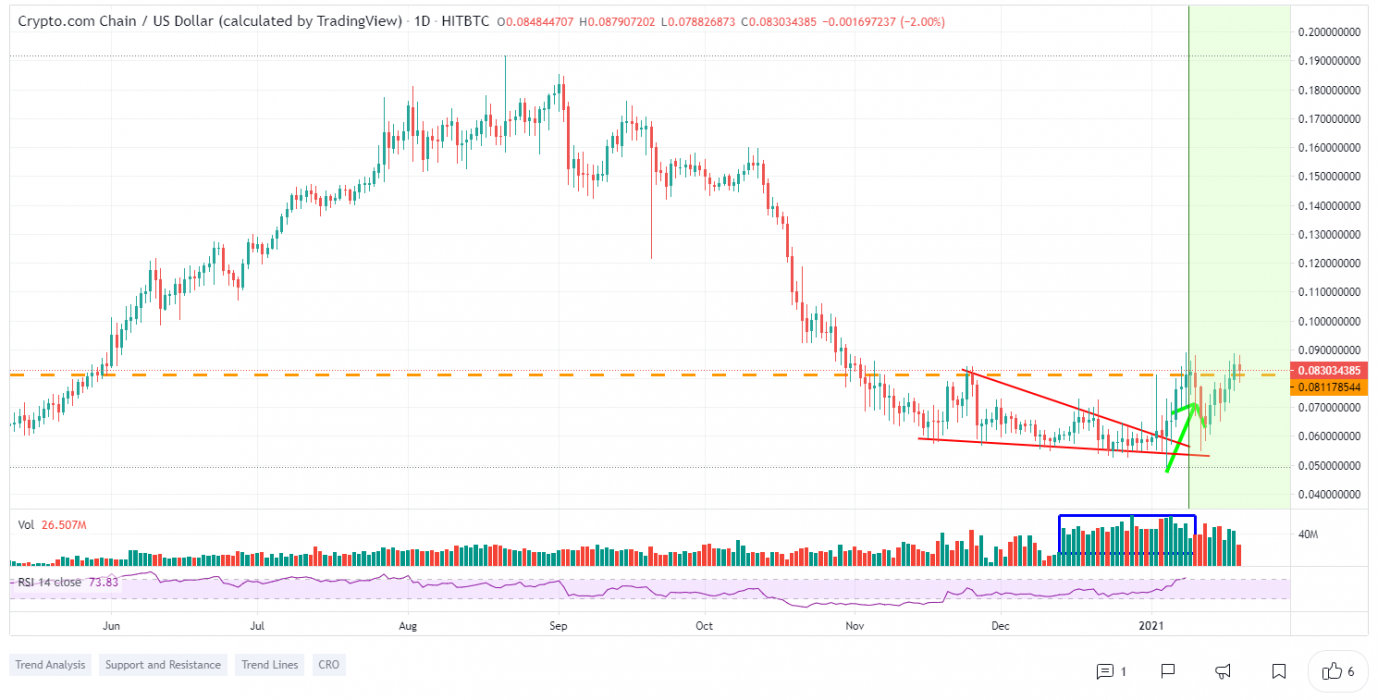
At the time of writing, CRO is ranked 24th cryptocurrency globally and the current price is $0.1214 AUD. Let’s take a look at the chart below for price analysis.
Source: TradingView

CRO’s +44% January rally could be setting up a more significant bullish move for the rest of the quarter.

Last week, the support beginning near $0.0829 AUD launched a move to the resistance starting near $0.0954. This move failed to close below the previous swing high. However, it did create probable support underneath the high near a monthly level around $0.0715 AUD.

Aggressive bulls could enter near this recently formed support. The last swing high at $0.1086 AUD gives a first reasonable target. Bulls could hold for the second target at the set of relatively equal daily highs near $0.1104 AUD, just below the previous major down moves EQ.

A daily close above the resistance from $0.0915 AUD to $0.0995 AUD could signal an extended move. Resistance at the EQ near $0.1192 AUD, a small price range near $0.1211 AUD, and probable resistance beginning at $0.1516 AUD give potential take profit or turning points before the equal highs forming the primary objective at $0.1677 AUD.

2. Near Protocol (NEAR)

NEAR Protocol is a decentralized application platform designed to make apps usable on the web. The network runs on a Proof-of-Stake (PoS) consensus mechanism called Nightshade, which aims to offer scalability and stable fees.

NEAR Price Analysis

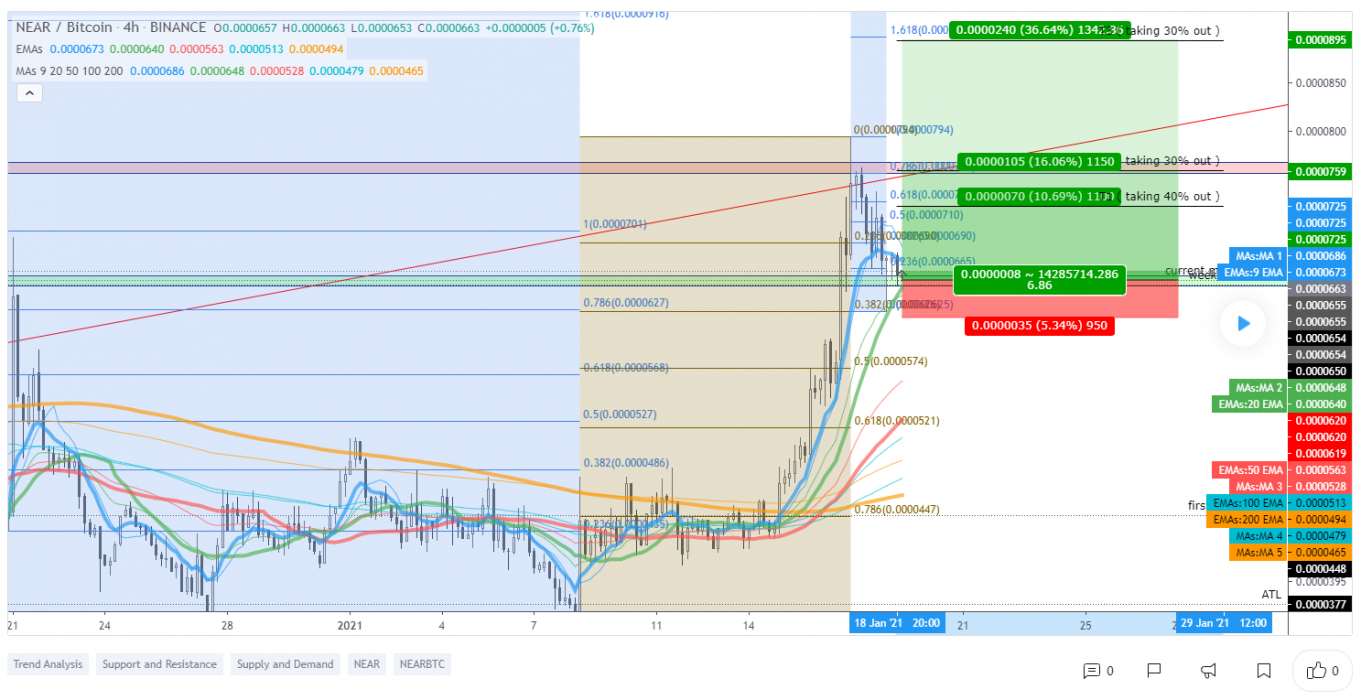
At the time of writing, NEAR is ranked 64th cryptocurrency globally and the current price is $2.97 AUD. Let’s take a look at the chart below for price analysis.
Source: TradingView

NEAR tore upward into price discovery last week before pausing at resistance near the main move’s 0.68 extension.

The price range beginning at $2.17 AUD provides the first potential support for an early-week dip. Just below this range, the previous swing high and accumulation near $1.94 AUD could provide more substantial support.

A significant market drop could reach as low as the consolidation range beginning at $1.59 AUD, supported by the January monthly open.

It’s impossible to predict where the price in discovery will go, but the last high at $2.89 AUD provides the first probable target. Extensions from the primary move hint at $3.15, AUD, and $3.85 AUD as probable take-profit zones.

3. Neo (NEO)

Neo bills itself as a “rapidly growing and developing” ecosystem that has the goal of becoming the foundation for the next generation of the internet — a new economy where digitized payments, identities, and assets come together. Initially known as Antshares, this project was believed to be China’s first-ever public blockchain when it was launched in February 2014. The open-source platform subsequently rebranded to Neo three years later.

NEO Price Analysis

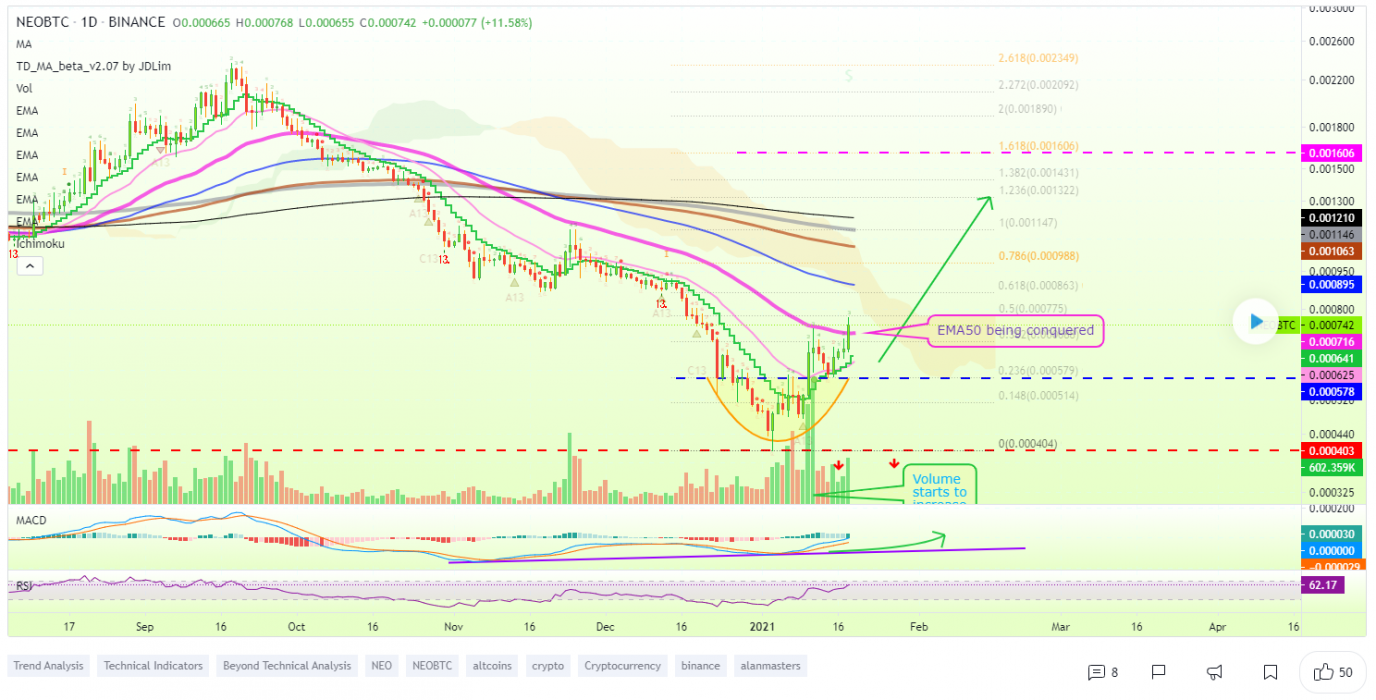
At the time of writing, NEO is ranked 23rd cryptocurrency globally and the current price is $35.82 AUD. Let’s take a look at the chart below for price analysis.
Source: TradingView

January saw a +91% spike in price into the resistance beginning near $28.14 AUD. This move swept September’s swing high, which might set the stage for retracement and reaccumulation.

The previous high and brief reaccumulation near $25.29 AUD has so far provided support, making it a reasonable place for bulls to begin building positions.

A deeper drop to run stops and test the daily gap beginning at $22.52 AUD is likely to meet support. This area has confluence with a monthly level and a consolidation zone.

Bulls could target the most recent swing high near $34.71 AUD. A break of this resistance zone is likely to reach near the old monthly high at $45 AUD.

Resistance near $36.15 AUD could cause the price to pause. However, a break of this level is likely to proceed to resistance under the next monthly high, near $55.24 AUD.

Where to Buy or Trade Altcoins?

These 3 Altcoins have the highest liquidity on Binance Exchange so that would help for trading on USDT or BTC pairs. However, if you’re just looking at buying some quick and hodling then Swyftx Exchange is a popular choice in Australia.

Categories
Crypto News Market Analysis Trading VeChain

VeThor Token Breakout Analysis – VTHO Gains +73% in a Week with Strong Uptrend

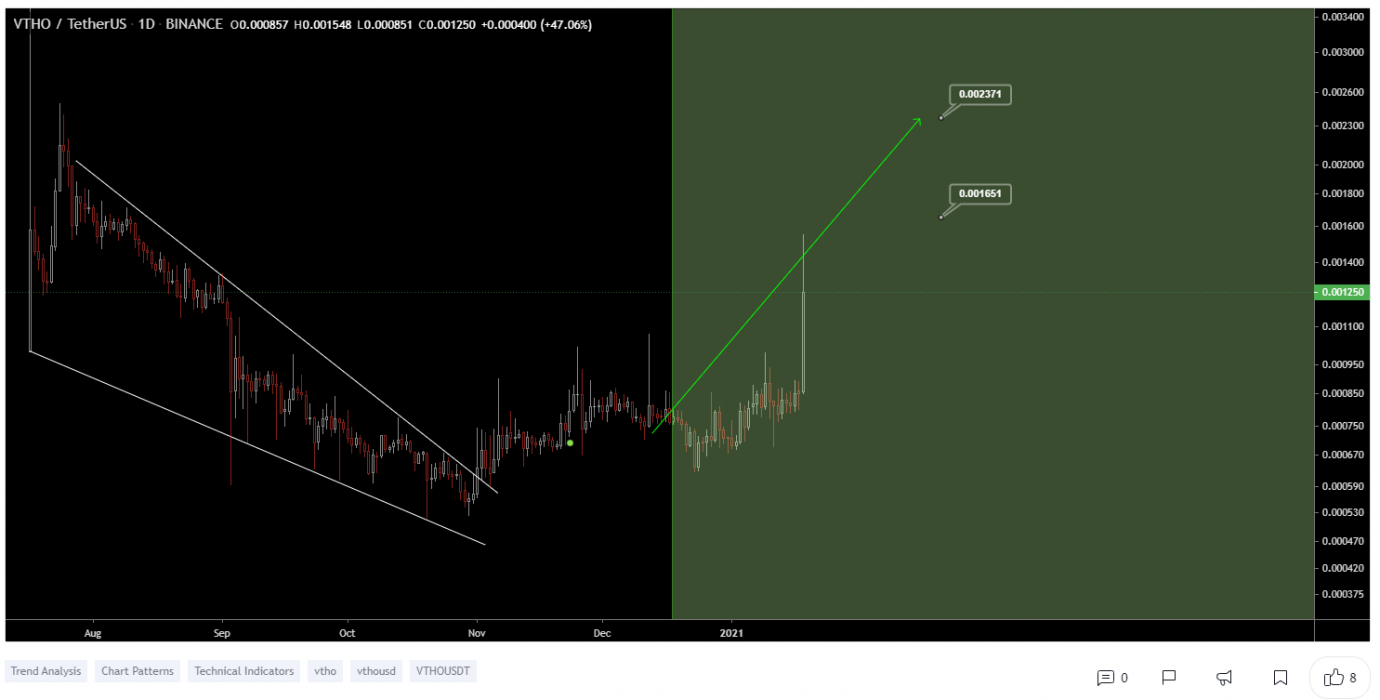
VeThor Token VTHO is flipping on a 1-day candle chart, The Cryptocurrency VTHO has grown by a massive +73% in the past week. Let’s take a quick look at VTHO price analysis and possible reasons for the recent breakout.

What is VeThor Token?

VeThor Token is represented as the energy cost for carrying payment transactions and smart contract transactions on the VeChainThor blockchain. VTHO is so generated as a form of gas from VeChain Tokens, over time.

VeThor Token Quick Stats

SYMBOL:VTHO
Global rank:309
Market cap:$49,812,847 AUD
Current price:$0.0015 AUD
All time high price:$0.0546 AUD
1 day:+41.4%
7 day:+73.55%
1 year:+116.47%

VTHO Price Analysis

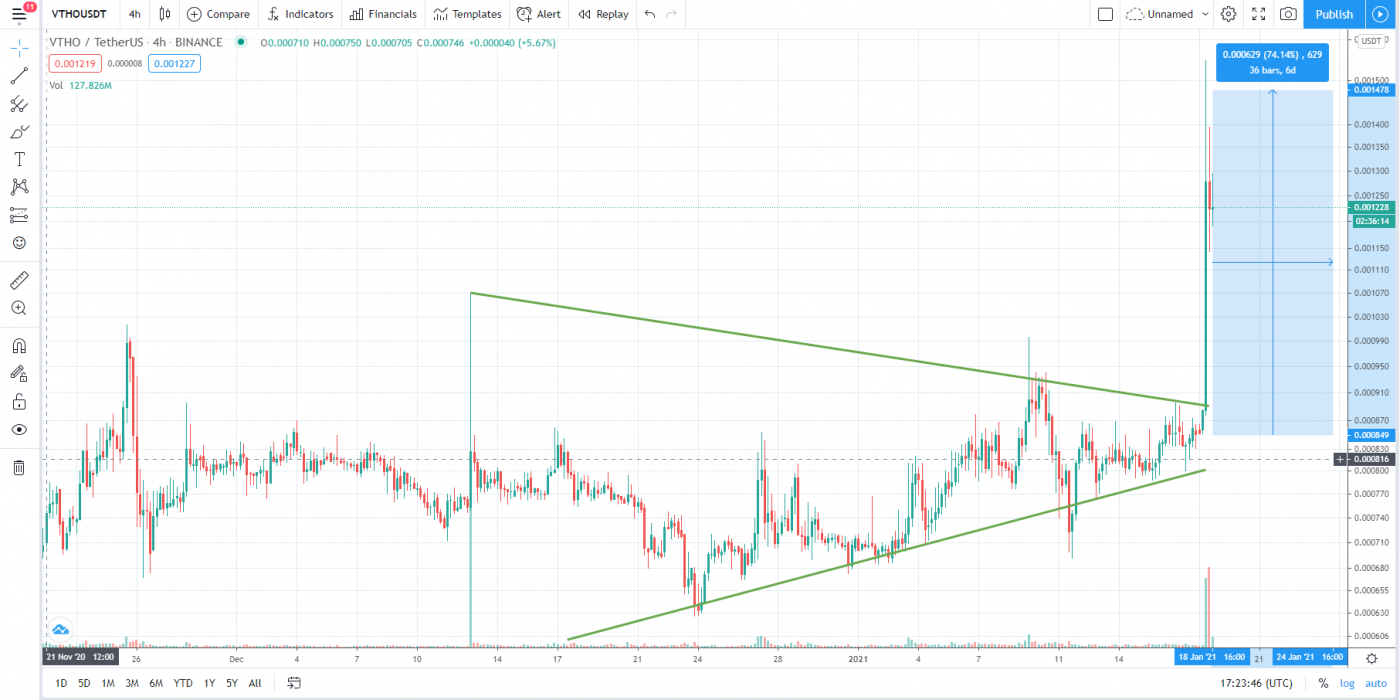
At the time of writing, VTHO is ranked 309th cryptocurrency globally and the current price is $0.0015 AUD. This is a +73.55% increase since 12th January 2021 (7 days ago) as shown in the chart below.

Source: TradingView

In the past month, there was a strong rise in Bitcoin, Ethereum, and other Altcoins. As a result, VeThor VTHO also formed strong support near $0.0012 AUD price levels before starting a fresh increase against the BTC pair. The red uptrend line started on 20th November. Is being obliterated this week, colossal strength and volume which both signals the further rise in the uptrend. Additional growth can follow for this Altcoin on different trading pairs.

Here we also have the “W” pattern with a higher low just as looking at it before starting a strong increase, there was a break above a crucial contracting triangle with resistance near $0.0011 AUD on the weekly chart of the VTHO/USDT. The pair gained pace above the $0.0013 AUD and $0.0014 AUD resistance levels.

“W pattern is a price pattern, also called Double Bottom. This pattern, when drawn it looks like the W and this is why it is called as W pattern. Sometimes patterns look like W but it is not the exact W pattern and these patterns are called Semi-W patterns.”

Source: TradingView

What do the technical indicators say?

The VTHO TradingView indicators (on the 1 day) mainly indicate VTHO as a buy, except the Oscillators which indicate VTHO as a neutral.

So Why did VTHO Breakout?

The recent rise in Bitcoin over +300% since the halving in May and then the suggested start of the Altcoin season could have contributed to the recent breakout. Another reason for this sudden pump in price could be the whales secretly buying VTHO for the next Altcoins rally & it could also be contributed to some of the recent news of Daas Fee-Delegation.

Recent VeThor News & Events:

Where to Buy or Trade VTHO?

VeThor Token has the highest liquidity on Binance Exchange so that would help for trading VTHO/USDT or VTHO/BNB pairs. However, if you’re just looking at buying some quick and hodling then Swyftx Exchange is a popular choice in Australia.

Categories
Crypto News IOST Market Analysis Trading

IOST Breakout Analysis – Parabolic Breakout on IOST with +106% Gains in a Week

IOST is trading in uptrend here like many other altcoins. The Cryptocurrency IOST just went up +47% in a single day by breaking a Falling wedge pattern with strong buying volume and surges over +106% in a week.

What is IOST?

IOST describes itself as an “ultra-fast,” fully-fledged and decentralized blockchain network and ecosystem with its own nodes, wallets and based on the “next-generation” consensus protocol dubbed “proof-of-believability.” IOST’s blockchain infrastructure is open-source and designed to be secure and scalable — all in the hope that it will serve as the backbone for online services in the future.

IOST Quick Stats

SYMBOL:IOST
Global rank:67
Market cap:$498,737,502 AUD
Current price:$0.0305 AUD
All time high price:$0.1772 AUD
1 day:+47.35%
7 day:+106.94%
1 year:+295.7%

IOST Price Analysis

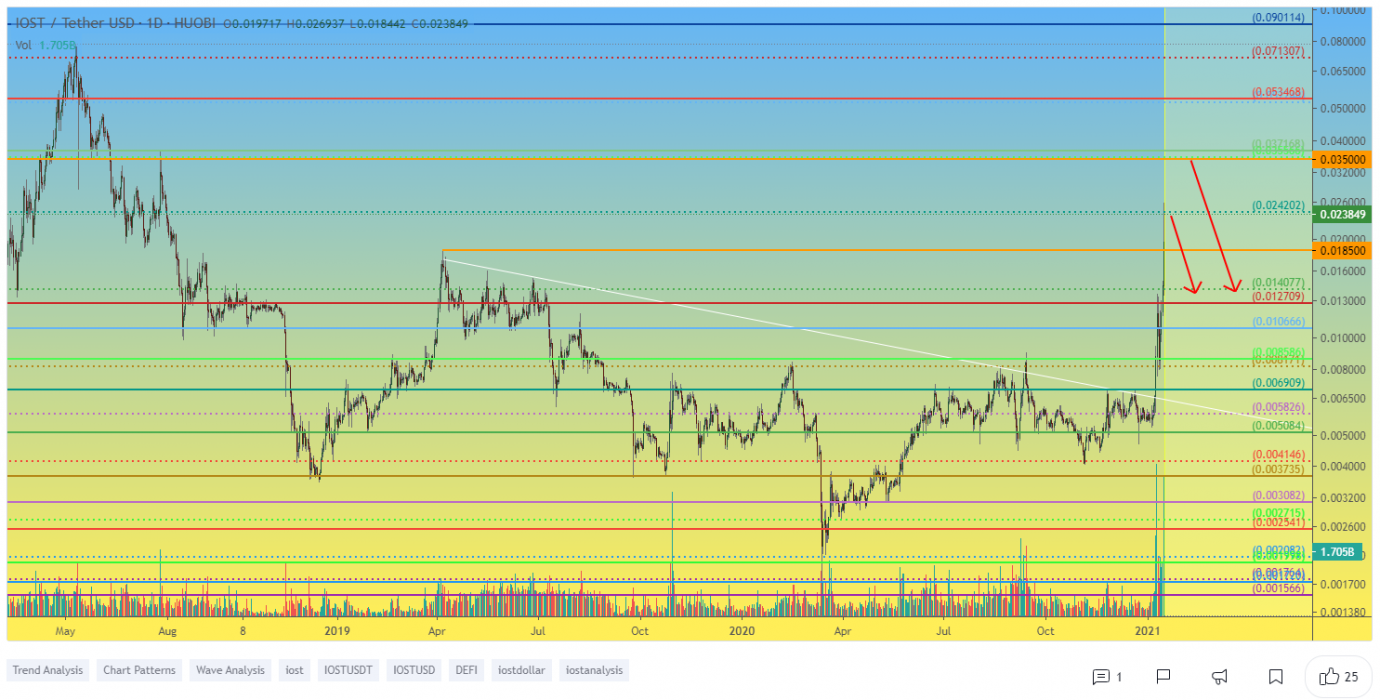
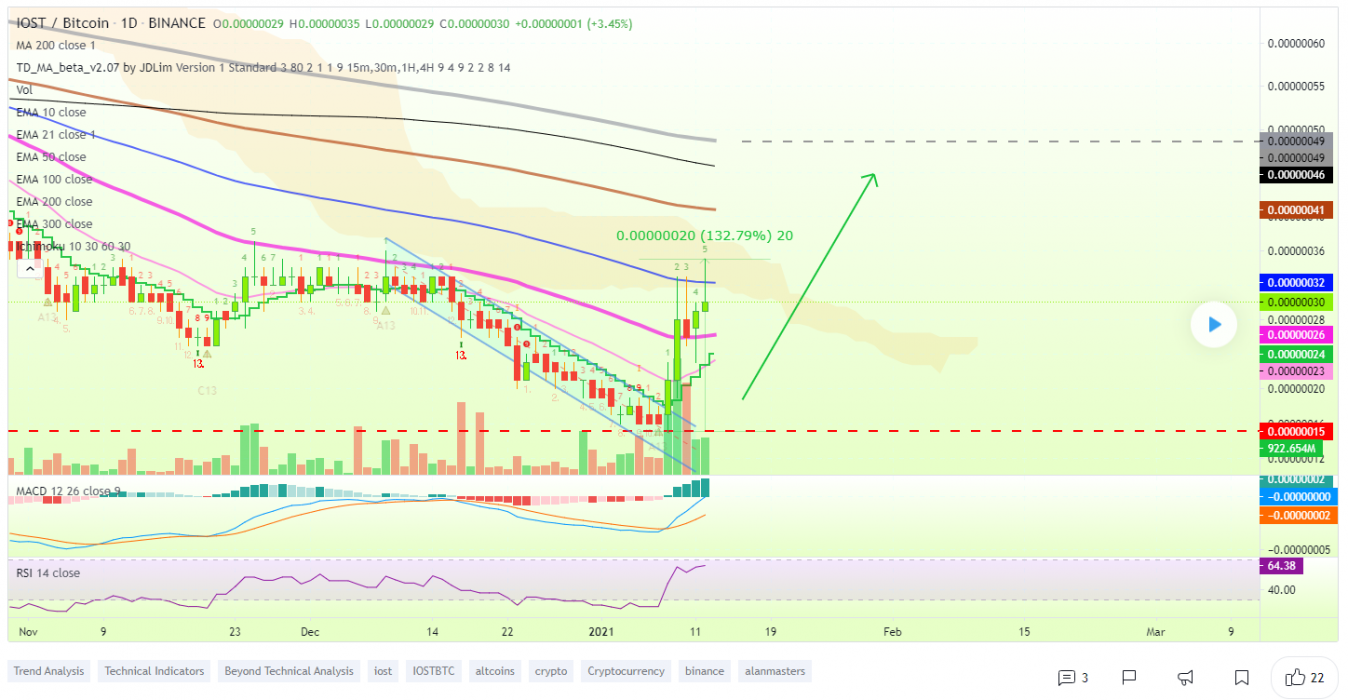
At the time of writing, IOST is ranked 67th cryptocurrency globally and the current price is $0.0305 AUD. This is a +106.94% increase since 10th January 2021 (7 days ago) as shown in the chart below.

Source: TradingView

If we see the above 1-day candle chart, IOST did a strong breakout from the falling wedge pattern while trading sideways from the last few days around $0.02471 AUD price levels & is now heading towards its major resistance of the month. After BTC made a new all-time high in its price recently and Altcoins are also rising in a bullish trend, IOST looks well-positioned to hit the next high price levels.

“The Falling Wedge is a bullish pattern that begins wide at the top and contracts as prices move lower. This price action forms a cone that slopes down as the reaction highs and reaction lows converge.”

Source: TradingView

What do the technical indicators say?

The IOST TradingView indicators (on the 1 day) mainly indicate IOST as a strong buy, except the Oscillators which indicate IOST as a buy.

So Why did IOST Breakout?

The recent rise in Bitcoin over +300% since the halving in May and then the suggested start of the Altcoin season could have contributed to the recent breakout. Another reason for this sudden pump in price could be the whales secretly buying IOST for the next Altcoins rally & it could also be contributed to some of the recent news of IOST Staking Rewards.

Recent IOST News & Events:

Where to Buy or Trade IOST?

IOST has the highest liquidity on Binance Exchange so that would help for trading IOST/BTC or IOST/USDT pairs. However, if you’re just looking at buying some quick and hodling then Swyftx Exchange is a popular choice in Australia.

Categories
Crypto News Market Analysis Trading

Cocos BCX Breakout Analysis – BCX Pumps +36% in a Single Day on Binance

Cocos BCX just pumped up to +36% in a single day and surges over +56% in a week with a strong breakout on Binance & other Exchanges. Let’s take a quick look at the BCX price analysis and possible reasons for the recent breakout.

What is Cocos BCX?

Cocos-BCX is a public blockchain platform aiming to create a complete run-time environment for games with multi-game system compatibility, providing game developers a user-friendly platform for blockchain game development.

Cocos Quick Stats

SYMBOL:Cocos-BCX
Global rank:471
Market cap:$21,267,454 AUD
Current price:$0.0005 AUD
All time high price:$0.0031 AUD
1 day:+36.41%
7 day:+56.79%
1 year:+135.07%

Cocos-BCX Price Analysis

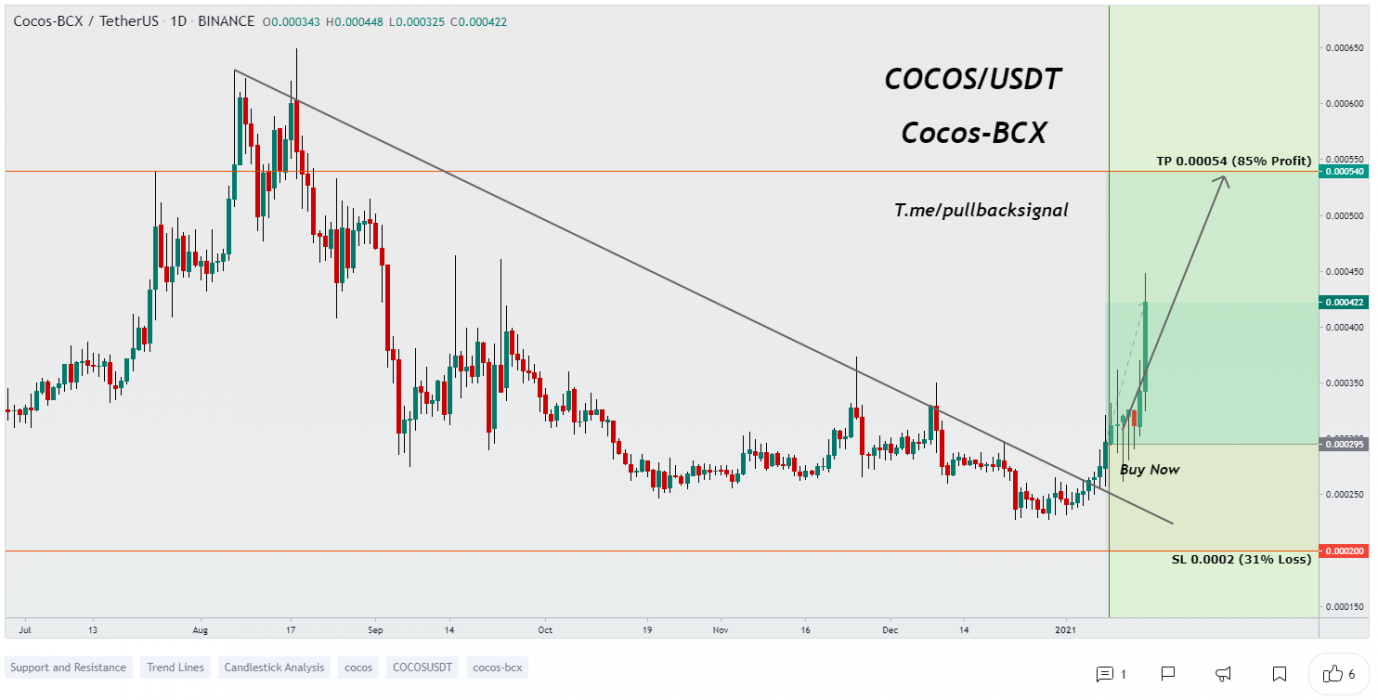
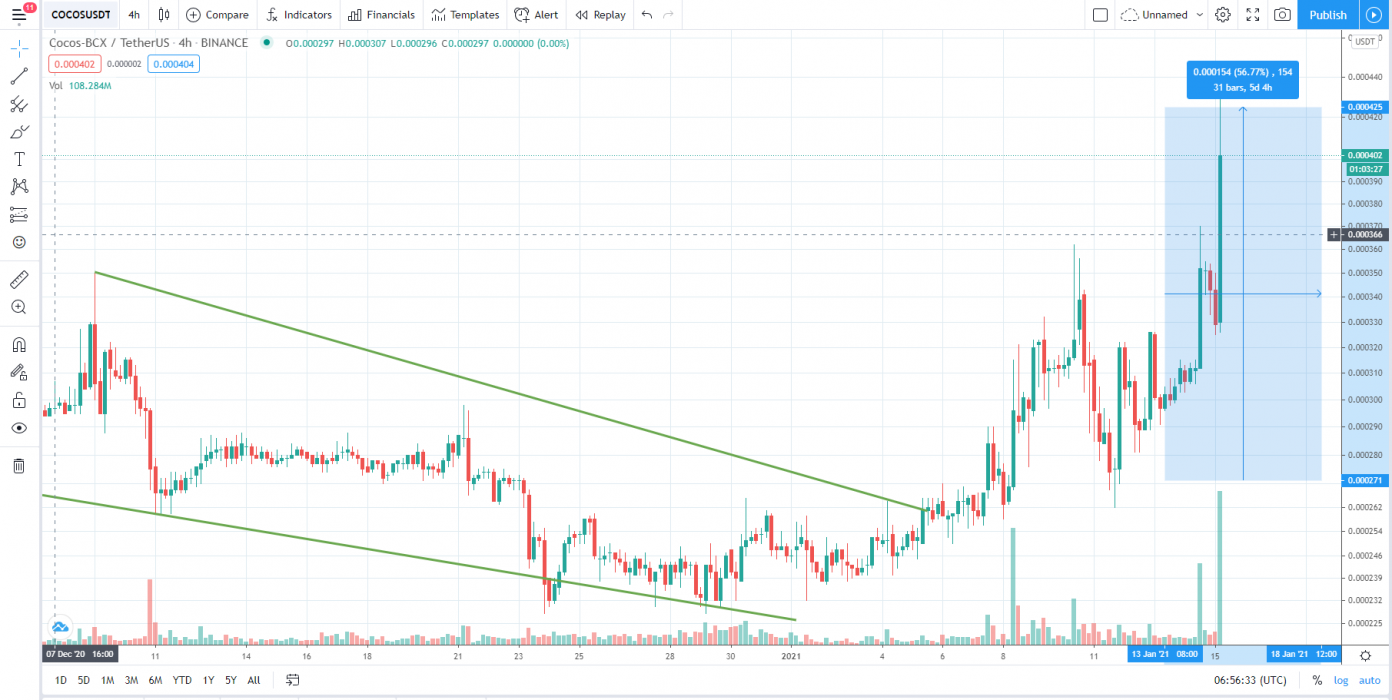
At the time of writing, Cocos-BCX is ranked 471st cryptocurrency globally and the current price is $0.0005 AUD. This is a +56.79% increase since 9th January 2021 (7 days ago) as shown in the chart below.

Source: TradingView

If we see the above 1-day candle chart, Cocos-BCX did a strong parabolic breakout from the falling wedge pattern while trading sideways from the last few days around $0.00029 AUD price levels & is now heading towards its major resistance which is $0.0012 AUD. After BTC made a new all-time high in its price and Altcoins are also rising in a bullish trend, Cocos-BCX looks well-positioned to hit the next high price levels.

“The Falling Wedge is a bullish pattern that begins wide at the top and contracts as prices move lower. This price action forms a cone that slopes down as the reaction highs and reaction lows converge.”

Source: TradingView

What do the technical indicators say?

The Cocos-BCX TradingView indicators (on the 1 day) mainly indicate Cocos-BCX as a buy, except the Oscillators which indicate Cocos-BCX as a neutral.

So Why did Cocos-BCX Breakout?

The recent rise in Bitcoin over +300% since the halving in May and then the suggested start of the Altcoin season could have contributed to the recent breakout. Another reason for this sudden pump in price could be the whales secretly buying Cocos-BCX for the next Altcoins rally & it could also be contributed to some of the recent news of the Cocos Reduction Plan.

Recent Cocos News & Events:

Where to Buy or Trade Cocos-BCX?

Cocos-BCX has the highest liquidity on Binance Exchange so that would help for trading Cocos/USDT or Cocos/ETH pairs. However, if you’re just looking at buying some quick and hodling then Swyftx Exchange is a popular choice in Australia.
Categories
Crypto News Market Analysis Trading

Polkadot Breakout Analysis – DOT Pumps +30% in a Single Day with Active Uptrend

Polkadot DOT is trading in uptrend here like many other altcoins. The Cryptocurrency DOT just went up +30% in a single day by breaking a Falling wedge pattern with strong buying volume and surges over +52% in a week.

What is Polkadot?

Polkadot is an open-source sharding multichain protocol that facilitates the cross-chain transfer of any data or asset types, not just tokens, thereby making a wide range of blockchains interoperable with each other.

The Polkadot protocol connects public and private chains, permissionless networks, oracles, and future technologies, allowing these independent blockchains to trustlessly share information and transactions through the Polkadot relay chain.

DOT Quick Stats

SYMBOL:DOT
Global rank:5
Market cap:$14,510,797,086 AUD
Current price:$16.08 AUD
All time high price:$18.48 AUD
1 day:+30.38%
7 day:+42.96%
1 year:+137.81%

DOT Price Analysis

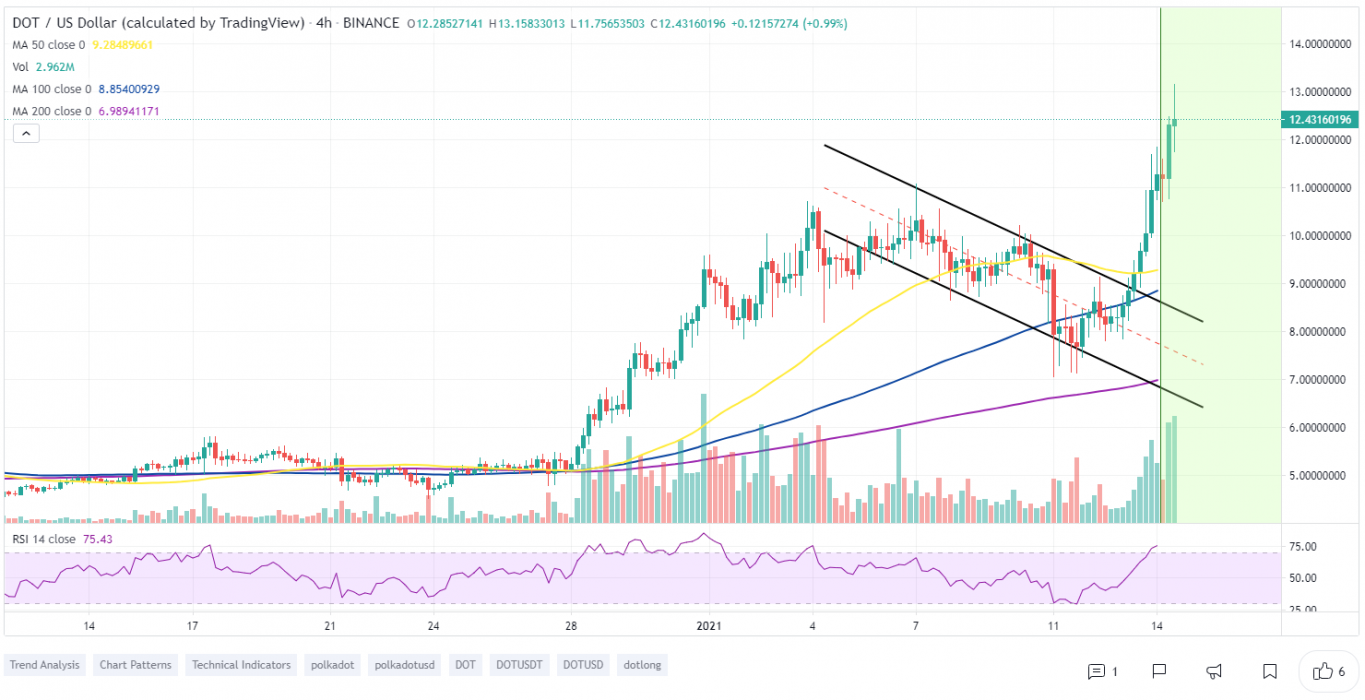
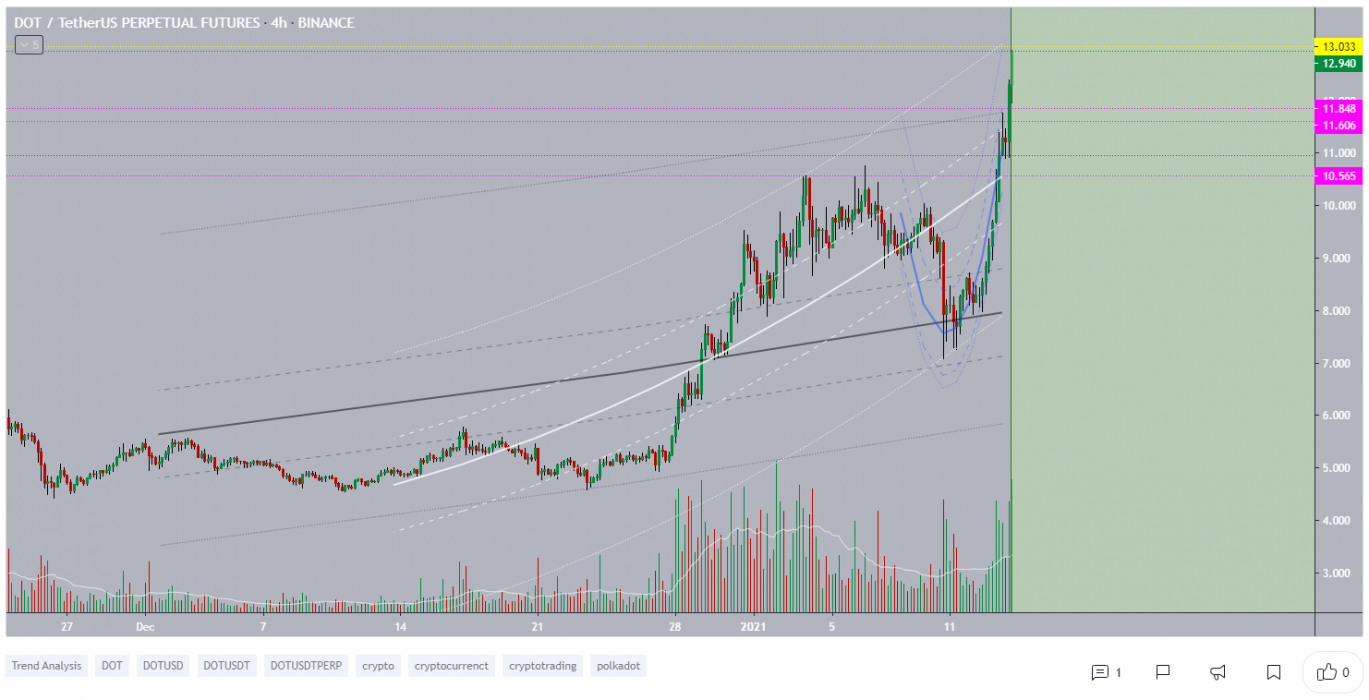
At the time of writing, DOT is ranked 5th cryptocurrency globally and the current price is $16.08 AUD. This is a +42.96% increase since 8th January 2021 (7 days ago) as shown in the chart below.

Source: TradingView

After looking at the above 4-hour candle chart, we can clearly see that DOT was trading inside the falling wedge pattern on the DOT/USDT pair. The first resistance was on the $13.05 AUD price levels which DOT broke with a strong bullish trend buying volume and is now heading towards the next all-time high price. Seeing that many altcoins are waking up bullish this week, DOT is likely to continue to increase in the uptrend.

“The Falling Wedge is a bullish pattern that begins wide at the top and contracts as prices move lower. This price action forms a cone that slopes down as the reaction highs and reaction lows converge.”

Source: TradingView

What do the Technical indicators say?

The DOT TradingView indicators (on the 1 day) mainly indicate DOT as a buy, except the Oscillators which indicate DOT as a neutral.

So Why did DOT Breakout?

The recent rise in Bitcoin over +300% since the halving in May and then the suggested start of the Altcoin season could have contributed to the recent breakout. Another reason for this sudden pump in price could be the whales secretly buying DOT for the next Altcoins rally & it could also be contributed to some of the recent news of Integration Announcement.

Recent DOT News & Events:

Where to Buy or Trade DOT?

Polkadot has the highest liquidity on Binance Exchange so that would help for trading DOT/BTC or DOT/USDT pairs. However, if you’re just looking at buying some quick and hodling then Swyftx Exchange is a popular choice in Australia.
Categories
Crypto News Initial Coin Offering Market Analysis Trading

Frontier Breakout Analysis – FRONT Pumps +49% in a Single Day with Active Uptrend

Frontier FRONT is trading in uptrend here like many other altcoins. The Cryptocurrency FRONT just went up +49% in a single day by breaking a Falling wedge pattern with strong buying volume and surges over +60% in a week.

What is Frontier?

Frontier is a Chain Agnostic DeFi Aggregation layer. Using Frontier, Users can Track and Manage DeFi positions, Stake Assets, Swap or Exchange Assets and explore more DeFi Applications in one single place. Frontier is also building Frontier chain, which is a Decentralised Key Management blockchain based on Cosmos SDK.

Frontier Quick Stats

SYMBOL:FRONT
Global rank:563
Market cap:$13,882,001 AUD
Current price:$0.5937 AUD
All time high price:$1.11 AUD
1 day:+49.38%
7 day:+60.96%
1 year:+105.73%

FRONT Price Analysis

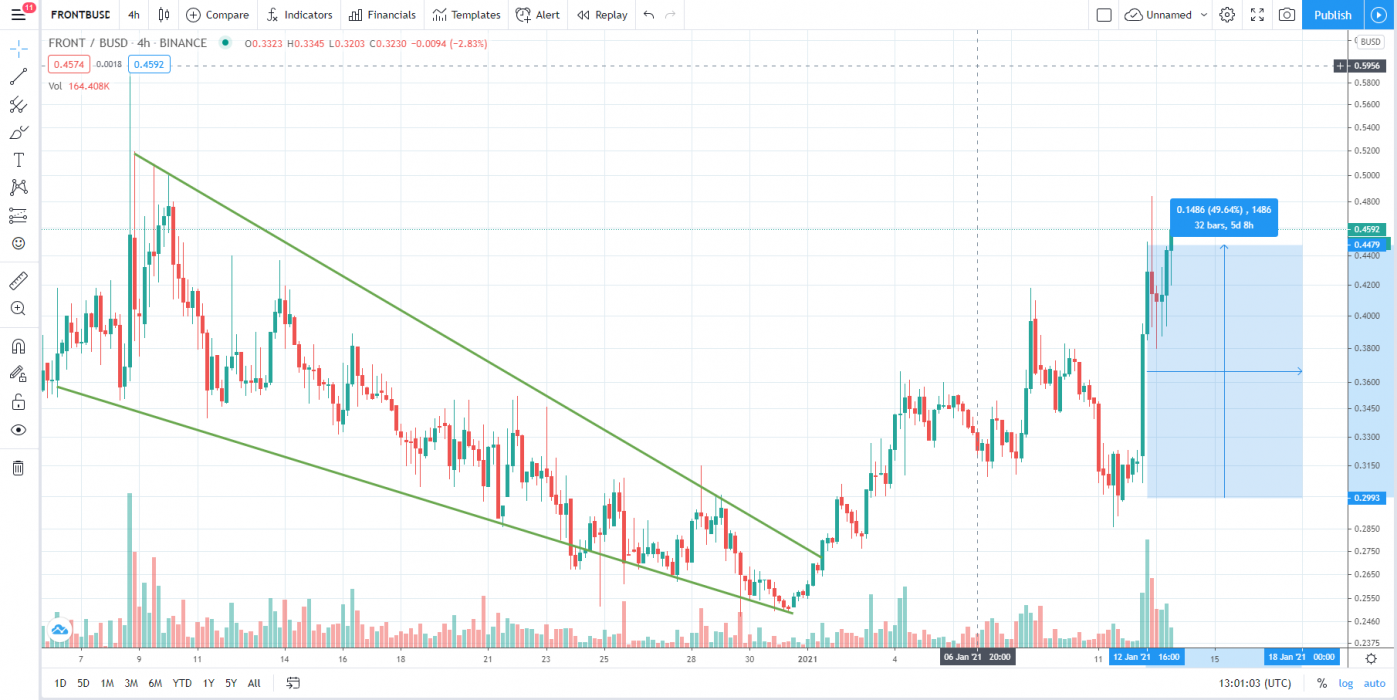
At the time of writing, FRONT is ranked 563rd cryptocurrency globally and the current price is $0.5937 AUD. This is a +60.96% increase since 7th January 2021 (7 days ago) as shown in the chart below.

Source: TradingView

After looking at the above 4-hour candle chart, we can clearly see that FRONT was trading inside the falling wedge pattern on the FRONT/BUSD pair. The first resistance was on the $0.3874 AUD price levels which FRONT broke with a strong bullish trend buying volume and is now heading towards the next monthly high prices. Seeing that many altcoins are waking up bullish this week, FRONT is likely to continue to increase in the uptrend.

“The Falling Wedge is a bullish pattern that begins wide at the top and contracts as prices move lower. This price action forms a cone that slopes down as the reaction highs and reaction lows converge.”

What do the Technical indicators say?

The FRONT TradingView indicators (on the 1 day) mainly indicate FRONT as a strong buy, except the Oscillators which indicate FRONT as a buy.

So Why did FRONT Breakout?

The recent rise in Bitcoin over +300% since the halving in May and then the suggested start of the Altcoin season could have contributed to the recent breakout. Another reason for this sudden pump in price could be the whales secretly buying FRONT for the next Altcoins rally & it could also be contributed to some of the recent news of Frontier Prize Pool.

Recent FRONT News & Events:

Where to Buy or Trade FRONT?

The Frontier FRONT has the highest liquidity on Binance Exchange so that would help for trading FRONT/ETH or FRONT/BUSD pairs. However, you can also buy FRONT from different exchanges listed on Coinmarketcap.

Categories
Crypto News Market Analysis NEM Trading Verge

Altcoins Trading Analysis – 3 Coins that Might Breakout this Week: ATOM, XEM, XVG

For today’s trading news, we’re looking at three Altcoins that might breakout this week by showing bullish trends in the charts.

1. Cosmos (ATOM)

In a nutshell, Cosmos bills itself as a project that solves some of the “hardest problems” facing the blockchain industry. It aims to offer an antidote to “slow, expensive, unscalable and environmentally harmful” proof-of-work protocols, like those used by Bitcoin, by offering an ecosystem of connected blockchains.

ATOM Price Analysis

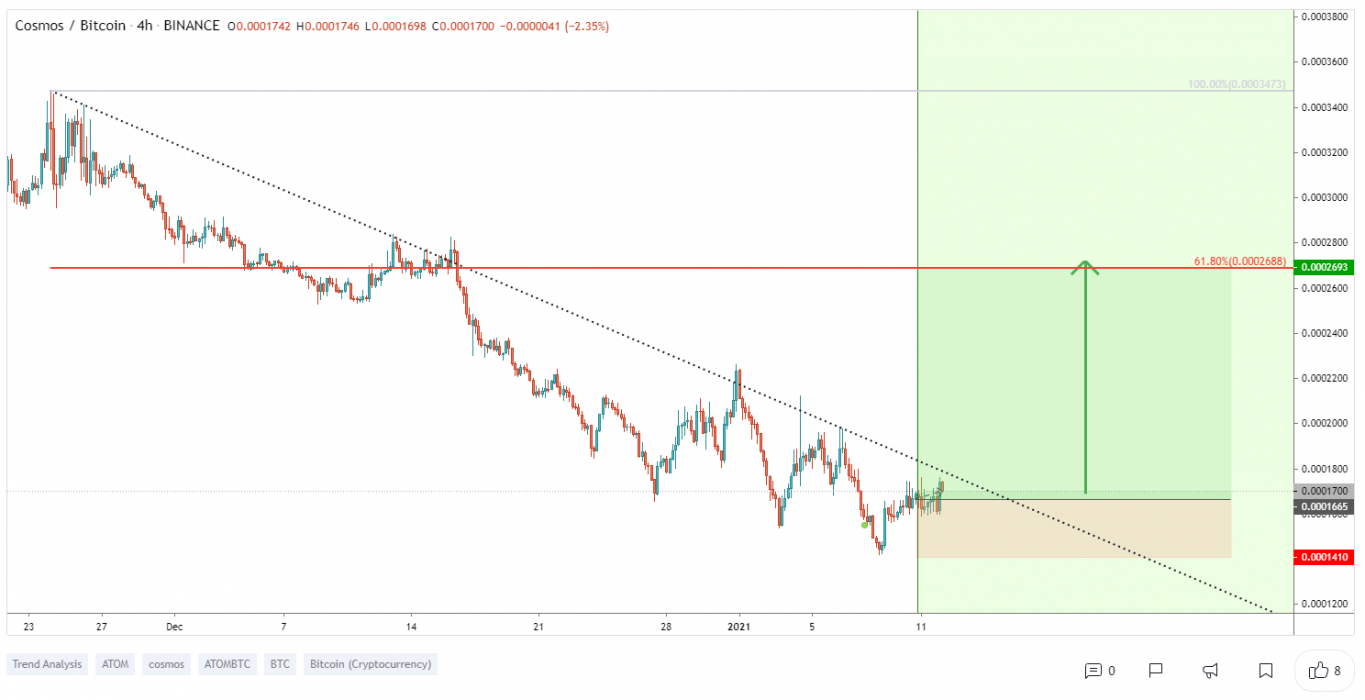
At the time of writing, ATOM is ranked 30th cryptocurrency globally and the current price is $7.80 AUD. Let’s take a look at the chart below for price analysis.

Source: TradingView

During January, ATOM has consolidated under the January monthly open inside an approximately 35% range. This consolidation could point to accumulation.

Bulls immediately bought up dips to support at a weekly level near $5.52 AUD and the monthly level near $5.37 AUD, showing substantial buyer interest.

A cluster of relatively equal daily lows around $5.18 AUD provides an attractive target for a stop run, creating a potentially excellent entry for bulls. More aggressive bulls could enter on dips to the closer support beginning at $5.48 AUD.

If Bitcoin tumbles, a more pronounced dip could reach as low as the equal lows near $4.20 AUD, running stops into support beginning at $4.20 AUD. This move would give a good risk/reward entry for bulls targeting the high below resistance starting at $7.23 AUD, the relatively equal highs near $7.92 AUD, and the August high near $9.87 AUD.

2. Nem (XEM)

NEM (New Economy Movement) is an ecosystem of platforms that use blockchain and cryptography to provide solutions for businesses and individuals. XEM is the native cryptocurrency of NEM’s NIS1 public blockchain.

XEM Price Analysis

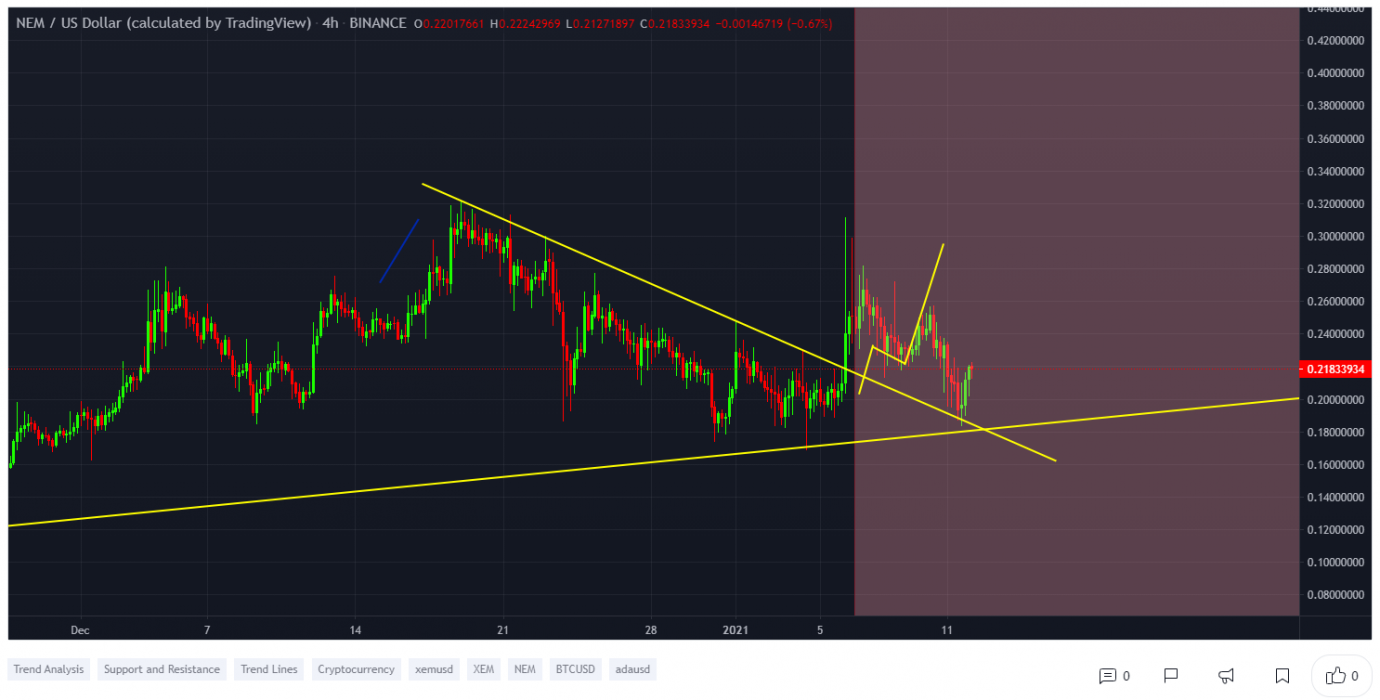
At the time of writing, XEM is ranked 18th cryptocurrency globally and the current price is $0.2839 AUD. Let’s take a look at the chart below for price analysis.

Source: TradingView

After accumulating under the January monthly open, XEM rallied +87% in a single day before retracing to support near $0.2276 AUD.

Buyers continue to snatch up dips under the monthly open, suggesting that accumulation is still taking place.

Bulls could look for entries in this region while being conscious of a potential stop run below the cluster of lows at $0.1667 AUD. Two areas of support, beginning near $0.1492 AUD and $0.1434 AUD, provide probable buys if the price dips this low.

The equal highs near $0.3142 AUD provide a first reasonable bullish target. If the price takes this target and penetrates the surrounding resistance, the next probable resistance begins near $0.4348 AUD. Possible targets include the old highs just above this resistance near $0.4544 AUD, $0.47 AUD, and $0.5318 AUD price levels.

3. Verge (XVG)

Verge is a privacy-focused cryptocurrency and blockchain that seeks to offer a fast, efficient, decentralized payments network that improves upon the original Bitcoin (BTC) blockchain. It includes additional privacy features including integrating the anonymity network Tor into its wallet, called vergePay, and providing the option of sending transactions to stealth addresses.

XVG Price Analysis

At the time of writing, XVG is ranked 85th cryptocurrency globally and the current price is $0.0161 AUD. Let’s take a look at the chart below for price analysis.

Source: TradingView

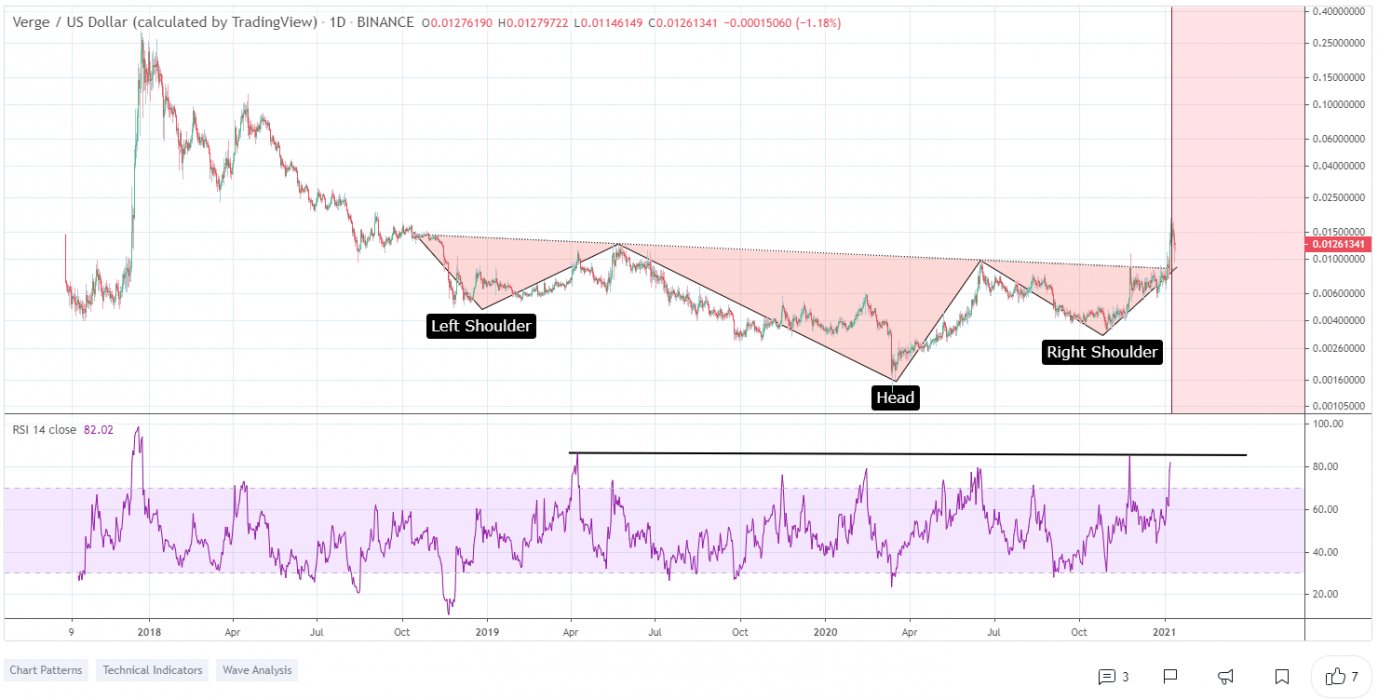
XVG wasted no time during January, rocketing upward over +190% from the second day of the month into the resistance near $0.0151 AUD.

For the last several days, the price has consolidated sideways and appears to be flipping old resistance near $0.0143 AUD to support. If this level breaks – perhaps due to the tempting daily equal lows below – the next support begins near $0.0112 AUD.

Bulls entering at these levels could set their first target near the previous resistance near $0.0160 AUD. Beyond this level, probable targets include the old highs near $0.0204 AUD and the resistance above near $0.0229 AUD.

A break of this resistance, perhaps prompted by the halving coming later this month, could continue to the highs near $0.0249 AUD and $0.0287 AUD price levels.

Where to Buy or Trade Altcoins?

These 3 Altcoins have the highest liquidity on Binance Exchange so that would help for trading on USDT or BTC pairs. However, if you’re just looking at buying some quick and hodling then Swyftx Exchange is a popular choice in Australia.

Categories
Crypto News Market Analysis Trading

Horizen ZEN Breakout Analysis – ZEN Pumps +102% in a Week with Strong Bullish Trend

Horizen ZEN is flipping on a 1-day candle chart, ZEN has grown by a massive +102% in the past week. Let’s take a quick look at ZEN, price analysis, and possible reasons for the recent breakout.

What is Horizen?

Horizen is an inclusive ecosystem where everyone is empowered and rewarded for their contributions. Horizen’s massively scalable platform enables businesses and developers to quickly and affordably create their own public or private blockchains on the largest node network in the industry. Horizen’s Sidechain SDK provides all necessary components for easy and fast deployment of a fully customizable blockchain.

Horizen Quick Stats

SYMBOL:ZEN
Global rank:76
Market cap:$346,159,214 AUD
Current price:$32.10 AUD
All time high price:$91.50 AUD
1 day:+45.4%
7 day:+102.55%
1 year:+182.68%

Horizen Price Analysis

At the time of writing, ZEN is ranked 76th cryptocurrency globally and the current price is $32.10 AUD. This is a +102% increase since 5th January 2021 (7 days ago) as shown in the chart below.

Source: TradingView

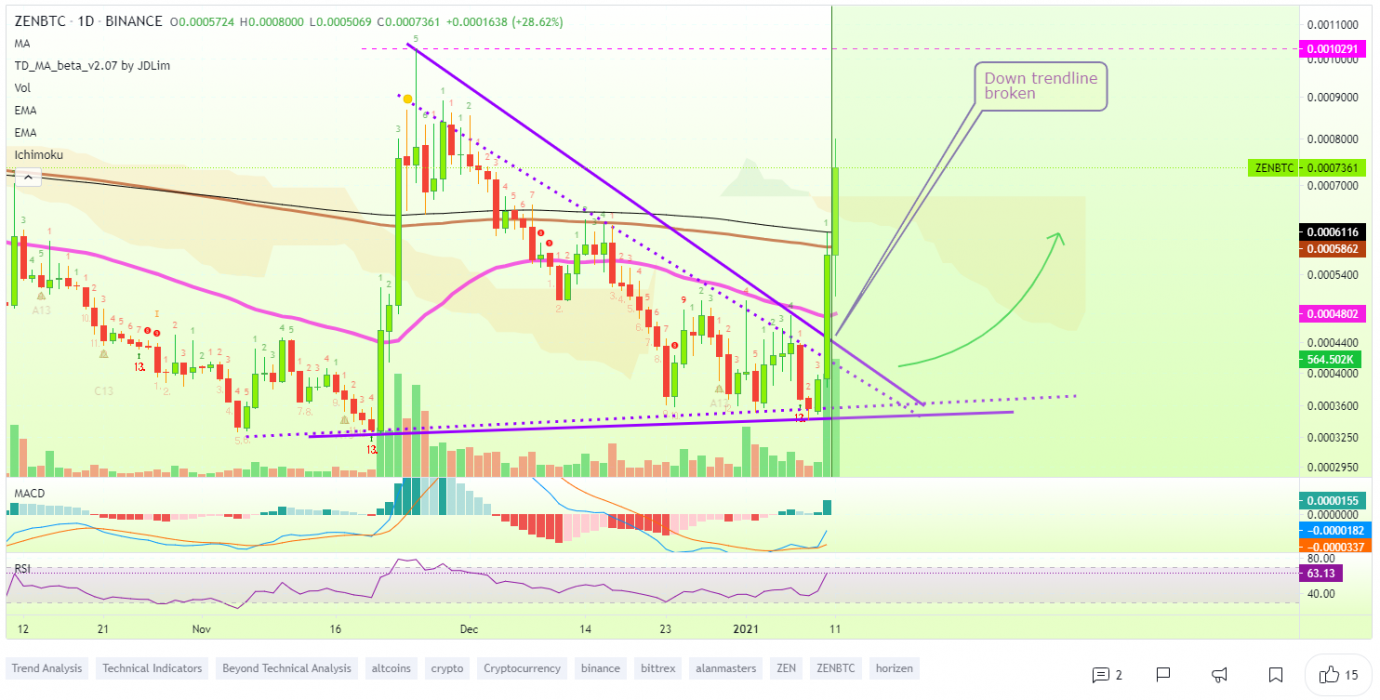
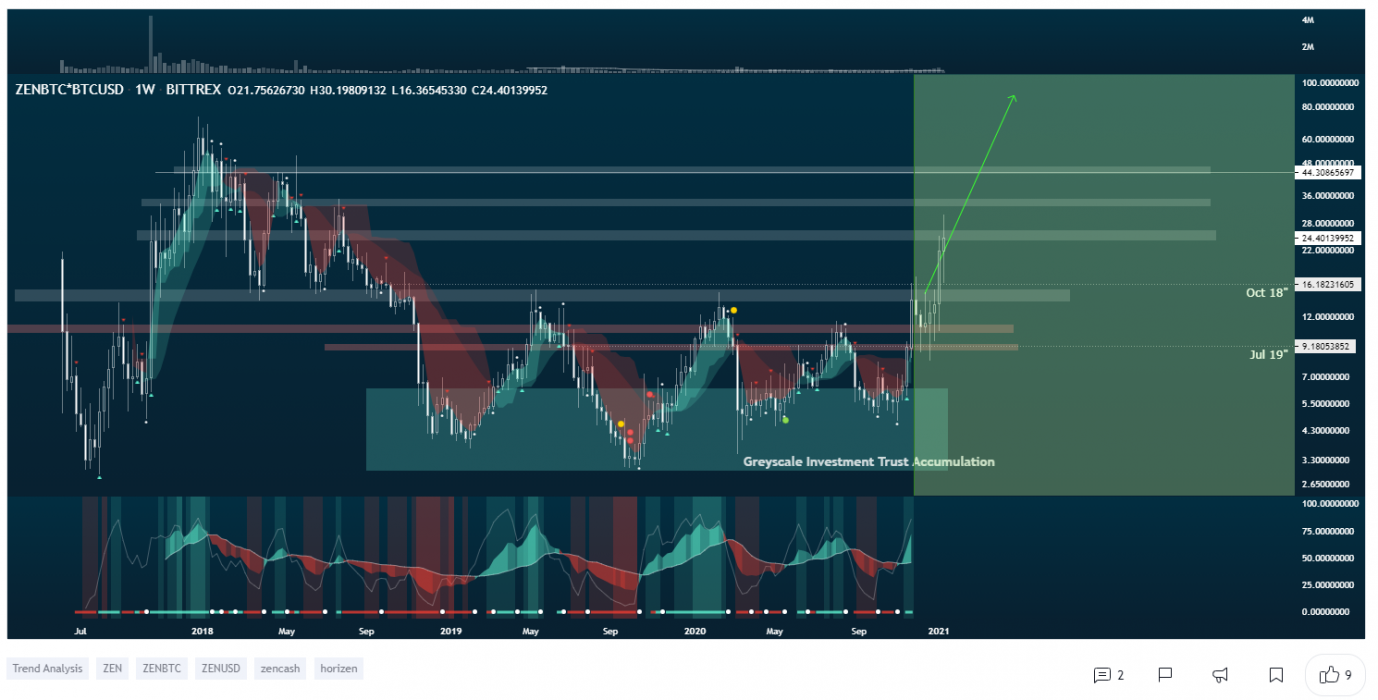
In the past week, there was a strong rise in Bitcoin, Ethereum, and other Altcoins. As a result, Horizen ZEN also formed strong support near $16.38 AUD price levels before starting a fresh increase against the BTC pair. The down trendline that started on 25th November. is being obliterated today, huge strength and volume which both signals the reversal of a trend. Additional growth can follow for this Altcoin on different trading pairs.

Here we also have the “W” pattern with a higher low just as looking at it before starting a strong increase, there was a break above a crucial contracting triangle with resistance near $20.65 AUD on the daily chart of the ZEN/BTC. The pair gained pace above the $23.40 AUD and $24.70 AUD resistance levels.

“W pattern is a price pattern, also called Double Bottom. This pattern, when drawn it looks like the W and this is why it is called as W pattern. Sometimes patterns look like W but it is not the exact W pattern and these patterns are called Semi-W patterns.”

Source: TradingView

What do the technical indicators say?

The Horizen ZEN TradingView indicators (on the 1 day) mainly indicate ZEN as a buy, except the Oscillators which indicate ZEN as a sell.

So Why did ZEN Breakout?

The recent rise in Bitcoin over +300% since the halving in May and then the suggested start of the Altcoin season could have contributed to the recent breakout. Another reason for this sudden pump in price could be the whales secretly buying ZEN for the next Altcoins rally & it could also be contributed to some of the recent news Partnership with Messari.

Recent Horizen News & Events:

Where to Buy or Trade Horizen?

ZEN has the highest liquidity on Binance Exchange so that would help for trading ZEN/USDT or ZEN/BTC pairs. However, if you’re just looking at buying some quick and hodling then Swyftx Exchange is a popular choice in Australia.

Categories
Crypto News Maker Market Analysis Trading

Maker Breakout Analysis – MKR Pumps +156% in a Week with Active Uptrend

Maker MKR is trading in uptrend here like many other altcoins. The Cryptocurrency MKR just went up +54% in a single day by breaking a Bullish rectangle with strong buying volume and surges over +156% in a week.

What is Maker?

Maker (MKR) is the governance token of the MakerDAO and Maker Protocol — respectively a decentralized organization and a software platform, both based on the Ethereum blockchain — that allows users to issue and manage the DAI stablecoin.

Maker Quick Stats

SYMBOL:MKR
Global rank:23
Market cap:$2,209,706,966 AUD
Current price:$2,126 AUD
All time high price:$2,548 AUD
1 day:+54.38%
7 day:+156.96%
1 year:+275.73%

MKR Price Analysis

At the time of writing, MKR is ranked 23rd cryptocurrency globally and the current price is $2,126AUD. This is a +156.96% increase since 4th January 2021 (7 days ago) as shown in the chart below.

Source: TradingView

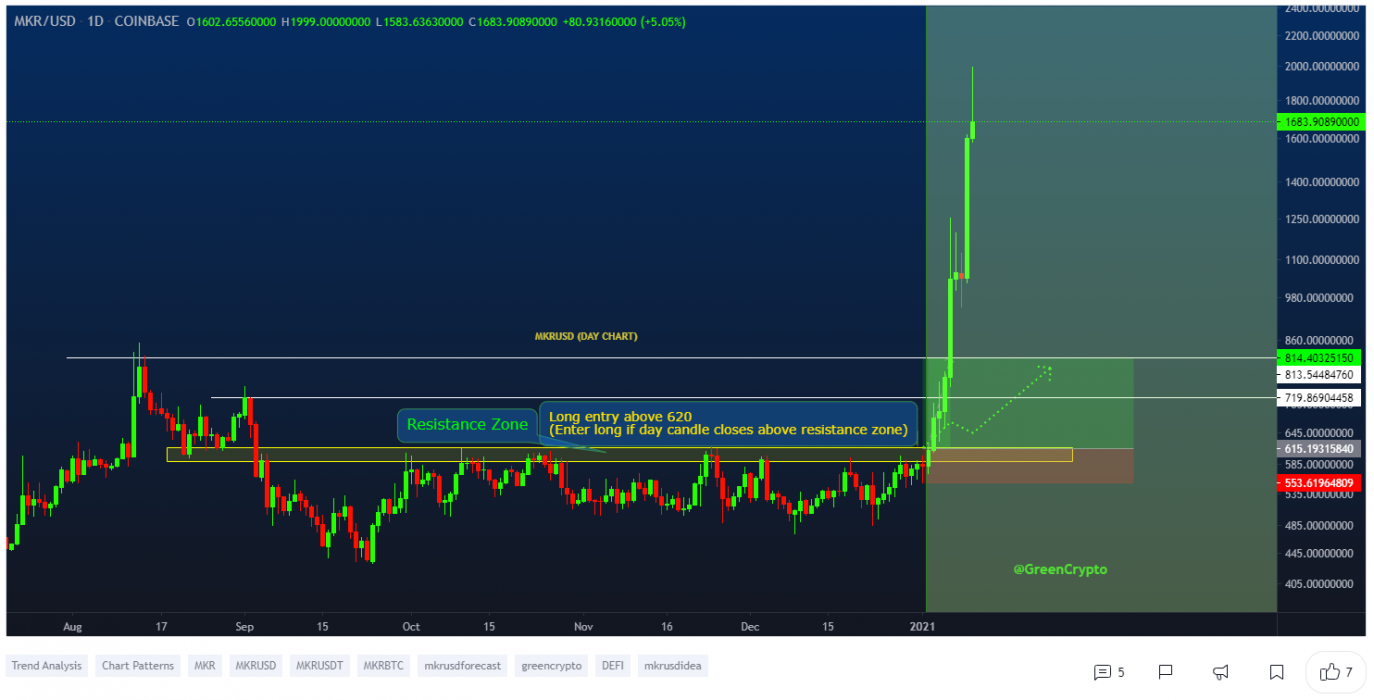
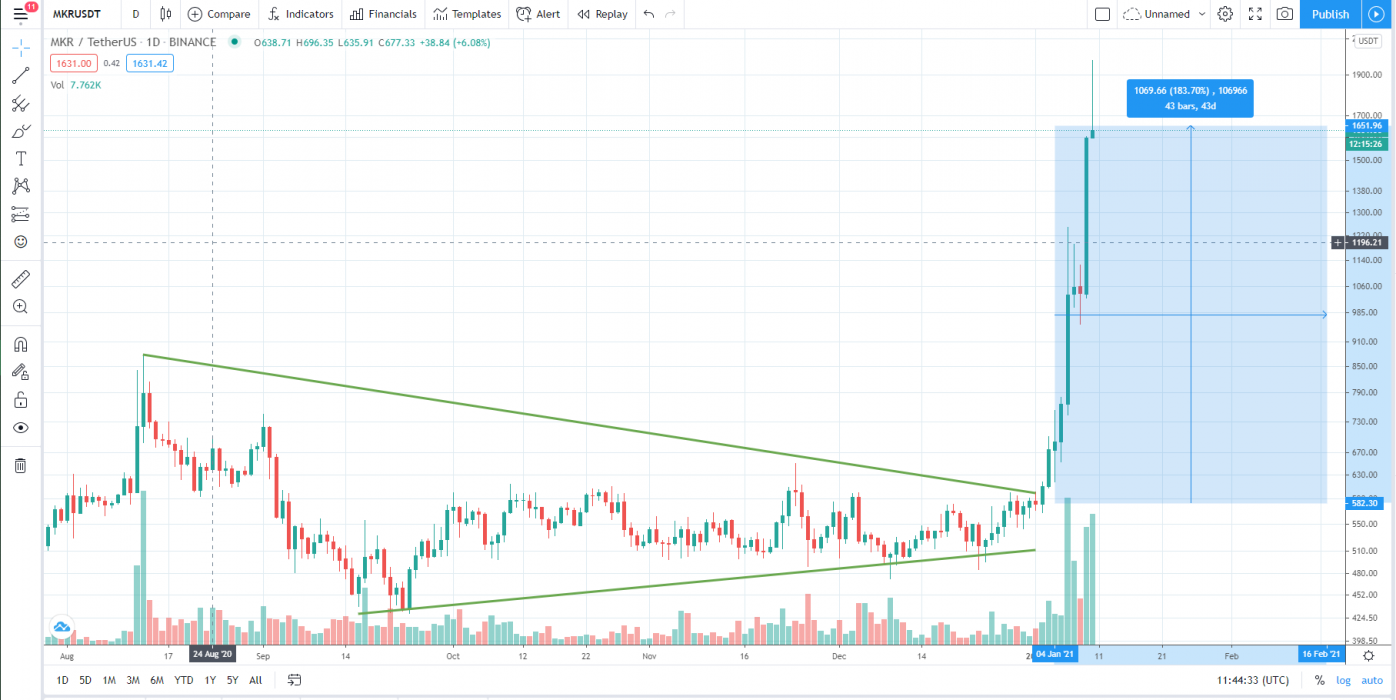
If we see the above 1-day candle chart, MKR did a strong breakout from the bullish rectangle pattern while trading sideways from the last few days & is now heading towards its major resistance of the month. After BTC made a new all-time high in its price recently and Altcoins are also rising in a bullish trend, MKR looks well-positioned to hit the next high price levels.

“Bullish rectangles are continuation patterns that occur when a price pauses temporarily during an uptrend – they offer you a buying opportunity. … you place your profit target the same distance above the rectangle’s upper resistance level as the distance between the rectangle’s two parallel lines.”

Source: TradingView

What do the technical indicators say?

The MKR TradingView indicators (on the 1 day) mainly indicate MKR as a buy, except the Oscillators which indicate MKR as a sell.

So Why did MKR Breakout?

The recent rise in Bitcoin over +300% since the halving in May and then the suggested start of the Altcoin season could have contributed to the recent breakout. Another reason for this sudden pump in price could be the whales secretly buying MKR for the next Altcoins rally & it could also be contributed to some of the recent news of Executive Voting Portal.

Recent MKR News & Events:

Where to Buy or Trade MKR?

Maker has the highest liquidity on Binance Exchange so that would help for trading MKR/BTC or MKR/USDT pairs. However, if you’re just looking at buying some quick and hodling then Swyftx Exchange is a popular choice in Australia.
Categories
Crypto News Market Analysis Trading

PundiX NPXS Breakout Analysis – Parabolic Breakout on NPXS with +150% Gains in a Single Day

PundiX NPXS just pumped up to +150% in a single day with a strong breakout on Binance & other Exchanges. Let’s take a quick look at the NPXS price analysis and possible reasons for the recent breakout.

What is NPXS?

Pundi X (NPXS) aims to make the use of cryptocurrency as a form of payment into a reality for retailers and consumers alike. By applying the technology to a series of real-world use cases such as cards and the XPOS point-of-sale devices, the team has built products that could accept the NPXS token for goods and services. With the goals of supporting retail intelligence, marketing & loyalty programs as well as inventory & order management systems, the Pundi X Point-of-Sale device could help to support digital commerce worldwide.

NPXS Quick Stats

SYMBOL:NPXS
Global rank:116
Market cap:$111,022,009 AUD
Current price:$0.0006 AUD
All time high price:$0.0201 AUD
1 day:+150.41%
7 day:+180.79%
1 year:+299.07%

NPXS Price Analysis

At the time of writing, NPXS is ranked 116th cryptocurrency globally and the current price is $0.0006 AUD. This is a +180.79% increase since 3rd January 2021 (7 days ago) as shown in the chart below.

Source: TradingView

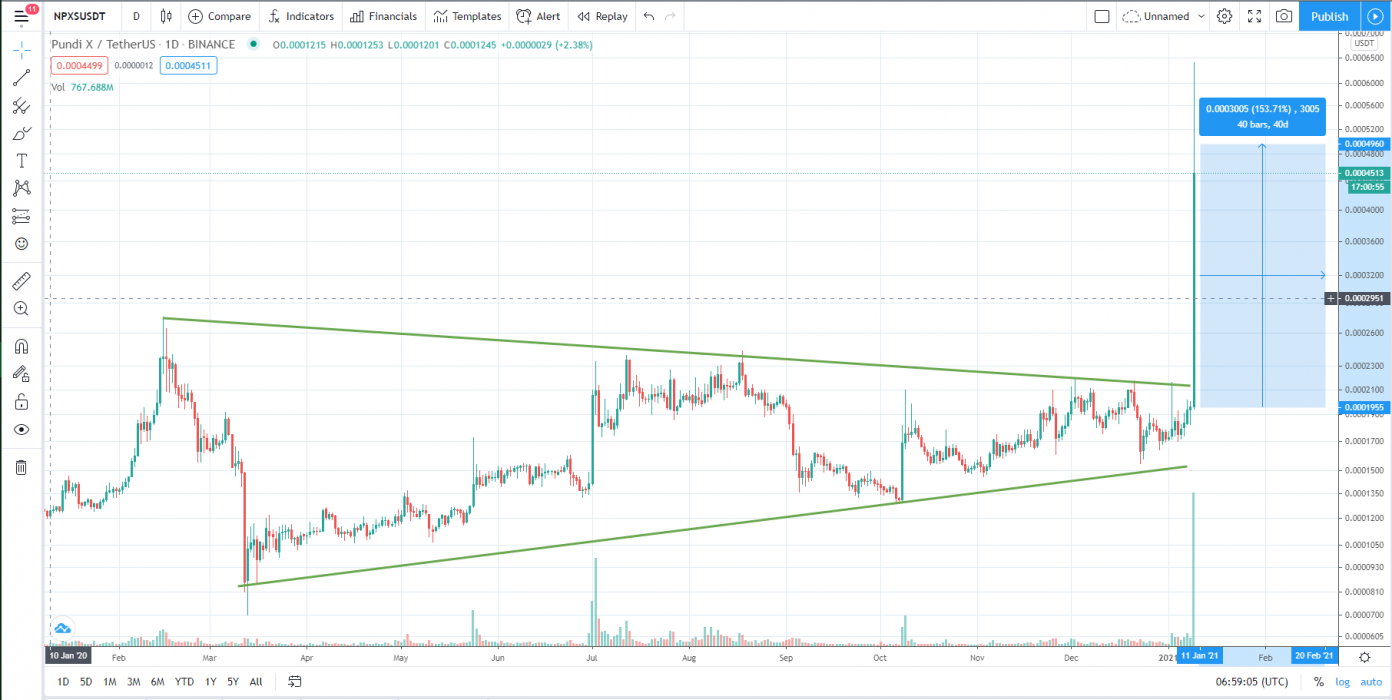
If we see the above 1-day candle chart, NPXS did a strong parabolic breakout from the rising wedge pattern while trading sideways from the last few days around $0.00025 AUD price levels & is now heading towards its major resistance of the year 2020 which is $0.0012 AUD. After BTC made a new all-time high in its price and Altcoins are also rising in a bullish trend, NPXS looks well-positioned to hit the next high price levels.

“A rising wedge is a technical indicator, suggesting a reversal pattern frequently seen in bear markets. This pattern shows up in charts when the price moves upward with pivot highs and lows converging toward a single point known as the apex.”

Source: TradingView

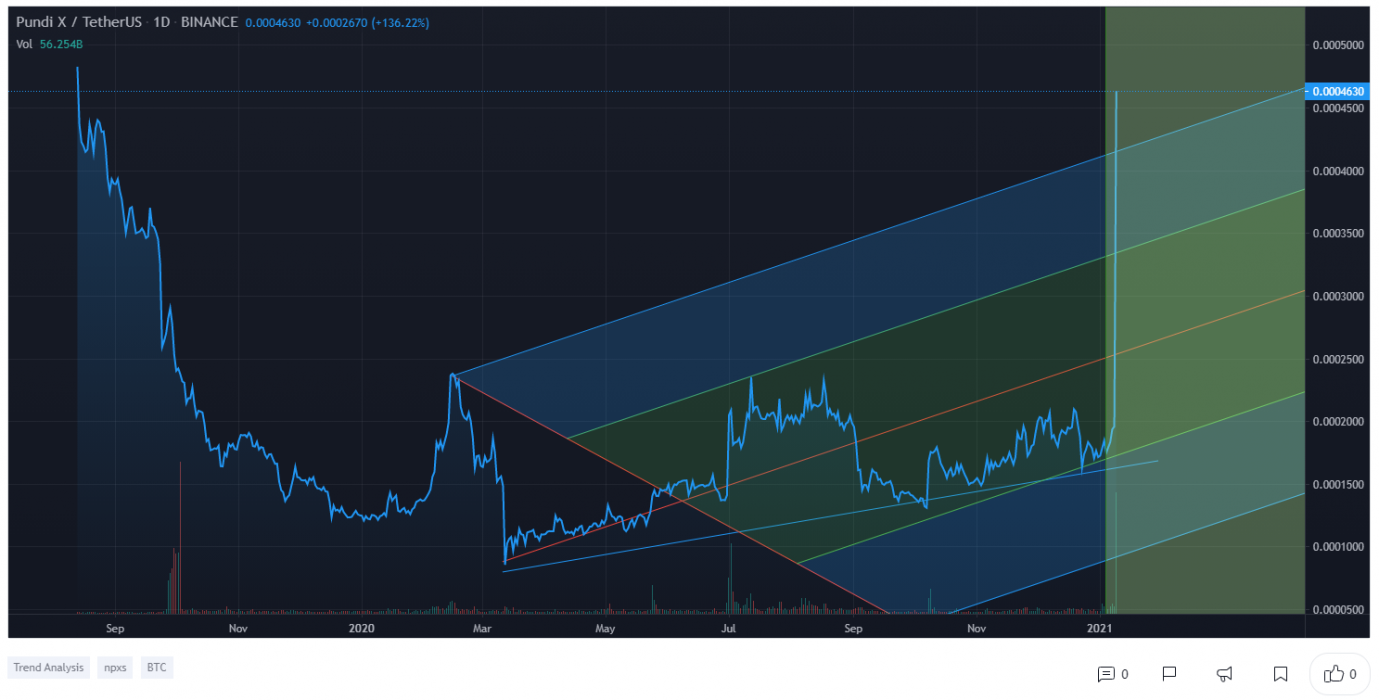
If we zoom out and take a look at the price over the past few months or so, we can see the recent breakout more clearly, the line is almost vertical which is looks insane.

What do the technical indicators say?

The NPXS TradingView indicators (on the 1 day) mainly indicate NPXS as a buy, except the Oscillators which indicate NPXS as a neutral.

So Why did NPXS Breakout?

The recent rise in Bitcoin over +300% since the halving in May and then the suggested start of the Altcoin season could have contributed to the recent breakout. Another reason for this sudden pump in price could be the whales secretly buying NPXS for the next Altcoins rally & it could also be contributed to some of the recent news of XPOS Transactions in the United States.

Recent NPXS News & Events:

Where to Buy or Trade NPXS?

PundiX NPXS has the highest liquidity on Binance Exchange so that would help for trading NPXS/USDT or NPXS/ETH pairs. However, if you’re just looking at buying some quick and hodling then Swyftx Exchange is a popular choice in Australia.