Categories
Bitcoin Crypto News Market Analysis Trading

Bitcoin Breakout Analysis – BTC Price Hits New High at $30k AUD with +15% Gains in a Day

Bitcoin hits a fresh record high above $30,000 AUD on Thursday, extending a wild rally for the cryptocurrency that has seen it more than triple in value this year.

The world’s most valuable digital currency surged +15% to $30,902 AUD according to crypto market data provider Coin Metrics, taking its year-to-date gains to more than +200%.

What is Bitcoin?

Bitcoin is a decentralized cryptocurrency originally described in a 2008 whitepaper by a person, or group of people, using the alias “Satoshi Nakamoto” It was launched soon after, in January 2009.

Bitcoin is a peer-to-peer online currency, meaning that all transactions happen directly between equal, independent network participants, without the need for any intermediary to permit or facilitate them. Bitcoin was created, according to Nakamoto’s own words, to allow “online payments to be sent directly from one party to another without going through a financial institution.”

Bitcoin Quick Stats

SYMBOL:BTC
Global rank:1st
Market cap:$551,313,622,271 AUD
Current price:$30,124 AUD
All time high price:$30,902 AUD
1 day:+15.96%
7 day:+24.53%
1 year:+241.59%

Bitcoin Price Analysis

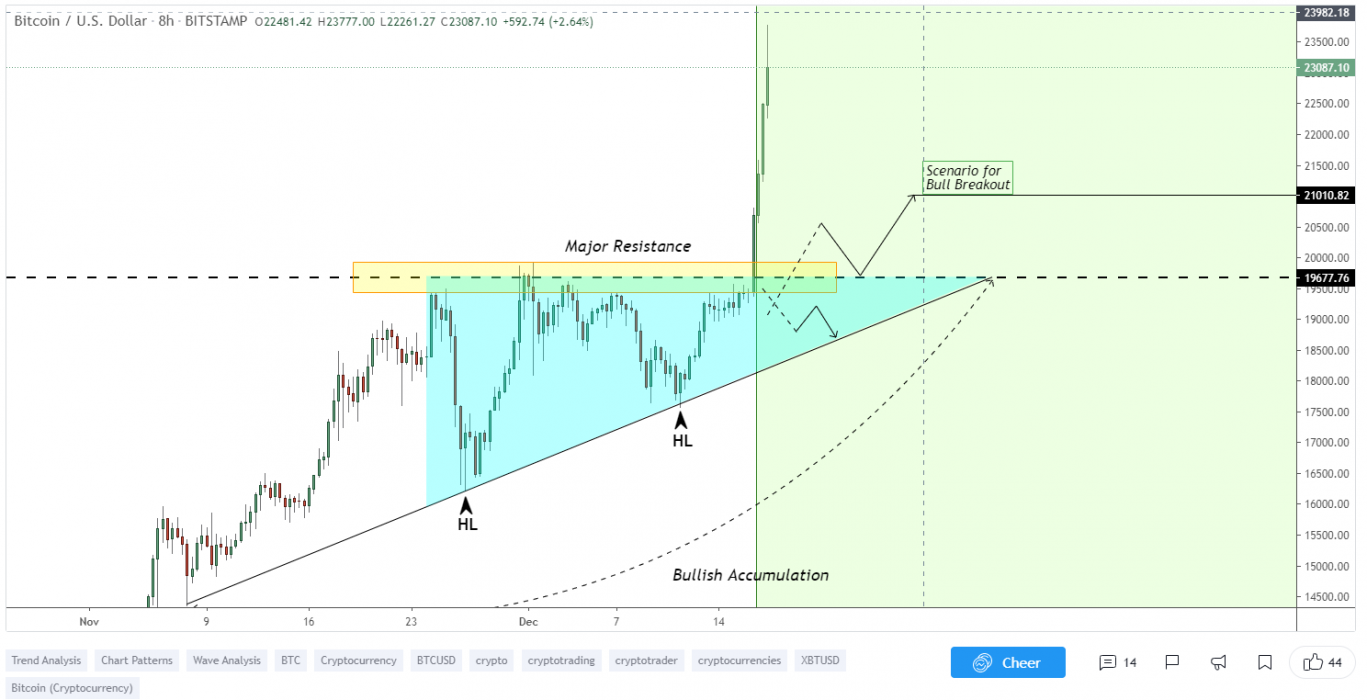
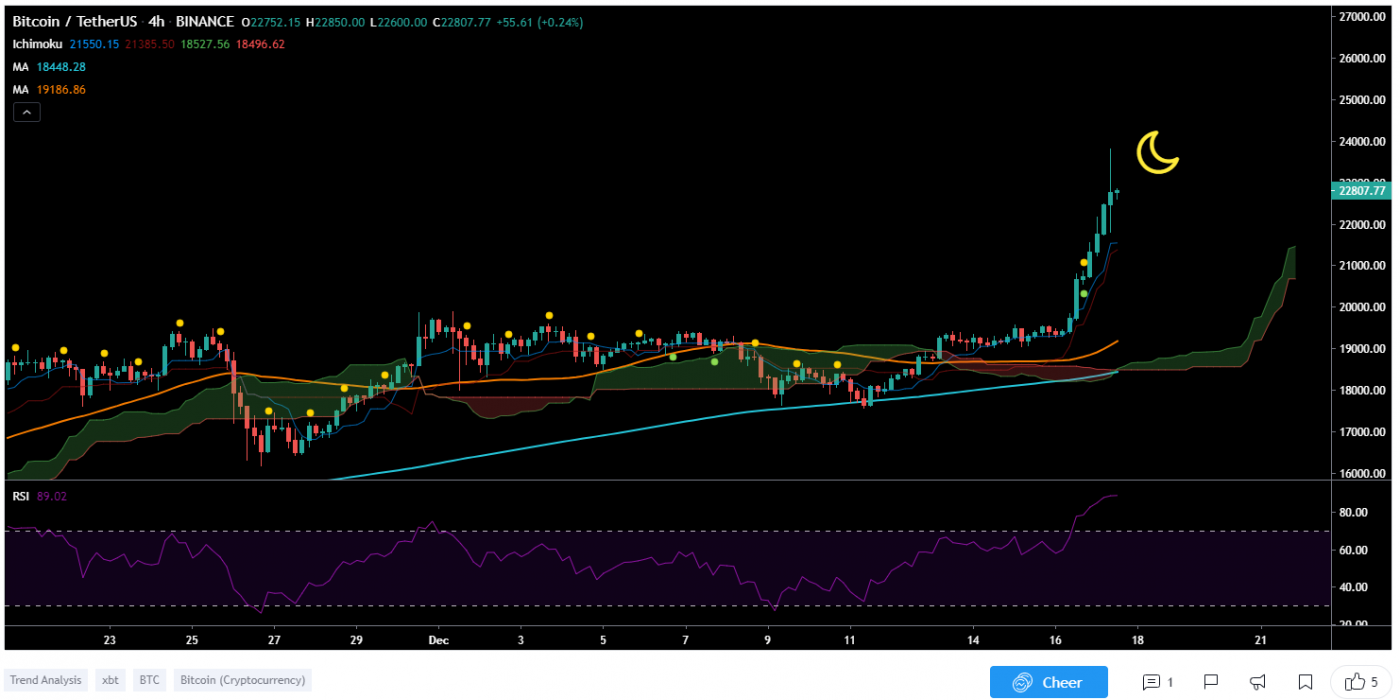
At the time of writing, Bitcoin is ranked 1st cryptocurrency globally and the current price is $30,124 AUD. This is a +24.53% increase since 11th December 2020 (7 days ago) as shown in the chart below.
Source: TradingView

After looking at the above 8-hour candle chart, we can clearly see that Bitcoin was trading inside the rising wedge pattern on the BTC/USDT pair. The first resistance was on the $26,151 AUD price levels which BTC broke with a strong bullish trend buying volume and made a new all-time high above +$30k AUD. Seeing that the whole crypto market is waking up bullish today, Bitcoin is likely to continue the uptrend to make new all-time high prices.

“A rising wedge is a technical indicator, suggesting a reversal pattern frequently seen in bear markets. This pattern shows up in charts when the price moves upward with pivot highs and lows converging toward a single point known as the apex.”
Source: TradingView

The cryptocurrency rose by more than +15% on Thursday to reach $30,472 against the AUD, extending a winning streak this year amid growing interest among big investment companies attracted to its potential for quick gains.

The price of bitcoin has surged by more than +400% this year from a low point of around $4,718 AUD in March when the coronavirus pandemic triggered a deep sell-off in financial markets around the world.

Analysts said that unlike in previous surges, a major price driver appeared to be more institutional investors buying into the cryptocurrency.

What do the Technical Indicators say?

The  Bitcoin TradingView indicators (on the 1 day) mainly indicate BTC as a buy, except the Oscillators which indicate BTC as a neutral.

So Why did Bitcoin Breakout?

The recent rise in Bitcoin over 100% since the halving in May and then the suggested start of the Altcoin season could have contributed to the recent breakout of Bitcoin. Another reason could be the whales, secretly stacking up Bitcoin to their portfolio for the next bull run rally.

A few other reasons for Bitcoin’s return to the record highs. It’s about $30,124 as of this writing, matching the previous highs from 2017’s original explosion.

Reason One: Paypal and Square’s Cash App, according to reports, are in a race to acquire enough Bitcoin to facilitate the next generation of their money transferring services. They both seek to allow their massive user bases to be able to seamlessly transact with merchants in Bitcoin, moving money back and forth from sovereign currencies into Bitcoin, etc.

Reason Two: Wall Street legends are being won over. Don’t underestimate the pull of FOMO, peer pressure, idol worship, etc, Read this article in Barron’s about how institutions are afraid of missing out.

Reason Three: Gold and Silver aren’t “working.” Go look at a chart of gold or a gold ETF since the summer. It peaked in July in US dollar terms. The weakening (some would say plunging) dollar is one of the biggest macro stories around right now. Gold should be rallying. So far it’s not. Just fell below its 200-day last week.

Recent Bitcoin News & Events:

Where to Buy or Trade Bitcoin?

Bitcoin has the highest liquidity on Binance Exchange so that would help for trading USDT/BTC pair. However, if you’re just looking at buying some quick and hodling Bitcoin then Swyftx Exchange is a popular choice in Australia.

Categories
Crypto News Market Analysis Trading

Prometeus Breakout Analysis – Parabolic Breakout on PROM with +90% Gain in a Single Day

Prometeus PROM just pumped up to +90% in a single day with a strong breakout on Binance & other Exchanges. Let’s take a quick look at PROM, price analysis, and possible reasons for the recent breakout.

What is Prometeus?

Prometeus Network describes itself as a secure and decentralized ecosystem designed to solve real-world problems in data brokerage. It was created for the Influencer Marketing, Medical, and Insurance data market industries. Prometeus Network is developed by Prometeus Labs, a company of data scientists and entrepreneurs.

PROM Quick Stats

SYMBOL:PROM
Global rank:199
Market cap:$43,632,422 AUD
Current price:$6.89 AUD
All time high price:$7.50 AUD
1 day:+90.25%
7 day:+105.66%
1 year:+1345.47%

PROM Price Analysis

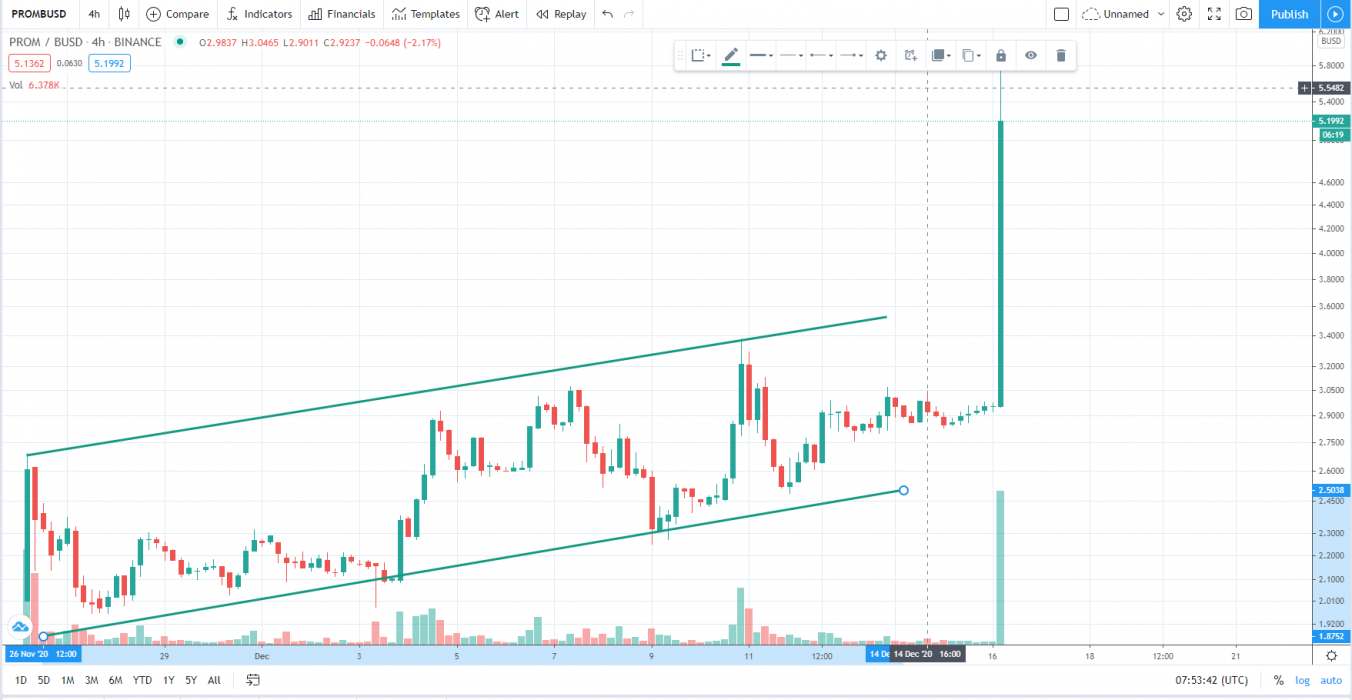
At the time of writing, PROM is ranked 199th cryptocurrency globally and the current price is $6.89 AUD. This is a +105.66% increase since 10th December 2020 (7 days ago) as shown in the chart below.

Source: TradingView

After looking at the above 4-hour candle chart, we can clearly see that PROM was trading inside the inverse head and shoulders pattern on the PROM/BUSD pair. The first resistance was on the $3.12 AUD price level which PROM broke with a strong bullish trend buying volume and is now heading towards the all-time high price. Seeing that many altcoins are waking up bullish today, PROM is likely to continue to increase in the uptrend.

“An inverse head and shoulders pattern is comprised of three component parts: After long bearish trends, the price falls to a trough and subsequently rises to form a peak. … The price falls for the third time, but only to the level of the first trough, before rising once more and reversing the trend.”

What do the Technical indicators say?

The  PROM TradingView indicators (on the 1 day) mainly indicate PROM as a buy, except the Oscillators which indicate PROM as a sell.

So Why did PROM Breakout?

The recent rise in Bitcoin over 100% since the halving in May and then the suggested start of the Altcoin season could have contributed to the recent breakout. Another reason could be the whales, secretly stacking up PROM to their portfolio for this Altcoin rally. It could also be contributed to some of the recent news of Binance Listing PROM to Innovation Zone.

Recent PROM News & Events:

Where to Buy or Trade PROM?

Prometeus has the highest liquidity on Binance Exchange so that would help for trading PROM/BUSD or PROM/BNB pairs. However, you can also buy PROM from different exchanges listed on Coinmarketcap.

Categories
Bancor Crypto News Market Analysis Trading

Bancor Breakout Analysis – BNT Performing Active Uptrend with +29% Gains in a Day

Bancor is trading in active uptrend here like many other Altcoins. The Cryptocurrency Bancor BNT just went up +29% in a single day and surges over +32% in a week.

What is Bancor?

Bancor is an on-chain liquidity protocol that enables automated, decentralized exchange on Ethereum and across blockchains. The protocol is made up of a series of smart contracts that are designed to pool liquidity and perform peer-to-contract trades in a single transaction with no counterparty. Users stake BNT in automated market makers in exchange for trading fees, BNT staking rewards, and voting rights in the Bancor DAO. Bancor has processed more than $2 billion in trade volume across thousands of tokens, with millions in fees generated by stakers.

Bancor Quick Stats

SYMBOL:BNT
Global rank:93
Market cap:$164,380,611 AUD
Current price:$1.77 AUD
All time high price:$13.31 AUD
1 day:+29.79%
7 day:+32.04%
1 year:+419.44%

Bancor Price Analysis

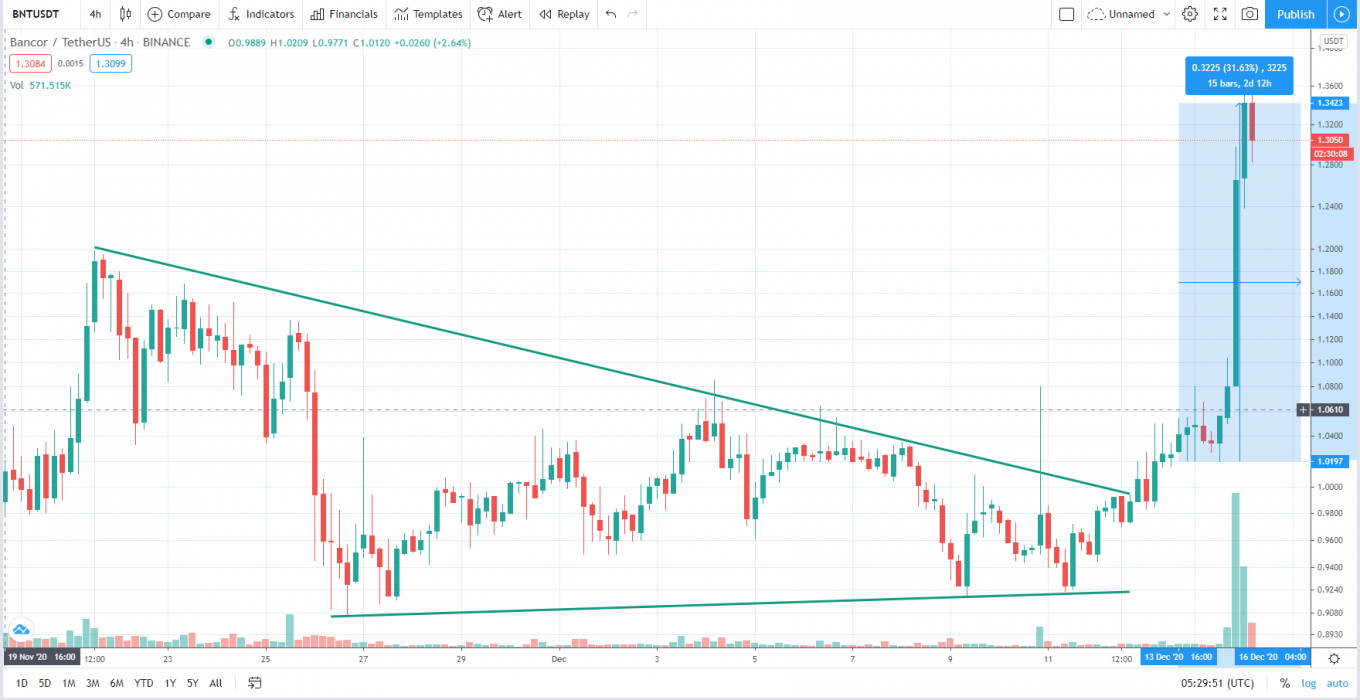
At the time of writing, Bancor is ranked 93rd cryptocurrency globally and the current price is $1.77 AUD. This is a +32.04% increase since 9th December 2020 (7 days ago) as shown in the chart below.

Source: TradingView

If we see the above 2-hour candle chart, BNT just bounced back from its support levels of $0.91 AUD and took a strong breakout from Descending Triangle within the next resistance which was at $1.25 AUD. The blue line is acting as a support level for this Descending triangle trend.

“A descending triangle is a bearish chart pattern used in technical analysis that is created by drawing one trend line that connects a series of lower highs and a second horizontal trend line that connects a series of lows”

Source: TradingView

What do the technical indicators say?

The BNT TradingView indicators (on the 1 day) mainly indicate BNT as a buy, except the Oscillators which indicate BNT as a neutral.

So Why did BNT Breakout?

The recent rise in Bitcoin over 100% since the halving in May and then the suggested start of the Altcoin season could have contributed to the recent breakout. It could also be contributed to some of the recent news of BNT Liquidity Mining Rewards.

Recent BNT News & Events:

Where to Buy or Trade BNT?

Bancor has the highest liquidity on Binance Exchange so that would help for trading BNT/USDT or BNT/BTC pairs. However, if you’re just looking at buying some quick and hodling then Swyftx Exchange is a popular choice in Australia.
Categories
Crypto News Market Analysis Trading

Theta Fuel Breakout Analysis – TFUEL Pumps +42% in a Week

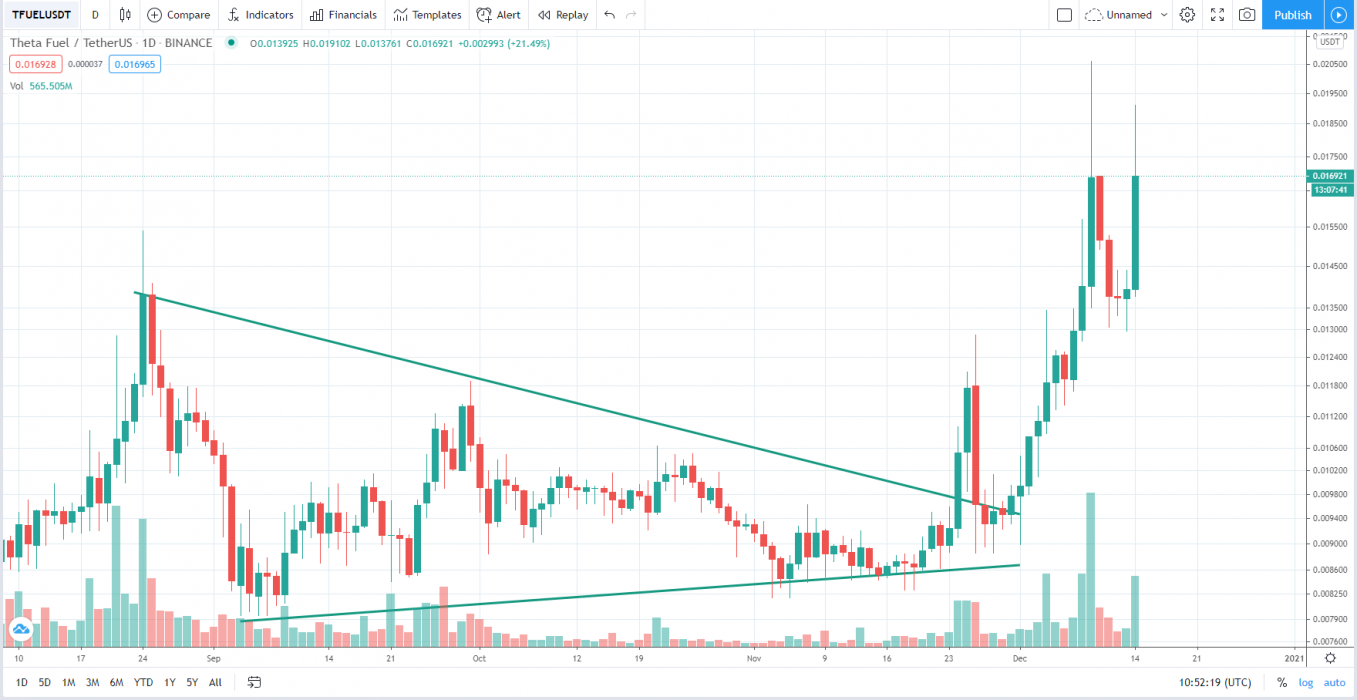
Theta Fuel is trading in active uptrend here like many other altcoins. The Cryptocurrency TFUEL just went up +27.96% in a single day and surges over +42.12% in a week.

What is Theta Fuel?

Theta Fuel is the second token (gas token) of the Theta Network. Theta Fuel is a native token on the Theta blockchain. TFUEL powers on-chain operations like payments to relayers for sharing a video stream, or for deploying or interacting with smart contracts. Relayers earn TFUEL for every video stream they relay to other users on the network.

TFUEL Quick Stats

SYMBOL:TFUEL
Global rank:114
Market cap:$112,242,519 AUD
Current price:$0.0226 AUD
All time high price:$0.0331 AUD
1 day:+27.96%
7 day:+42.12%
1 year:+594.07%

TFUEL Price Analysis

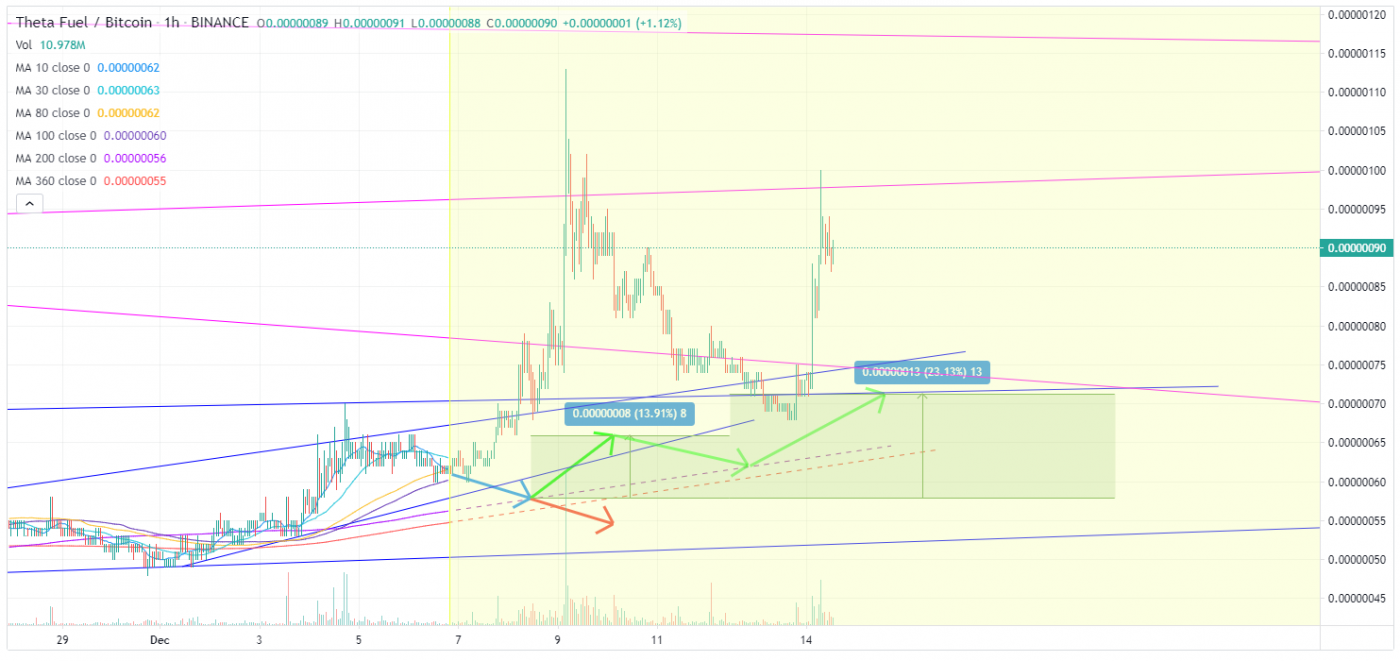
At the time of writing, TFUEL is ranked 114th cryptocurrency globally and the current price is $0.0226 AUD. This is a +42.12% increase since 8th December 2020 (7 days ago) as shown in the chart below.

Source: TradingView

After looking at the above 1-hour candle chart, we can clearly see that TFUEL was trading inside the falling wedge pattern on the TFUEL/BTC pair. The first resistance was on the $0.0165 AUD price levels which TFUEL broke with a strong bullish trend buying volume and is now heading towards the next resistance at $0.0254 AUD & $0.0286 AUD respectively. Seeing that many altcoins are waking up bullish today, TFUEL is likely to continue the uptrend.

“The falling wedge pattern is a continuation pattern formed when price bounces between two downward slopings, converging trendlines. It is considered a bullish chart formation but can indicate both reversal and continuation patterns – depending on where it appears in the trend”

Source: TradingView

What do the Technical Indicators say?

The  TFUEL TradingView indicators (on the 1 day) mainly indicate TFUEL as a strong buy, except the Oscillators which indicate TFUEL as a buy.

So Why did TFUEL Breakout?

The recent rise in Bitcoin over 100% since the halving in May and then the suggested start of the Altcoin season could have contributed to the recent breakout. Another reason could be the whales, secretly stacking up TFUEL to their portfolio for this Altcoins rally. It could also be contributed to some of the recent news of TFUEL Staking & Burning.

Recent TFUEL News & Events:

Where to Buy or Trade TFUEL?

Theta Fuel has the highest liquidity on Binance Exchange so that would help for trading TFUEL/USDT or TFUEL/BTC pairs. However, if you’re just looking at buying some quick and hodling then Swyftx Exchange is a popular choice in Australia.

Categories
Crypto News Litecoin Market Analysis NEO Ripple Trading

Altcoins Trading Analysis – 3 Coins that Might Breakout Today: XRP, LTC, NEO

For today’s trading news, we’re looking at three altcoins that might breakout by showing bullish trends in the charts.

1. Ripple (XRP)

Ripple is a real-time gross settlement system, currency exchange, and remittance network created by Ripple Labs Inc., a US-based technology company.

XRP Price Analysis

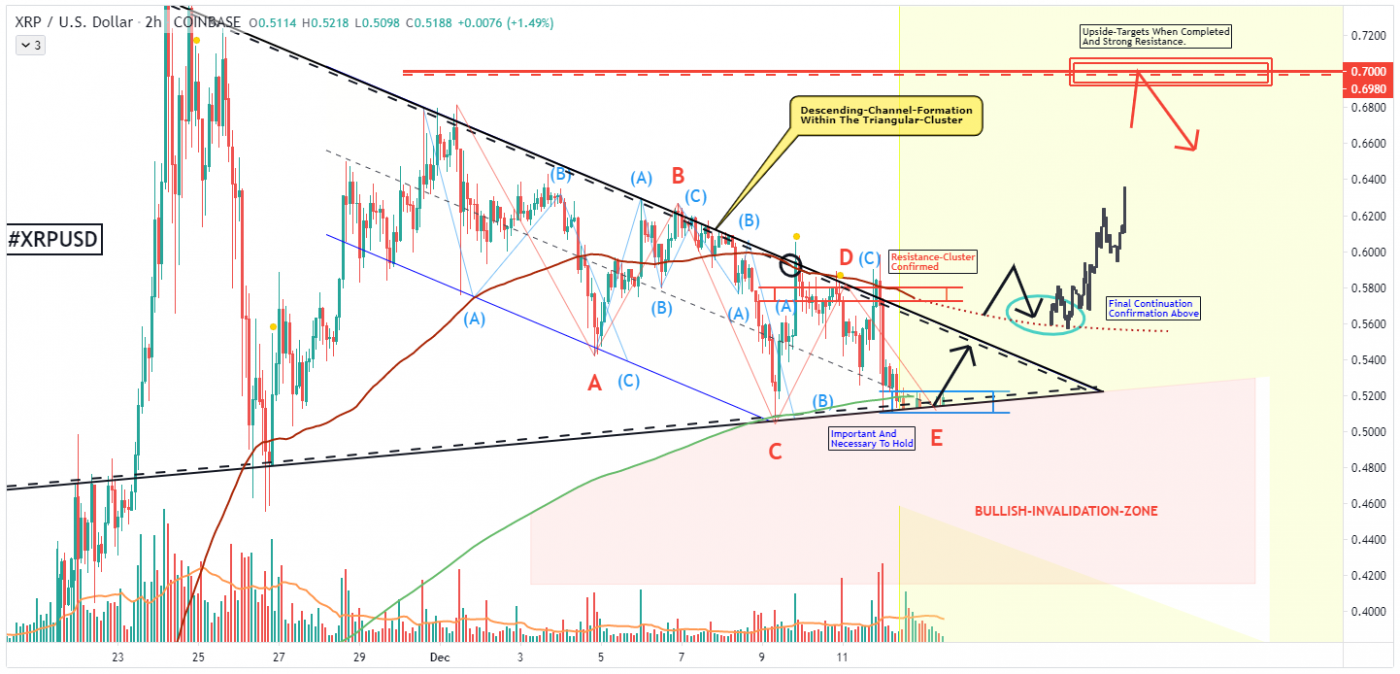
At the time of writing, XRP is ranked 3rd cryptocurrency globally and the current price is $0.6960 AUD AUD. Let’s take a look at the chart below for price analysis.

Source: TradingView

If we see the above 2-hour candle chart, we are moving in a symmetrical triangle, just tested the lower support line of this triangle, and we can expect the movement to the upper resistance line. If we breakout from this ABCDE triangle pattern, XRP might start a new bullish trend.

“A symmetrical triangle is a chart pattern characterized by two converging trend lines connecting a series of sequential peaks and troughs. Trend lines that are converging at unequal slopes are referred to as a rising wedge, falling wedge, ascending triangle, or descending triangle.”

2. Litecoin (LTC)

Litecoin is a peer-to-peer cryptocurrency created by Charlie Lee, a former Google employee, in 2011. The cryptocurrency was created based on the Bitcoin protocol, but it differs in terms of the hashing algorithm used, hard cap, block transaction times, and a few other factors.

LTC Price Analysis

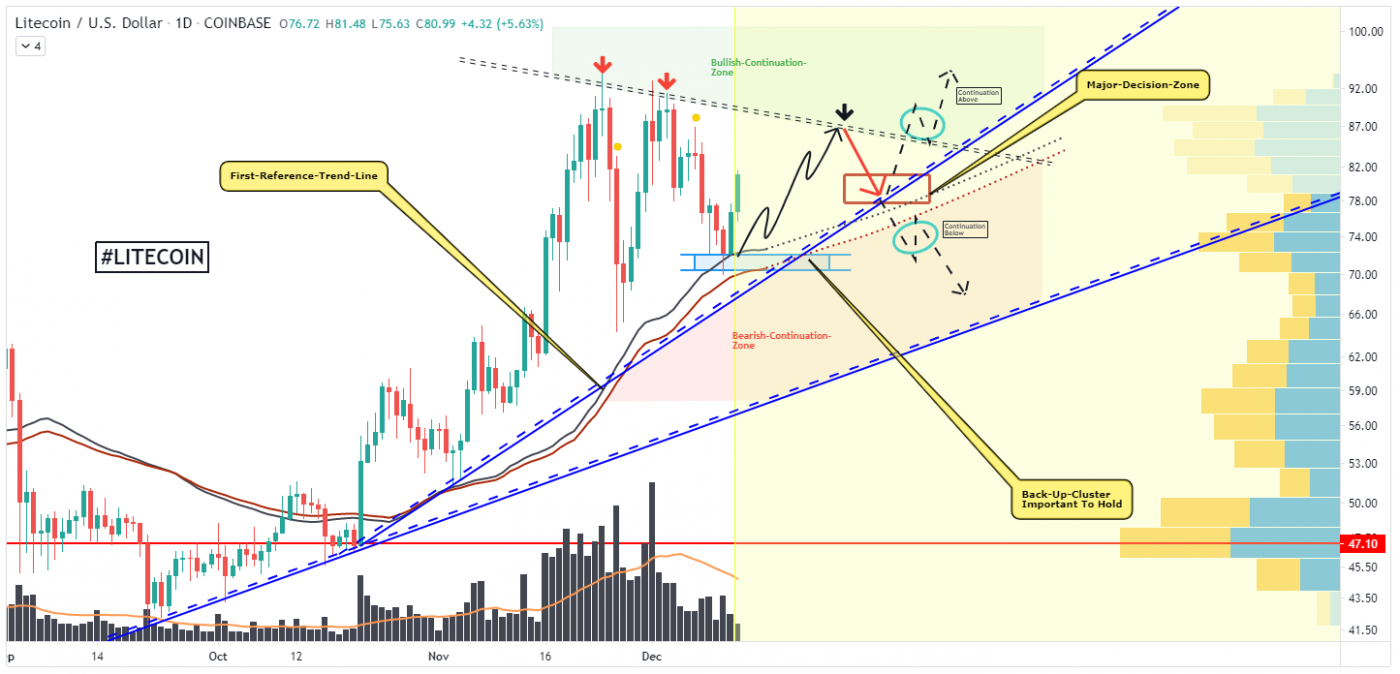
At the time of writing, LTC is ranked 5th cryptocurrency globally and the current price is $107.69 AUD  AUD. Let’s take a look at the chart below for price analysis.

Source: TradingView

If we see the above 1-day candle chart, Litecoin LTC is forming a rising wedge pattern by making higher-highs as resistance, if LTC bounces back from the blue support line and breaks the previous resistances it can continue the bullish trend with massive gains on different trading pairs like LTC/BTC or LTC/USDT.

“A rising wedge is a technical indicator, suggesting a reversal pattern frequently seen in bear markets. This pattern shows up in charts when the price moves upward with pivot highs and lows converging toward a single point known as the apex.”

3. Neo (NEO)

Neo bills itself as a “rapidly growing and developing” ecosystem that has the goal of becoming the foundation for the next generation of the internet a new economy where digitized payments, identities, and assets come together. Initially known as Antshares, this project was believed to be China’s first-ever public blockchain when it was launched in February 2014. The open-source platform subsequently rebranded to Neo three years later.

NEO Price Analysis

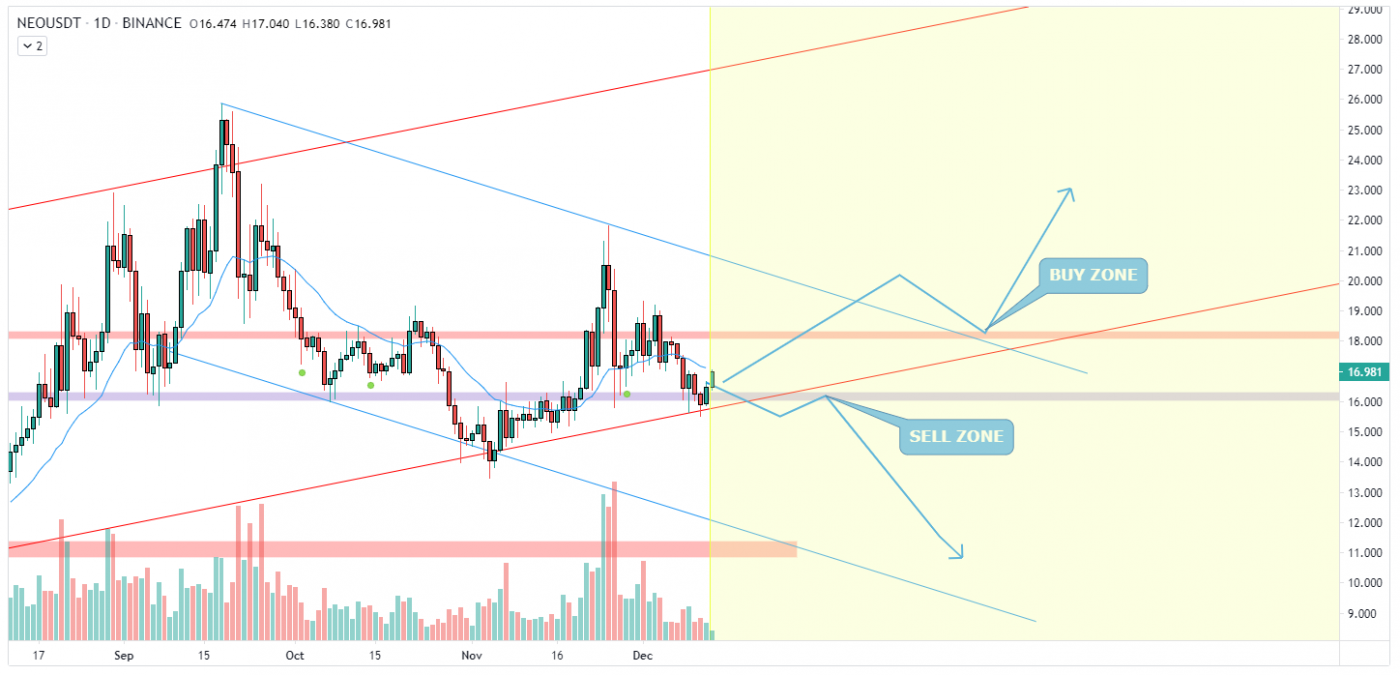
At the time of writing, NEO is ranked 23rd cryptocurrency globally and the current price is $22.81 AUD. Let’s take a look at the chart below for price analysis.

Source: TradingView

NEO is testing the weekly trendline and monthly structure. If NEO bounces back from the support and breaks the previous resistance at $24.06 AUD & $29.50 AUD respectively, we can see the bullish uptrend in prices for NEO on different trading pairs like NEO/BTC or NEO/USDT.

NEO has been in a consolidation period since breaking the $20.45 AUD price levels , looking for a delayed bullish run after watching bitcoin sit & close above higher highs with other altcoins market trends.

Where to Buy or Trade Altcoins?

These 3 Altcoins have the highest liquidity on Binance Exchange so that would help for trading USDT or BTC pairs. However, if you’re just looking at buying some quick and hodling then Swyftx Exchange is a popular choice in Australia.
Categories
Crypto News Market Analysis Trading

DForce Breakout Analysis – Parabolic Breakout on DF with +76% Gains in a Single Day

DForce DF is flipping on a 1-hour candle chart, DF just went up over +76% in a single day. Let’s take a quick look at DF, price analysis, and possible reasons for the recent breakout.

What is DForce?

DF is the platform utility token of the DForce network, an integrated and interoperable DeFi platform. It will be used for transaction services, community governance, system stabilizer, incentivization, and validator deposits.

DForce Quick Stats

SYMBOL:DF
Global rank:414
Market cap:$19,107,370 AUD
Current price:$0.2100 AUD
All time high price:$1.56 AUD
1 day:+76.41%
7 day:+107.70%
1 year:+148.74%

DForce Price Analysis

At the time of writing, DF is ranked 414th cryptocurrency globally and the current price is $0.2100 AUD. This is a +107.70% increase since 5th December 2020 (7 days ago) as shown in the chart below.

Source: TradingView

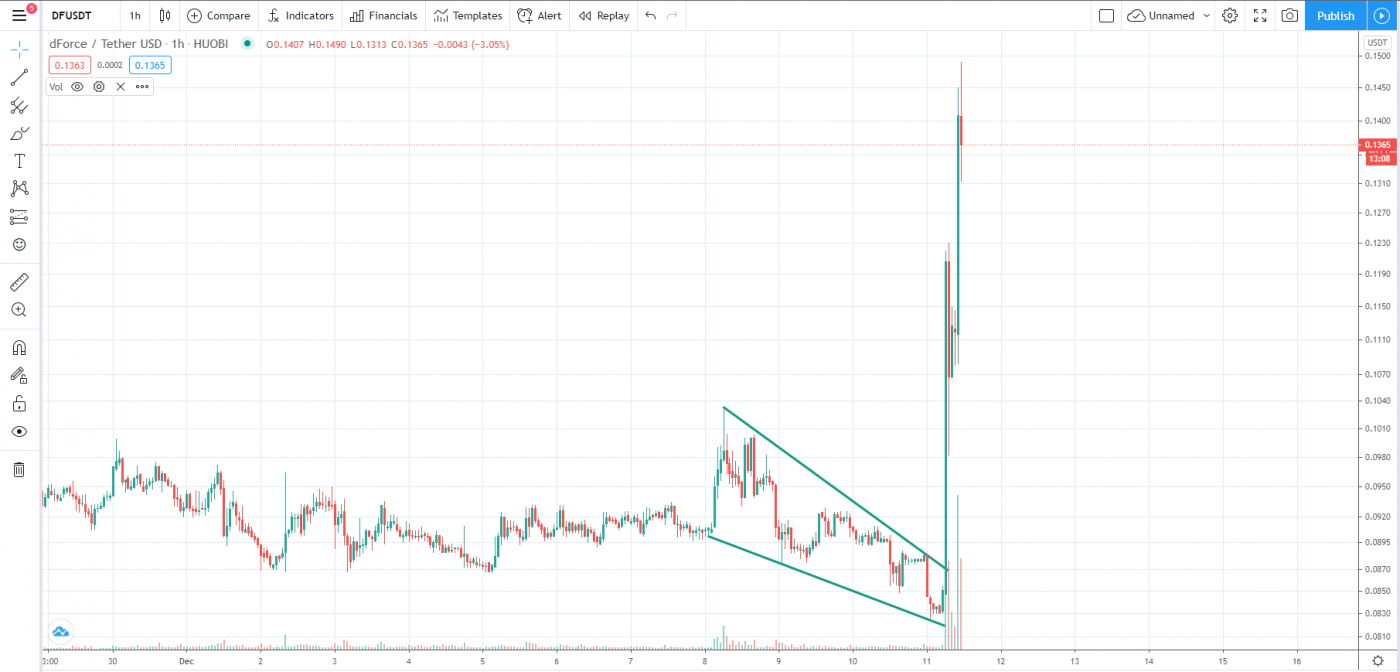
If we see the above 1-hour candle chart, DF did a strong breakout from the falling wedge pattern & is now heading towards its major resistance of the month. After BTC crashed the Altcoins market today with a -3% drop in its price, DF looks well-positioned to hit the next high price levels.

“The Falling Wedge is a bullish pattern that begins wide at the top and contracts as prices move lower. This price action forms a cone that slopes down as the reaction highs and reaction lows converge.”

What do the technical indicators say?

The DForce TradingView indicators (on the 1 day) mainly indicate DF as a buy, except the Oscillators which indicate DF as a neutral.

So Why did DForce Breakout?

The recent rise in Bitcoin over 100% since the halving in May and then the suggested start of the Altcoin season could have contributed to the recent breakout. Another reason for this sudden pump in price could be the whales secretly buying Dforce for the next Altcoins rally & it could also be contributed to some of the recent events & announcement where Binance Lists DForce DF.

Recent DForce News & Events:

Where to Buy or Trade DForce?

DForce has the highest liquidity on Binance Exchange so that would help for trading DF/BUSD or DF/ETH pairs. However, you can also buy DForce from different exchanges listed on Coinmarketcap.

Categories
Crypto News Market Analysis Nucleus Vision Trading

Nucleus Vision Breakout Analysis – Parabolic Breakout on NCASH with +51% Gains in a Week

Nucleus Vision was trading sideways on a 4-hour candle chart and it just went up over +51% in a week by breaking all previous resistances. Let’s take a quick look at NCASH, price analysis, and possible reasons for the recent breakout.

What is Nucleus Vision?

Launched in 2014, Nucleus Vision, also known as NCash, aims to bridge the divide between the online and offline retail world. The project is an IoT-based, contactless identification system that enables retailers to identify and better serve their customers by using customer’s records to make precise decisions on product preferences without the use of WiFi or Bluetooth.

NCASH Quick Stats

SYMBOL:NCASH
Global rank:714
Market cap:$7,190,556 AUD
Current price:$0.0010 AUD
All time high price:$0.0680 AUD
1 day:+26.41%
7 day:+51.73%
1 year:+99.35%

NCASH Price Analysis

At the time of writing, NCASH is ranked 714th cryptocurrency globally and the current price is $0.0010 AUD. This is a +51.73% increase since 7th December 2020 (7 days ago) as shown in the chart below.

Source: TradingView

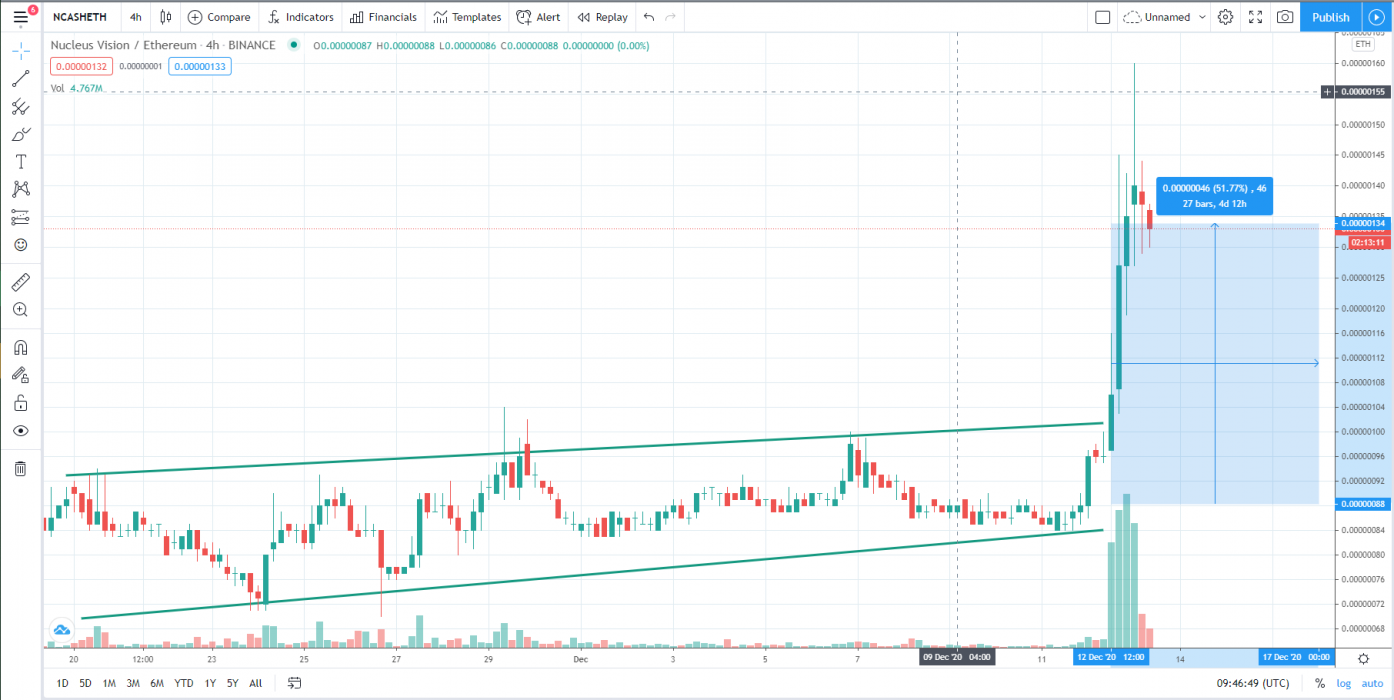
After looking at the above 4-hour candle chart, we can clearly see that NCASH was trading inside the inverse head and shoulders pattern on the NCASH/ETH pair. The first resistance was on the $0.0008 AUD price level which NCASH broke with a strong bullish trend buying volume and is now heading towards the previous monthly resistance. Seeing that many altcoins are waking up bullish today, NCASH is likely to continue to increase.

“An inverse head and shoulders pattern is comprised of three component parts: After long bearish trends, the price falls to a trough and subsequently rises to form a peak. … The price falls for the third time, but only to the level of the first trough, before rising once more and reversing the trend.”

What do the Technical indicators say?

The  NCASH TradingView indicators (on the 1 day) mainly indicate NCASH as a buy, except the Moving Averages which indicate NCASH as a strong buy.

So Why did NCASH Breakout?

The recent rise in Bitcoin over 100% since the halving in May and then the suggested start of the Altcoin season could have contributed to the recent breakout. Another reason could be the whales, secretly stacking up NCASH to their portfolio for this Altcoin rally. It could also be contributed to some of the recent news for Point-Of-Sale Financing.

Recent NCASH News & Events:

Where to Buy or Trade NCASH?

Nucleus Vision has the highest liquidity on Binance Exchange so that would help for trading NCASH/BTC or NCASH/ETH pairs. However, you can also buy from other different exchanges listed in Coinmarketcap.

Categories
Crypto News Initial Coin Offering Market Analysis Trading

Hard Protocol Breakout Analysis – HARD Gains +21% in a Day on Binance Launchpad

After the launch of Hard Protocol on Binance Launchpad, HARD was trading sideways with strong buying volume and took a breakout today with +21% gains. Let’s take a quick look at HARD, price analysis, and possible reasons for the recent breakout.

What is Hard Protocol?

HARD Protocol is a decentralized money market built on Kava, enabling the lending and borrowing of cross-chain assets. HARD Protocol supports supply-side deposits for BTC, XRP, BNB, BUSD, and USDX. The platform will allow overcollateralized borrowing for supported assets.

HARD Quick Stats

SYMBOL:HARD
Global rank:289
Market cap:$43,643,209 AUD
Current price:$1.23 AUD
All-time high price:$1.59 AUD
1 day:+21.2%
7 day:+56.7%
1 year:+78.3%

HARD Price Analysis

At the time of writing, HARD is ranked 289th cryptocurrency globally and the current price is $1.23 AUD with an All-time +78.3% increase since the launch of its ICO at Binance Launchpad. Have a look at the chart below for price analysis.

Source: TradingView

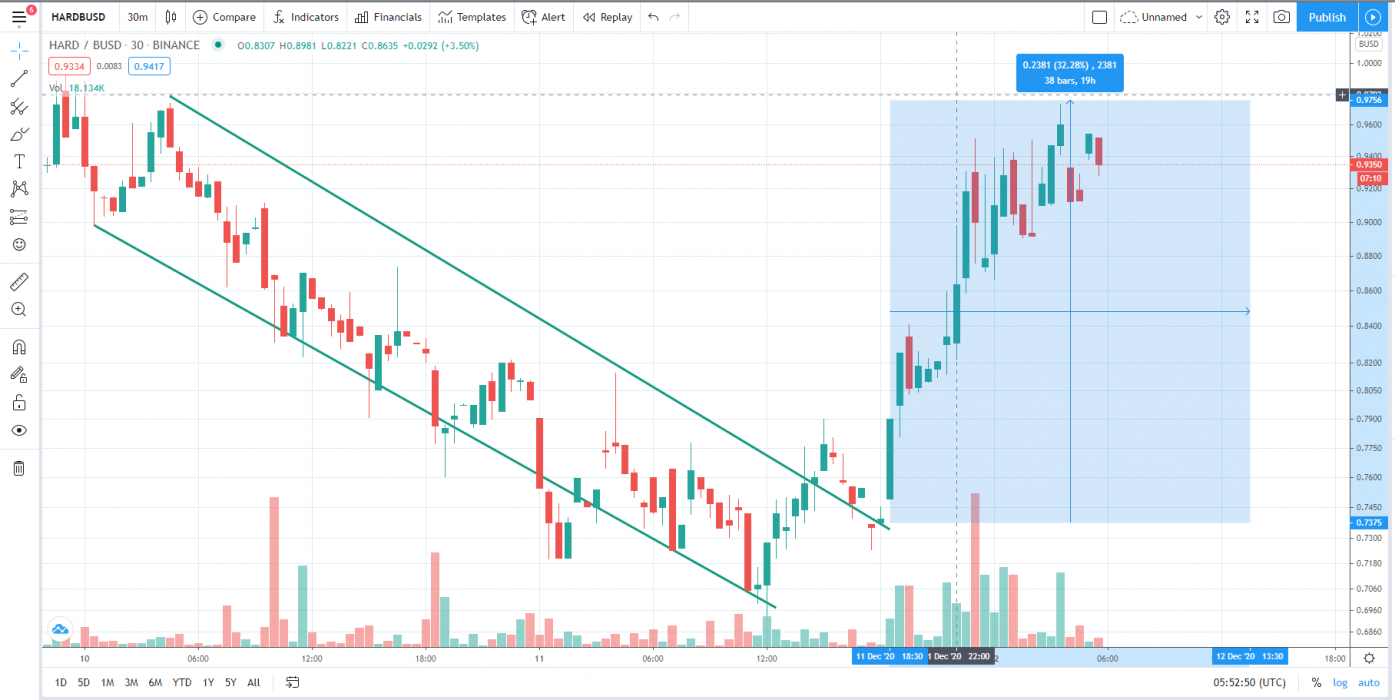
After the launch of HARD on Binance Launchpad, It pumped up to $3.95 AUD having +296% gains in just a few hours and the initial opening price of HARD was $0.83 AUD at Binance Exchange with many different trading pairs like HARD/BTC, HARD/BUSD, and HARD/USDT.

Currently, HARD is trading at $1.23 AUD price levels after breaking out the falling wedge pattern in its sideways trend & now HARD is heading towards its all-time high price facing some previous weekly resistances.

What do the technical indicators say?

The HARD TradingView indicators (on the 1 day) mainly indicate HARD as a strong buy, except the Oscillators which indicate HARD as a buy.

So Why did HARD Breakout?

After the opening at Binance Launchpad, mostly ICO’s pumps after going live on exchange for trade and, the recent rise in Bitcoin over 100% since the halving in May and then the suggested start of the Altcoin season could have contributed to the recent breakout. It could also be contributed to some recent news of Hard Margin Trading on Binance.

Recent HARD News & Events:

Where to Buy or Trade HARD?

Hard Protocol has the highest liquidity on Binance Exchange so that would help for trading HARD/USDT or HARD/BTC pairs. However, you can also buy from other different exchanges listed in Coinmarketcap.

Categories
Crypto News Market Analysis Trading

Cover Protocol Breakout Analysis – Cover Pumps +42% in a Single Day

Cover is trading in active uptrend here like many other altcoins. The Cryptocurrency Cover Protocol just went up +42% in a single day and surges over +126% in a week.

What is COVER?

COVER Protocol provides peer to peer coverage with fungible tokens. It lets the market set coverage prices as opposed to a bonding curve. COVER Protocol allows DeFi users to be protected against smart contract risk. It stabilizes the turbulent DeFi space by instilling confidence and trust between protocols and their users. By bridging the gap between decentralized finance and traditional finance, COVER Protocol will open the doors of DeFi to all investors.

COVER Quick Stats

SYMBOL:COVER
Global rank:264
Market cap:$67,431,440 AUD
Current price:$1,500 AUD
All time high price:$1,813 AUD
1 day:+42.5%
7 day:+126.4%
1 year:+152.7%

COVER Price Analysis

At the time of writing, Cover is ranked 264th cryptocurrency globally and the current price is $1,500 AUD. This is a +126.4% increase since 4th December 2020 (7 days ago) as shown in the chart below.

Source: TradingView

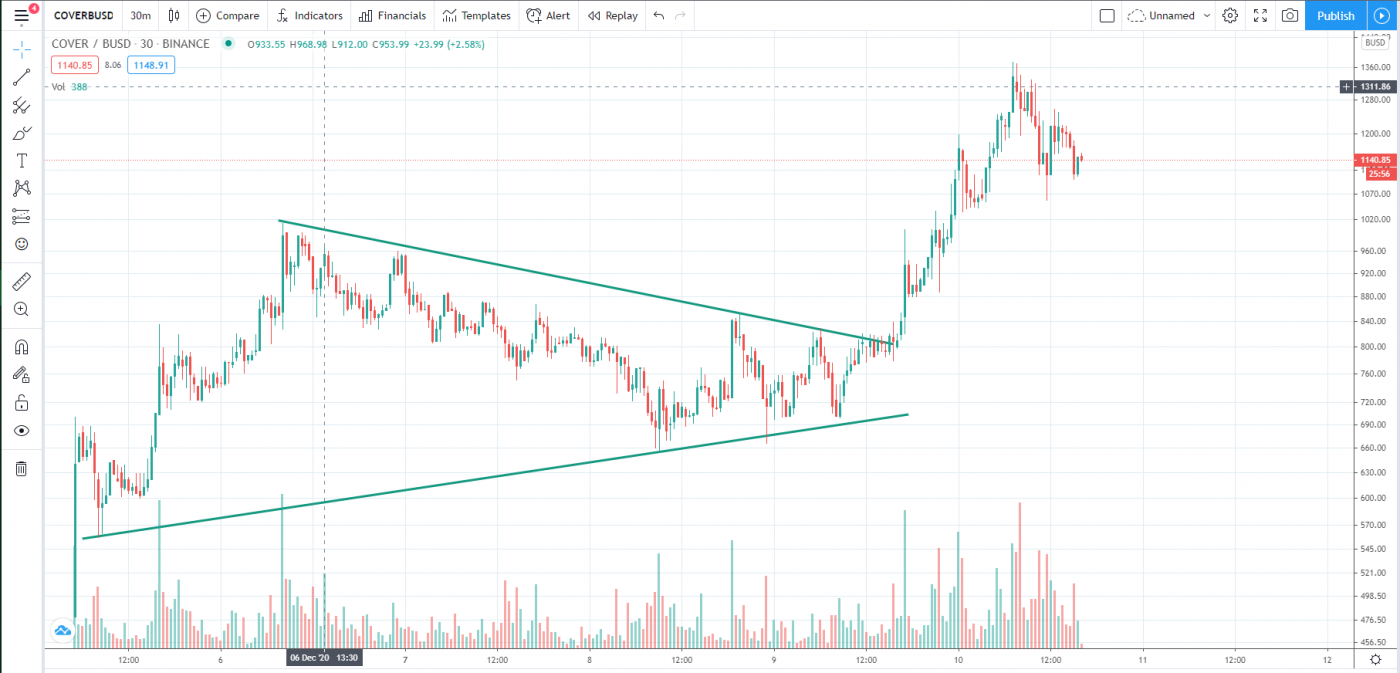
After looking at the above 30-Minute candle chart, we can clearly see that Cover was trading inside the falling wedge pattern on the COVER/BUSD pair. The first resistance was on the $1250 AUD price levels which COVER broke with a strong bullish trend buying volume and is now heading towards the All-time high price. Seeing that many altcoins are bearish today but COVER is likely to continue to increase.

“The falling wedge pattern is a continuation pattern formed when price bounces between two downward slopings, converging trendlines. It is considered a bullish chart formation but can indicate both reversal and continuation patterns – depending on where it appears in the trend”

What do the Technical indicators say?

The  Cover TradingView indicators (on the 1 day) mainly indicate COVER as a Neutral.

So Why did Civic Breakout?

The recent rise in Bitcoin over 100% since the halving in May and then the suggested start of the Altcoin season could have contributed to the recent breakout. Another reason could be the whales, secretly stacking up COVER to their portfolio for this Altcoins rally. It could also be contributed to some of the recent news having Initial Implementation of Creame V2 & Cover.

Recent COVER News & Events:

Where to Buy or Trade Cover?

Cover has the highest liquidity on Binance Exchange so that would help for trading COVER/BUSD or COVER/ETH pairs. However, if you’re just looking at buying some quick and hodling then Swyftx Exchange is a popular choice in Australia.


Categories
Crypto News Market Analysis Trading

WING Breakout Analysis – Parabolic Breakout on WING with +45% Gains in a Day

WING is trading in uptrend here like many other altcoins. The Cryptocurrency WING just went up +45% in a single day by breaking a Descending triangle with strong buying volume and surges over +81% in a week.

What is WING?

Wing is described to be a credit-based, cross-chain DeFi lending platform dedicated to crypto-asset lending and cross-chain interactions between DeFi products. The project’s decentralized governance model and risk control mechanism are described to promote a mutually beneficial relationship between borrowers, creditors, and guarantors. Wing has also developed a credit evaluation module as a showcase example of credit-based decentralized lending.

WING Quick Stats

SYMBOL:WING
Global rank:486
Market cap:$16,560,710 AUD
Current price:$26.35 AUD 
All time high price:$188.29 AUD
1 day:+45.4%
7 day:+81.70%
1 year:+129.34%

WING Price Analysis

At the time of writing, WING is ranked 486th cryptocurrency globally and the current price is $26.35 AUD. This is a +81.70% increase since 3rd December 2020 (7 days ago) as shown in the chart below.

Source: TradingView

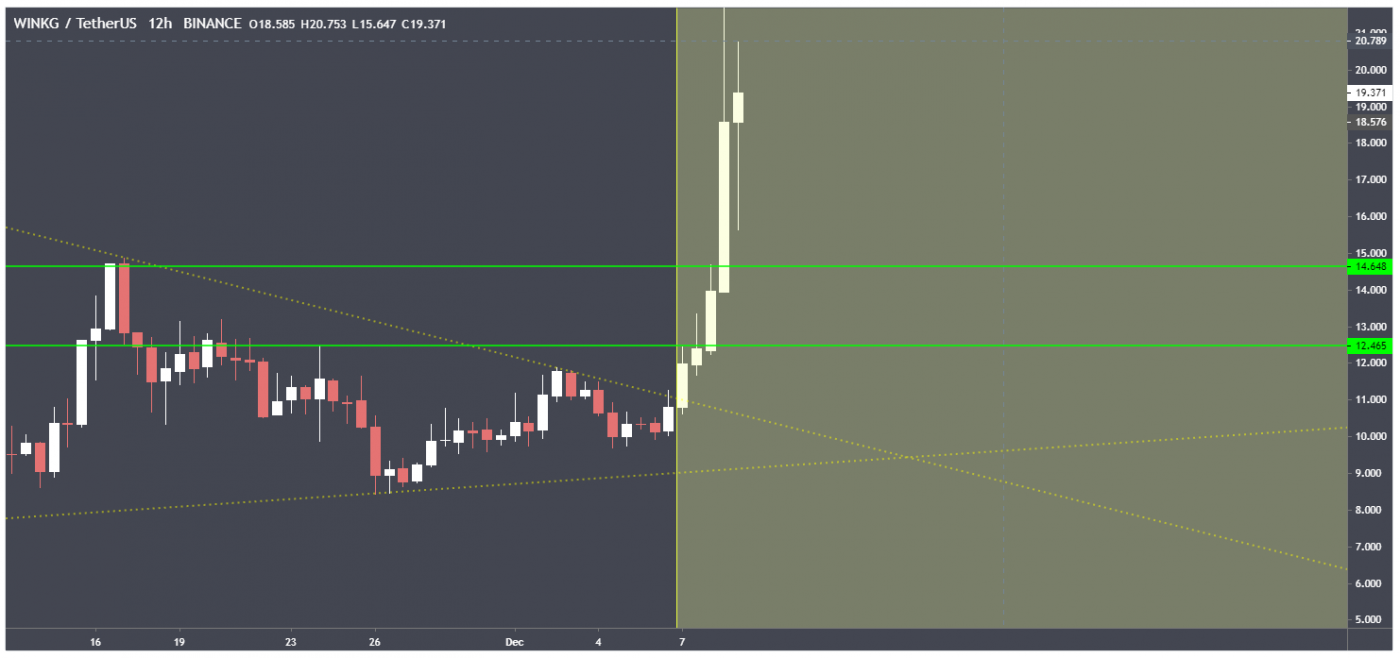
If we see the above 12-hour candle chart, WING just bounced back from its support levels of $15.35 AUD and took a strong breakout from Descending Triangle within the next resistance which was at $18.61 AUD. The line is acting as a support level for this Descending triangle trend.

“A descending triangle is a bearish chart pattern used in technical analysis that is created by drawing one trend line that connects a series of lower highs and a second horizontal trend line that connects a series of lows”

Source: TradingView

What do the technical indicators say?

The WING TradingView indicators (on the 1 day) mainly indicate WING as a buy, except the Oscillators which indicate WING as a neutral.

So Why did WING Breakout?

The recent rise in Bitcoin over 100% since the halving in May and then the suggested start of the Altcoin season could have contributed to the recent breakout. It could also be contributed to some of the recent events of WING Inclusive-Pool.

Recent WING News & Events:

Where to Buy or Trade WING?

WING has the highest liquidity on Binance Exchange so that would help for trading WING/USDT or WING/BTC pairs. However, if you’re just looking at buying some quick and hodling then Swyftx Exchange is a popular choice in Australia.