Categories
Crypto News Market Analysis Ontology Trading

Ontology Gas ONG Breakout Analysis – Parabolic Breakout on ONG Pumps with +206% gains in a Single Day

Ontology ONG just pumped up to +206% in the last few hours with a strong breakout on Binance & other Exchanges. Let’s take a quick look at ONG, price analysis, and possible reasons for the recent breakout.

What is Ontology?

Ontology is a new high-performance public blockchain project & a distributed trust collaboration platform. It provides new high-performance public blockchains that include a series of complete distributed ledgers and smart contract systems.

Ontology Quick Stats

SYMBOL:ONG
Global rank:42
Market cap:$465,820,527
Current price:$0.3420 AUD
All time high price:$5.98 AUD
1 day:+206.4%
7 day:+210.70%
1 year:+234.74%

Ontology ONG Price Analysis

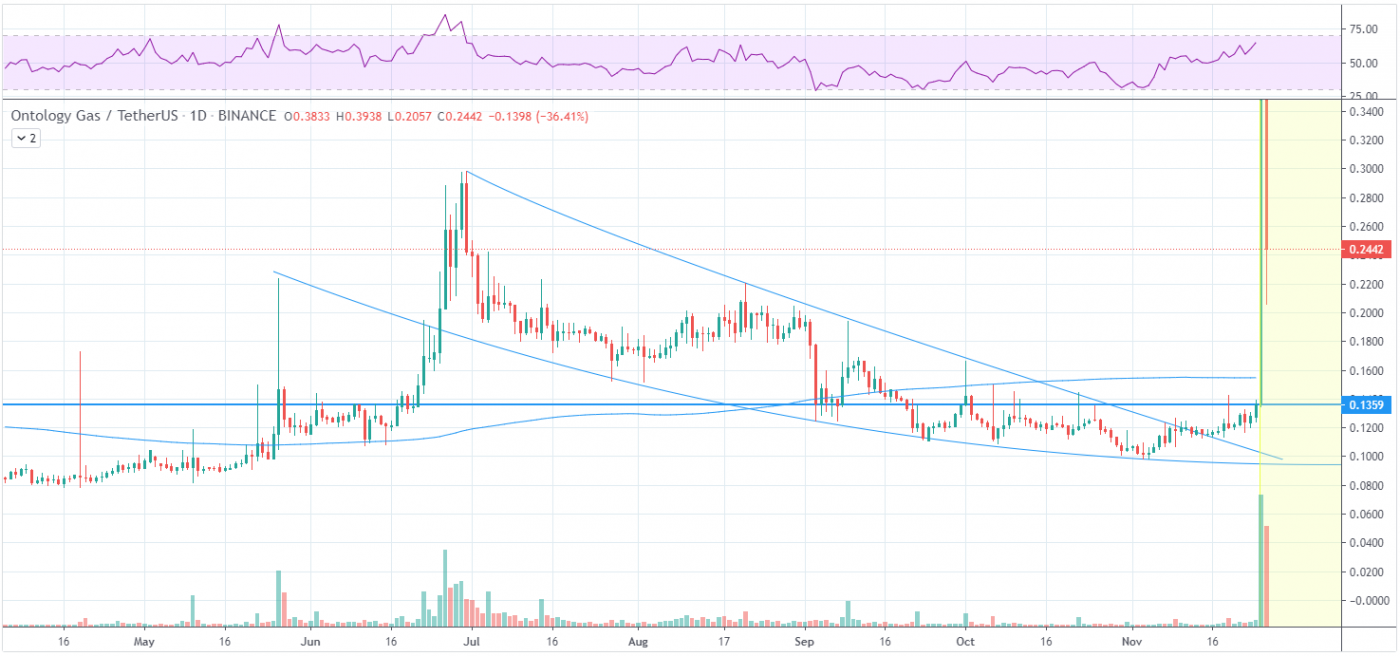
At the time of writing, ONG is ranked 42nd cryptocurrency globally and the current price is $0.34 AUD. This is a +210% increase since 20 November 2020 (7 days ago) as shown in the chart below.
Source: TradingView

If we see the above 1-day candle chart, ONG was trading inside the falling wedge at the $0.1245 AUD price levels. Ontology Gas just did an awesome breakout by breaking all the major resistances in a single day and is now currently trading at $0.2452 AUD.
Source: TradingView

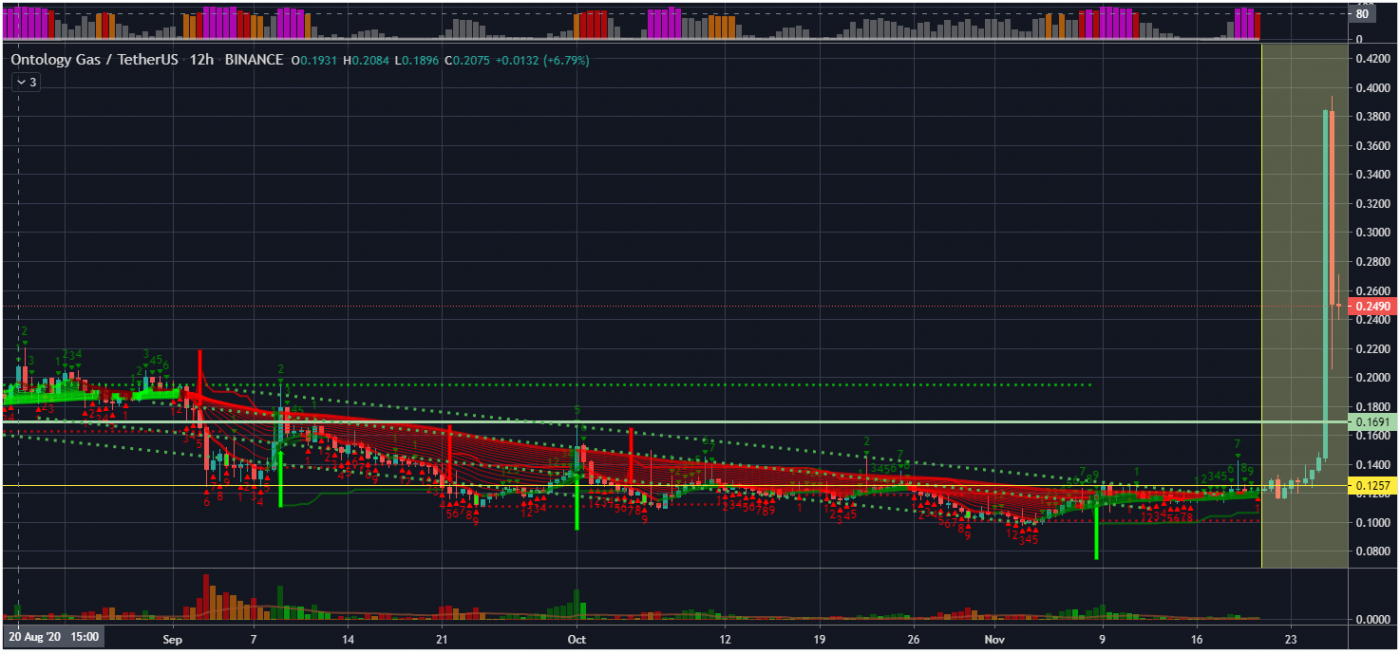
The price gained pace above the $0.30 AUD price levels and the 100-day simple moving average. It even broke the $0.40 AUD price level and traded to a new multi-month high at $0.4150 AUD. Ontology ONG price is currently correcting lower and trading below $0.2500 AUD.

What do the technical indicators say?

The Ontology ONG TradingView indicators (on the 1 day) mainly indicate ONG as a buy, except the Moving Averages which indicate ONG as a strong buy.

So Why did ONG Breakout?

The recent rise in Bitcoin over 100% since the halving in May and then the suggested start of the Altcoin season could have contributed to the recent breakout. Another big reason could be the whales secretly buying this coin for their portfolio which might give them huge profits in the next Altcoin rally. It could also be contributed to some of the recent events & news.

Recent Ontology News & Events:

Where to Buy or Trade Ontology?

ONG has the highest liquidity on Binance Exchange so that would help for trading ONG/USDT or ONG/BTC pairs. However, if you’re just looking at buying some quick and hodling then Swyftx Exchange is a popular choice in Australia.

Categories
Crypto News Market Analysis NEM Trading

NEM Breakout Analysis – XEM Pumps +57.73% in a Week by Breaking Falling Wedge Pattern

NEM was squeezing inside the falling wedge pattern on a 1-day candle chart, it just went up over +57% in the last 7 days. Let’s take a quick look at NEM, price analysis, and possible reasons for the recent breakout.

What is NEM?

NEM is a cryptocurrency and blockchain platform for smart digital assets. The main new feature in NEM includes Proof of Importance (POI), a new consensus algorithm, and a smart asset system.

NEM Quick Stats

SYMBOL:XEM
Global rank:20
Market cap:$2,390,016,420 AUD
Current price:$0.2655 AUD
All time high price:$2.85 AUD
1 day:+27.4%
7 day:+57.73%
1 year:+452.58%

NEM Price Analysis

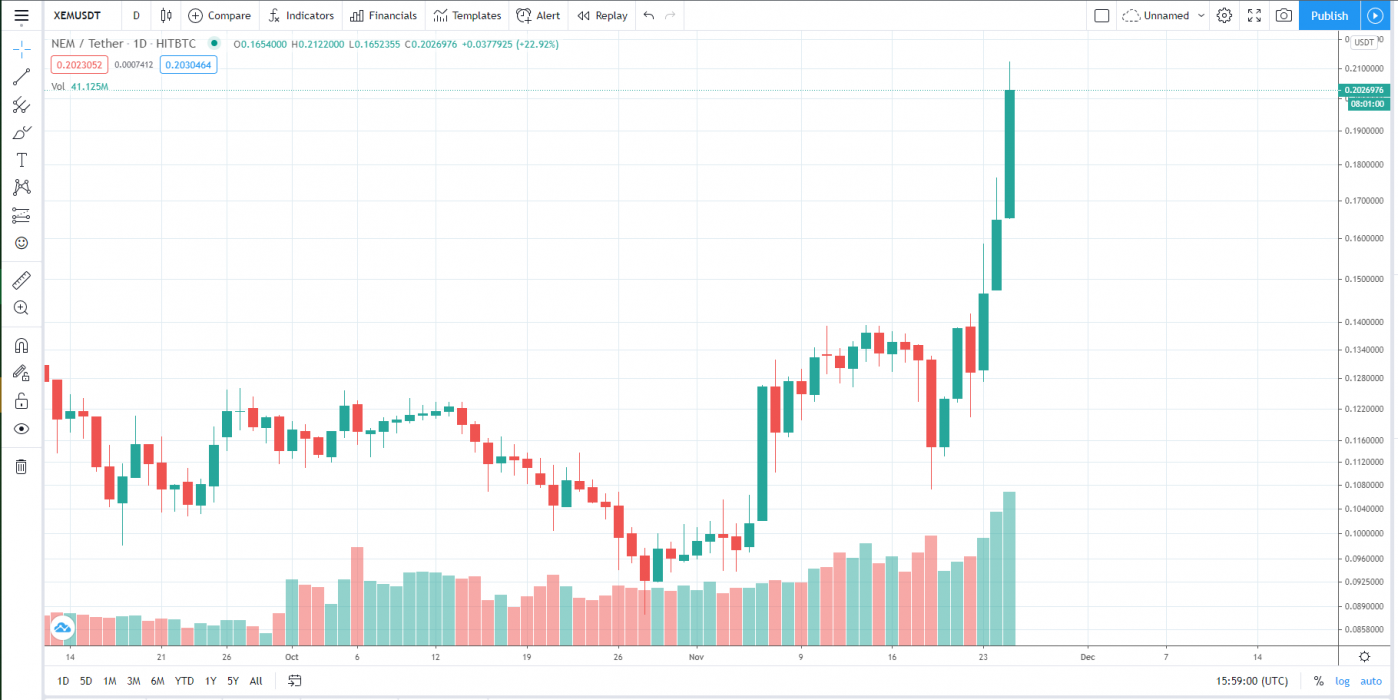
At the time of writing, NEM is ranked 20th cryptocurrency globally and the current price is $0.2655 AUD. This is a +57.73% increase since 19 November 2020 (7 days ago) as shown in the chart below.

Source: TradingView

After looking at the above 1-day candle chart, we can clearly see that NEM was trading inside the falling wedge pattern on XEM/BTC pair. The first resistance was on the $0.1756 AUD price level which NEM broke with a strong bullish trend buying volume and is now heading towards the next resistance at $0.2755 AUD & $0.3155 AUD respectively.

“The falling wedge pattern is a continuation pattern formed when price bounces between two downward slopings, converging trendlines. It is considered a bullish chart formation but can indicate both reversal and continuation patterns – depending on where it appears in the trend”

Source: TradingView

If we zoom out and take a look at the price over the past few days or so, we can see the recent breakout more clearly, the line is almost vertical which looks insane.

What do the Technical indicators say?

The  NEM XEM TradingView indicators (on the 1 day) mainly indicate NEM as a buy, except the Oscillators which indicate NEM as a neutral.

So Why did NEM Breakout?

The recent rise in Bitcoin over 100% since the halving in May and then the suggested start of the Altcoin season could have contributed to the recent breakout. Another reason could be the whales, secretly stacking up NEM to their portfolio for this Altcoin rally. It could also be contributed to some of the recent news for the upcoming Mainnet Launch of NEM and of course, they are giving 30% off on BlackFriday.

Recent NEM News & Events:

Where to Buy or Trade NEM XEM?

NEM has the highest liquidity on Binance Exchange so that would help for trading NEM/USDT or NEM/BTC pairs. However, if you’re just looking at buying some quick and hodling then Swyftx Exchange is a popular choice in Australia.
Categories
Crypto News Market Analysis Trading

Horizen ZEN Breakout Analysis – ZEN Pumps +139% in a Week with Strong Bullish Trend

Horizen ZEN is flipping on a 1-day candle chart, ZEN has grown by a massive 139% in the past week. Let’s take a quick look at ZEN, price analysis, and possible reasons for the recent breakout.

What is Horizen?

Horizen is an inclusive ecosystem where everyone is empowered and rewarded for their contributions. Horizen’s massively scalable platform enables businesses and developers to quickly and affordably create their own public or private blockchains on the largest node network in the industry. Horizen’s Sidechain SDK provides all necessary components for easy and fast deployment of a fully customizable blockchain.

Horizen Quick Stats

SYMBOL:ZEN
Global rank:85
Market cap:$199,323,485 AUD
Current price:$18.95 AUD
All time high price:$91.50 AUD
1 day:+10.4%
7 day:+139.55%
1 year:+203.74%

Horizen Price Analysis

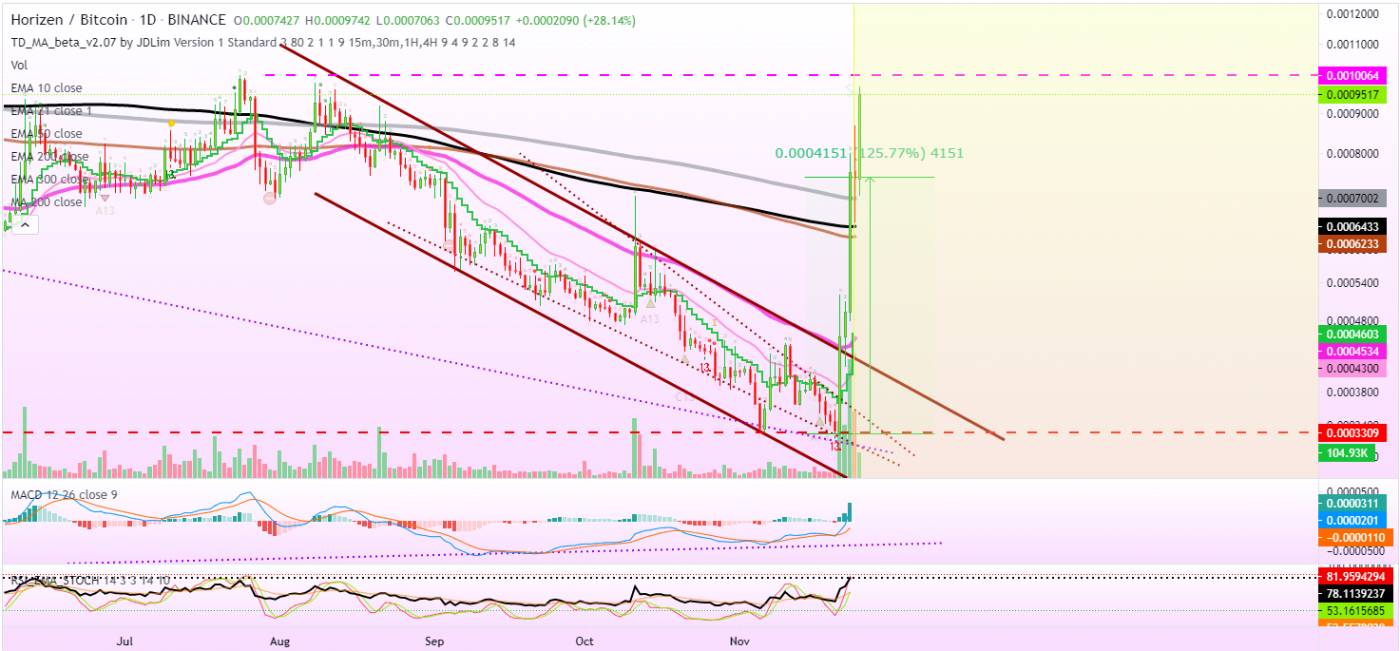
At the time of writing, ZEN is ranked 85th cryptocurrency globally and the current price is $18.95 AUD. This is a +139% increase since 19 November 2020 (7 days ago) as shown in the chart below.

Source: TradingView

In the past week, there was a strong rise in Bitcoin, Ethereum, and Ripple. As a result, Horizen ZEN also formed strong support near $6.56 before starting a fresh increase against the AUD.

Here we also have the “W” pattern with a higher low just as looking at it before starting a strong increase, there was a break above a crucial contracting triangle with resistance near $11.65 on the daily chart of the ZEN/AUD. The pair gained pace above the $14.12 and $15.70 resistance levels.

“W pattern is a price pattern, also called Double Bottom. This pattern, when drawn it looks like the W and this is why it is called as W pattern. Sometimes patterns look like W but it is not the exact W pattern and these patterns are called Semi-W patterns.”

Source: TradingView

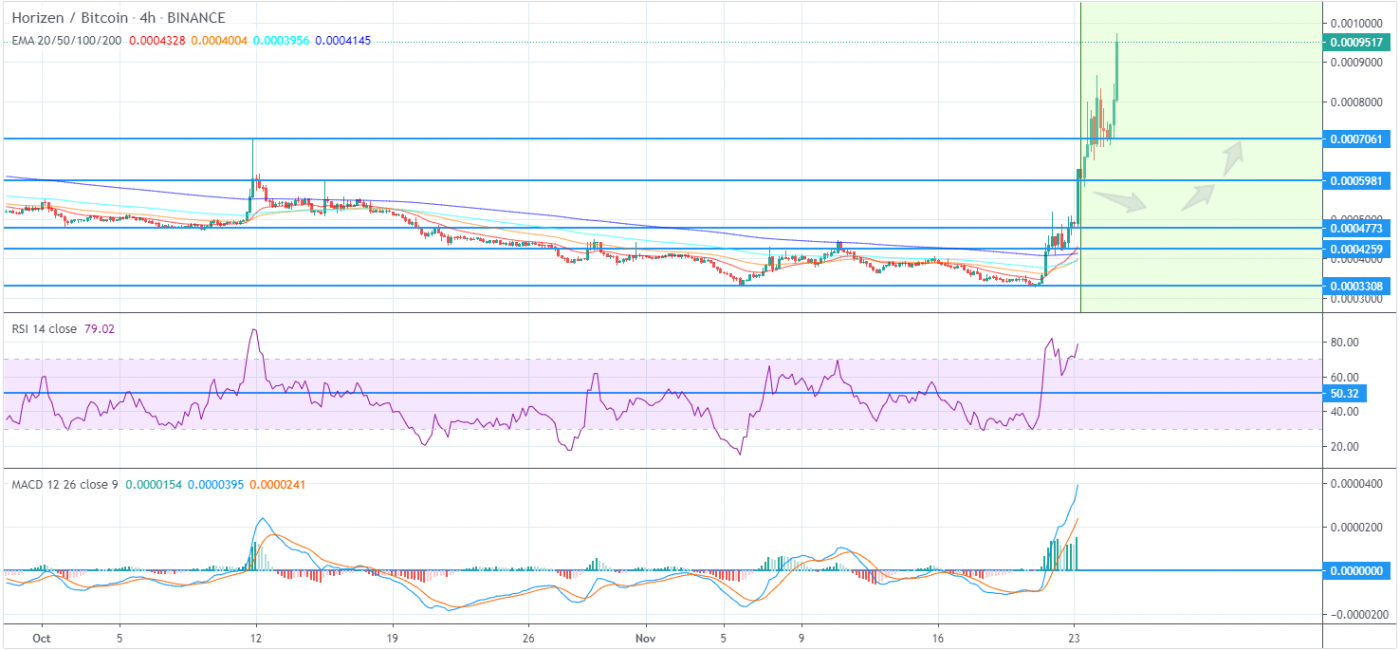
The price of ZEN gained pace by breaking above the 3rd major resistance of $15.12 AUD. If we see the above chart of ZEN/BTC pair on a 4-hour candle, it clearly shows the uptrend of Horizen ZEN has been started by joining the altcoins rally of 2020.

What do the technical indicators say?

The Horizen ZEN TradingView indicators (on the 1 day) mainly indicate ZEN as a buy, except the Oscillators which indicate ZEN as a neutral.

So Why did ZEN Breakout?

The recent rise in Bitcoin over 100% since the halving in May and then the suggested start of the Altcoin season could have contributed to the recent breakout. It could also be contributed to some of the recent events where the Horizen ZEN 2.0.22 Mainnet Fork is happening today expected around Nov 25 – Block 835968.

Recent Horizen News & Events:

Where to Buy or Trade Horizen?

ZEN has the highest liquidity on Binance Exchange so that would help for trading ZEN/USDT or ZEN/BTC pairs. However, if you’re just looking at buying some quick and hodling then Swyftx Exchange is a popular choice in Australia.

Categories
Crypto News

Lithuania Authorities Bag AU$10 Million After Selling Confiscated Cryptos

The government of Lithuania bagged millions of dollars on Tuesday after selling digital currencies confiscated by the law enforcement agencies in the country. The development today marks the first cryptocurrency sale by the government. The authorities failed to disclose further how the cryptos were sold – whether it was conducted under auction. However, they admitted that the process wasn’t easy, especially during conversion to fiat currency.

According to the report, Lithuania State Tax Inspectorate (STI) was in charge of the sale. The country’s tax authority reportedly gained about EUR 6.4 million (about AU$10.3 million) from the sales of the digital currencies, which includes Bitcoin (BTC), Ethereum (ETH), and the privacy coin, Monero (XMR). The proceeds have been added to the state’s budget, as per DELFI, a local news outlet.

Lithuania Gained Over AU$10 Million

Speaking about the sale, the representative for the State Tax Inspectorate, Irina Gavrilova, said the process was quite challenging. The conversion of the digital currencies to Euros nearly took 24 hours before completion. This boils down to the fact that it was the first time the agency dealt with such a situation. Gavrilova added in the report:

“The whole process for the tax administrator was new, starting with the taking over of the confiscated cryptocurrency and ending with its implementation.”

According to DELFI, the digital currencies were seized by the law enforcement agencies in February this year. There weren’t any more details regarding how and why the cryptocurrencies were confiscated, however, it’s worth mentioning that the country is one of the jurisdictions in Europe with a clear regulation for the digital currency space. Recently, the central bank announced plans to launch a digital collector coin known as “LBCOINs.”

In a separate development, another European region, Belfast, revealed plans to auction about 47 Bitcoin, which is worth about AU$1.2 million in today’s price at AU$26,321.

Categories
Crypto News Market Analysis Trading Verge

Verge XVG Breakout Analysis – XVG Pumps +65% in a Single Day

Verge XVG – Cryptocurrency is widely known as the “King Altcoin of 2017 Bullrun”, gave massive gains in that Altcoins season and, today XVG pumped +65% in a single day by just making its new all-time low & bouncing back from the support to join the Altcoins rally of 2020. Let’s take a quick look at XVG, price analysis, and possible reasons for the recent breakout.

What is Verge?

Verge is an open-source, decentralized cryptocurrency that claims to offer completely anonymous transactions by obfuscating the location and IP address of the transacting participants using TOR and I2P network layers. Verge trades on leading cryptocurrency exchanges with the symbol XVG.

Verge Quick Stats

SYMBOL:XVG
Global rank:93
Market cap:$156,663,352 AUD
Current price:$0.0109 AUD
All time high price:$0.410255 AUD
1 day:+65.4%
7 day:+75.70%
1 year:+112.74%

Verge Price Analysis

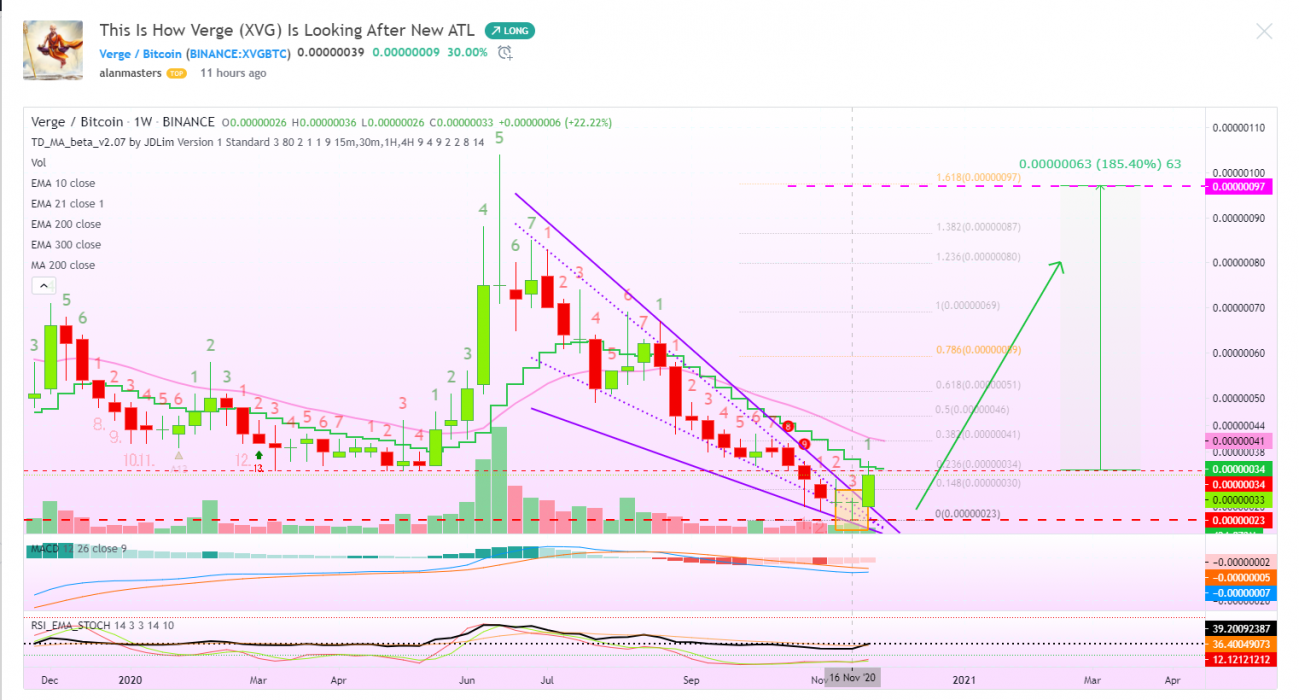
At the time of writing, XVG is ranked 93rd cryptocurrency globally and the current price is $0.01095 AUD. This is a +75.7% increase since 18 November 2020 (7 days ago) as shown in the chart below with a 1-week candle.

Source: TradingView

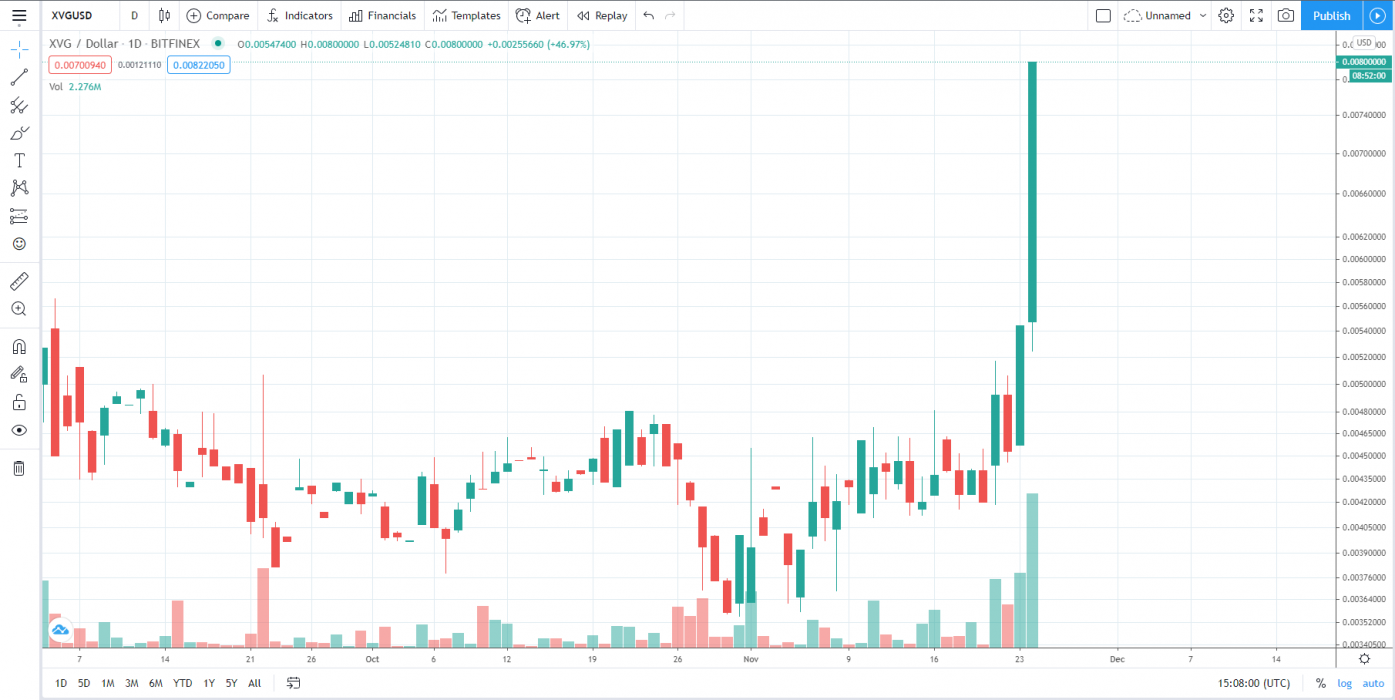
Verge XVG just bounced back from its support by making it’s new all-time-low price levels. By looking at this chart, you can see the bottom has been hit and once you hit bottom, the only place left to go is up. Looking at the weekly/long-term chart, we can notice another bullish signal.

Source: TradingView

What do the Technical indicators say?

The Verge XVG TradingView indicators (on the 1 day) mainly indicate XVG as a buy, except the Oscillators which indicate XVG as a neutral.

So Why did XVG Breakout?

The recent rise in Bitcoin over 100% since the halving in May and then the suggested start of the Altcoin season could have contributed to the recent breakout. Another reason could be the whales, secretly stacking up XVG to their portfolio for this Altcoin rally. It could also be contributed to some of the recent news from the Verge about NowPayments & Black Friday Discounts.

Recent Verge News & Events:

Where to Buy or Trade Verge XVG?

XVG has the highest liquidity on Binance Exchange so that would help for trading XVG/USDT or XVG/BTC pairs. However, if you’re just looking at buying some quick and hodling then Swyftx Exchange is a popular choice in Australia.

Categories
Crypto News Market Analysis Stellar Trading

Stellar XLM Breakout Analysis – Parabolic Breakout on XLM with +103% gains in a Week

Stellar XLM is flipping on a 4-hour candle chart, XLM just went up over +103% from the past week. Let’s take a quick look at XLM, price analysis, and possible reasons for the recent breakout.

What is Stellar?

Stellar is an open platform for building financial products that connect people everywhere. Stellar blockchain enables near-instant payments, with almost zero fees, and a smart contract platform to create a digital asset economy.

Stellar Quick Stats

SYMBOL:XLM
Global rank:12
Market cap:$4,906,911,142 AUD
Current price:$0.2327 AUD
All time high price:$1.28 AUD
1 day:+62.4%
7 day:+103.70%
1 year:+193.74%

Stellar Price Analysis

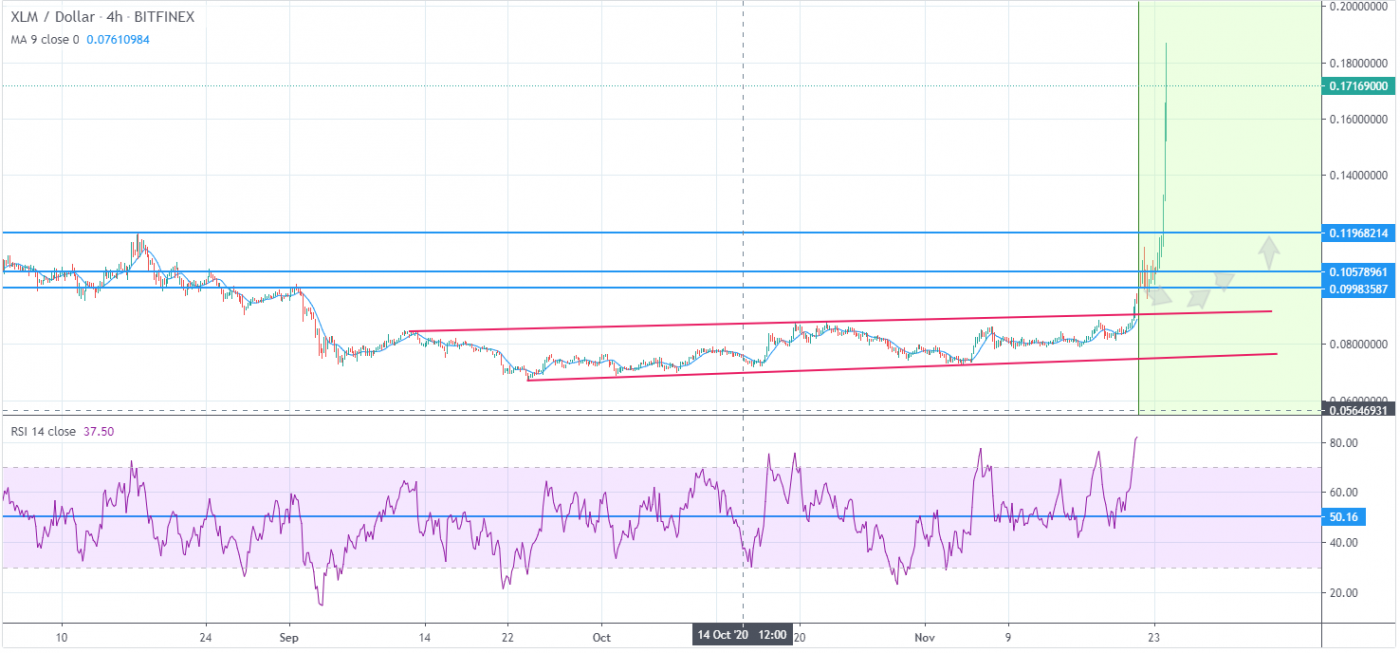
At the time of writing, XLM is ranked 12th cryptocurrency globally and the current price is $0.23 AUD. This is a +103% increase since 18 November 2020 (7 days ago) as shown in the chart below.

Source: TradingView

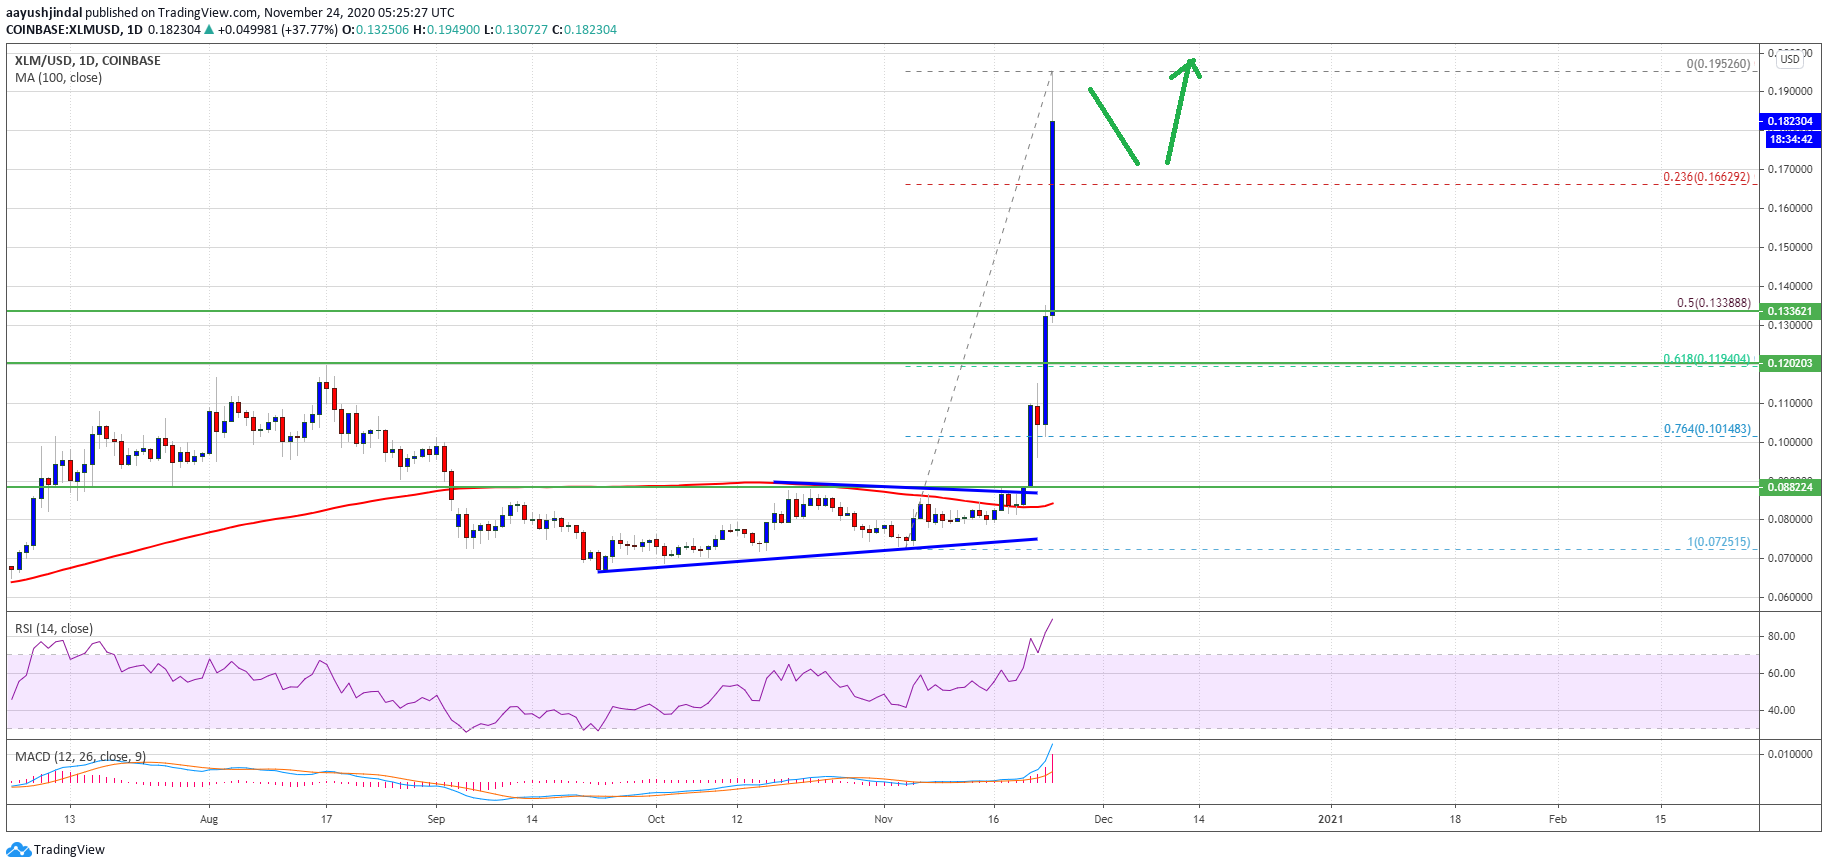
In the past week, there was a strong rise in Bitcoin, Ethereum, and Ripple. As a result, stellar (XLM) also formed strong support near $0.096 before starting a fresh increase against the AUD.

To start a strong increase, there was a break above a crucial contracting triangle with resistance near $0.0882 on the daily chart of the XLM/AUD. The pair gained pace above the $0.1250 and $0.1470 resistance levels.

Stellar (XLM)
Source: TradingView

The price gained pace above the $0.1700 level and the 100-day simple moving average. It even broke the $0.2000 level and traded to a new multi-month high at $0.2352. Stellar’s XLM price is currently correcting lower and trading below $0.2400 AUD.

More Upsides in XLM

If the XLM price remains elevated, there are chances of more upsides above $0.2300. The next key resistance is near the $0.2550 level, followed by $0.2400 AUD.

A clear break above the $0.2350 resistance level may perhaps open the doors for more gains above $0.2450. The next major hurdle for the bulls could be near the $0.2600 AUD level.

What do the technical indicators say?

The Stellar XLM TradingView indicators (on the 1 day) mainly indicate XLM as a buy, except the Oscillators which indicate XLM as a neutral.

So Why did XLM breakout?

The recent rise in Bitcoin over 100% since the halving in May and then the suggested start of the Altcoin season could have contributed to the recent breakout. It could also be contributed to some of the recent events where the Stellar anchor Settle Network is issuing two new stablecoins, ARST and BRLT.

Recent Stellar News & Events:

Where to Buy or Trade Stellar?

XLM has highest liquidity on Binance Exchange so that would help for trading XLM/USDT or XLM/BTC pairs. However, if you’re just looking at buying some quick and hodling then Swyftx Exchange is a popular choice in Australia.
Categories
Bitcoin Crypto News Cryptocurrencies

The Wall Street Journal Discusses Bitcoin And The Adoption Of Cryptocurrencies By Institutional Investors

It has been an exciting two months for the cryptocurrency world, especially for Bitcoin. Since it rallied 80 % in just two months, it has settled new market capitalization records and capturing a lot of mainstream media attention. Now BTC lands on the homepage of The Wall Street Journal (WSJ).

In a new report, WSJ discusses the embrace of Bitcoin among institutional traders — also highlighting how BTC gained the attention of famous multimillionaires investors, like Paul Tudor Jones and Stan Druckenmiller — both speaking highly positively about Bitcoin over the past few months.

The Wall Street Journal emphasizes how retail investors, hedge funds, and other companies are hungry for buying and holding cryptocurrency — especially BTC.

The Rapid Growth and Adoption of Bitcoin

More institutions and online financial services are embracing Bitcoin and other cryptocurrencies every day — giving them a big boost in their prices. But also making them more scarce: Grayscale, 3iQ, and ETC Group alone have acquired over 24,000 BTC. That’s roughly translated to $457.764.000,00 million.

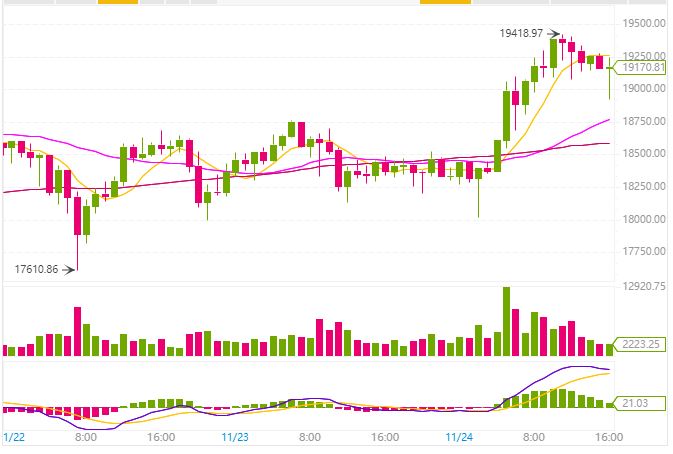
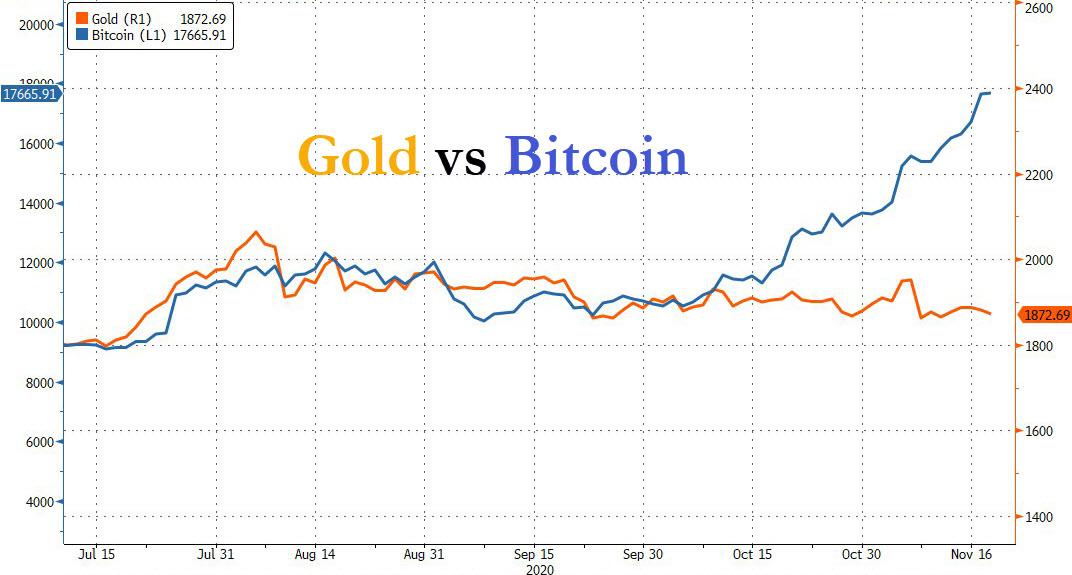
This week, BTC reached a level of USD 18,900 (25,700 AUD) on the daily chart, trading as high as 19,400 — prices that are rarely traded.

As more high-net-worth investors and financial institutions buy Bitcoin, BTC replaces gold as a store of value, breaking their correlation.

Gold vs Bitcoin correlation

Public figures like Dan Schulman, CEO of PayPal, also spoke about Bitcoin, stating his bullish position with BTC and how cryptocurrencies are moving away from being “just an asset“:

As paper money slowly dissipates and disappears from how people are using transactions, central banks especially on the retail side will need to replace paper money with forms of digital fiat currency.

Stated Schulman for CBNC.

PayPal made a considerable impact in the cryptocurrency world these past months — the company recently removed its waitlist for US residents to buy and hold crypto-assets — and together with Cash App, they have accumulated over 70 % of newly mined Bitcoins.

Categories
Australia Crypto News Cryptocurrencies Investing

Pendal Group Joins The Big League Financiers Hedging Their Bets On Bitcoin

The Pendal Group – a Sydney-based investment management firm among the biggest in Australia – has recently come out in support of Bitcoin, lauding the asset’s qualities, especially when compared to government bonds.

No Longer An Asset For “The Tinfoil Brigade”

Vimar Gor – the head of Bond, Income, and Defensive Strategies at Pendal Group – iterated his support for Bitcoin and declared that the Pendal Group will be entering the crypto market via futures contracts.

In order to trade Bitcoin futures, the investment management firm is looking to join longstanding futures markets such as the CME Group Exchange and the Chicago Board Options Exchange (CBOE), among others.

In an interview for the Australian Financial Review, Vimar Gor went on to say that the currently ongoing COVID-19 pandemic has been a catalyst for greater market trends that have been around for a while – and that cryptocurrencies are in the right spot to profit from it. With official interest rates and bonds plummeting and large scale central bank QE programs doing the rounds, Vimar predicts that bond yields won’t be very fruitful in the foreseeable future.

Vimar then went on to explain that cryptocurrency has become the elephant in the room – or rather a cockroach in the room that you can’t really ignore anymore.

“Bitcoin is a cockroach that exists. They can’t ban it out of existence.

We think ultimately that government bonds will turn into a dead asset class, so we now have to imagine what it will be like for other assets classes when bonds are no longer relevant to hold in a portfolio.”

Contrary to notorious naysayers such as Peter Schiff, Vimar Gor sees a bright future for digital assets, owing to their finite supply and high demand.

Following the major investments into cryptocurrencies by companies like Square, Paypal, and now Pendal Group, it is not unlikely we will see more and more big-league financial companies hopping on the crypto train.

Categories
Cardano Crypto News Market Analysis Trading

Cardano Trading Analysis – ADA Performing Active Uptrend with +47% Gains in a Week.

Cardano ADA is in active uptrend here like many other altcoins are. The Cryptocurrency Cardano ADA just went up +15% in a single day and surges over +47% in a week.

What is Cardano ADA?

ADA is a token on a distributed computing platform that runs smart contracts, decentralized applications, side chains, multi-party computation, and metadata.

Cardano Quick Stats

SYMBOL:ADA
Global rank:9
Market cap:$6,521,127,429 AUD
Current price:$0.205990 AUD
All time high price:$1.81 AUD
1 day: +14.4%
7 day: +47.70%
1 year: +325.74%

Cardano Price Analysis

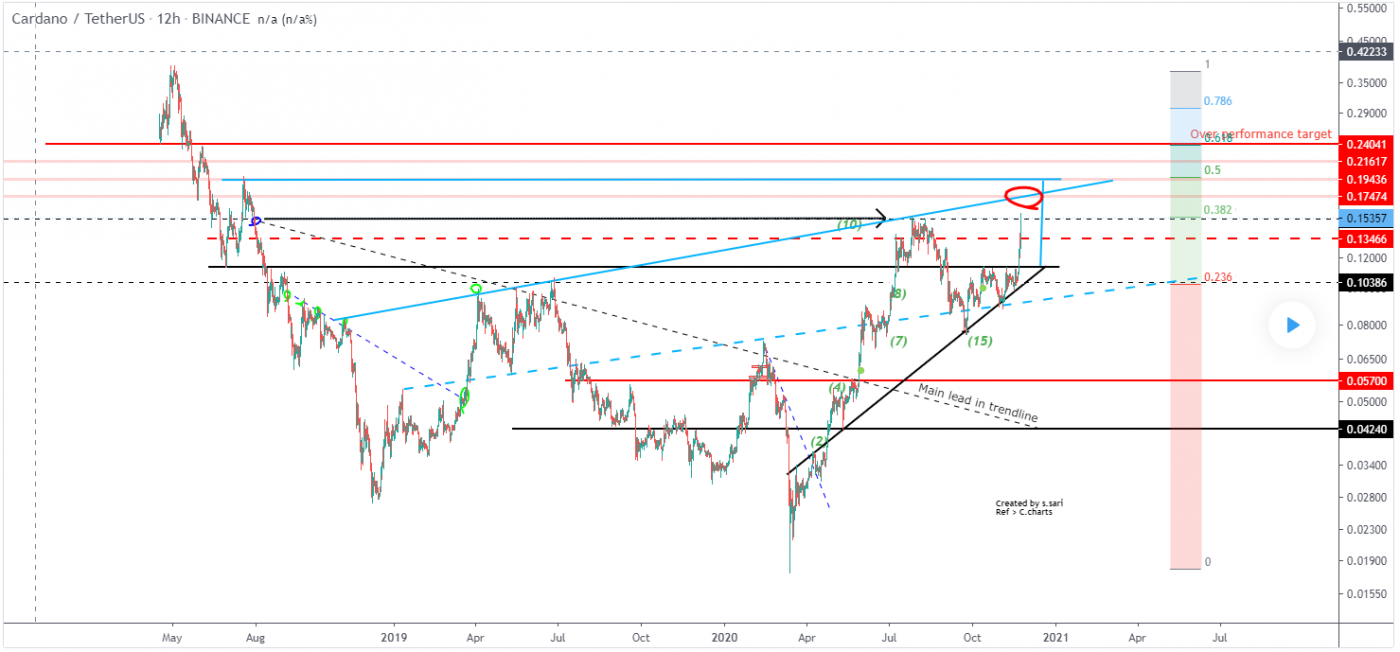
At the time of writing, ADA is ranked 9th cryptocurrency globally and the current price is $0.20 AUD. This is a +47% increase since 17 November 2020 (7 days ago) as shown in the chart below.

Source: TradingView

The target of this active trend is either this blue top trend line or the 0.5 fib level. Assuming if Cardano ADA breaks this double top, then it’s leaning towards a $0.173 price level, If Cardano ADA hits the 0.5 fib level, it might make a huge bullish structure, inverse H&S, and it most likely to retest that top blue trendline.

Fib is Fibonacci retracement levels & these are horizontal lines that indicate where support and resistance are likely to occur. They are based on Fibonacci numbers. Each level is associated with a percentage. The percentage is how much of a prior move the price has retraced.

Source: TradingView

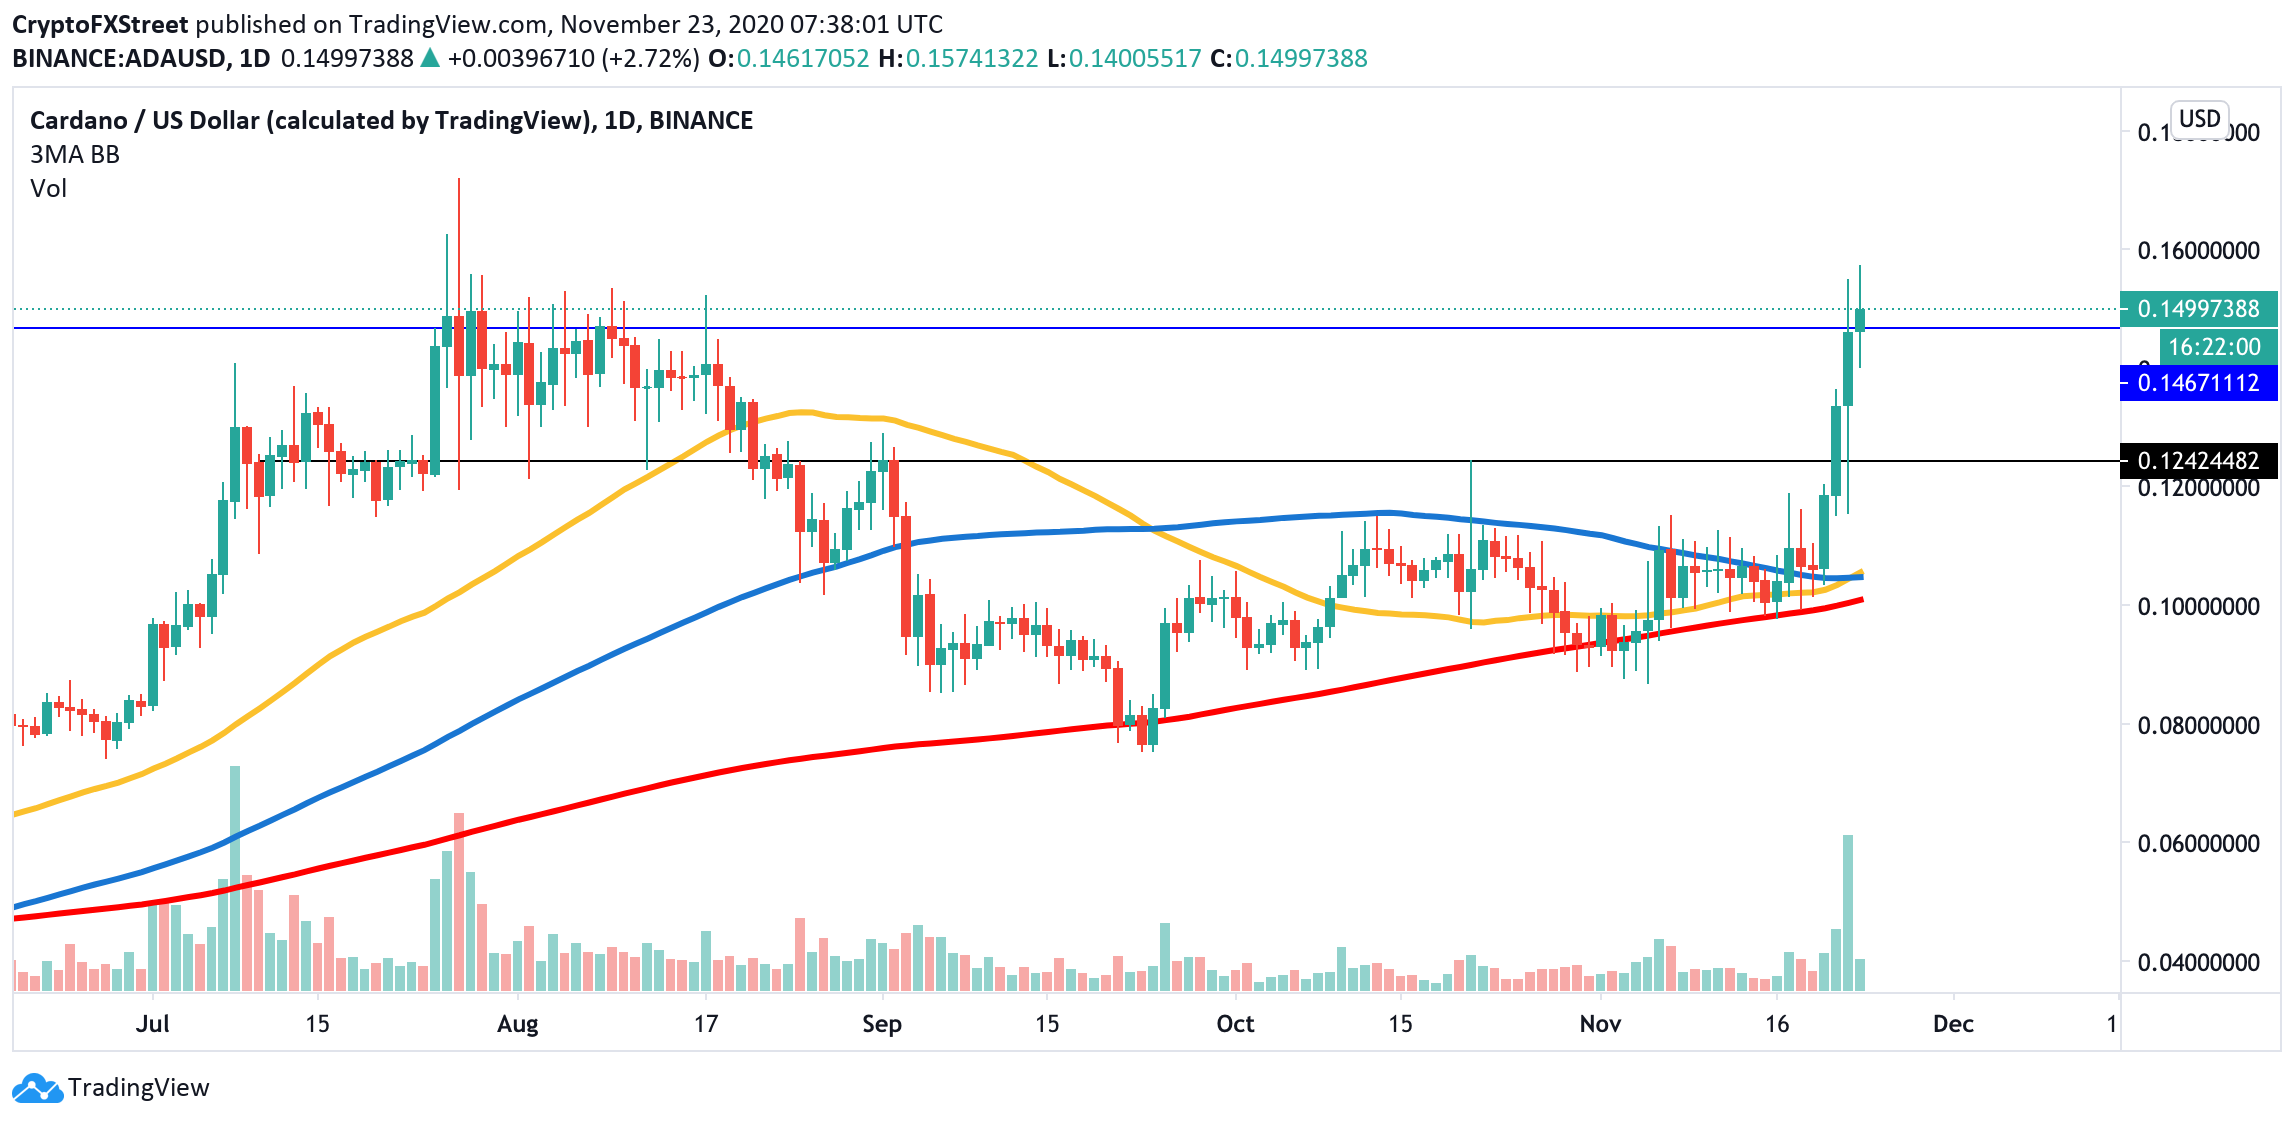
Despite the optimistic bullish scenario, the cryptocurrency market’s unpredictability means the bearish outlook cannot be disregarded. The charts show that the sell-off below $0.12 will speed up the correction and bring more sellers to the market. In this case, $0.1 will come into focus. This psychological barrier is reinforced by a combination of 50,100 and 200-day EMA.  a sustainable move below this area will invalidate the bullish scenario.

What do the technical indicators say?

The Cardano ADA TradingView indicators (on the 1 day) mainly indicate ADA as a buy, except the Oscillators which indicate ADA as a sell.

Cardano’s Network is on Fire

Cardano’s network growth gives additional credence to the bullish outlook. The number of new addresses doubled in the past few days and hit the highest level since the beginning of August. According to Intotheblock’s data, over 12,500 new addresses were created on Cardano’s blockchain on November 22 against 5,600 addresses on November 19. The growth coincides with the price increase and implies that the bullish momentum remains strong.

Recent ADA News & Events:

Where to Buy or Trade ADA?

ADA has the highest liquidity on Binance Exchange so that would help for trading ADA/USDT or ADA/BTC pairs. However, if you’re just looking at buying some quick and hodling then Swyftx Exchange is a popular choice in Australia.

Categories
Crypto News Market Analysis Ripple Trading

Breakout Analysis – XRP Pumps 69% in 7 days, here is why

The cryptocurrency XRP just went up over 69% in the past week. Let’s take a quick look at XRP, price analysis, and possible reasons for the recent breakout.

What is XRP?

Ripple (XRP) is one of the fastest and most scalable digital asset, enabling real-time global payments anywhere in the world.

XRP Price Analysis

At the time of writing, XRP has ranked the 3rd cryptocurrency globally and the current price is $0.6266 AUD. This is a +69% increase since 11 November 2020 (12 days ago) as shown in the chart below.

Source: TradingView

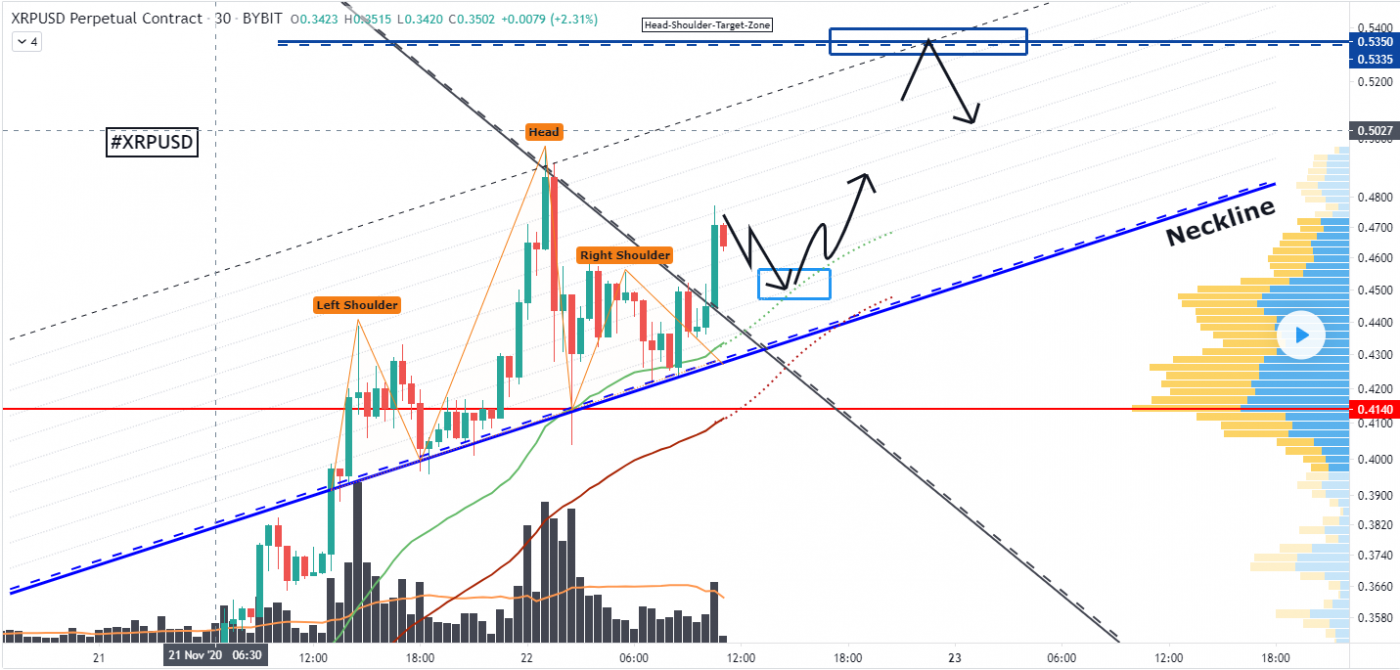
For now, XRPUSD has formed some solid bullish signs not only on the higher timeframes but also on the 30-minute chart which is likely to be the origin for the suggested targets to reach within the upcoming schedule, the next times it is necessary to elevate how XRPUSD bounces within the blue cluster and emerges from there, when the bounce is solid and strong this will give a great origin for the upside targets to be reached, currently, XRPUSD is one of the greater bullish cryptocurrencies out there which is necessary to differentiate as the divergence between the currencies is increasing more and more.

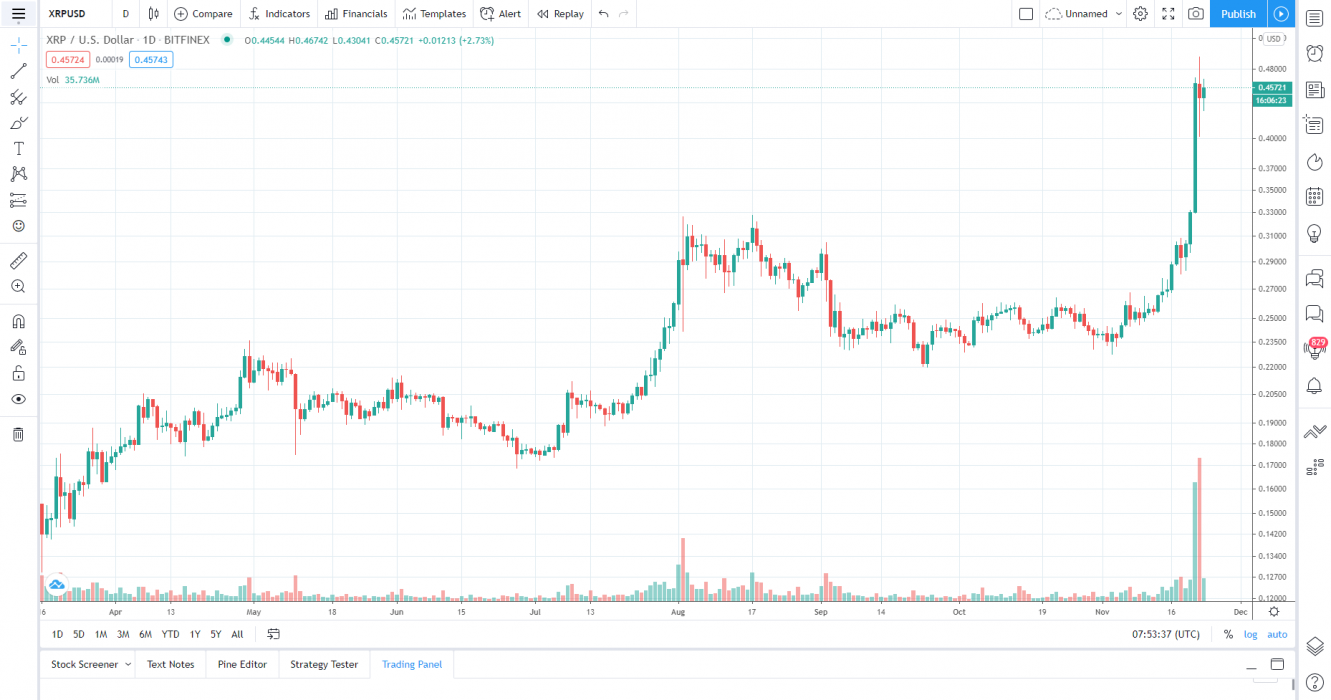
If we zoom out and take a look at the price over the past year or so with 1 day candle chart, we can see the recent breakout more clearly, the line is almost vertical which is insane.

Source: TradingView

So why did XRP breakout?

The recent rise in Bitcoin over 100% since the halving in May and then the suggested start of the Altcoin season could have contributed to the recent breakout. It could also be contributed to some of the recent events & news of XRP.

Ripple buybacks could be driving XRP price higher

During the third quarter of 2020, Ripple bought $45.5 million worth of XRP in a repurchasing program. The company described the initiative as a move to support healthy markets.

The sales summary listed on the Q3 2020 report detailed total purchases of $45.5 million. In previous quarters, Ripple did not repurchase XRP. The report reads:

“As indicated in the Q2 2020 XRP Markets Report, Ripple is purchasing – and may continue to purchase – XRP to support healthy markets.”

Recent XRP News & Events:

Where to Buy or Trade XRP?

XRP has the highest liquidity on Binance Exchange so that would help for trading XRP/USDT or XRP/BTC pairs. However, if you’re just looking at buying some quick and hodling then Swyftx Exchange is a popular choice in Australia.