Categories
Crypto News DeFiChain Elrond Market Analysis Oasis Network Trading

Top 3 Coins to Watch Today: EGLD, DFI, ROSE – August 26 Trading Analysis

Let’s take a closer look at today’s altcoins showing breakout signals. We’ll explain what the coin is, then dive into the trading charts and provide some analysis to help you decide.

1. Elrond (EGLD)

Elrond EGLD is a blockchain protocol that seeks to offer extremely fast transaction speeds by using sharding. The project describes itself as a technology ecosystem for the new internet, which includes fintech, decentralised finance, and the Internet of Things. Its smart contracts execution platform is reportedly capable of 15,000 transactions per second, six-second latency, and a $0.001 transaction cost. The blockchain has a native token known as eGold, or EGLD, used for paying network fees, staking, and rewarding validators.

EGLD Price Analysis

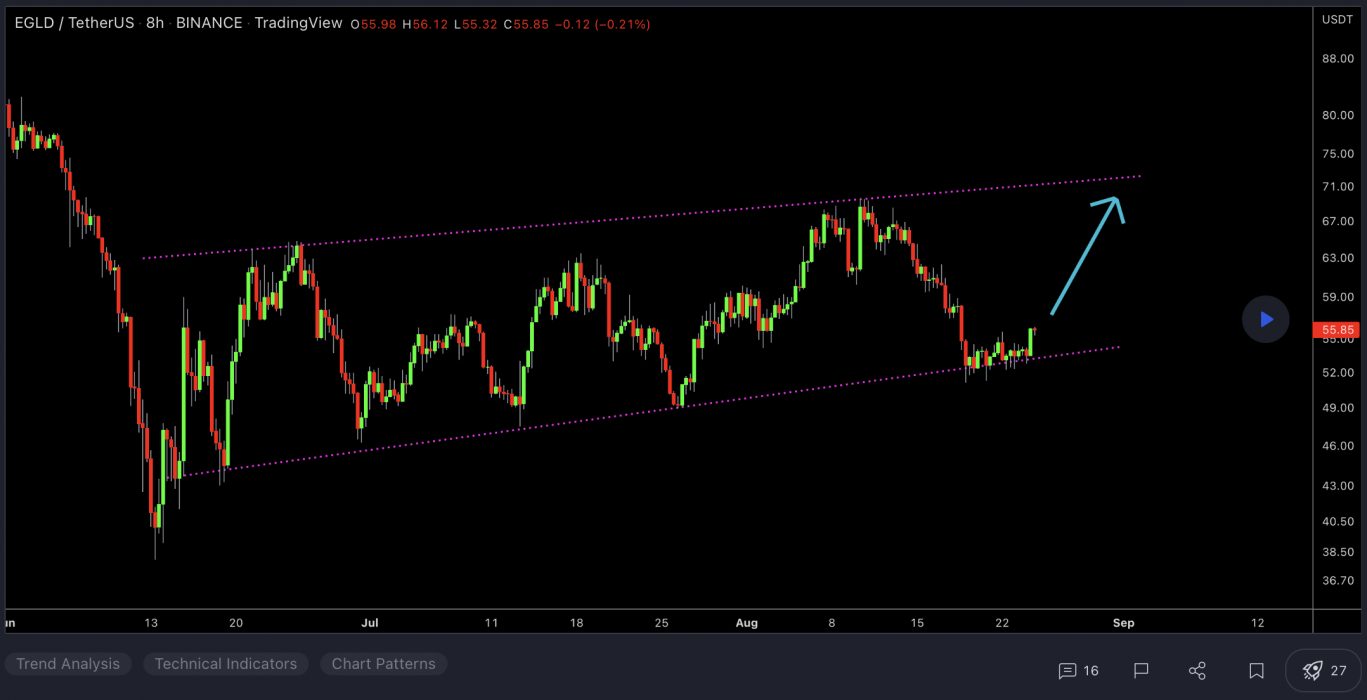
At the time of writing, EGLD is ranked the 42nd cryptocurrency globally and the current price is US$57.54. Let’s take a look at the chart below for price analysis:
Source: TradingView

EGLD‘s 65% rally during Q1 reversed with many other coins in Q2, retracing nearly 50%. Just above the current price and near the June monthly open, $69.20 could provide resistance before a downward move. This level has confluence with the 18 EMA.

Bears may consider $74.94 as a higher probability resistance to hunt shorts for a longer swing downward. However, higher-timeframe charts suggest that the price could reach $82.45 at the top of an inefficiently traded area before any future bearish breakdowns.

Resistance might also rest near $86.45, above the recent monthly open. However, the price is less likely to reach this level unless the overall market starts a bullish swing.

The price is finding support between $45.30 and $40.86. This zone may continue to hold, while overlapping higher-timeframe levels from $37.44 to $34.81 could provide the most substantial support inside this area. 

2. DeFiChain (DFI)

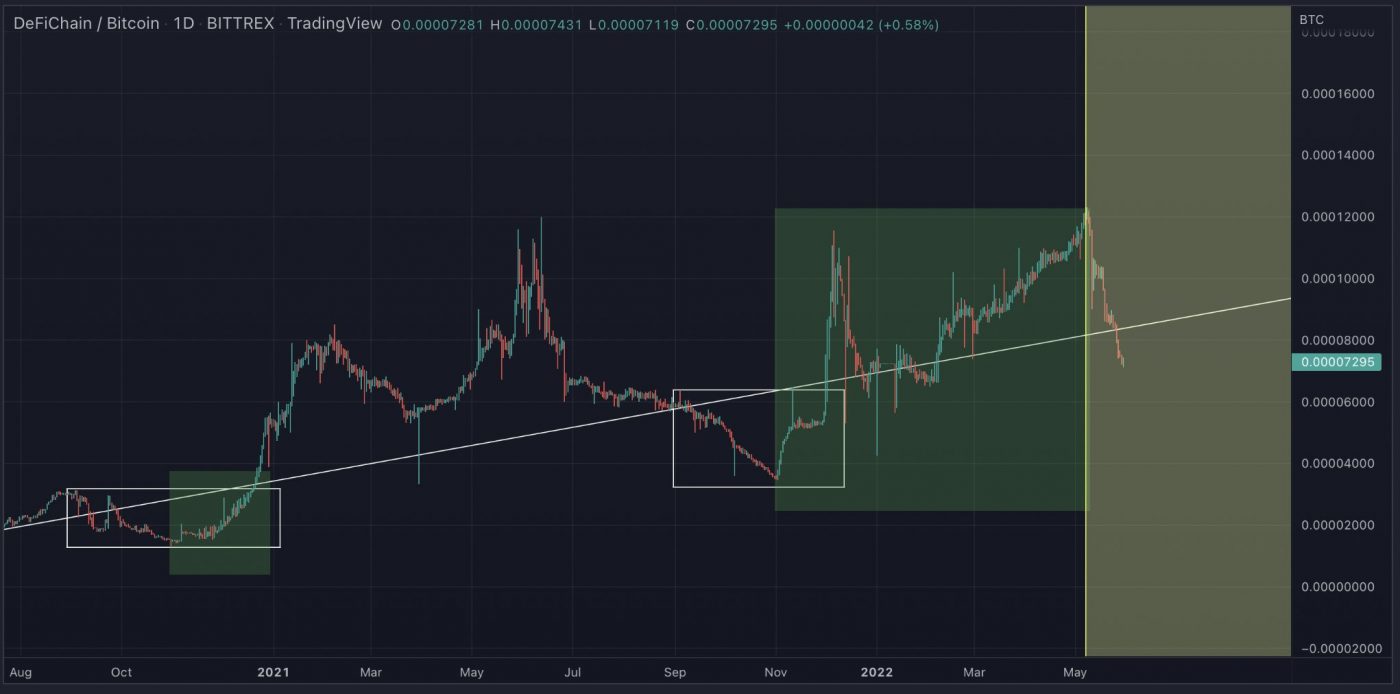
DeFiChain DFI is a blockchain platform built with the mission of maximising the full potential of DeFi within the Bitcoin (BTC) ecosystem. The software platform is supported by a distributed network of computers and is designed to facilitate fast and transparent transactions. The development team positions DeFiChain as an innovative blockchain project and offers solutions to problems like scalability, security, and decentralisation.

DFI Price Analysis

At the time of writing, DFI is ranked the 215th cryptocurrency globally and the current price is US$0.9492. Let’s take a look at the chart below for price analysis:

Source: TradingView

DFI collapsed 80% from its April high before beginning an uptrend in early July.

Bulls broke the market structure to the upside across Q2. This break resulted in a 64% climb ending with a large spike during June. Inside this spike, $1.22 could provide the first resistance. It overlaps with a small area of inefficient trading in mid-June and is near the 40 EMA.

A move higher may retest July’s high, near $1.30. This area shows inefficient trading on the daily and weekly charts. It’s also near the top of inefficient trading on the monthly chart. 

If the rally continues, bulls should find support near $1.08. A narrow pocket under this level, from $1.06 to $1.02, could provide more sensitivity. This pocket shows inefficient trading on the daily and overlaps with old highs. It’s also near the 9 and 18 EMAs.

If the downtrend resumes, a wide area from $0.9133 to $0.07532 may spawn the following bullish setup. This zone shows inefficient trading on the monthly chart.

3. Oasis Network (ROSE)

The Oasis Network ROSE is the first privacy-enabled blockchain platform for open finance and a responsible data economy. Combined with its high throughput and secure architecture, the Oasis Network is able to power private, scalable DeFi, revolutionising Open Finance and expanding it beyond traders and early adopters to a mass market. Its unique privacy features can not only redefine DeFi but also create a new type of digital asset called Tokenised Data that can enable users to take control of the data they generate and earn rewards for staking it with applications – creating the first-ever responsible data economy.

ROSE Price Analysis

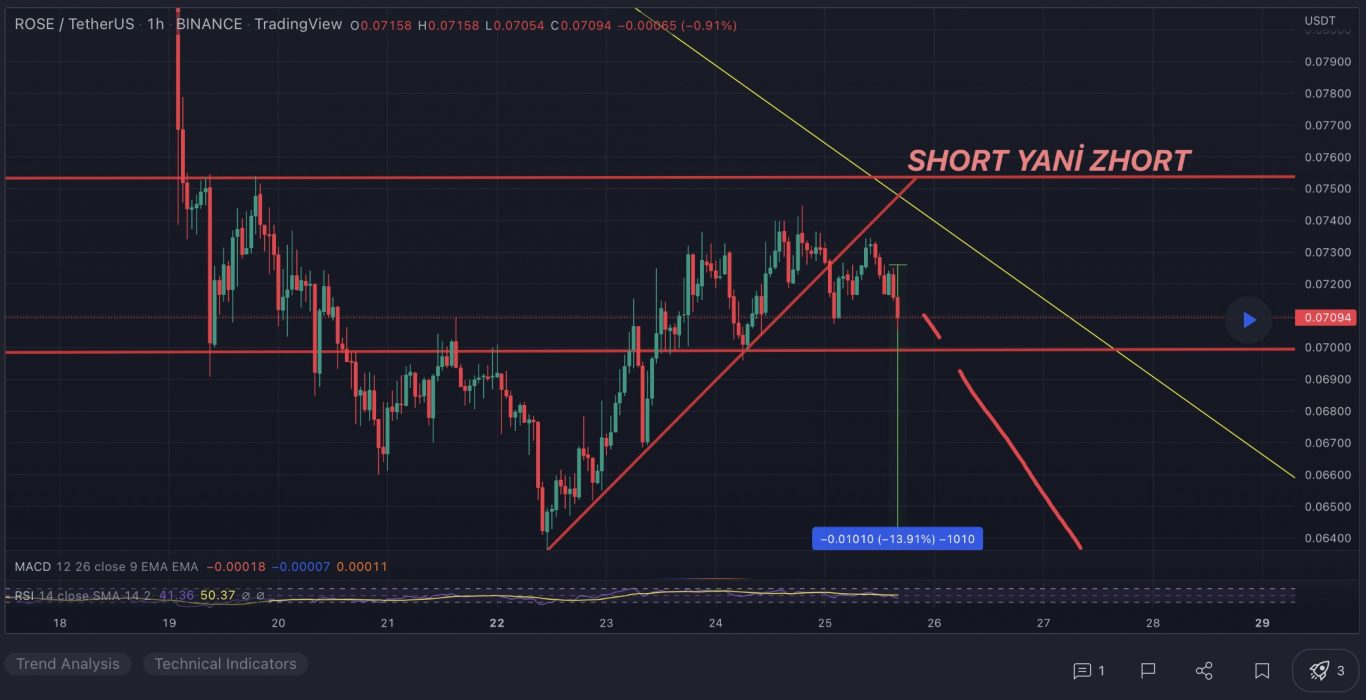
At the time of writing, ROSE is ranked the 100th cryptocurrency globally and the current price is US$0.06918. Let’s take a look at the chart below for price analysis:
Source: TradingView

ROSE climbed 40% from its Q1 low, then dropped nearly 63% into support last month. The price is currently testing this resistance, near $0.1043. It may also provide support again and has confluence with the 61.8% and 78.6% retracements.

Resistance begins just above, at $0.09537. This inefficiently traded area, which reaches slightly beyond $0.1186, contains the previous monthly highs, a bearish market structure break on the daily chart, and the 9, 18 and 40 EMAs. 

These confluences often provide strong resistance. Since this resistance is close to the $0.1215 support, the price may enter consolidation before breaking out to the next move.

If the price breaks this resistance, bulls could eye an area of old rejection, near $0.1320, as their next target. Continuation through this level may target another area of bearish rejection on the weekly chart, near the 27% extension from $0.1359 to $0.1387.

A more significant bearish turn in the market may reach for bulls’ stops under the Q2 lows, down to an area of old support in an inefficiently traded area between $0.06341 and $0.05217.

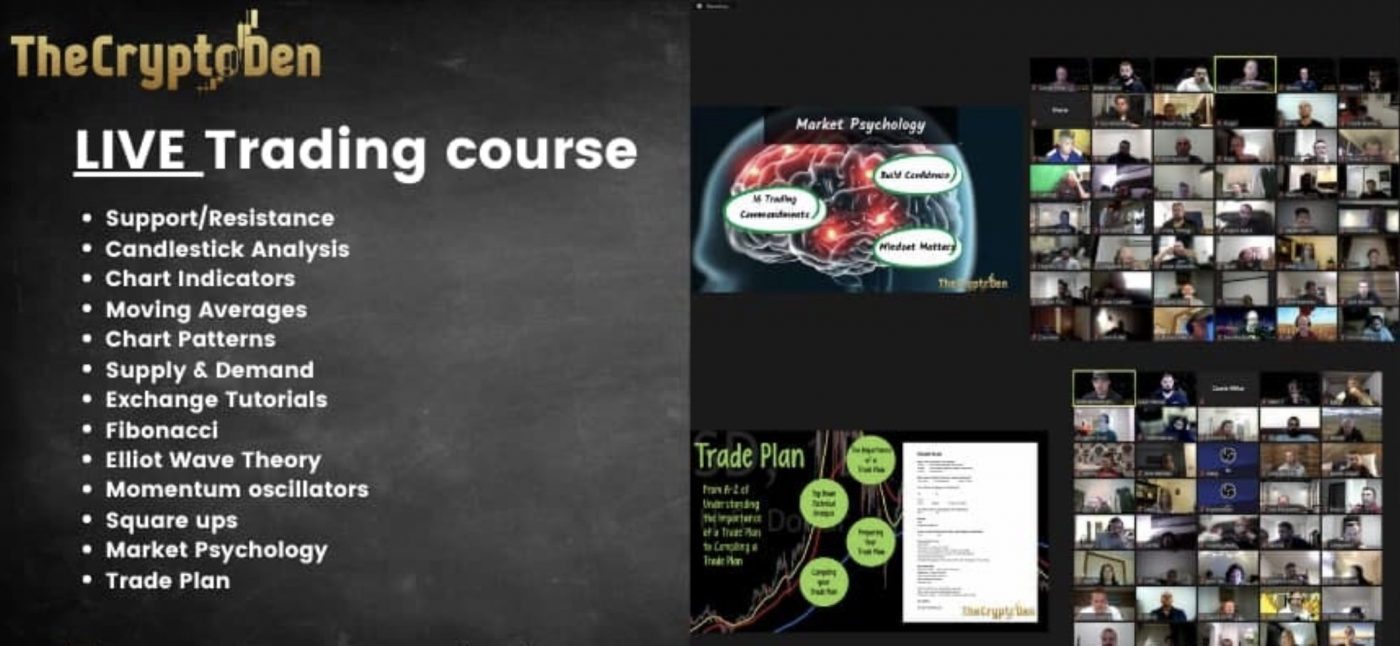
Learn How to Trade Live!

Join Dave and The Crypto Den Crew and they’ll show you live on a webinar how to take your crypto trading to the next level.
Where to Buy or Trade Altcoins?

These coins have high liquidity on Binance Exchange, so that could help with trading on AUD/USDT/BTC pairs. And if you’re looking at buying and HODLing cryptos, then Swyftx Exchange is an easy-to-use popular choice in Australia.

Categories
COTI Crypto News DeFiChain Market Analysis Perpetual Protocol Trading

Top 3 Coins to Watch Today: COTI, DFI, PERP – July 26 Trading Analysis

Let’s take a closer look at today’s altcoins showing breakout signals. We’ll explain what the coin is, then dive into the trading charts and provide some analysis to help you decide.

1. Coti (COTI)

COTI markets itself as the first enterprise-grade fintech platform that empowers organisations to build their own payment solutions, as well as digitise any currency to save time as well as money. COTI is one of the world’s first blockchain protocols optimised for decentralised payments and designed for use by merchants, governments, payment DApps, and stablecoin issuers. The ecosystem has a DAG-based blockchain, proof-of-trust consensus algorithm, multiDAG, GTS (Global Trust System), a universal payment solution, and a payment gateway.

COTI Price Analysis

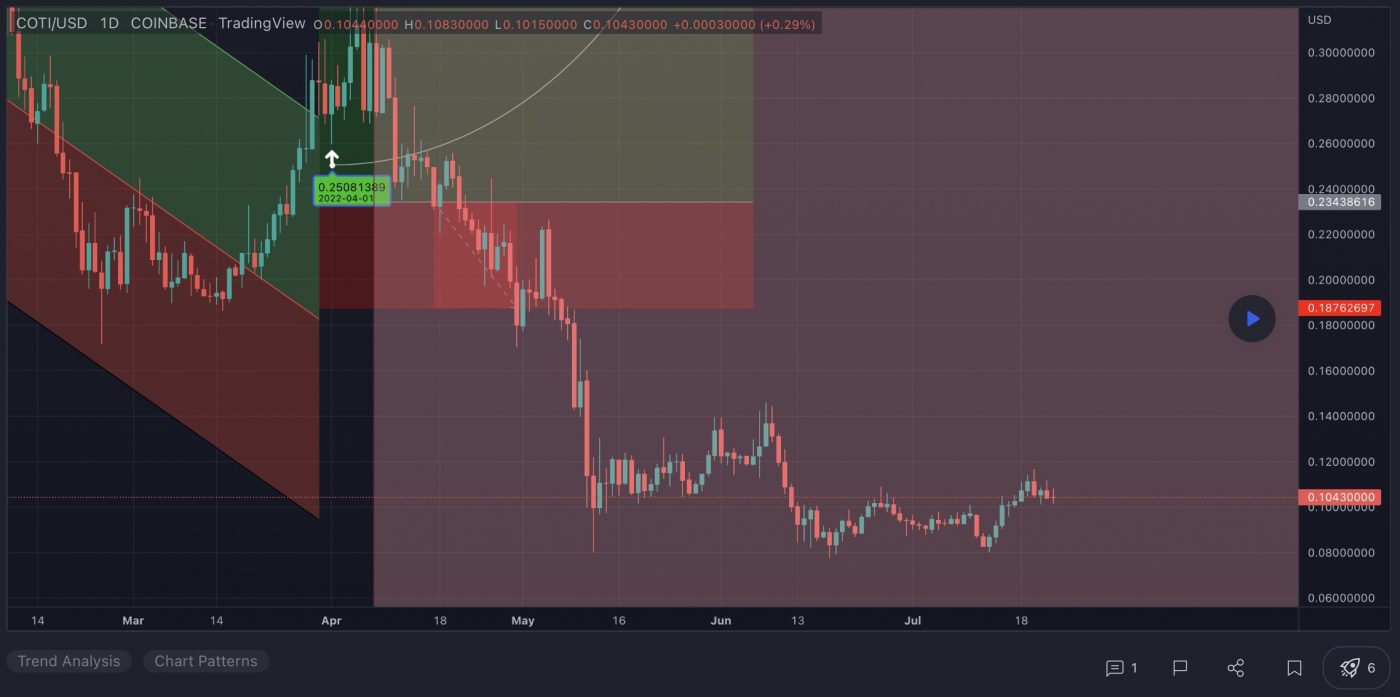
At the time of writing, COTI is ranked the 185th cryptocurrency globally and the current price is US$0.1003. Let’s take a look at the chart below for price analysis:

Source: TradingView

COTI has been ranging since its swift collapse in early May. Bulls and bears are battling between adjacent support and resistance surrounding $0.1036. This proximity may cause more consolidation until a strong move shows the next direction.

The area of resistance showed inefficient trading on the weekly chart. Price has rebalanced this area, so bears are free to take the price lower. Meanwhile, the upper part of accumulation on the weekly and the 9, 18 and 40 EMAs form support below.

A break lower might reach for inefficient trading on the daily chart near $0.0941. This level saw accumulation before mid-July’s run on bulls’ stops. It’s also under the July monthly open and the high of previous inefficient trading on the weekly chart.

If the price breaks higher, an area near $0.1315 could provide the next significant resistance. A move to this level would rebalance early June’s fast drop. It’s also near the June monthly open.

Bulls’ stops under relative equal lows, near $0.07689, might be the next bearish target if the downtrend resumes. This level still shows inefficient trading on the monthly and weekly charts.

2. DeFiChain (DFI)

DeFiChain DFI is a blockchain platform built with the mission of maximising the full potential of DeFi within the Bitcoin (BTC) ecosystem. The software platform is supported by a distributed network of computers and is designed to facilitate fast and transparent transactions. The development team positions DeFiChain as an innovative blockchain project and offers solutions to problems like scalability, security, and decentralisation.

DFI Price Analysis

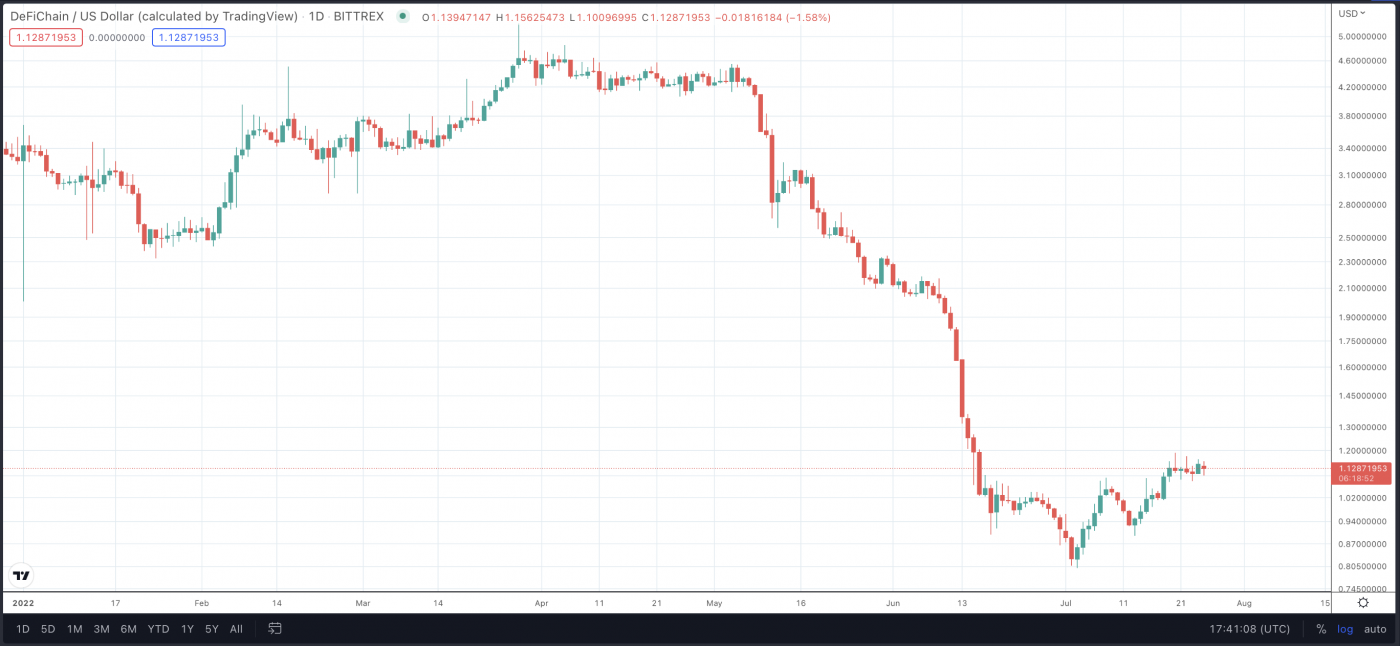
At the time of writing, DFI is ranked the 214th cryptocurrency globally and the current price is US$1.10. Let’s take a look at the chart below for price analysis:

Source: TradingView

DFI collapsed 84% from its April high before beginning an uptrend in early July.

Bulls broke the market structure to the upside on July 7. This break resulted in a 73% climb ending with a large spike on July 22. Inside this spike, $1.2568 could provide the first resistance. It overlaps with a small area of inefficient trading in mid-June and is near the 40 EMA.

A move higher might retest July 22’s high, near $1.3922. This area shows inefficient trading on the daily and weekly charts. It’s also near the top of inefficient trading on the monthly chart. 

If the rally continues, bulls should find support near $1.0852. A narrow pocket under this level, from $1.0690 to $1.050, could provide more sensitivity. This pocket shows inefficient trading on the daily and overlaps with old highs. It’s also near the 9 and 18 EMAs.

If the downtrend resumes, a wide area from $0.7233 to $0.4132 might spawn the following bullish setup. This zone shows inefficient trading on the monthly chart.

Near its midpoint, around $0.5387, is the bottom of inefficient trading on the weekly chart. This level could provide sensitivity and be a target for bears.

3. Perpetual Protocol (PERP)

Perpetual Protocol PERP is a decentralised exchange (DEX) for futures on Ethereum and xDai. Traders can go long or short with up to 10X leverage on a growing number of assets such as BTC, ETH, DOT, and others. Trading is non-custodial, meaning traders always retain possession of their assets and on-chain. Perpetual Protocol utilises a virtual automated market maker (vAMM), which provides on-chain liquidity with predictable pricing set by constant product curves. Furthermore, Perpetual Protocol designed its vAMMs to be market-neutral and fully collateralised.

PERP Price Analysis

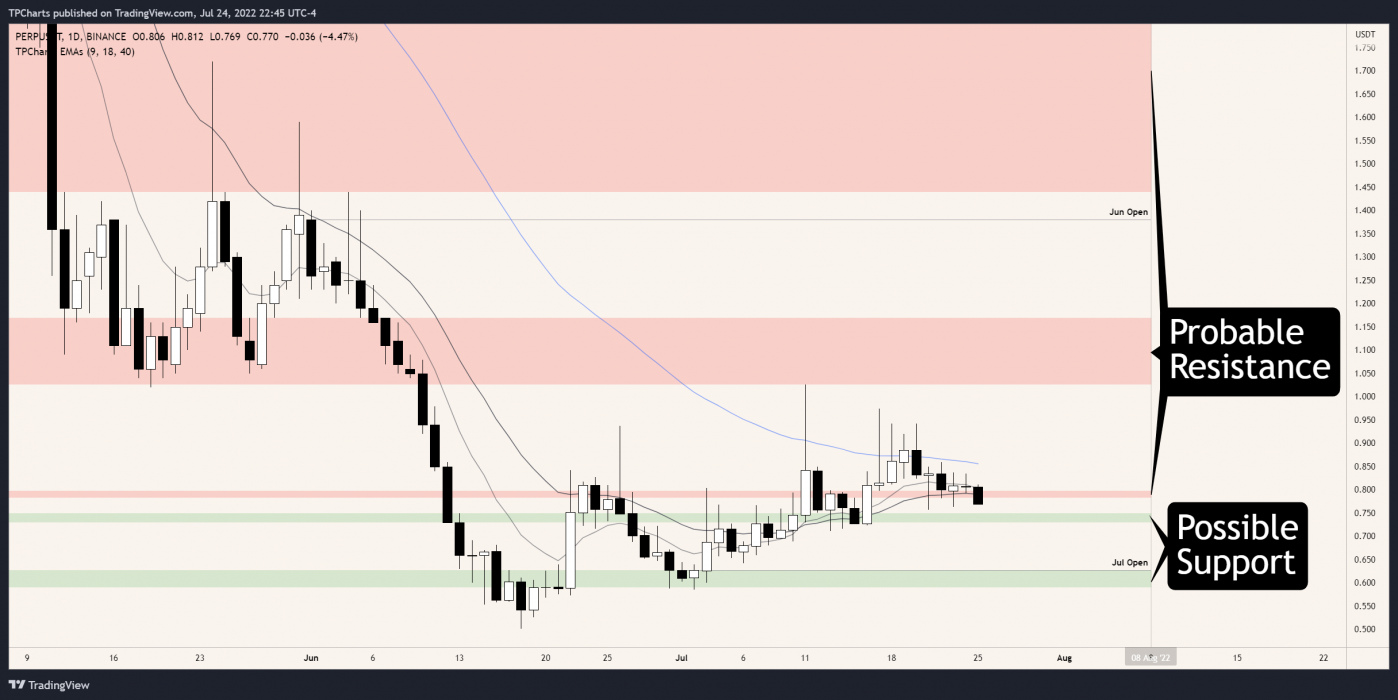
At the time of writing, PERP is ranked the 319th cryptocurrency globally and the current price is US$0.7525. Let’s take a look at the chart below for price analysis:

Source: TradingView

PERP has been in a downtrend for almost a year. In June, it set its all-time low.

Currently, the price is consolidating. The weekly accumulation high near $0.750 should support the price if bulls are buying. This retest would allow more buying as the price runs other bulls’ trailed stops under $0.757.

Yet, the closest resistance is nearby, at $0.783. This level is near the 9 and 18 EMAs, and also showed inefficient trading on the daily chart. This old inefficient trading may cause it to begin offering resistance. 

If the closest support breaks, higher timeframes suggest that $0.628 might be the next support. This level is under the July open near the origin of the rally. Bulls rejected bears here in mid-June.

A drop to this level should make bulls cautious. It could mean that swing lows near $0.586 and $0.502 are the bearish targets.

If bulls do find support, they may be targeting a wide area from $1.026 to $1.170. This range shows inefficient trading on the weekly chart that the price may need to fill. It would also sweep bears’ stops over early July’s swing high into an old distribution area.

Learn How to Trade Live!

Join Dave and The Crypto Den Crew and they’ll show you live on a webinar how to take your crypto trading to the next level.

Where to Buy or Trade Altcoins?

These coins have high liquidity on Binance Exchange, so that could help with trading on AUD/USDT/BTC pairs. And if you’re looking at buying and HODLing cryptos, then Swyftx Exchange is an easy-to-use popular choice in Australia.

Categories
Crypto News DeFiChain Maple Market Analysis PlayDapp Trading

Top 3 Coins to Watch Today: DFI, MPL, PLA – May 31 Trading Analysis

Let’s take a closer look at today’s altcoins showing breakout signals. We’ll explain what the coin is, then dive into the trading charts and provide some analysis to help you decide.

1. DefiChain (DFI)

DeFiChain DFI is a blockchain platform built with the mission of maximising the full potential of DeFi within the Bitcoin (BTC) ecosystem. The software platform is supported by a distributed network of computers and is designed to facilitate fast and transparent transactions. The development team positions DeFiChain as an innovative blockchain project and offers solutions to problems like scalability, security, and decentralisation.

DFI Price Analysis

At the time of writing, DFI is ranked the 210th cryptocurrency globally and the current price is US$2.24. Let’s take a look at the chart below for price analysis:

Source: TradingView

DFI has dropped nearly 60% from its late-March high and is near the bottom of a high-timeframe range extending to the beginning of 2021.

The first high-probability resistance is near $2.3867. This area shows inefficient trading on the daily chart. It’s also near the low of January 2022’s rally. The 9 EMA recently passed through this area, and the 18 EMA will soon arrive.

A more substantial rally could reach up to $3.1593. This area overlaps with the 2022 yearly open, contains the 40 EMA, and shows inefficient trading on the weekly chart.

If the market becomes significantly more bullish, $3.735 to $4.0636 could see profit-taking by bulls. This area shows inefficient trading on the monthly chart and is where distribution occurred before May’s breakdown.

On lower timeframes, the price may have formed support near $2.1561. Traders looking for a short trade on the daily chart may want to watch this area for support. Here, the price created a swing low near an area of buying last September and November.

Bulls might also find support below, near $1.9327. This area has shown chaotic buying in the past, making exact support challenging to pinpoint. However, multiple weekly swing lows have formed in this area near the bottom of the current range. These lows show past demand by bulls while also providing bears with an attractive target.

Below this level, little price action exists to provide precise support. Near $1.0052, a large, inefficiently traded area on the monthly chart was also inefficiently traded on the weekly chart. This zone could provide sensitivity during a retest as bears take profits.

2. Maple (MPL)

Maple MPL is a decentralised corporate credit market offering borrowers transparent and efficient financing completed entirely on-chain. For liquidity providers, Maple offers a sustainable yield source through lending to diversified pools of crypto’s premium institutions. The Pool Delegates that manage these pools perform diligence and set terms with Borrowers. The protocol is governed by the Maple Token (MPL), which enables token holders to participate in governance, share in fee revenues, and stake insurance to Liquidity Pools.

MPL Price Analysis

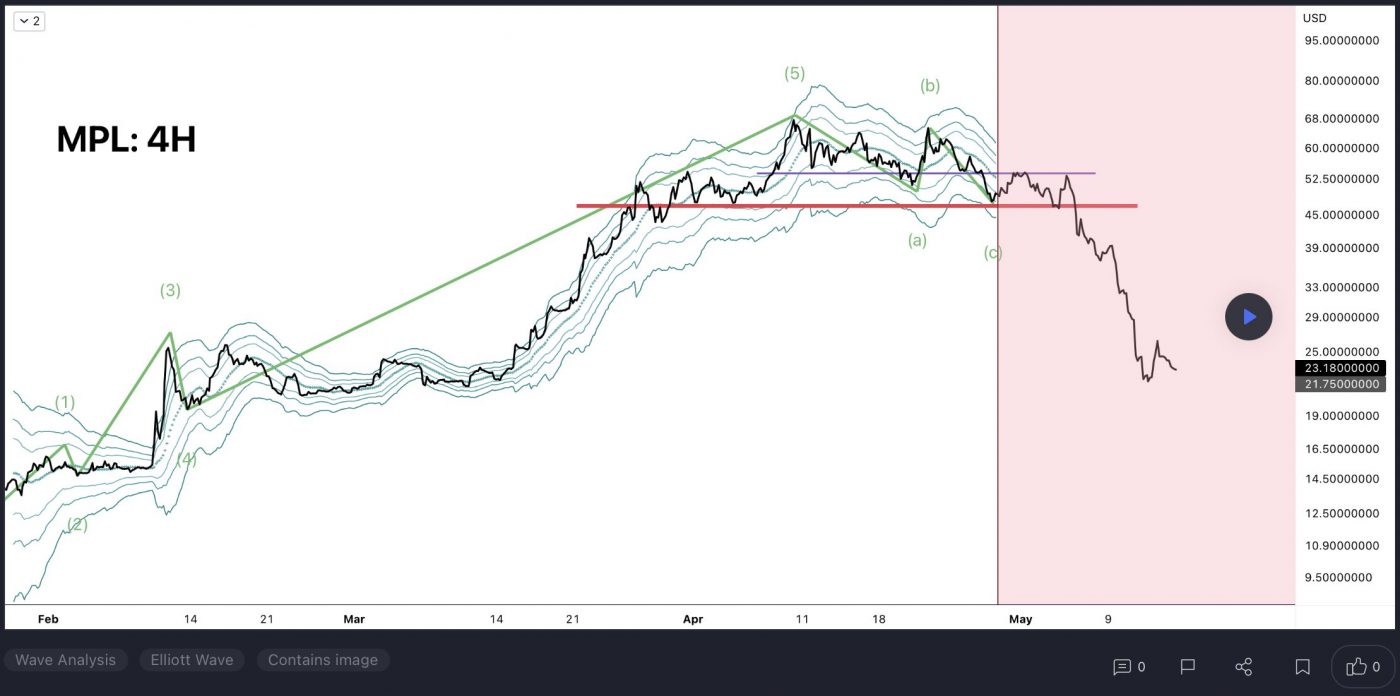
At the time of writing, MPL is ranked the 267th cryptocurrency globally and the current price is US$22.99. Let’s take a look at the chart below for price analysis:

Source: TradingView

MPL has retraced most of its 2022 rally, dropping nearly 70% into an area of old accumulation.

If the current early-week rally continues, $21.76 could provide support. This area formed a swing low on May 27 as the price created a triple-sweep formation, which sometimes suggests an incoming reversal.

Aggressive bulls buying at this level will need to be nimble since the closest resistance is just above, near $22.057. This area is inefficiently traded on the daily chart, contains the 9 EMA, and saw accumulation in March before the explosive run to all-time highs. A rally slightly higher might reach $23.64, near the recent consolidation range’s highs. 

A much more significant rally could retest an area of inefficient trading on the weekly chart, near $42.28, or slightly higher where bears rejected bulls and May’s trading opened, around $53.01. A rally this high is unlikely until the overall market has a more bullish catalyst.

The price still has a significant distance to drop. The next closest support might exist near $19.76, near the top of an area of inefficient trading on the weekly chart. 

Inefficient trading on the weekly chart and accumulation on the monthly chart near the 2022 yearly open, around $17.62, provides a stronger candidate for longer-term support.

3. PlayDapp (PLA)

PlayDapp PLA is an Ethereum token that powers PlayDapp, a blockchain gaming platform and NFT marketplace. PLA acts as the primary token for processing transactions on PlayDapp. Game developers can also receive PLA when users make in-game purchases. A digital asset is used within the PlayDapp Blockchain gaming ecosystem to purchase and trade NFT items within games and with the global C2C marketplace.

PLA Price Analysis

At the time of writing, PLA is ranked the 144th cryptocurrency globally and the current price is US$0.5492. Let’s take a look at the chart below for price analysis:

Source: TradingView

PLA dropped nearly 77% from its March high, forming a low in early May and retracing near the midpoint of its last impulsive move downward.

The price is testing possible resistance near $0.5422, where the 9 and 18 EMAs converge with an area of distribution on the daily chart.

If this level holds as resistance, aggressive bulls might watch $0.5320 as potential support. This area contains the recent lows and inefficient trading on the daily chart.

However, an old swing low and inefficient trading near $0.4629 has better odds of providing support for a more significant rally.

Below this region, exact support levels are ambiguous due to a lack of historical price action on exchange charts. An area between approximately $0.2500 and $0.2000 could provide support. Here, the price accumulated before a significant rally upward.

If the current resistance breaks, inefficient trading on the weekly chart and old swing lows near $0.6292 might act as a stronger resistance. A rally this high could poke slightly above, near $0.7010, where the monthly chart shows the low end of the range where October’s rally began.

Learn How to Trade Live!

Join Dave and The Crypto Den Crew and they’ll show you live on a webinar how to take your crypto trading to the next level.

Where to Buy or Trade Altcoins?

These coins have high liquidity on Binance Exchange, so that could help with trading on AUD/USDT/BTC pairs. And if you’re looking at buying and HODLing cryptos, then Swyftx Exchange is an easy-to-use popular choice in Australia.

Categories
Crypto News DeFiChain IRISnet Market Analysis MobileCoin Trading

Top 3 Coins to Watch Today: DFI, IRIS, MBOX – April 5 Trading Analysis

Let’s take a closer look at today’s altcoins showing breakout signals. We’ll explain what the coin is, then dive into the trading charts and provide some analysis to help you decide.

1. DefiChain (DFI)

DeFiChain DFI is a blockchain platform built with the mission of maximising the full potential of DeFi within the Bitcoin (BTC) ecosystem. The software platform is supported by a distributed network of computers and is designed to facilitate fast and transparent transactions. The development team positions DeFiChain as an innovative blockchain project and offers solutions to problems like scalability, security and decentralisation.

DFI Price Analysis

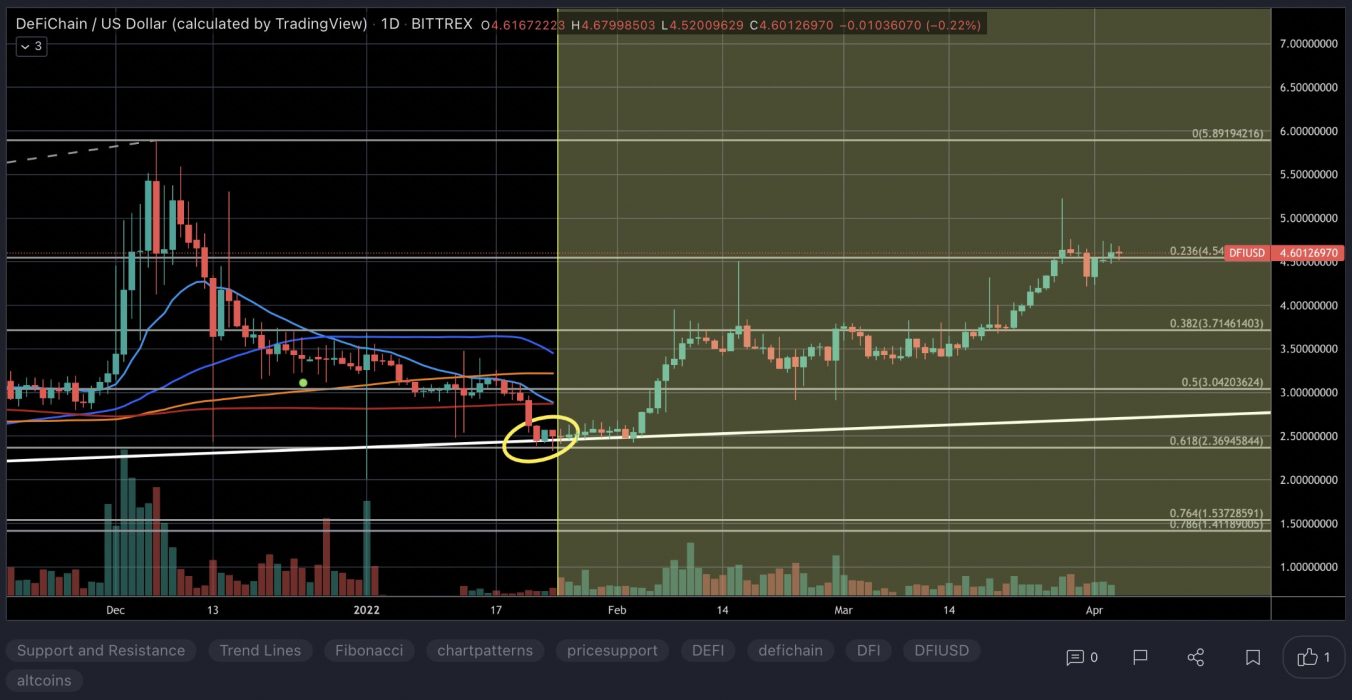
At the time of writing, DFI is ranked the 207th cryptocurrency globally and the current price is US$4.58. Let’s take a look at the chart below for price analysis:

Source: TradingView

DFI has climbed 109.51% from its late January low and is nearing its range high.

The price is currently encountering resistance near $4.750, where December’s breakdown began. This level could continue to provide resistance.

After bulls reached this resistance, the price saw a sharp 15.2% sell-off to support near $3.923, just above the consolidation that began the last leg upward. This level could provide support again.

More aggressive bulls might hunt closer possible support levels near $4.115, where the sell-off wicked through an inefficiently traded area, and from $4.472 to $4.330, where the 9 EMA and April monthly open converge.

Selling may intensify since the price is nearing its yearly range highs. However, if the price breaks its closest resistance, bulls may be eyeing the two bearish rejections near $5.764 as the next target.

2. IRISnet (IRIS)

Irisnet IRIS is a service protocol and cryptocurrency, officially launched on March 1, 2019. The primary purpose of the IRISnet protocol is to provide a blockchain-based, open network to small and medium businesses that are offering a wide variety of services, with the protocol aiming to employ different public and consortium blockchains to bring the power of decentralised, open networks to thousands of businesses and freelance service providers. Interestingly, IRISnet was named after Iris, the personification of the rainbow and the messenger of the Gods in Greek mythology.

IRIS Price Analysis

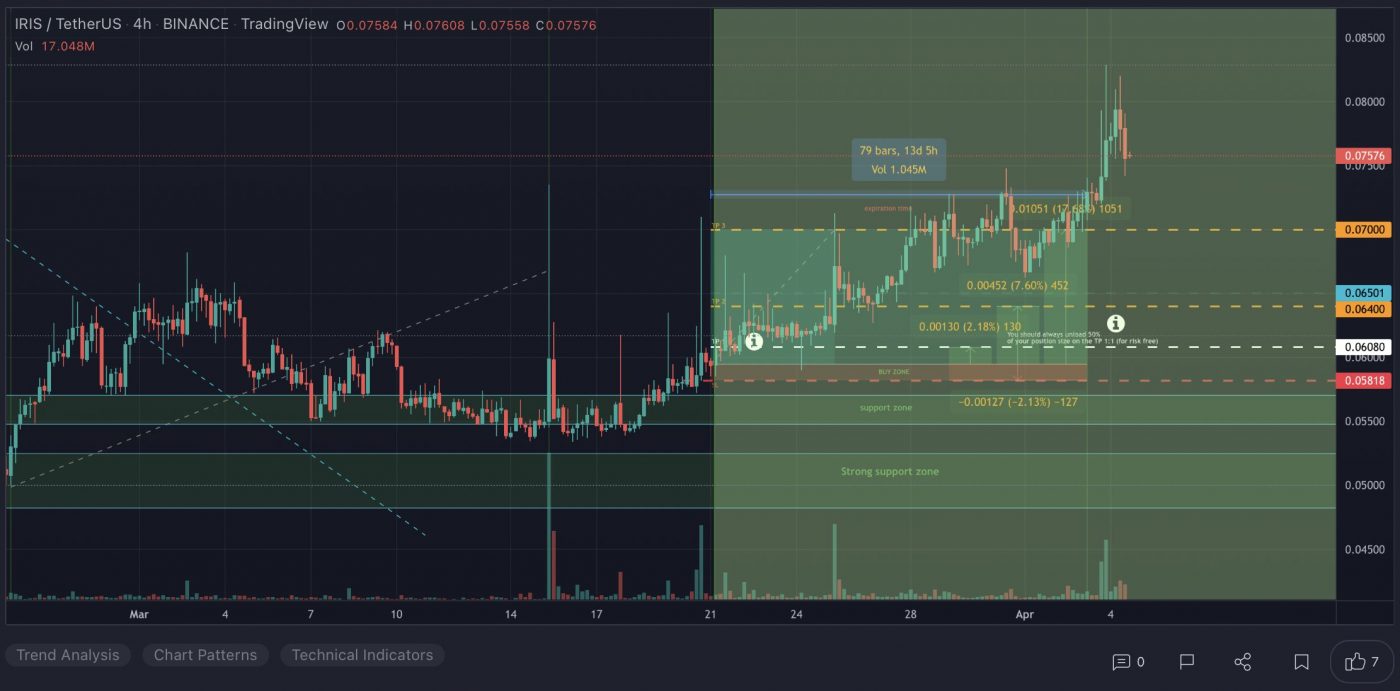
At the time of writing, IRIS is ranked the 420th cryptocurrency globally and the current price is US$0.07611. Let’s take a look at the chart below for price analysis:

Source: TradingView

IRIS climbed nearly 66% after it ran bulls’ stops near a cluster of lows at $0.05133.

The price might find support in the current area, from $0.07636 to $0.07310. Here, the price consolidated before February’s sell-off.

Further below, $0.06525 to $0.06056 may offer more substantial support. The 9, 18 and 40 EMAs have created a bullish cross in this zone. It also has confluence with the 61.8-78.6% retracement levels of the current move and marks the consolidation high before the recent rally.

While the current level could also provide resistance, the price may reach slightly beyond, near $0.08532. This level is near the 2022 yearly open and a significant consolidation low that preceded January’s breakdown.

If this price breaks this resistance, bulls might next watch the area near $0.09808. At this level, the monthly chart shows the last significant consolidation before December’s breakdown.

If the market turns aggressively bearish, bears may enter with a hopeful short target near $0.04625. A move to this level would run bulls’ stops under all higher-timeframe swing lows into the origin of January 2021’s rally.

3. MoBox (MBOX)

MoBox MBOX is an NFT gaming ecosystem built on Binance Smart Chain, a community-driven platform empowering users by rewarding them for their engagement and enjoyment. It combines yield farming in DeFi with gaming NFTs, creating a free-to-play, play-to-earn gaming model. MOBOX Platform combines DeFi and Gaming NFTs, creating a truly free-to-play and play-to-earn ecosystem. 

MBOX Price Analysis

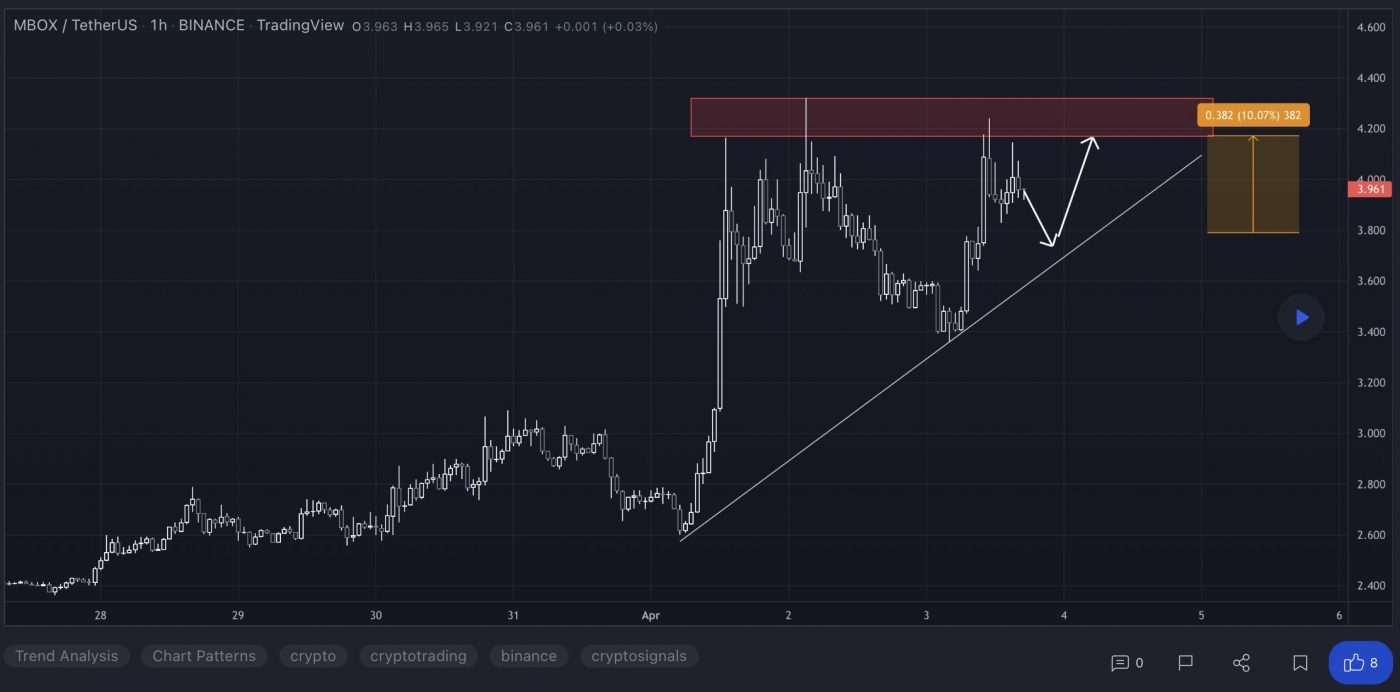
At the time of writing, MBOX is ranked the 184th cryptocurrency globally and the current price is US$3.75. Let’s take a look at the chart below for price analysis:

Source: TradingView

Last week, MBOX broke a key swing high to the upside, reaching resistance beginning near $4.289.

This area could continue to provide resistance, although it’s reasonable to expect the price to reach slightly above to an area between $4.729 and $5.222. This area is near the 2022 yearly open. It also shows an overlap of inefficient higher-timeframe trading and December’s consolidation, which spawned a strong move downward.

As of now, the first probable support may be near $3.393. This area provided support last week. It also overlaps the consolidation high before February’s drop, contains the 9 EMA, and is an inefficiently traded area.

If the support near $3.393 fails, bulls might eye $2.519 as the next possible support. This level has confluence with the 78.6% retracement level, saw the bullish cross of the 9, 18 and 40 EMAs, and is inefficiently traded on higher timeframes.

Learn How to Trade Live!

Join Dave and The Crypto Den Crew and they’ll show you live on a webinar how to take your crypto trading to the next level.

Where to Buy or Trade Altcoins?

These coins have high liquidity on Binance Exchange, so that could help with trading on AUD/USDT/BTC pairs. And if you’re looking at buying and HODLing cryptos, then Swyftx Exchange is an easy-to-use popular choice in Australia.