Categories
Crypto News Kava Market Analysis Trading UFO Gaming Victoria VR

Top 3 Coins to Watch Today: KAVA, UFO, VR – May 24 Trading Analysis

Let’s take a closer look at today’s altcoins showing breakout signals. We’ll explain what the coin is, then dive into the trading charts and provide some analysis to help you decide.

1. Kava.io (KAVA)

KAVA is a cross-chain DeFi lending platform that allows users to borrow USDX stablecoins and deposit a variety of cryptocurrencies to begin earning a yield. The Kava DeFi hub operates as a decentralised bank for digital assets, allowing users to access a range of decentralised financial services, including its native USD-pegged stablecoin, USDX, as well as synthetics and derivatives. Through Kava, users are able to borrow USDX tokens by depositing collateral, effectively leveraging their exposure to crypto-assets.

KAVA Price Analysis

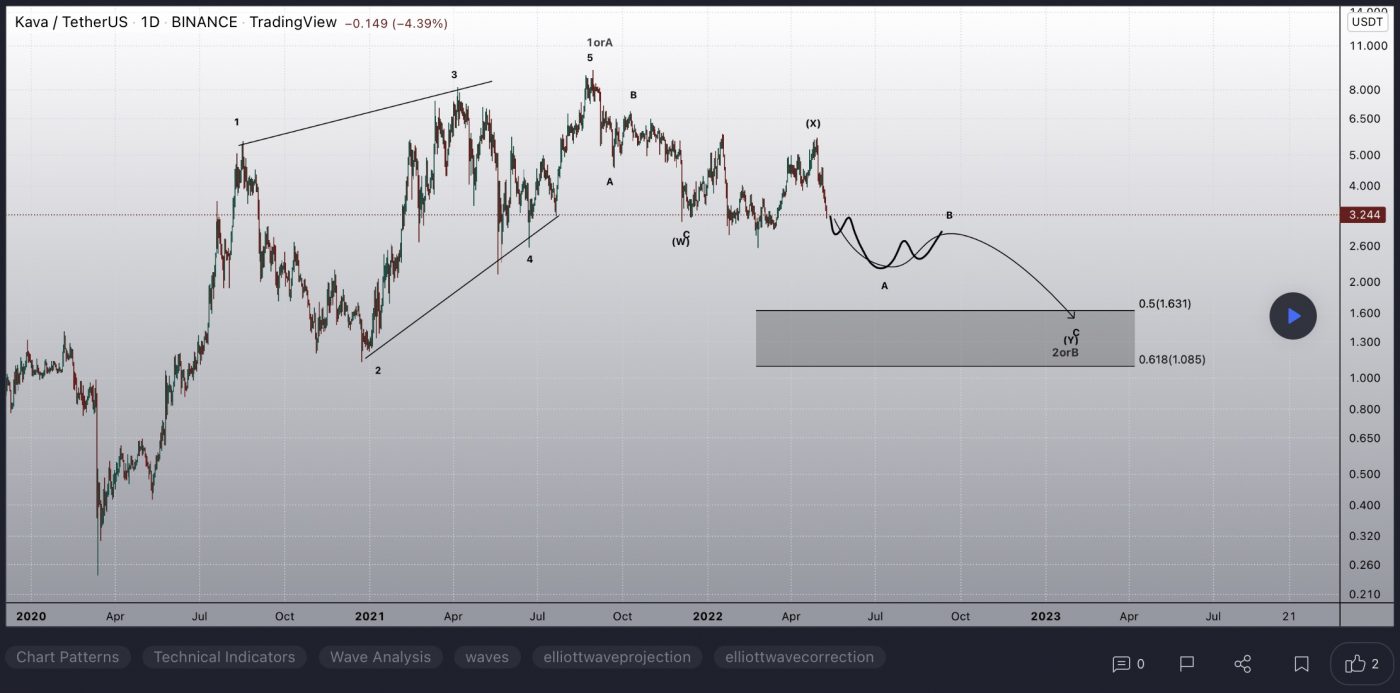
At the time of writing, KAVA is ranked the 85th cryptocurrency globally and the current price is US$2.83. Let’s take a look at the chart below for price analysis:

Source: TradingView

KAVA dropped 75% during the May crash, running bulls’ stops below a significant swing low at $2.109 and almost reaching bulls’ stops near $1.123.

The price has bounced and might have created support near $2.611. This level is near the upper portion of last week’s consolidation and the 9 EMA. 

If this level breaks, bulls might look to $2.039 as the next possible support. The monthly chart shows inefficient trading at this level, which is at the base of the recent rally and could require another test.

An inefficiently traded area on the daily chart from $3.020 to $3.342 may offer some resistance. This area overlaps with the February and March consolidation low and contains the 40 EMA.

If bulls break through this level, $3.528 to $4.066 may be the next target. This zone is inefficiently traded on the weekly chart, overlaps with the 2022 yearly open, and borders the bottom of April’s last rally before the price plunged.

A more bullish market might target bears’ stops at relatively equal swing highs and an old area of monthly rejection near $5.655. 

However, the market is currently bearish. This bearishness increases the odds that the price could first visit possible support near $1.292. Here, bulls have stops under a significant swing low, and the monthly chart shows inefficient trading.

2. UFO Gaming (UFO)

UFO Gaming UFO is a decentralised gaming platform with play-to-earn elements, NFTs, and DeFi functionality such as staking. Its first game is Super Galactic, an RPG/arcade action game with its own NFT collection combined with an auto battler. UFO Gaming is built on Ethereum, but its games are integrated with Immutable X, a layer-two scaling solution for NFT projects on Ethereum. UFO Gaming has sealed several high-impact partnerships with projects such as Kadena, Merit Circle, Citizen X, Polygon and ShibaSwap.

UFO Price Analysis

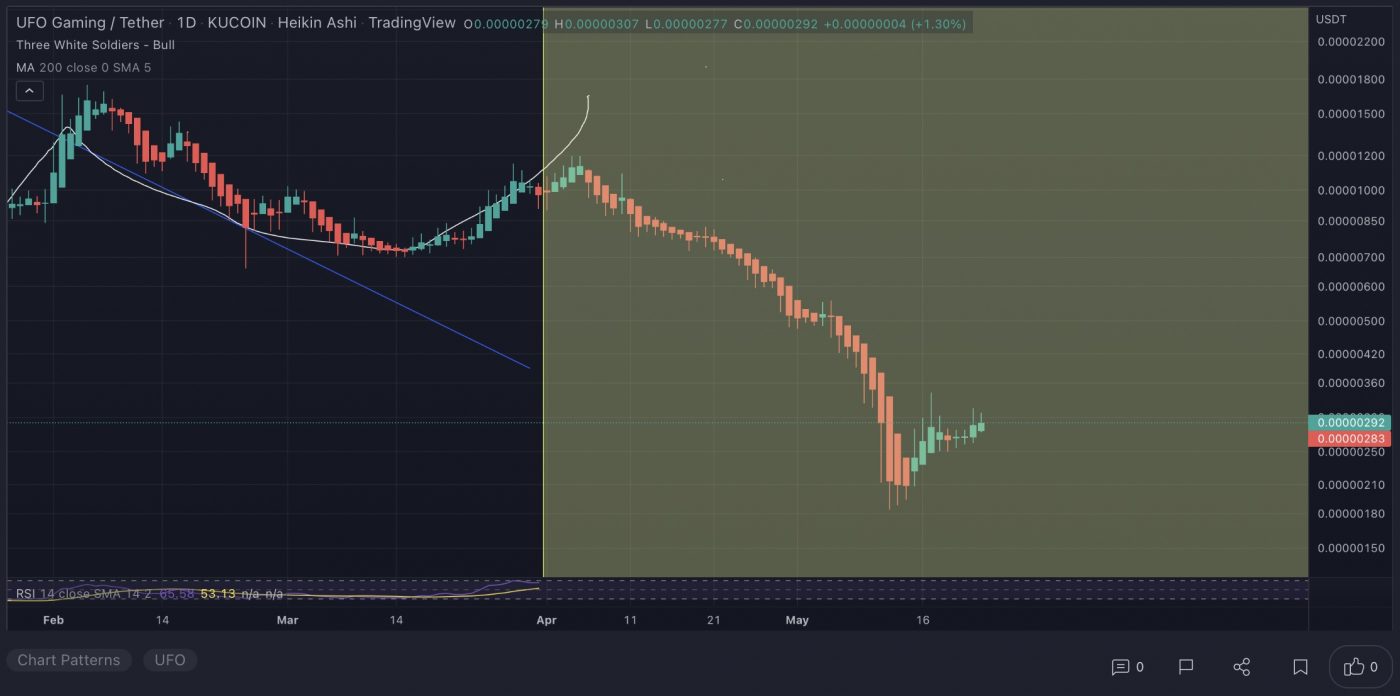
At the time of writing, UFO is ranked the 350th cryptocurrency globally and the current price is US$0.000002829. Let’s take a look at the chart below for price analysis:
Source: TradingView

UFO has dropped 84% from its April high, running bulls’ stops below relatively equal lows near $0.000002088.

An inefficiently traded area on the daily chart, from $0.000002458 to $0.000002178, might provide support during a retest. Bulls may see a retest of this level around May 25’s staking dApp launch as traders take profits with the news.

However, the strong bearish trend might make bulls wary of a run under the recent swing low. Bulls could watch for signs of support down to approximately $0.000001557, which saw accumulation before a strong rally in August 2021.

Below this level, $0.000001030 may provide the next notable support. This level saw significant buying in June before 2021’s bull run.

The price might find its first high probability resistance between $0.000003775 and $0.000004023. This area is in the upper half of the most recent swing and shows inefficient trading on the daily chart.

Above this resistance, April’s fast drop may require re-trading. Price action varies across exchanges, making accurate prices impossible to determine. Traders could watch for resistance in an area that shows inefficient trading from near the $0.000007120 swing low up to approximately $0.000008786.

3. Victoria VR (VR)

Victoria VR is a blockchain-based MMORPG in Virtual Reality with Realistic Graphics built on Unreal Engine, created and owned by its users. The whole world is built to be a universal platform for all virtual realities, games, and decentralised applications, collectively creating a Metaverse – a shared virtual realm, the 3D internet. In the Victoria VR World, there will be games, quests, never-ending adventure, virtual galleries, and The Big Market VR where you can exchange NFTs in 3D! In addition, users will be rewarded for each of their activities in the VR world.

VR Price Analysis

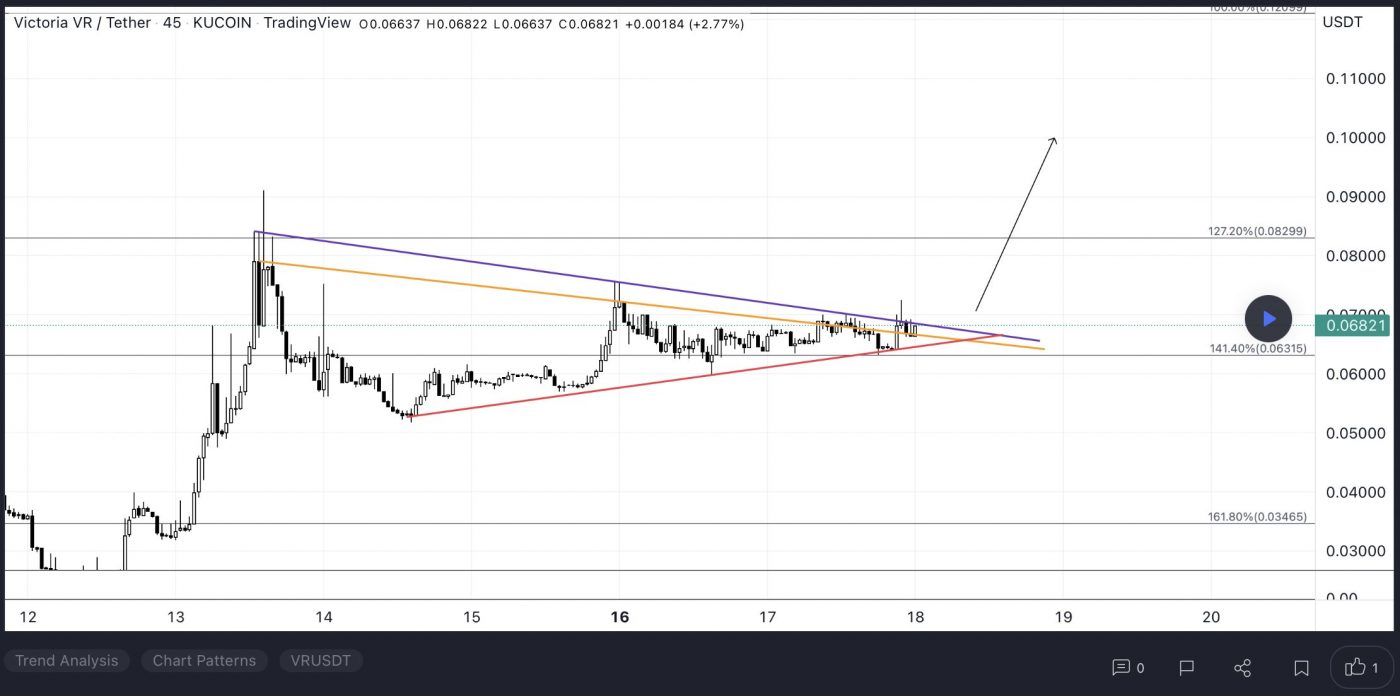
At the time of writing, VR is ranked the 443rd cryptocurrency globally and the current price is US$0.05974. Let’s take a look at the chart below for price analysis:
Source: TradingView

VR has dropped 91% from its March high as it searches for a bottom.

A test of $0.02232 led to a sharp 308% rally over two days. This rally may have created support between $0.05500 and $0.03990, where the daily chart shows inefficient trading.

However, the chart shows a strong bearish bias on higher timeframes. Bulls might be cautious, concerned about a run under the recent swing low at $0.02232. Under this low, there is no historical price action to give precise support levels.

An inefficiently traded area on the daily chart near $0.08764 rejected the price and might provide resistance again. This level has confluence with the 40 EMA.

A rally through this high may reach the next inefficiently traded area, near $0.10109. This level is near the May monthly open.

If the market turns significantly more bullish, the price could reach the late-April consolidation near $0.14148. A rally to this level might try to test inefficient trading on the weekly chart, near $0.16752. The upper portion of this zone has confluence with March-to-May’s 61.8% retracement.

Learn How to Trade Live!

Join Dave and The Crypto Den Crew and they’ll show you live on a webinar how to take your crypto trading to the next level.

Where to Buy or Trade Altcoins?

These coins have high liquidity on Binance Exchange, so that could help with trading on AUD/USDT/BTC pairs. And if you’re looking at buying and HODLing cryptos, then Swyftx Exchange is an easy-to-use popular choice in Australia.

Categories
Crypto News eCash Kava Market Analysis Secret Trading

Top 3 Coins to Watch Today: KAVA, SCRT, XEC – May 10 Trading Analysis

Let’s take a closer look at today’s altcoins showing breakout signals. We’ll explain what the coin is, then dive into the trading charts and provide some analysis to help you decide.

1. Kava.io (KAVA)

KAVA is a cross-chain DeFi lending platform that allows users to borrow USDX stablecoins and deposit a variety of cryptocurrencies to begin earning a yield. The Kava DeFi hub operates as a decentralised bank for digital assets, allowing users to access a range of decentralised financial services, including its native USD-pegged stablecoin, USDX, as well as synthetics and derivatives. Through Kava, users are able to borrow USDX tokens by depositing collateral, effectively leveraging their exposure to crypto assets.

KAVA Price Analysis

At the time of writing, KAVA is ranked the 94th cryptocurrency globally and the current price is US$3.06. Let’s take a look at the chart below for price analysis:

Source: TradingView

KAVA retraced nearly 40% from its April high during the past 10 days. The price is now testing possible support near $3.260. Bulls accumulated near this level during February and March before the last significant rally. 

If this level breaks, relatively equal lows near $2.924 provide an attractive target for bears. Bulls have rejected bears below this level multiple times, near $2.744. This level could provide support again.

A more significant downward move could reach an inefficiently traded area and old accumulation on the monthly chart between $2.135 and $1.678. The upper half of this zone may be the primary bearish target.

If Tuesday’s high cannot reach $3.534, then the high may provide the closest resistance. A break through this level will likely encounter resistance near the 2022 yearly open, near $3.863. This level also has confluence with the 9 EMA and April’s range lows.

A more significant rally might reach above the May monthly open into a pocket of inefficient trading on the daily near $4.510. This level is at the midpoint of April’s distribution range and bearish rejection of bulls on the monthly.

2. Secret (SCRT)

Secret SCRT is the native coin of the Secret Network, a decentralised network for private/secure computation. Nodes on the network (known as secret nodes) can perform generalisable computations over encrypted data, which allows smart contracts (known as secret contracts) to use private and sensitive data as inputs. Our focus is on computational privacy, not just transactional privacy. Developers can build decentralised, privacy-preserving “Secret Apps” on the network. The privacy functionality of the Secret Network is critical for many fields, including decentralised finance, Web3, machine learning, access control, and many more.

SCRT Price Analysis

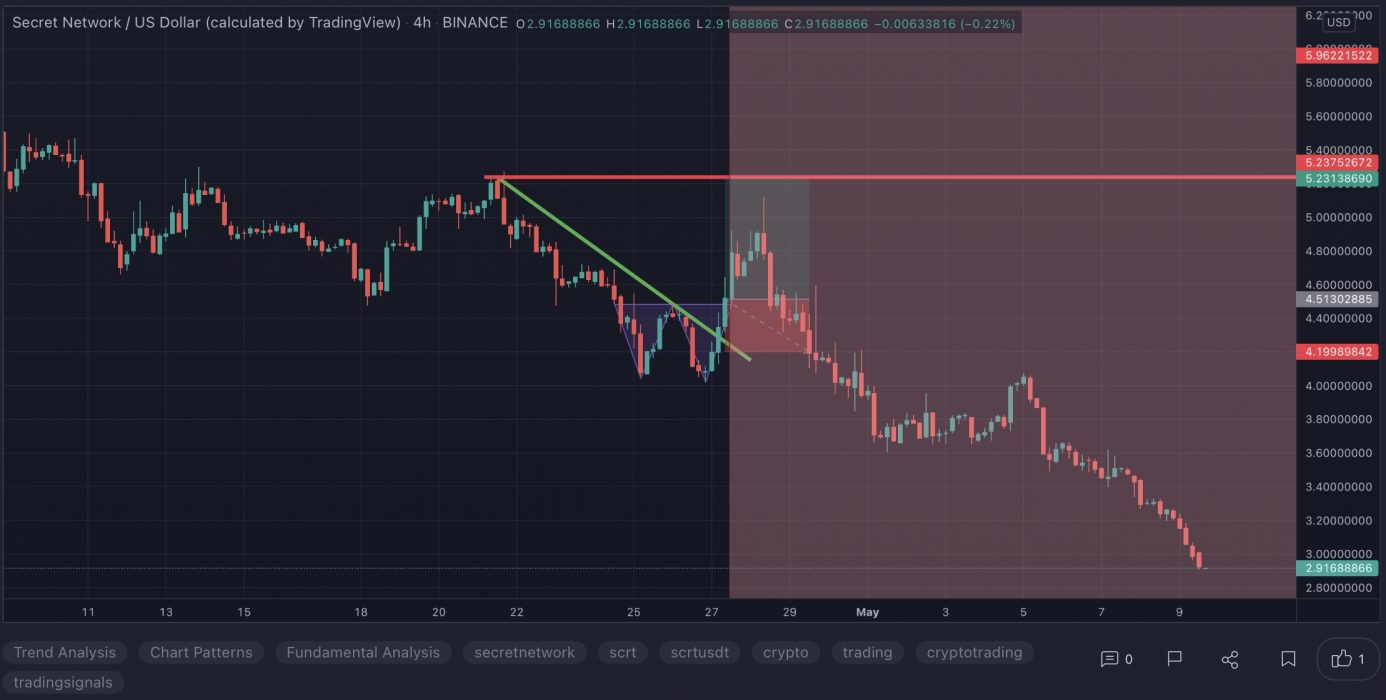
At the time of writing, SCRT is ranked the 102nd cryptocurrency globally and the current price is US$2.93. Let’s take a look at the chart below for price analysis:

Source: TradingView

SCRT has retraced 54% since its early April high, potentially dropping this much again before finding a bottom.

An old swing high near $2.879 could provide a tradable bounce, although bulls should be cautious about overstaying their welcome. The inefficiently traded areas below, near $2.550 and $2.287, provide attractive targets for bears. 

Near $1.169, an inefficiently traded area on the monthly chart may be the next bearish target if these levels break. Reaching this zone would run the stops of most bulls and retest last summer’s accumulation area. 

A retest of these closer resistances could reach up to $3.860. This level is near the 18 EMA, shows consolidation before last week’s breakdown, and has confluence with December’s swing low.

If markets become more bullish, the price could reach above the May open to $4.304. This area is near the 40 EMA, shows consolidation before a breakdown, and would run the stops of aggressive bears. A rally this high with daily candle closes in the region could lead to a more significant bullish movement.

3. eCash (XEC)

eCash XEC follows through on key blockchain scaling promises. An innovative Avalanche consensus layer and its own token layer are unique technical highlights of eCash, which also aims to introduce features never before seen in a Bitcoin project such as staking, fork-free network upgrades, and subchains. Built by an experienced team of bitcoin developers who founded Bitcoin Cash, eCash is a fork of bitcoin with a more aggressive technical roadmap.


XEC Price Analysis

At the time of writing, XEC is ranked the 61st cryptocurrency globally and the current price is US$0.00006294. Let’s take a look at the chart below for price analysis:

Source: TradingView

XEC has retraced 60% from its April high and is testing an old support area for the third time.

Bulls’ stops under relatively equal lows near $0.00006205 provide a tempting target for bears. The small pocket of inefficiently traded price action bordering these lows could provide a tradable bounce. 

However, if the price reaches this level, bulls should be cautious. Traders “selling the news” could push the price down to other potential supports. If this happens, relatively equal lows near $0.00004869 may be the next bearish target. This level shows a bearish rejection of bulls on the weekly chart in May 2021 and could become support.

Below, a large zone of inefficient trading on the monthly chart starts near $0.00004107. This area offers a reasonable bearish target and could see a longer-term bullish reversal. However, this is a wide range, and the price could reach below the inefficiently traded area to $0.00002624.

Bears might see the upper half of the recent consolidation, near $0.00007134, as a place to hunt short setups. This level has confluence with the 9 EMA and soon the 18 EMA.

If bulls can run bears’ stops above this resistance, $0.00007904 could provide the next resistance. This area has confluence with the 40 EMA and started late April’s selloff.

A more significant rally might reach as high as $0.00009274, where the last consolidation before April’s high took place. Bears have rejected bulls at this level before on the monthly chart.

Learn How to Trade Live!

Join Dave and The Crypto Den Crew and they’ll show you live on a webinar how to take your crypto trading to the next level.

Where to Buy or Trade Altcoins?

These coins have high liquidity on Binance Exchange, so that could help with trading on AUD/USDT/BTC pairs. And if you’re looking at buying and HODLing cryptos, then Swyftx Exchange is an easy-to-use popular choice in Australia.

Categories
Crypto News Kava Litecoin Market Analysis Stellar Trading

Top 3 Coins to Watch Today: LTC, XLM, KAVA – April 13 Trading Analysis

Let’s take a closer look at today’s altcoins showing breakout signals. We’ll explain what the coin is, then dive into the trading charts and provide some analysis to help you decide.

1. Litecoin (LTC)

Litecoin LTC is a cryptocurrency designed to provide fast, secure and low-cost payments by leveraging the unique properties of blockchain technology. The cryptocurrency was created based on the Bitcoin protocol, but it differs in terms of the hashing algorithm used, hard cap, block transaction times, and a few other factors. Litecoin has a block time of just 2.5 minutes and extremely low transaction fees, making it suitable for micro-transactions and point-of-sale payments.

LTC Price Analysis

At the time of writing, LTC is ranked the 20th cryptocurrency globally and the current price is US$103.65. Let’s take a look at the chart below for price analysis:

Source: TradingView

After setting a low last month, LTC kicked off a recovery trend that gained nearly 20% to break the weekly highs.

The following 65% plummet found support near $102.36, sweeping under the 40 EMA into the 61.8% retracement level before bouncing to resistance beginning at $120.53.

This area could continue to provide resistance, possibly causing a retracement to the 9 EMA and 18 EMA near $125.12, where aggressive bulls might begin bidding. The level near $134.98, which has confluence with the 40 EMA, may see more interest from bulls loading up for an attempt on probable resistance beginning near $147.13. 

However, if Bitcoin continues its sideways trend, much lower prices could be seen. The old support near $100.18 could provide at least a short-term bounce. If this level fails, the old monthly lows near $91.23 might also give support and see the start of a new bullish cycle after retesting these support levels.

2. Stellar (XLM)

Stellar XLM is an open network that allows money to be moved and stored. When it was released, the goal was boosting financial inclusion by reaching the world’s unbanked – but soon after, its priorities shifted to helping financial firms connect with one another through blockchain technology. The network’s native token, lumens, serves as a bridge that makes it less expensive to trade assets across borders. All of this aims to challenge existing payment providers who often charge high fees for a similar service.

XLM Price Analysis

At the time of writing, XLM is ranked the 30th cryptocurrency globally and the current price is US$0.1902. Let’s take a look at the chart below for price analysis:

Source: TradingView

XLM set a high near $0.2557 in early April before retracing nearly 25% to find a low near $0.1780. The price consolidated around this level before the strong bullish impulse during the past several weeks.

Probable resistance near $0.2478 is slowing the bullish advance down. However, another leg might target the last swing high at $0.2822 and relatively equal highs at $0.3136. Resistance near $0.3359 could cap the move before the second swing high. Beyond these levels, little stands in the bulls’ way before reaching the swing high near $0.3856.

A retracement before a move higher might find support in the daily gap near $0.1743, just above the monthly open. Relatively equal lows near $0.1675 could also provide support. Run-on stops at $0.1605 and $0.1583 might find support in the gap beginning near $0.1520.

3. Kava.io (KAVA)

KAVA is a cross-chain DeFi lending platform that allows users to borrow USDX stablecoins and deposit a variety of cryptocurrencies to begin earning a yield. The Kava DeFi hub operates as a decentralised bank for digital assets, allowing users to access a range of decentralised financial services, including its native USD-pegged stablecoin, USDX, as well as synthetics and derivatives. Through Kava, users are able to borrow USDX tokens by depositing collateral, effectively leveraging their exposure to crypto-assets.

KAVA Price Analysis

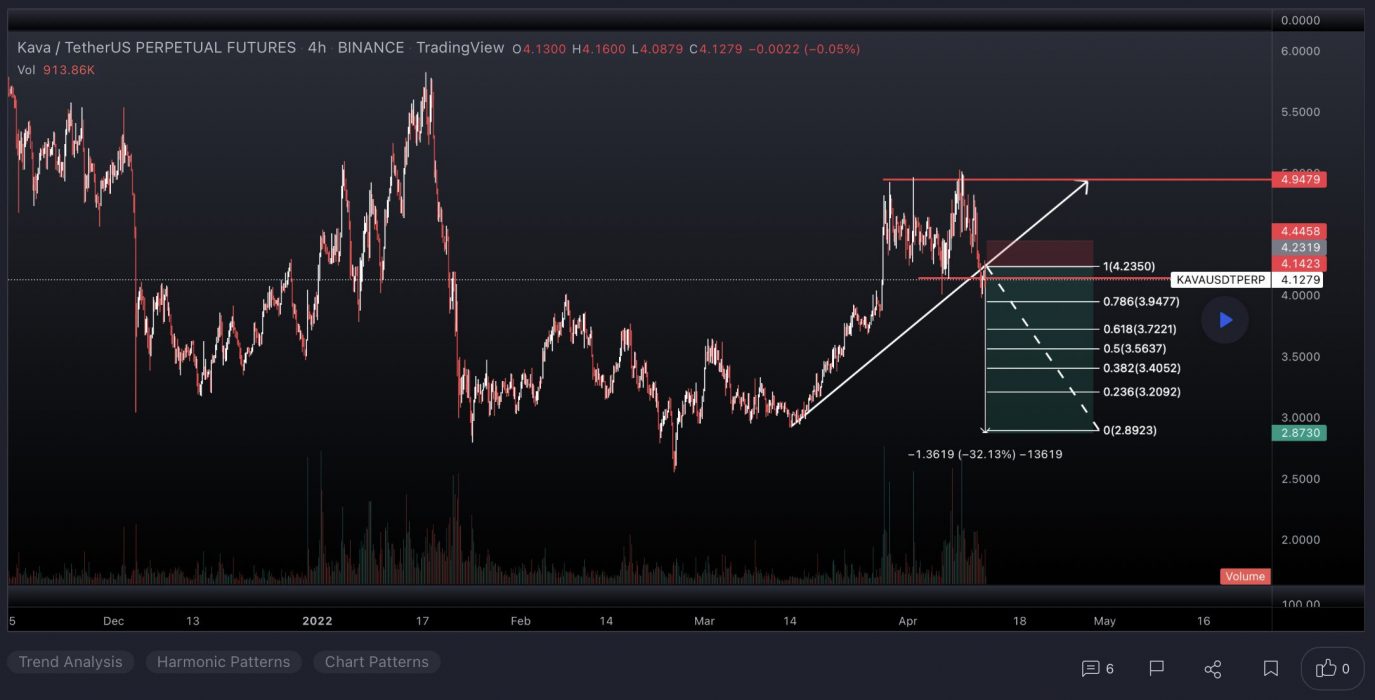
At the time of writing, KAVA is ranked the 96th cryptocurrency globally and the current price is US$4.07. Let’s take a look at the chart below for price analysis:

Source: TradingView

The last year saw KAVA travel through a massive range from approximately $8.00 to $3.66. Currently, it is trending downward into the range lows.

Resistance might be found just above the current price, beginning near $4.75. This area has confluence with the 9 and 18 EMAs. 

A stronger retracement against the bearish trend could reach the 40 EMA and the March monthly open, near $3.70. 

Although unlikely in the current bearish market conditions, a more significant rally might reach over the 2022 yearly open to test an inefficiently traded area from $4.19 to $4.48.

During Q1, the price bounced from the support between $3.15 to $3.00 while wicking just under a narrow support zone at $2.89. These two levels could provide support again. 

However, the price has been consolidating on higher timeframes since late January. Given the current bearish market conditions, it seems likely that a retest of these two support levels may fail. 

Learn How to Trade Live!

Join Dave and The Crypto Den Crew and they’ll show you live on a webinar how to take your crypto trading to the next level.

Where to Buy or Trade Altcoins?

These coins have high liquidity on Binance Exchange, so that could help with trading on AUD/USDT/BTC pairs. And if you’re looking at buying and HODLing cryptos, then Swyftx Exchange is an easy-to-use popular choice in Australia.

Categories
Crypto News Kava Market Analysis Terra Trading Verge

Top 3 Coins to Watch Today: KAVA, LUNA, XVG – March 8 Trading Analysis

Let’s take a closer look at today’s altcoins showing breakout signals. We’ll explain what the coin is, then dive into the trading charts and provide some analysis to help you decide.

1. Kava.io (KAVA)

KAVA is a cross-chain DeFi lending platform that allows users to borrow USDX stablecoins and deposit a variety of cryptocurrencies to begin earning a yield. The Kava DeFi hub operates as a decentralised bank for digital assets, allowing users to access a range of decentralised financial services, including its native USD-pegged stablecoin, USDX, as well as synthetics and derivatives. Through Kava, users are able to borrow USDX tokens by depositing collateral, effectively leveraging their exposure to crypto assets.

KAVA Price Analysis

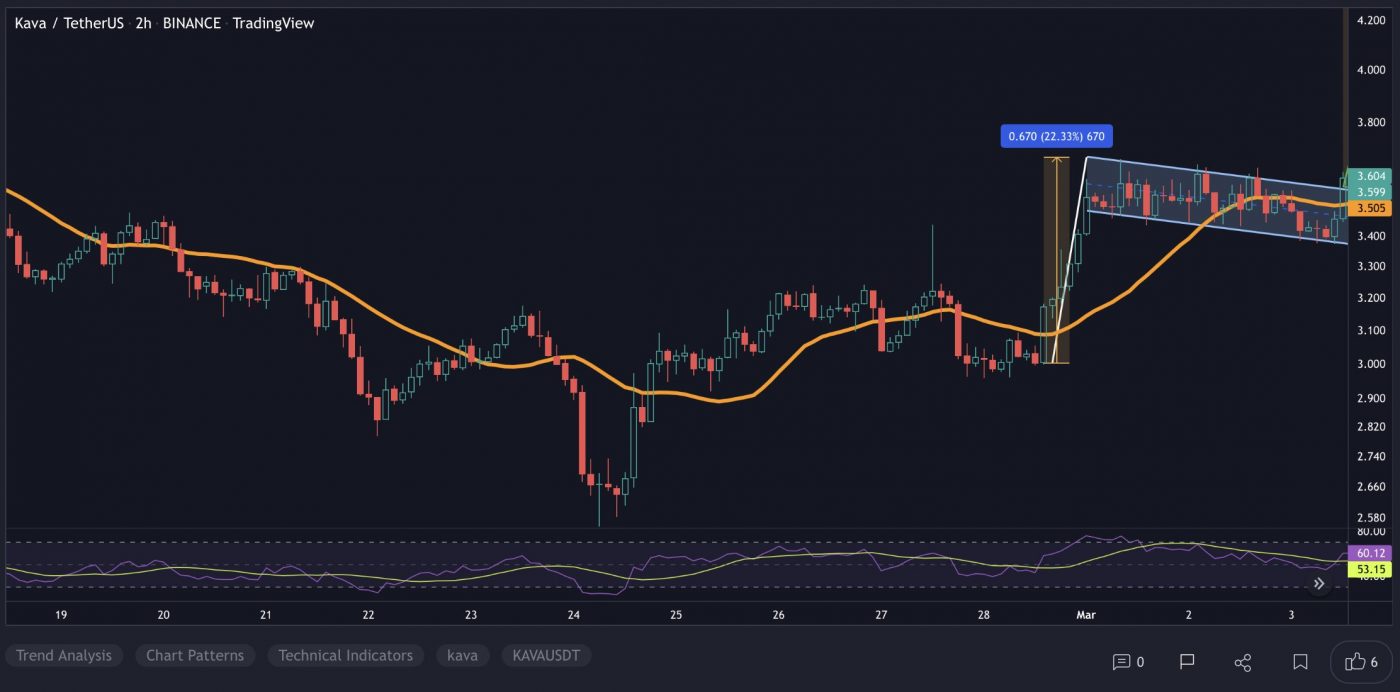
At the time of writing, KAVA is ranked the 118th cryptocurrency globally and the current price is US$3.14. Let’s take a look at the chart below for price analysis:

Source: TradingView

The last year saw KAVA travel through a massive range from approximately $8 to $2.66. Currently, it is trending downward into the range lows.

Resistance might be found just above the current price, beginning near $3.148. This area has confluence with the 9 and 18 EMAs. 

A stronger retracement against the bearish trend could reach the 40 EMA and the March monthly open, near $3.407.

Although unlikely in the current bearish market conditions, a more significant rally might reach over the 2022 yearly open to test an inefficiently traded area from $4.198 to $4.486.

In late February, the price bounced from the support between $2.819 to $2.734 while wicking just under a narrow support zone at $2.594. These two levels could provide support again. 

However, the price has been consolidating on higher timeframes since late January. Given the current bearish market conditions, it seems likely that a retest of these two support levels may fail. 

Bears might take profits near $1.827 at Q4 2021’s consolidation, which could offer support. However, if the price reaches this far, it’s reasonable to expect continuation through the swing low at $1.123 into an inefficiently traded area on higher timeframes.

2. Terra (LUNA)

Terra LUNA is a blockchain protocol that uses fiat-pegged stablecoins to power price-stable global payments systems. According to its whitepaper, Terra combines the price stability and wide adoption of fiat currencies with the censorship-resistance of Bitcoin and offers fast and affordable settlements. Terra’s native token, LUNA, is used to stabilise the price of the protocol’s stablecoins. LUNA holders are also able to submit and vote on governance proposals, giving it the functionality of a governance token.

LUNA Price Analysis

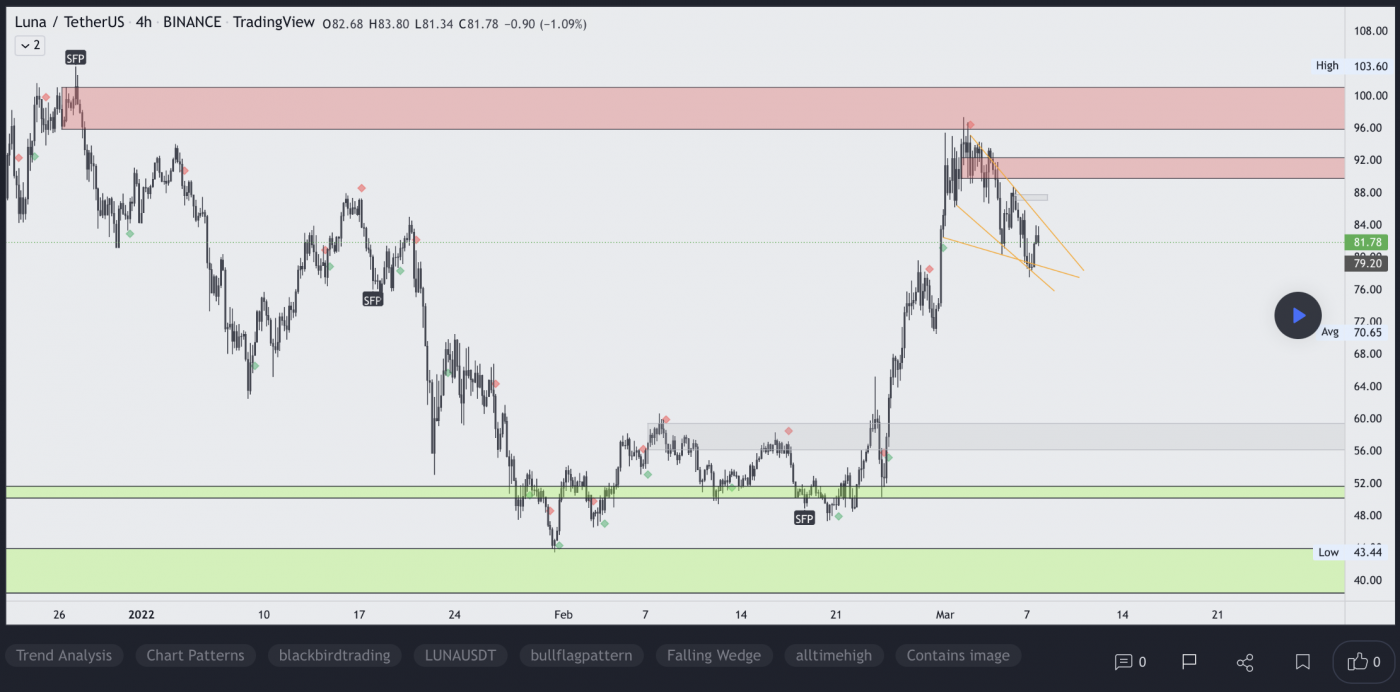
At the time of writing, LUNA is ranked the 7th cryptocurrency globally and the current price is US$81.77. Let’s take a look at the chart below for price analysis:

Source: TradingView

LUNA showed significant strength in the face of a mostly-bearish altcoin market, rallying over 100% in late February after raising funds to help stabilise its peg.

The price is currently retracing from resistance near $98.90, just below the all-time high. Bulls might begin eyeing entries near $79.00, which will soon be near the 18 EMA and between the 61.8% and 78.6% retracement levels of the last leg upward.

A deeper retracement might reach an inefficient zone and the 40 EMA under the last daily swing low, between $70.44 and $66.07. A move below this low suggests a more bearish shift in market structure. If this shift occurs, it could create a short setup to target possible support at the upmove’s accumulation zone, near $59.41.

While the price is retracing, $83.44 offers the closest probable resistance at the 2022 yearly open. Just above, near the March monthly open, the consolidation lows near $89.69 are also a reasonable candidate for resistance.

If the price breaks through these resistances, the significant resistance at $89.69 might also break and allow LUNA to set new all-time highs. However, bulls should keep in mind that the overall market is bearish, decreasing the chances of a massive bullish breakout. If the price does break the all-time high and enter discovery, overlapping extensions near $130 offer a possible significant target.

3. Verge (XVG)

Verge XVG is a privacy-focused cryptocurrency and blockchain that seeks to offer a fast, efficient, decentralised payments network that improves on the original Bitcoin blockchain. It includes additional privacy features including integrating the anonymity network Tor into its wallet, called Verge Pay, and providing the option of sending transactions to stealth addresses. The project describes itself as community-driven, relying on volunteers and priding itself on being open-source.

XVG Price Analysis

At the time of writing, XVG is ranked the 278th cryptocurrency globally and the current price is US$0.009039. Let’s take a look at the chart below for price analysis:

Source: TradingView

XVG has retraced nearly 80% from its November 2021 highs and appears poised to continue its downtrend.

If Monday’s trading fails to reach $0.009471, resistance might begin just above the current price at $0.009235. 

Just above this level rests higher-timeframe resistance from $0.009599 to $0.011032. Inside this broad zone, $0.009709 (an inefficiently traded area) and $0.010175 (the March monthly open) might offer the most sensitivity.

A more significant rally would likely find resistance between $0.013500 and $0.015655, where the monthly chart shows inefficient trading. However, the current bear market decreases the probability of a rally reaching this far.

The quarterly chart shows a broad zone of possible support near $0.006907. Inside this zone, $0.005756 – near the 100% extension of the last retracement upward – offers a higher probability for a bounce or bottom. This level is near the midpoint of November 2020’s massive rally. 

However, the swing low at $0.003552 and an inefficiently traded area below inside late 2019’s consolidation offers an attractive target for bears. Bulls should be cautious with entries until the trend flips bullish.

Learn How to Trade Live!

Join Dave and The Crypto Den Crew and they’ll show you live on a webinar how to take your crypto trading to the next level.

Where to Buy or Trade Altcoins?

These coins have high liquidity on Binance Exchange, so that could help with trading on AUD/USDT/BTC pairs. And if you’re looking at buying and HODLing cryptos, then Swyftx Exchange is an easy-to-use popular choice in Australia.