Categories
Crypto News Market Analysis Theta Trading

Top 3 Coins to Watch Today: COTI, DUSK, THETA – February 1 Trading Analysis

Let’s take a closer look at today’s altcoins showing breakout signals. We’ll explain what the coin is, then dive into the trading charts and provide some analysis to help you decide.

1. Coti (COTI)

COTI markets itself as the first enterprise-grade fintech platform that empowers organisations to build their own payment solutions as well as digitise any currency to save time as well as money. COTI is one of the world’s first blockchain protocols that is optimised for decentralised payments and designed for use by merchants, governments, payment DApps, and stablecoin issuers. The ecosystem has a DAG-based blockchain, proof-of-trust consensus algorithm, multiDAG, GTS (Global Trust System), a universal payment solution, and a payment gateway.

COTI Price Analysis

At the time of writing, COTI is ranked the 170th cryptocurrency globally and the current price is US$0.3304. Let’s take a look at the chart below for price analysis:

Source: TradingView

COTI‘s 682% rally during H2 2022 broke down during November and has since been in a bearish trend on the daily chart. The price recently swept lows below a contested area at $0.2352, which prompted a rally during the last week into resistance at the 40 EMA near $0.3288. 

It remains to be seen whether this contested area from $0.2703 to $0.2352 can support a retest.

Unless the overall market turns bullish, a bearish continuation to possible support near $0.2065 – just under the 78.6% retracement level – seems likely. This area has sparked multiple consolidations.

A break of this level might continue to possible support near $0.1599, where the H2 2022 rally began accumulating before its run.

If the market continues its rally, breaking through resistance near the 2021 yearly open, the macro range highs near $0.4613 might provide the next resistance.

2. Dusk Network (DUSK)

Dusk Network describes itself as a blockchain for programmable and confidential securities, powered by Zero-Knowledge proofs and a novel Private PoS leader extraction-based consensus protocol. Dusk Network is a privacy blockchain for financial applications. It is a layer-1 blockchain that powers the Confidential Security Contract (XSC) standard and supports native confidential smart contracts.

DUSK Price Analysis

At the time of writing, DUSK is ranked the 196th cryptocurrency globally and the current price is US$0.5727. Let’s take a look at the chart below for price analysis:

Source: TradingView

DUSK‘s stunning 1,310% rally from its June lows to December highs shows signs of a more significant bearish reversal after a failed rally in mid-January.

An area near $0.5546, which has confluence with the 9 EMA and the most recent consolidation, is likely to provide resistance.

Possible support under a significant recent swing low and the 61.8% retracement, near $0.4605, may be the next bearish target.

If this area fails to provide support, an area near $0.2625 might offer the next support and potentially a longer-term bottom. This area has confluence with the 78.6% retracement and the consolidation preceding the sharpest leg of H2’s rally.

If market conditions become more bullish and resistance near $0.5546 breaks, an area near the last down moves midpoint, around $0.7737, could provide the next resistance. 

A more sustained move upward may retest the 2022 open near $0.9356. However, the current market conditions reduce the probability of a significant rally.

3. Theta Network (THETA)

Theta Network THETA is a blockchain-powered network purpose-built for video streaming. Launched in March 2019, the Theta mainnet operates as a decentralised network in which users share bandwidth and computing resources on a peer-to-peer (P2P) basis. Theta features its own native cryptocurrency token, THETA, which performs various governance tasks within the network, and counts Google, Binance, Blockchain Ventures, Gumi, Sony Europe, and Samsung as Enterprise validators, along with a Guardian network of thousands of community-run guardian nodes.

THETA Price Analysis

At the time of writing, THETA is ranked the 45th cryptocurrency globally and the current price is US$2.90. Let’s take a look at the chart below for price analysis:

Source: TradingView

THETA has been gradually trending downwards since its massive 44,582% rally through 2020 into April 2021.

The 9 and 18 EMAs, near $2.941 and an old consolidation area, might provide resistance to propel the price down to possible support.

Multiple swing lows under an area of old consolidation, near $1.136, could be the next downside target. If this level breaks, higher-timeframe consolidation near $0.772 might provide the following support.

However, if the current resistance breaks, an area near $3.678 and the 40 EMA might be the next level to watch. This level supported multiple past retests, which means it may flip to resistance.

A more substantial rally could push through 2022 yearly open, revisiting the lows of an old consolidation from $4.986 to $5.830. If this move occurs, it could set the stage for a more extensive consolidation or the start of a new bullish trend.

Learn How to Trade Live!

Join Dave and The Crypto Den Crew and they’ll show you live on a webinar how to take your crypto trading to the next level.

Where to Buy or Trade Altcoins?

These coins have high liquidity on Binance Exchange, so that could help with trading on AUD/USDT/BTC pairs. And if you’re looking at buying and HODLing cryptos, then Swyftx Exchange is an easy-to-use popular choice in Australia.

Categories
Crypto News Market Analysis Trading

Top 3 Coins to Watch Today: ALGO, MANA, ENJ – January 31 Trading Analysis

Let’s take a closer look at today’s altcoins showing breakout signals. We’ll explain what the coin is, then dive into the trading charts and provide some analysis to help you decide.

1. Algorand (ALGO)

The Algorand ALGO blockchain is a permissionless, pure proof-of-stake blockchain protocol. Unlike proof-of-work (PoW) blockchains, where the root block must be validated by randomly selected validators (using computing power), in the pure proof-of-stake approach all of the validators are known to one another and only have to agree on the next block in order to create a new block. Algorand was invented to speed up transactions and improve efficiency in response to the slow transaction times of Bitcoin and other blockchains.

ALGO Price Analysis

At the time of writing, ALGO is ranked the 25th cryptocurrency globally and the current price is US$0.9436. Let’s take a look at the chart below for price analysis:

Source: TradingView

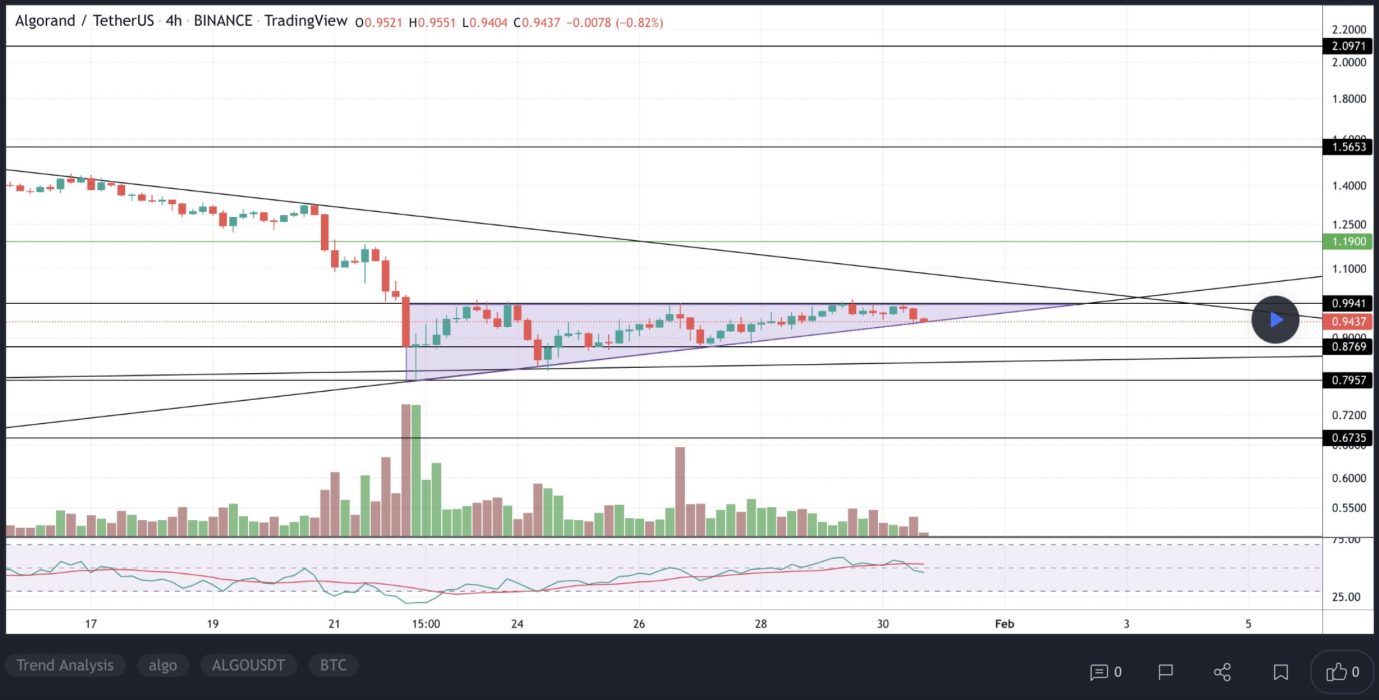
After creating a second equal low during late December, ALGO gained nearly 30% into resistance that starts near $1.55.

Swing traders looking for a continuation to the nearest cluster of relatively equal highs around $1.15 might look for bids near $1.04. More significant resistance rests above, near $1.22. A group of significant swing highs at $1.35 and $1.44 give possible targets if this resistance breaks.

A stop run on the recent low at $0.9200 into possible support beginning near $0.8530 might see stronger bidding. This area also has a confluence with the recent monthly lows.

2. Decentraland (MANA)

Decentraland MANA defines itself as a virtual reality platform powered by the Ethereum blockchain that allows users to create, experience, and monetise content and applications. In this virtual world, users purchase plots of land that they can later navigate, build on and monetise. Decentraland uses two tokens: MANA and LAND. MANA is an ERC-20 token that must be burned to acquire non-fungible ERC-721 LAND tokens. MANA tokens can also be used to pay for a range of avatars, wearables, names, and more on the Decentraland marketplace.

MANA Price Analysis

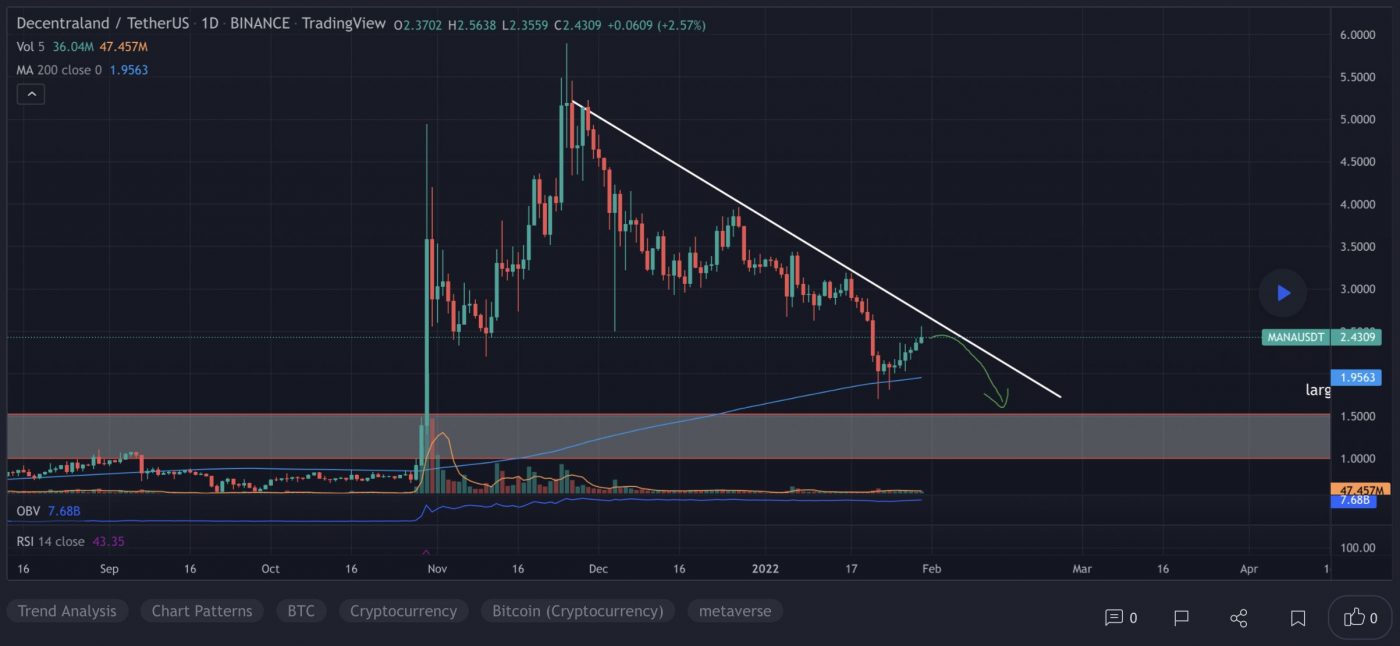
At the time of writing, MANA is ranked the 31st cryptocurrency globally and the current price is US$2.44. Let’s take a look at the chart below for price analysis:

Source: TradingView

Like many other altcoins, MANA set a new all-time high during Q3 2021 before retracing 65% to the low at $2.10 last week.

Price broke through resistance near $2.40, which may mark an area of possible support on a retracement. If this support fails, bulls might also step in near $2.25. However, a drop this far increases the chances of a stop run to $2.15 and possibly into support near $2.00. For now, continuing bullish market conditions could help $2.30 become support.

The swing high around $2.66 gives bulls a reasonable first target, with $3.75 also likely to draw the price upward. Higher-timeframe resistance beginning near $2.91 or $3.10 could cap the move or trigger consolidations. If bullish market conditions continue, bulls might test probable resistance near new monthly highs near $3.22.

3. Enjin Coin (ENJ)

Enjin Coin ENJ is a project of Enjin, a company that provides an ecosystem of interconnected, blockchain-based gaming products. Enjin’s flagship offering is the Enjin Network, a social gaming platform through which users can create websites and clans, chat, and host virtual item stores. Enjin Coin is a digital store of value used to back the value of blockchain assets such as non-fungible tokens (NFTs).

ENJ Price Analysis

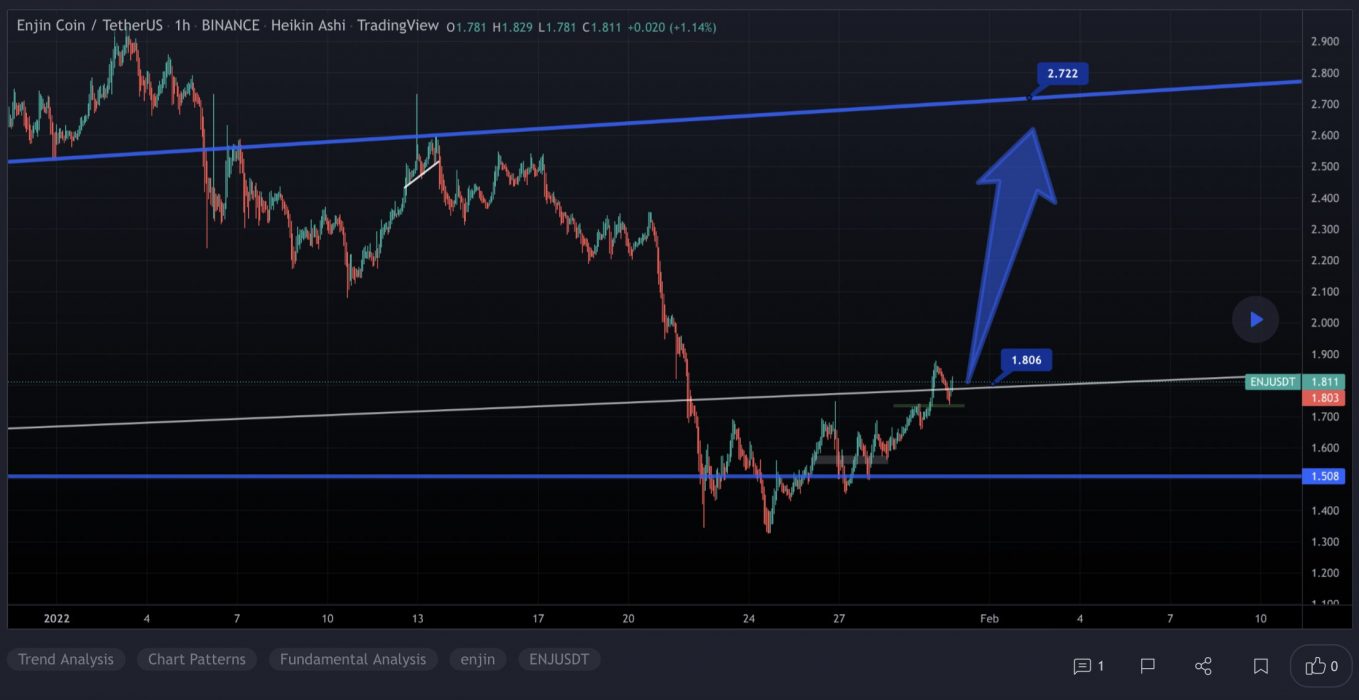
At the time of writing, ENJ is ranked the 58th cryptocurrency globally and the current price is US$1.81. Let’s take a look at the chart below for price analysis:

Source: TradingView

ENJ spent January ranging across the monthly open, reaching 20% over and 25% below. The price is currently consolidating between adjacent resistance and support at $1.60 with no clear higher-timeframe trend. A strong move over the monthly open could signal a run to resistance beginning near $2.10. 

This move would likely target the swing high at $2.19 and relatively equal highs near $2.34. A sustained bullish trend could reach up to the monthly high near $2.40.

Bulls might see a sweep of the relatively equal lows near $1.68 as a chance to buy at a discount. If this level fails to hold, the next significant area for the price to find buyers is likely near the consolidation around $1.55 and $1.48.

Learn How to Trade Live!

Join Dave and The Crypto Den Crew and they’ll show you live on a webinar how to take your crypto trading to the next level.

Where to Buy or Trade Altcoins?

These coins have high liquidity on Binance Exchange, so that could help with trading on AUD/USDT/BTC pairs. And if you’re looking at buying and HODLing cryptos, then Swyftx Exchange is an easy-to-use popular choice in Australia.

Categories
Chiliz Coin Crypto News Market Analysis Trading VeChain

Top 3 Coins to Watch Today: CHZ, VET, CELR – January 28 Trading Analysis

Let’s take a closer look at today’s altcoins showing breakout signals. We’ll explain what the coin is, then dive into the trading charts and provide some analysis to help you decide.

1. Chiliz (CHZ)

Chiliz CHZ is the leading digital currency for sports and entertainment, powering the world’s first blockchain-based fan engagement and rewards platform, Socios.com. Here, fans can purchase and trade branded fan tokens as well as having the ability to participate, influence, and vote in club-focused surveys and polls. Founded in Malta in 2018, the company’s vision is to bridge the gap between active and passive fans, providing millions of sports fanatics with a fan token that acts as a tokenised share of influence.

CHZ Price Analysis

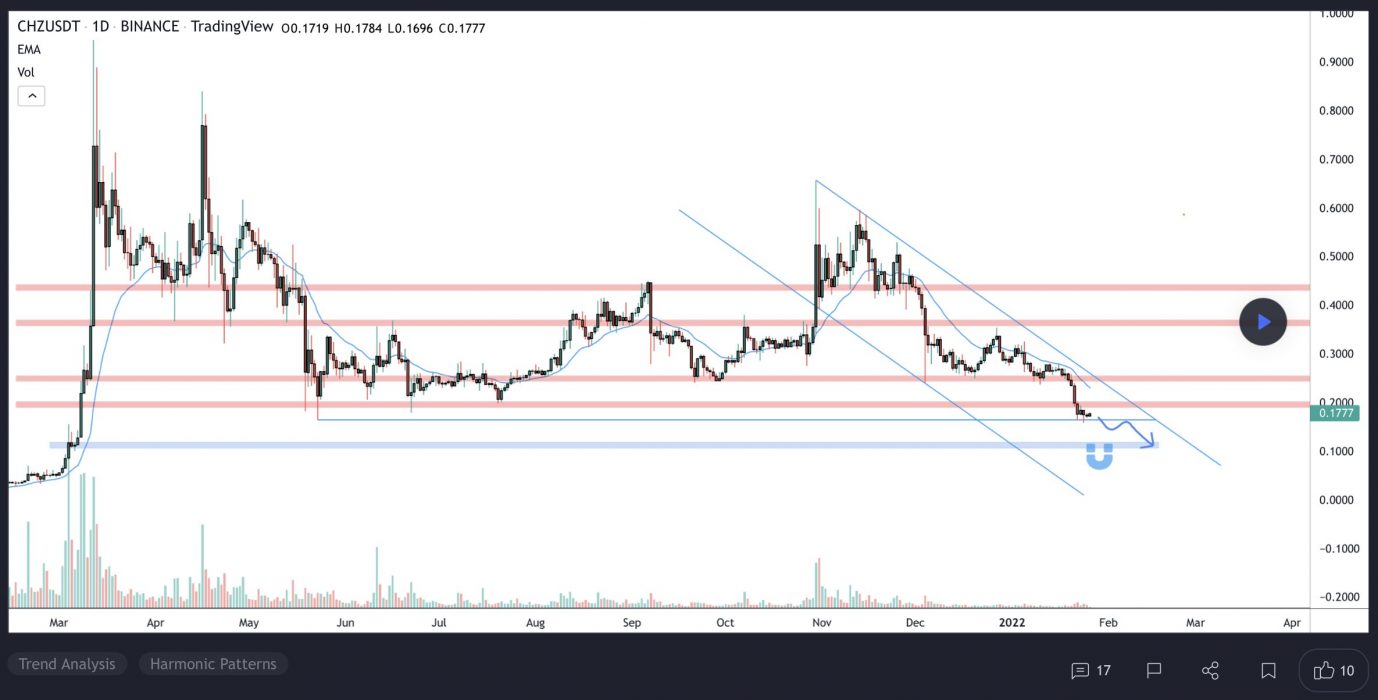
At the time of writing, CHZ is ranked the 78th cryptocurrency globally and the current price is US$0.1766. Let’s take a look at the chart below for price analysis:

Source: TradingView

CHZ‘s stunning rally to $0.4931 plummeted over 60% during January to sweep consolidation lows at $0.2055. This could set the stage for a new bullish cycle to begin. 

The price is currently balancing around the monthly open. A quick stop run into support beginning near $0.1722 could set the stage for a move into the daily gap beginning near $0.1675, potentially reaching resistance near $0.1944.

A sweep of the highs near $0.2122, followed by a sharp sell-off, could hint that bulls are preparing to run the swing high near $0.2257. This run could find the next resistance around $0.2466 in the candle wick that created the monthly high. If the market remains bullish, the price will likely reach into possible resistance near $0.2638.

2. VeChain (VET)

VeChain VET is a blockchain-powered supply chain platform. VeChain aims to use distributed governance and Internet of Things (IoT) technology to create an ecosystem that solves some of the major problems with supply chain management. The platform uses two in-house tokens, VET and VTHO, to manage and create value based on its VeChainThor public blockchain. The idea is to boost the efficiency, traceability, and transparency of supply chains while reducing costs and placing more control in the hands of individual users.

VET Price Analysis

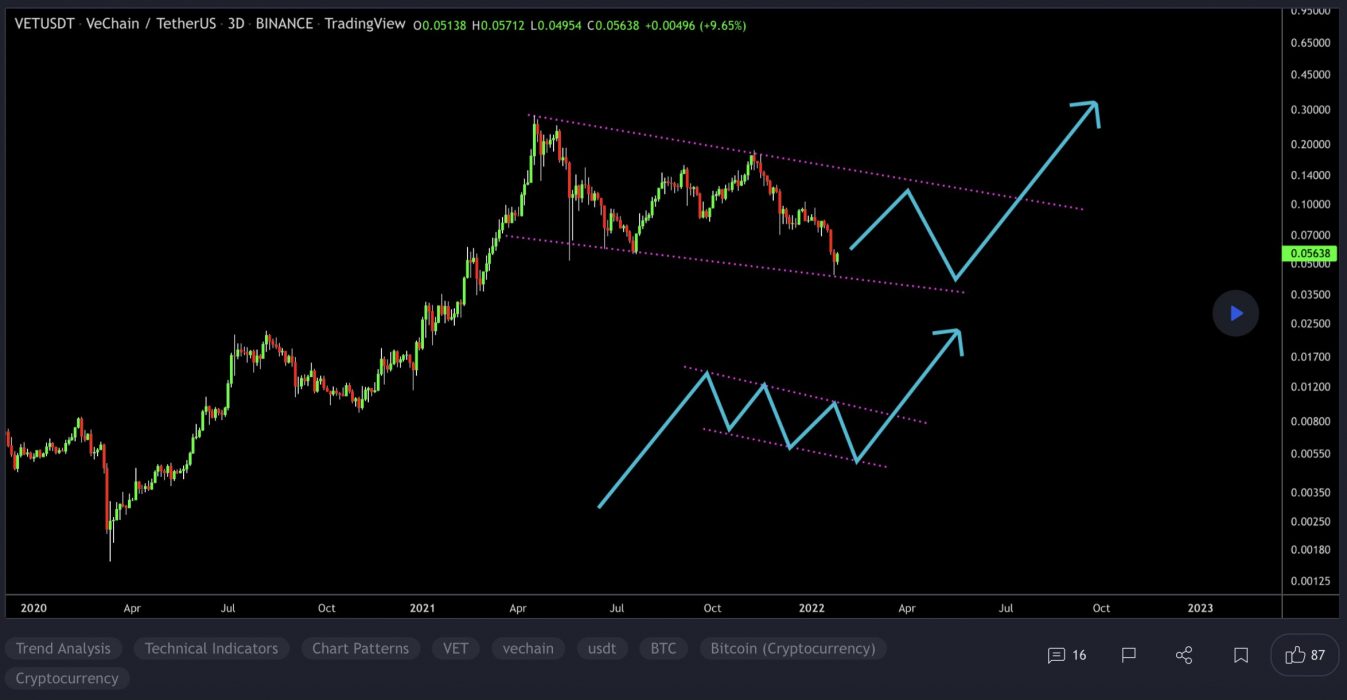
At the time of writing, VET is ranked the 35th cryptocurrency globally and the current price is US$0.05302. Let’s take a look at the chart below for price analysis:

Source: TradingView

VET‘s 75% move during late-October ran into resistance near $0.1570, at the 27% extension of the Q2 swing.

An old high and the 18 EMA have provided support near $0.06595 and might give support again on a retest. This area also has confluence with the 50% and 61.8% retracements of November’s swing.

Just below, near $0.05293, the 61.8% retracement of the current Q4 swing might also mark an area of support. 

If the market remains bearish, $0.04862 is unlikely to be revisited but could see interest from bulls during any deeper retracement.

An area near $0.07216, at the 50% extension of the summer’s swing, could see some profit-taking if bulls break the current resistance near $0.06178. Above, old consolidations near $0.06325 and $0.06582 might also provide some resistance before another round of price discovery.

2. Celer Network (CELR)

The Celer Network CELR is a smartly designed layer-2 scaling solution that provides off-chain transaction handling. The Celer platform offers fast, simple and secure off-chain transactions for both payments and smart contracts. The project was among the first to be developed using the Substrate framework and is part of the Polkadot ecosystem. As to the overall goal of the network, its founders envisioned unleashing the full potential of blockchain and revolutionising Dapps with more efficient and productive outputs.

CELR Price Analysis

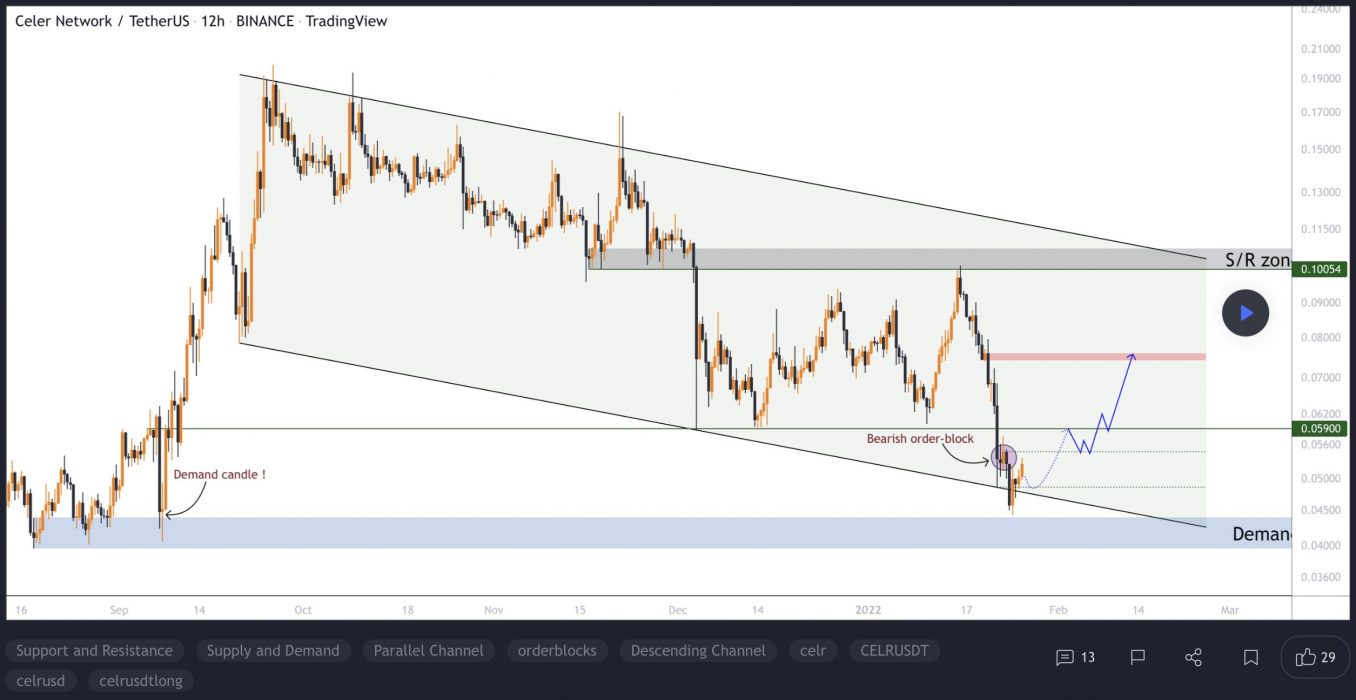
At the time of writing, CELR is ranked the 155th cryptocurrency globally and the current price is US$0.05093. Let’s take a look at the chart below for price analysis:

Source: TradingView

CELR‘s November spike retraced near $0.05141 into the consolidation that began the impulse before bouncing to $0.05366. 

This consolidation could provide support again, although bears would first have to push the price through possible support near $0.04945. The market’s structure may be shifting bearish, with $0.04825 likely to provide some support if this is the case. A sustained bearish move could reach the swing low near $0.04753 before finding support near $0.04536.

However, the bullish higher-timeframe trend may prevail, with relatively equal highs near $0.05920 potentially providing an attractive target to lure the price over the September monthly high. If so, the price could reach for the midpoint of the massive wick near $0.06577.

Learn How to Trade Live!

Join Dave and The Crypto Den Crew and they’ll show you live on a webinar how to take your crypto trading to the next level.

Where to Buy or Trade Altcoins?

These coins have high liquidity on Binance Exchange, so that could help with trading on AUD/USDT/BTC pairs. And if you’re looking at buying and HODLing cryptos, then Swyftx Exchange is an easy-to-use popular choice in Australia.
Categories
Crypto News Market Analysis Trading

Top 3 Coins to Watch Today: SHIB, HBAR, LUNA – January 27 Trading Analysis

Let’s take a closer look at today’s altcoins showing breakout signals. We’ll explain what the coin is, then dive into the trading charts and provide some analysis to help you decide.

1. Shiba Inu (SHIB)

Shiba Inu SHIB coin was created anonymously in August 2020 under the pseudonym “Ryoshi”. The meme coin quickly gained speed and value as a community of investors was drawn in by the cute charm of the coin, paired with headlines and tweets from personalities including Elon Musk and Vitalik Buterin.

SHIB Price Analysis

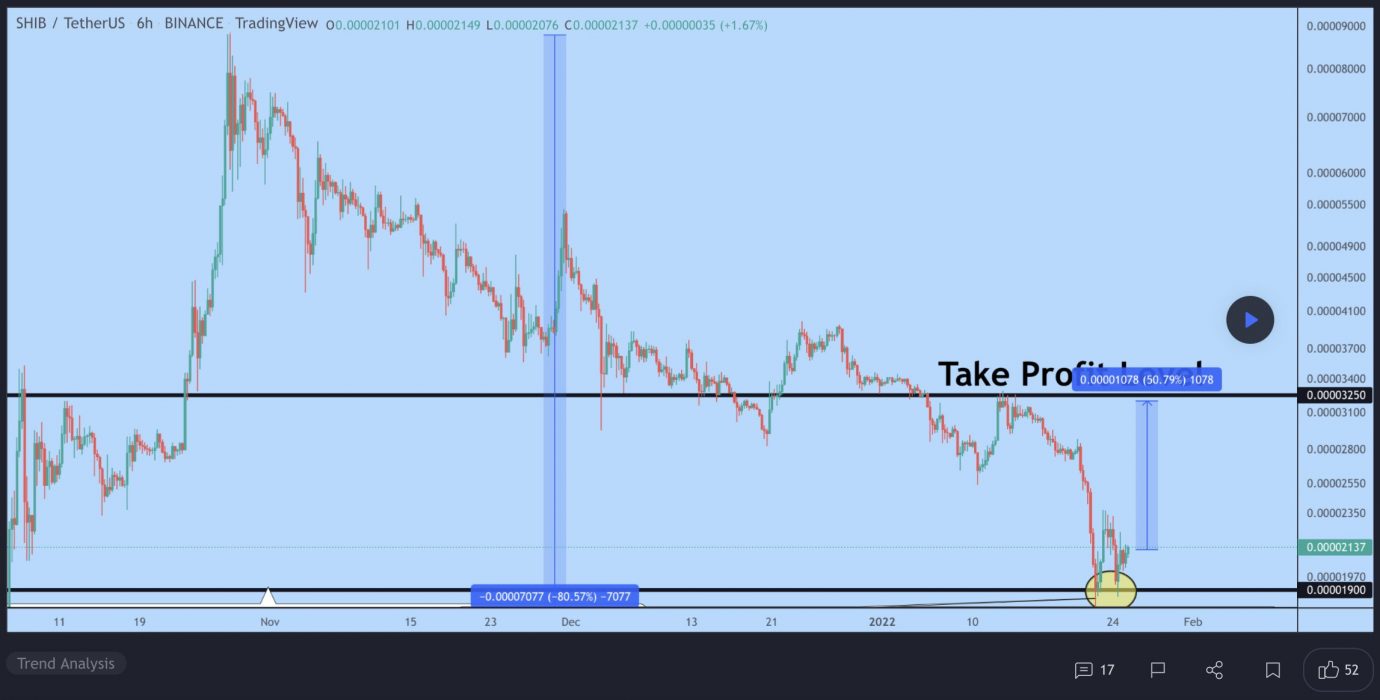
At the time of writing, SHIB is ranked the 15th cryptocurrency globally and the current price is US$0.00002248. Let’s take a look at the chart below for price analysis:

Source: TradingView

SHIB performed well during late Q3, rocketing upward over 360% from the first week of the month into the resistance near $0.00007832.

For the past several weeks, the price has been moving in a falling wedge and appears to be flipping old support near $0.00002142 to resistance. If this level breaks – perhaps due to the tempting daily equal lows below – the next support begins near $0.00001829.

Bulls entering at these levels could set their first target near the previous resistance near $0.00002680. Beyond this level, probable targets include the new monthly highs near $0.00002824 and the resistance above near $0.00003092.

A break of this resistance later this month could continue to the new weekly highs near $0.00003322 and $0.00003654.

2. Hedera (HBAR)

Hedera Hashgraph HBAR is a public network that allows individuals and businesses to create powerful decentralised applications (DApps). It is designed to be a fairer, more efficient system that eliminates some of the limitations older blockchain-based platforms face, such as slow performance and instability. The HBAR token has a dual role within the Hedera public network.

HBAR Price Analysis

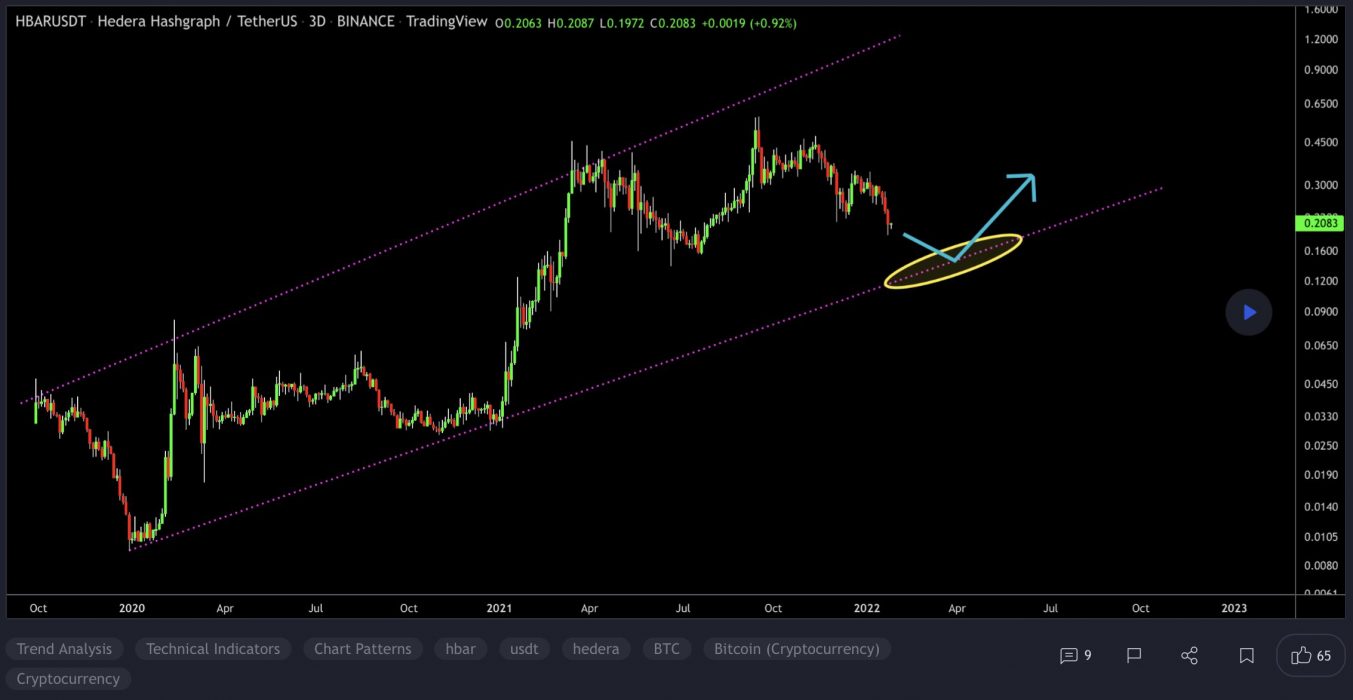
At the time of writing, HBAR is ranked the 34th cryptocurrency globally and the current price is US$0.2203. Let’s take a look at the chart below for price analysis:

Source: TradingView

HBAR‘s 54% December run retraced almost to its origin, narrowly missing probable support near $0.2095 before bears swatted down the bounce near resistance around $0.2389.

With the daily gap between $0.2212 and $0.2164 almost filled in a single wick, the price may not need to revisit areas below this level. However, the safer entry is still in probable support between $0.1945 and $0.1836, which would also sweep the lows of last week’s bounce.

The relatively equal highs near $0.2522 provide a likely first target on lower timeframes. However, the resistance beginning at $0.2935 may initially suppress a further move up.

A clean break through this resistance will need to contend with the next resistance near $0.3192, under the last swing high. This swing high at $0.3470 gives a reasonable take-profit area before a possible move to the 1.0 extension near $0.3625.

3. Terra (LUNA)

Terra LUNA is a blockchain protocol that uses fiat-pegged stablecoins to power price-stable global payments systems. According to its whitepaper, Terra combines the price stability and wide adoption of fiat currencies with the censorship-resistance of Bitcoin, and offers fast and affordable settlements. Terra’s native token, LUNA, is used to stabilise the price of the protocol’s stablecoins. LUNA holders are also able to submit and vote on governance proposals, giving it the functionality of a governance token.

LUNA Price Analysis

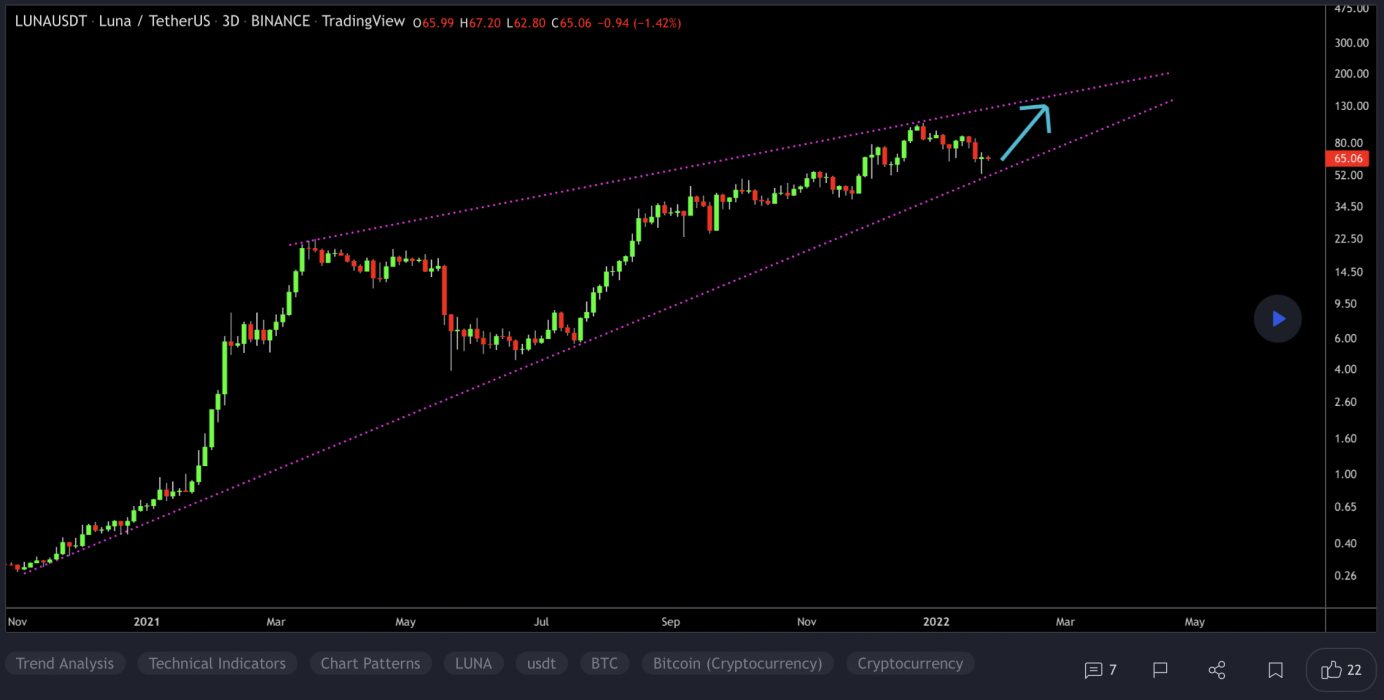
At the time of writing, LUNA is ranked the 9th cryptocurrency globally and the current price is US$64.29. Let’s take a look at the chart below for price analysis:

Source: TradingView

After breaking its monthly high last week,  LUNA began a range that has been whiplashing both bulls and bears.

Resistance beginning near $85.23 held the price down for the weekly opening, although bulls have shown some strength near the 9 and 18 EMAs. 

A quick drop to $58.37, or into the zone beginning near $52.87, could give bulls the fuel to push through the nearby resistance. If this resistance breaks, the high near $69.47 provides a reasonable target. 

A break of this level could move further into uncharted territory with the nearest probable resistances projected around $74.28 and $78.57.

More patient bulls might be waiting far below the 40 EMA with bids close to the higher-timeframe range’s 61.8% retracement, near $47.59.

Learn How to Trade Live!

Join Dave and The Crypto Den Crew and they’ll show you live on a webinar how to take your crypto trading to the next level.

Where to Buy or Trade Altcoins?

These coins have high liquidity on Binance Exchange, so that could help with trading on AUD/USDT/BTC pairs. And if you’re looking at buying and HODLing cryptos, then Swyftx Exchange is an easy-to-use popular choice in Australia.
Categories
Crypto News Market Analysis Trading

Top 3 Coins to Watch Today: FTM, NEAR, REN – January 26 Trading Analysis

Let’s take a closer look at today’s altcoins showing breakout signals. We’ll explain what the coin is, then dive into the trading charts and provide some analysis to help you decide.

1. Fantom (FTM)

Fantom FTM is a directed acyclic graph (DAG) smart contract platform providing decentralised finance (DeFi) services to developers using its own bespoke consensus algorithm. Together with its in-house token FTM, Fantom aims to solve problems associated with smart-contract platforms – specifically transaction speed, which developers say they have reduced to under two seconds.

FTM Price Analysis

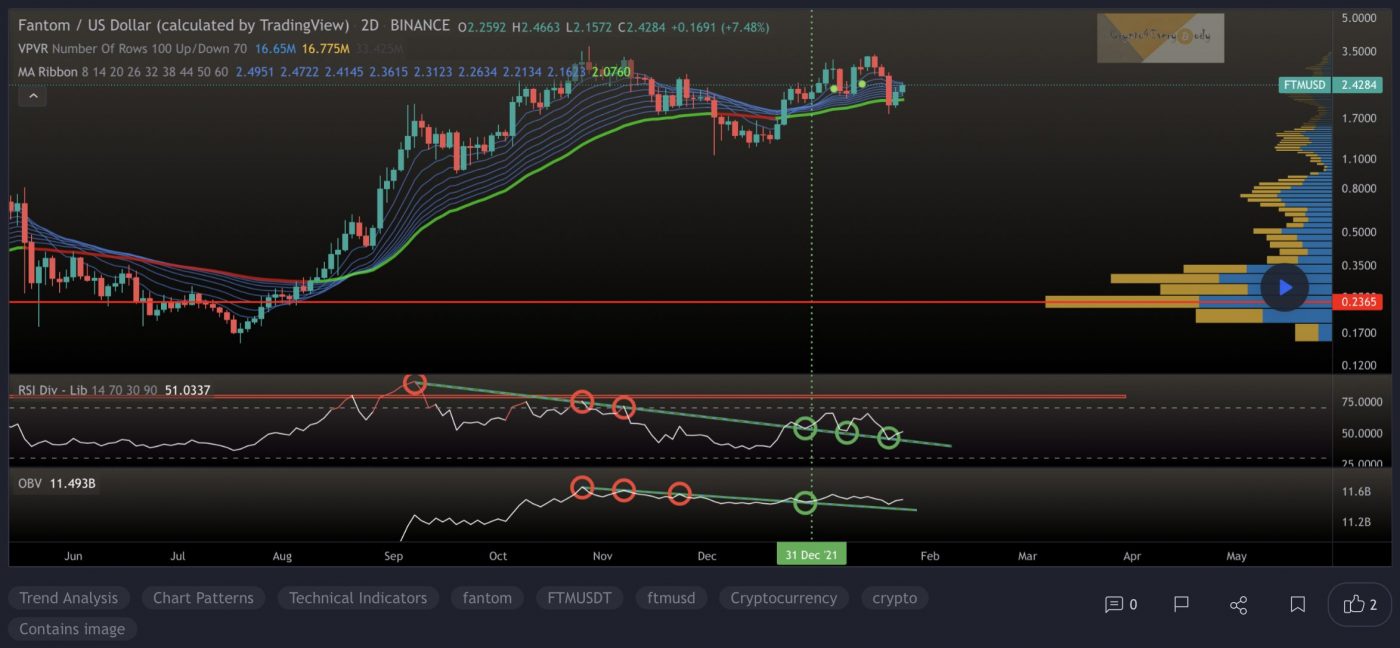
At the time of writing, FTM is ranked the 25th cryptocurrency globally and the current price is US$2.42. Let’s take a look at the chart below for price analysis:

Source: TradingView

FTM‘s bounce since mid-December ran into resistance near the old all-time highs. This rejection created a set of relatively equal highs near $3.35, possibly forming the next bullish leg’s target. Until then, the price will likely encounter resistance near $2.76.

Currently, the price is testing possible support near the January open, around $2.19. This level also has confluence with the 78.6% retracement of the current local range and the 18 and 40 EMAs. 

If this level fails to provide support, a zone from $1.95 to $1.82 might mark a possible swing low or consolidation area. This zone is between the 61.8% and 78.6% retracement of December’s swing.

A more bearish tone in the market could propel the price lower. The December lows, near $1.60, might mark an area of possible support as well as a bearish target.

2. Near Protocol (NEAR)

NEAR Protocol is a decentralised application platform designed to make apps usable on the web. The network runs on a Proof-of-Stake (PoS) consensus mechanism called Nightshade, which aims to offer scalability and stable fees. NEAR uses human-readable account names, unlike the cryptographic wallet addresses common to Ethereum. NEAR also introduces unique solutions to scaling problems and has its own consensus mechanism called “Doomslug.”

NEAR Price Analysis

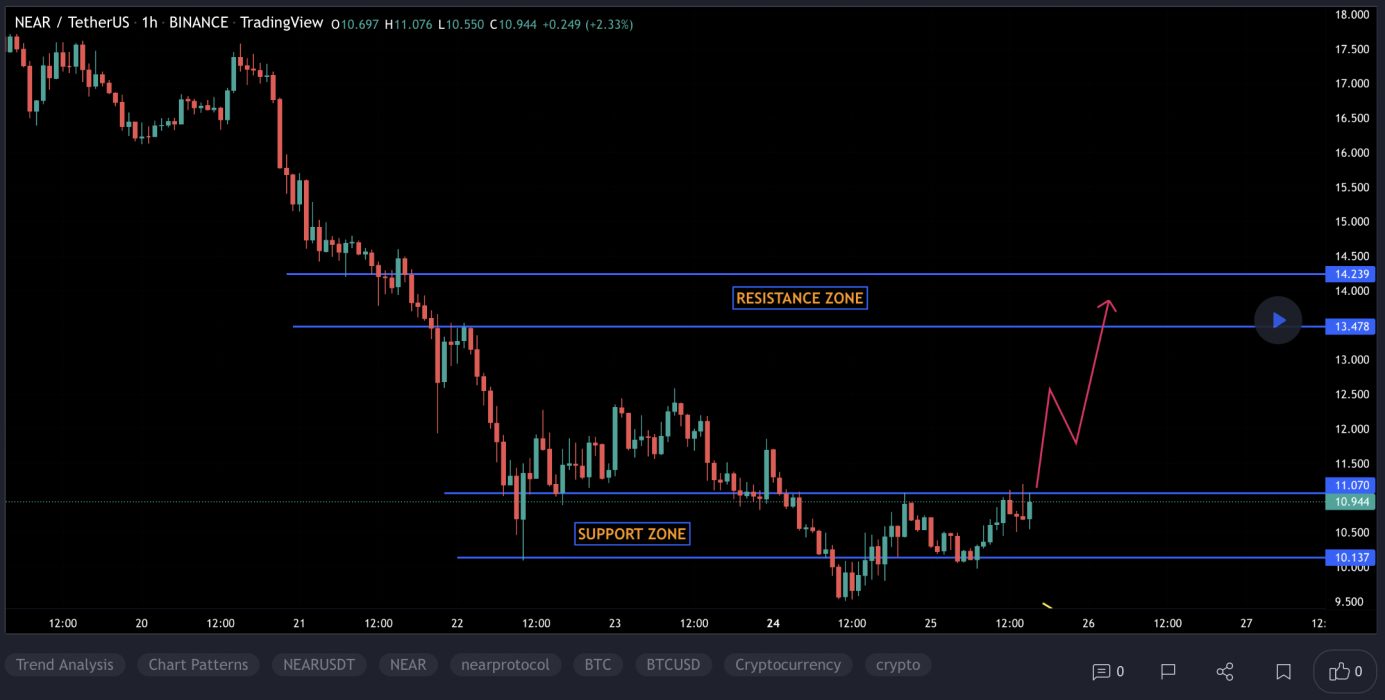
At the time of writing, NEAR is ranked 24th cryptocurrency globally and the current price is US$11.60. Let’s take a look at the chart below for price analysis.

Source: TradingView

NEAR tore upward into price discovery during January before pausing at resistance near the main move’s 0.68 extension.

The price range beginning at $10.57 provides the first potential support for an early-week dip. Just below this range, the previous swing high and accumulation near $9.84 could provide more substantial support.

A significant market drop could reach as low as the consolidation range beginning at $8.79, supported by mid-December.

It’s impossible to predict where the price in discovery will go, but the last high at $14.89 provides the first probable target. Extensions from the primary move hint at $15.15, and $16.85 as probable take-profit zones.

3. Ren (REN)

REN is an open protocol built to provide interoperability and liquidity between different blockchain platforms. The protocol’s native token, REN, functions as a bond for those running nodes that power RenVM, known as Darknodes. REN aims to expand the interoperability, and hence accessibility, of decentralised finance (DeFi) by removing hurdles involved in liquidity between blockchains.

REN Price Analysis

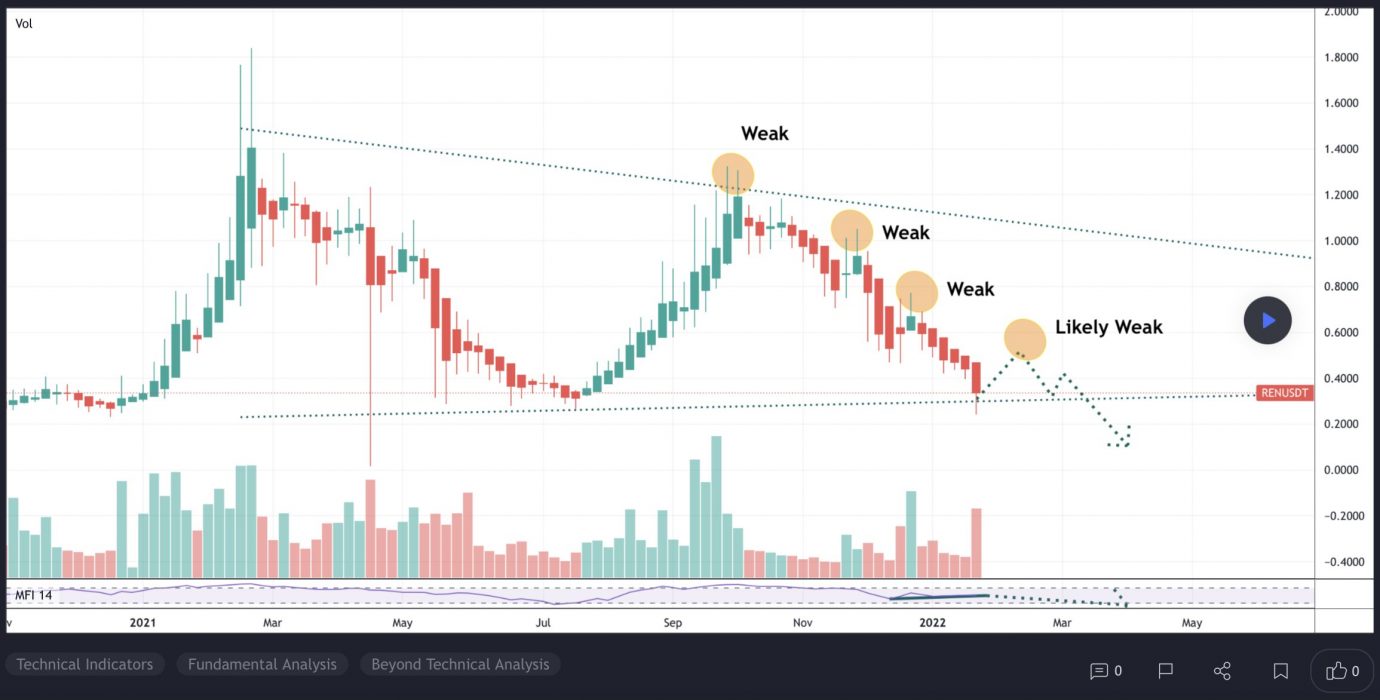
At the time of writing, REN is ranked the 146th cryptocurrency globally and the current price is US$0.2962. Let’s take a look at the chart below for price analysis:

Source: TradingView

REN bulls have enjoyed over 120% returns since Q3 2021, with little resistance above to end the current price discovery.

The price may find support near $0.2644. Still, aggressive bulls should be wary of a potential stop run under the monthly open into support near $0.2413. The area around $0.2250 should provide strong support if the price reaches this low.

The air above the current price is thin, but the level near $0.3026 could potentially provide some resistance in the short term. Extensions reaching near $0.3277 and $0.3492 make reasonable take-profit zones if the bullish trend continues.

Learn How to Trade Live!

Join Dave and The Crypto Den Crew and they’ll show you live on a webinar how to take your crypto trading to the next level.

Where to Buy or Trade Altcoins?

These coins have high liquidity on Binance Exchange, so that could help with trading on AUD/USDT/BTC pairs. And if you’re looking at buying and HODLing cryptos, then Swyftx Exchange is an easy-to-use popular choice in Australia. You can also buy these coins from different exchanges listed on CoinMarketCap.
Categories
Crypto News Market Analysis Polkadot Trading

Top 3 Coins to Watch Today: DOT, LOOKS, WOO – January 25 Trading Analysis

Let’s take a closer look at today’s altcoins showing breakout signals. We’ll explain what the coin is, then dive into the trading charts and provide some analysis to help you decide.

1. Polkadot (DOT)

Polkadot DOT is an open-source sharding multichain protocol that facilitates the cross-chain transfer of any data or asset types, not just tokens, thereby making a wide range of blockchains interoperable with each other. Polkadot’s native DOT token serves three clear purposes: providing network governance and operations, and creating parachains by bonding. The Polkadot protocol connects public and private chains, permissionless networks, oracles and future technologies, allowing these independent blockchains to trustlessly share information and transactions through the Polkadot relay chain.

DOT Price Analysis

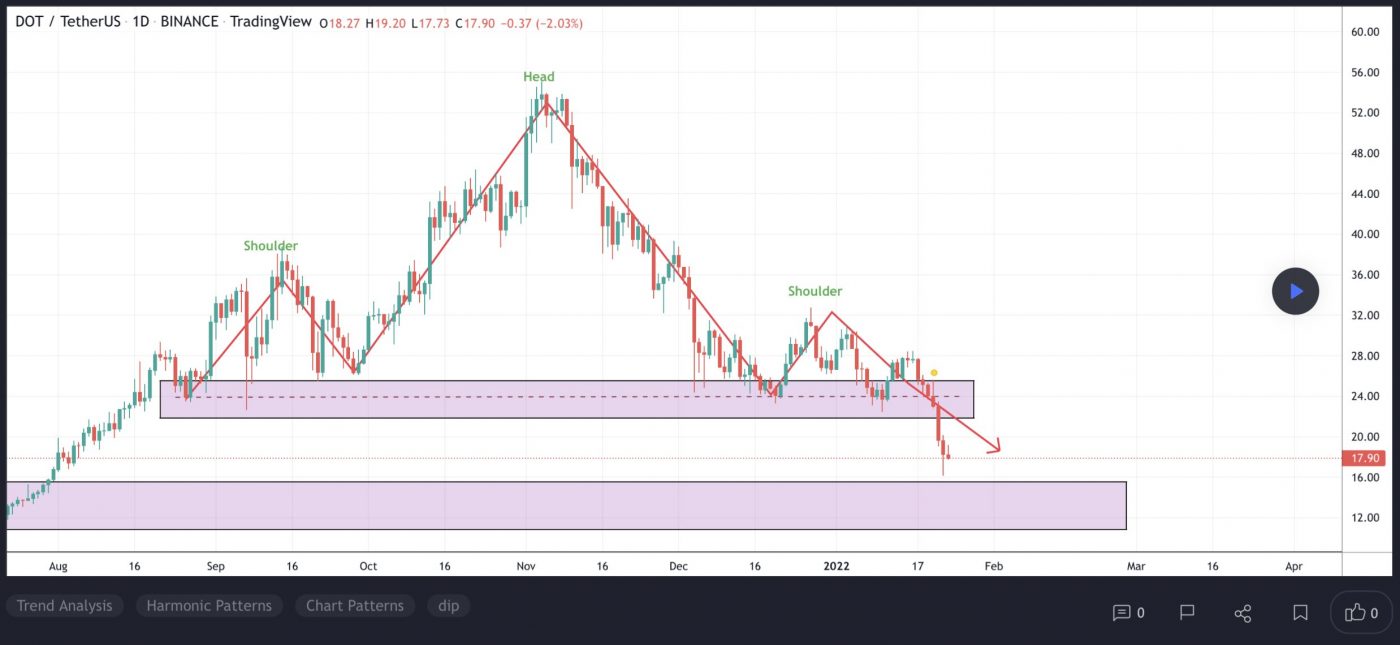
At the time of writing, DOT is ranked the 11th cryptocurrency globally and the current price is US$16.89. Let’s take a look at the chart below for price analysis:

Source: TradingView

DOT has retraced nearly 71% since its high in early November, showing little sign of interest from buyers.

December and early January’s consolidation at possible support from $21.68 to $23.57 broke down with the rest of the market last week, turning this into likely resistance on future retests. This area now has confluence with the 9 and 18 EMAs.

If market conditions turn and this resistance breaks, an area near the midpoint of December’s consolidation range and the 2021 open, near $27.70, and the high of December’s consolidation range, near $30.88, might see profit-taking from bulls.

The first test of possible support near $16.40 showed some sensitivity. Still, continued bearishness in the market will likely cause a break of this level.

A break of this support might continue to drop to the next possible support near $10.37, running stops under July’s swing low. 

If this level gives support and begins a consolidation forming a bottom, bulls might wait for a wick below to possible support from $7.16 to $5.47 at the high of 2020’s consolidation range.

2. LooksRare (LOOKS)

LOOKS is the token powering LooksRare, the community-focused NFT marketplace that actively rewards traders and creators for participating. One hundred percent of LooksRare’s platform trading fees are earned by LOOKS token stakers: a rewards model created in direct response to the previous generation of NFT marketplaces whose fees mostly reward a single entity. Users earn LOOKS tokens by trading NFTs on LooksRare, staking LOOKS, which also earns WETH fees, and more.

LOOKS Price Analysis

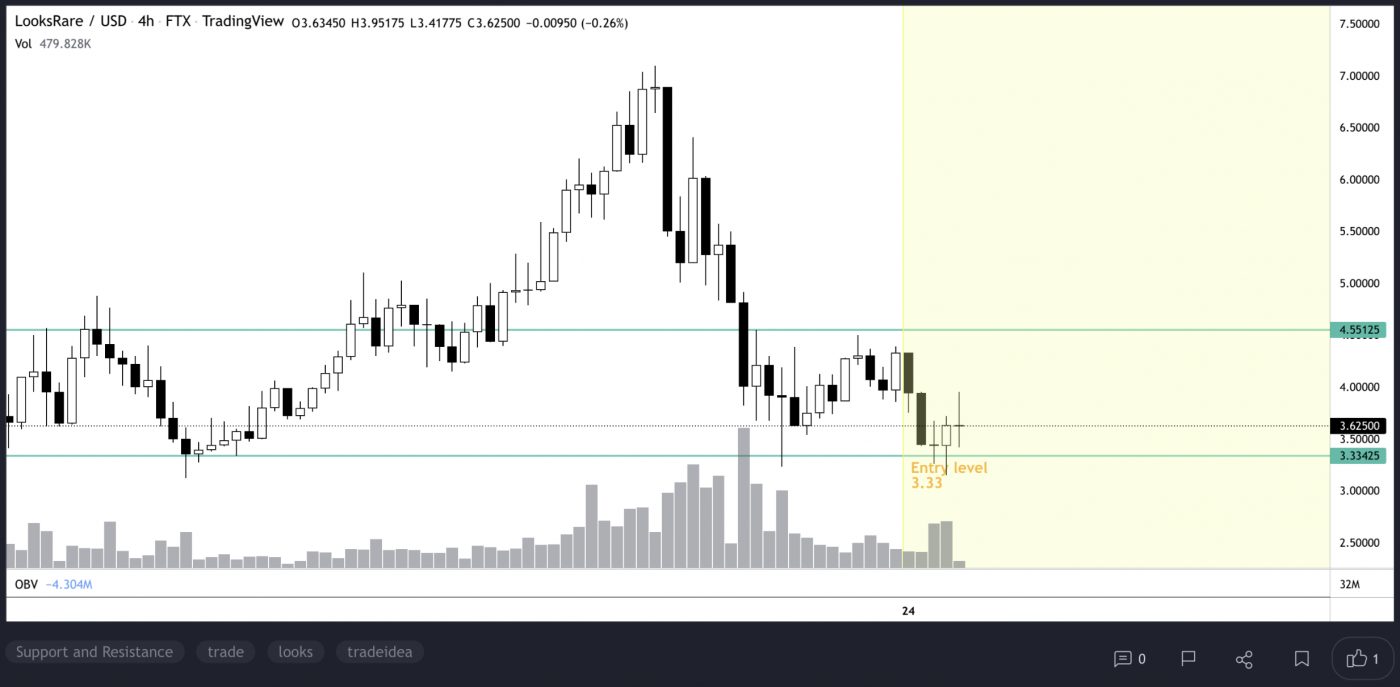
At the time of writing, LOOKS is ranked the 2830th cryptocurrency globally and the current price is US$3.56. Let’s take a look at the chart below for price analysis:

Source: TradingView

The 173% surge in LOOKS has retraced 54%, with no high-timeframe levels and low-probability market conditions offering little insight into where a longer-term bottom may form.

The price broke through, then consolidated, near possible support around $4.12. This level is between the 61.8% and 78.6% retracement levels. The current bearish market conditions for more sellers increase the probability of this level breaking and turning to resistance.

An area between $3.44 and $3.28 has offered support twice – and could do so on a future retest. However, each test of a level tends to weaken its strength. 

If this level breaks, the last potential support shown in historical price action is near $2.75, where the rally began on January 11.

A shift in market conditions could prompt a rally to $4.55, where an inefficient region and multiple highs create a tempting target for bulls. A more substantial rally could continue to another inefficient zone on the daily chart near $5.28, possibly spiking into a daily level near $5.86.

3. WOO Network (WOO)

WOO Network is a deep liquidity network connecting traders, exchanges, institutions and DeFi platforms with democratised access to best-in-class liquidity and trading execution at lower or zero cost. WOO Token is used in the network’s CeFi and DeFi products for staking and fee discounts. Presently, a diverse set of products and services interfacing retail, institutions, CeFi and DeFi have been built: WOO X is a zero-fee trading platform providing professional and institutional traders with best-in-class liquidity and execution. It features fully customisable modules for workspace customisation.

WOO Price Analysis

At the time of writing, WOO is ranked the 110th cryptocurrency globally and the current price is US$0.5441. Let’s take a look at the chart below for price analysis:

Source: TradingView

WOO has retraced 74% from its November highs and is currently challenging possible support near $0.5240, between the 61.8% and 78.6% retracement levels. 

If this level fails to provide support, the 78.6% retracement, near $0.4401, offers a strong draw for shorts with multiple daily swing lows and an inefficient area. 

Continued bearish conditions may cause this level to break, running all swing lows since March 2021 into the upper portion of an inefficient region starting near $0.2100. Near the midpoint and bottom of this region, lower timeframes show that $0.1320 and $0.0440 could also provide some sensitivity.

The low of early December’s consolidation, near $0.6517, and the 9 EMA may provide some resistance on any retracements. A continued rally – unlikely unless the overall market’s catalysts drastically shift – could reach over the 2021 open to $0.9727 and possibly $1.1400, where the daily chart shows a head-and-shoulders formation.

Learn How to Trade Live!

Join Dave and The Crypto Den Crew and they’ll show you live on a webinar how to take your crypto trading to the next level.

Where to Buy or Trade Altcoins?

These coins have high liquidity on Binance Exchange, so that could help with trading on AUD/USDT/BTC pairs. And if you’re looking at buying and HODLing cryptos, then Swyftx Exchange is an easy-to-use popular choice in Australia. You can also buy these coins from different exchanges listed on CoinMarketCap.

Categories
Market Analysis The Crypto Den

TradeRoom: Our Weekly Crypto Trades Analysis – Jan 24, 2022

Welcome to this weekly series from the TradeRoom. My name is Dave and I’m the founder of The Crypto Den, an Australian-based crypto trading and education community aiming to give you the knowledge to take your trading game to the next level.

Crypto Market Outlook

As I mentioned in last week’s article, we are in protecting-our-capital mode! This is because the past week has only been a good week for those trading in the futures markets and shorting – and I don’t think it’s over yet.

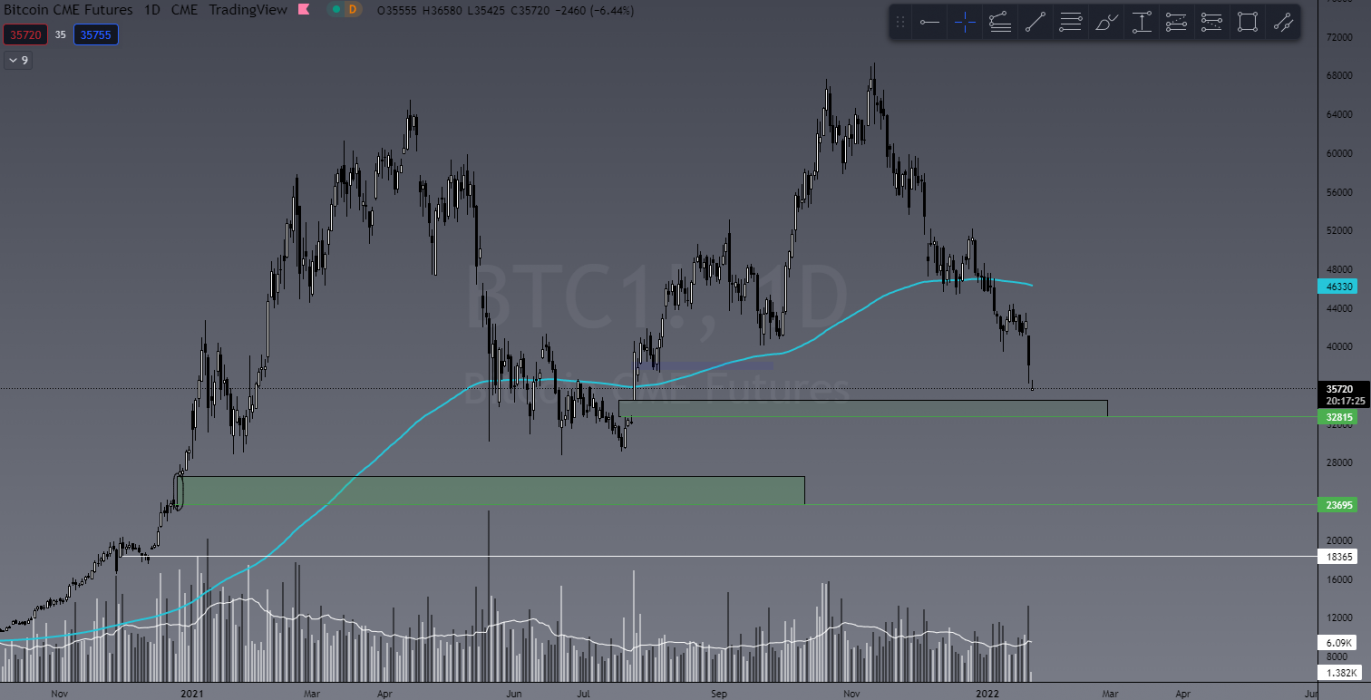
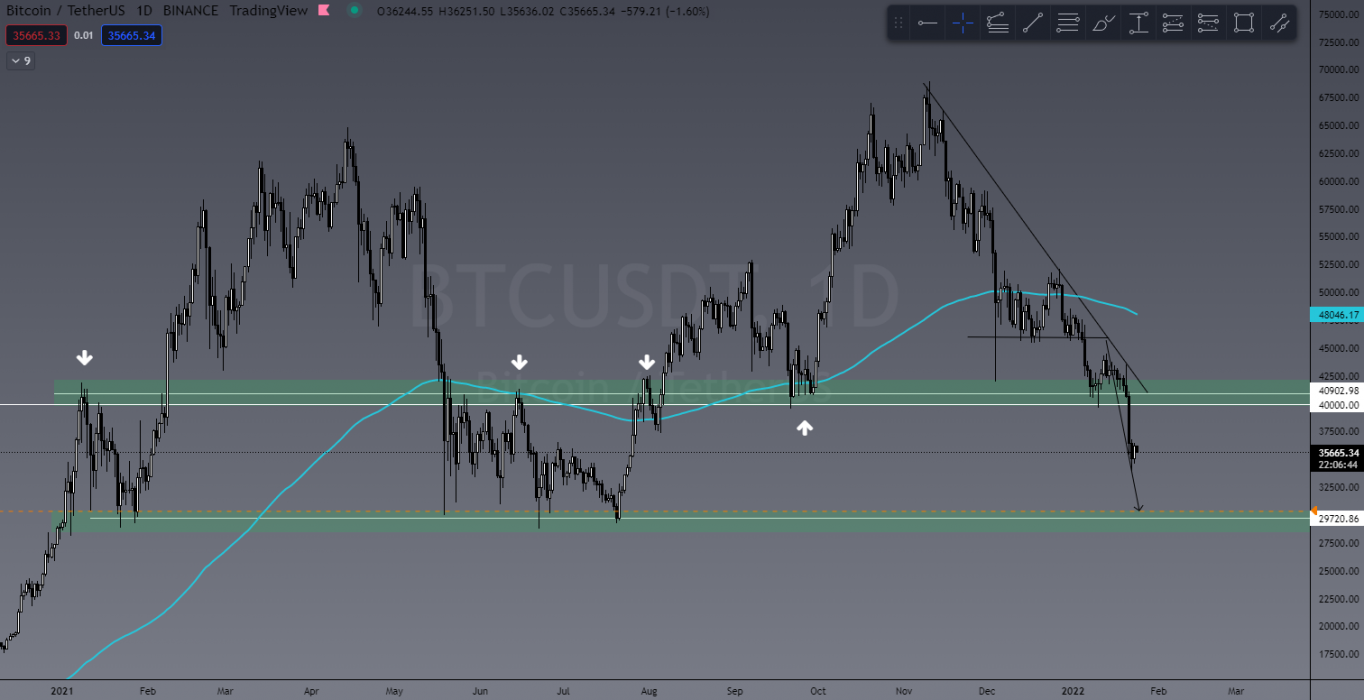
If we take a look at the Bitcoin CME Futures chart (BTC1!), you’ll see two very distinct gaps in price action displayed by the green boxes. Now, generally speaking, these gaps get “filled” (meaning price revisits those levels) 80 percent of the time. The further PA gets away from these gaps, the less likely they will be filled. That being said, we are very much in range of these gaps getting filled, which means the BTC price could very likely revisit US$32,000 and US$23,000. It’s my opinion that IF this does happen, BTC will test the previous top of the last bull cycle at US$20,000.

BTC1! chart

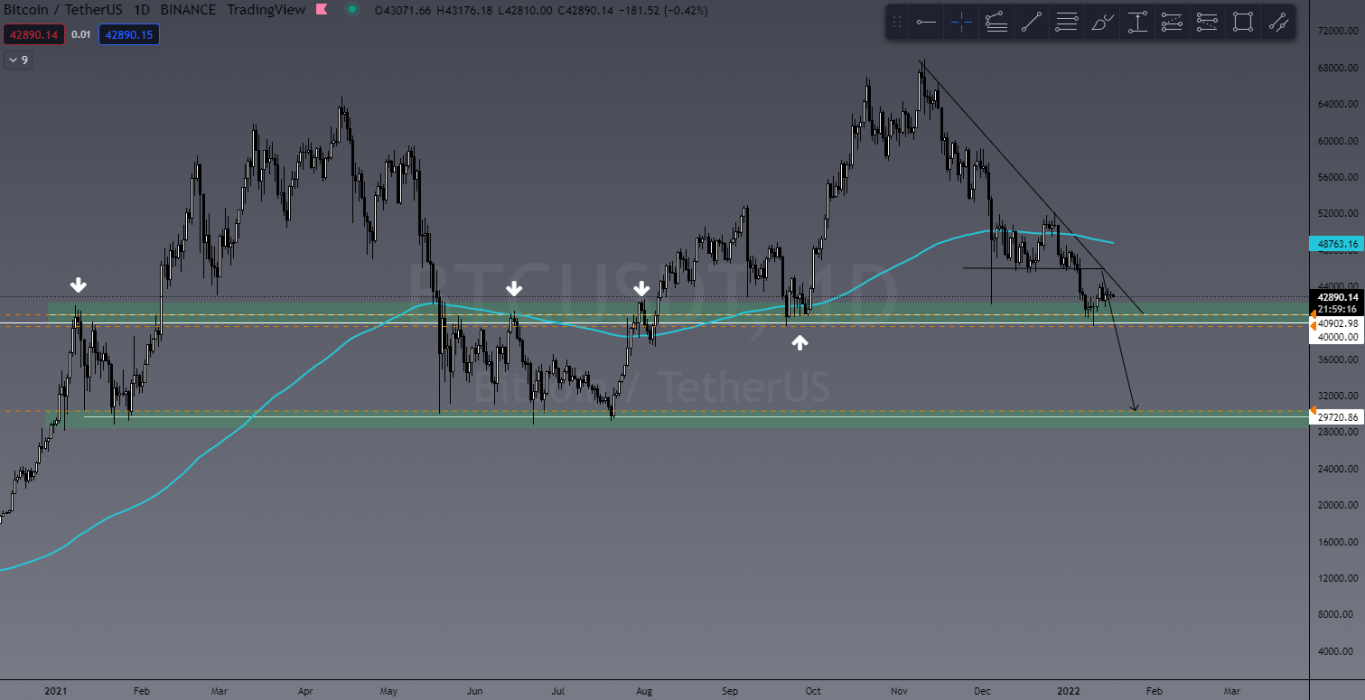
Comparing this week’s BTC chart to last week’s, you can see the target identified of US$30,000 has not yet been hit and is still very much in play. This will correlate well to the BTC1! gap closing.

We could see a very short-lived relief rally, but once again these are very short-term rallies. My money is still hedged on a further downside.

BTC/USDT chart from last week
Current BTC/USDT chart

Last Week’s Performance

LUNA/USDT

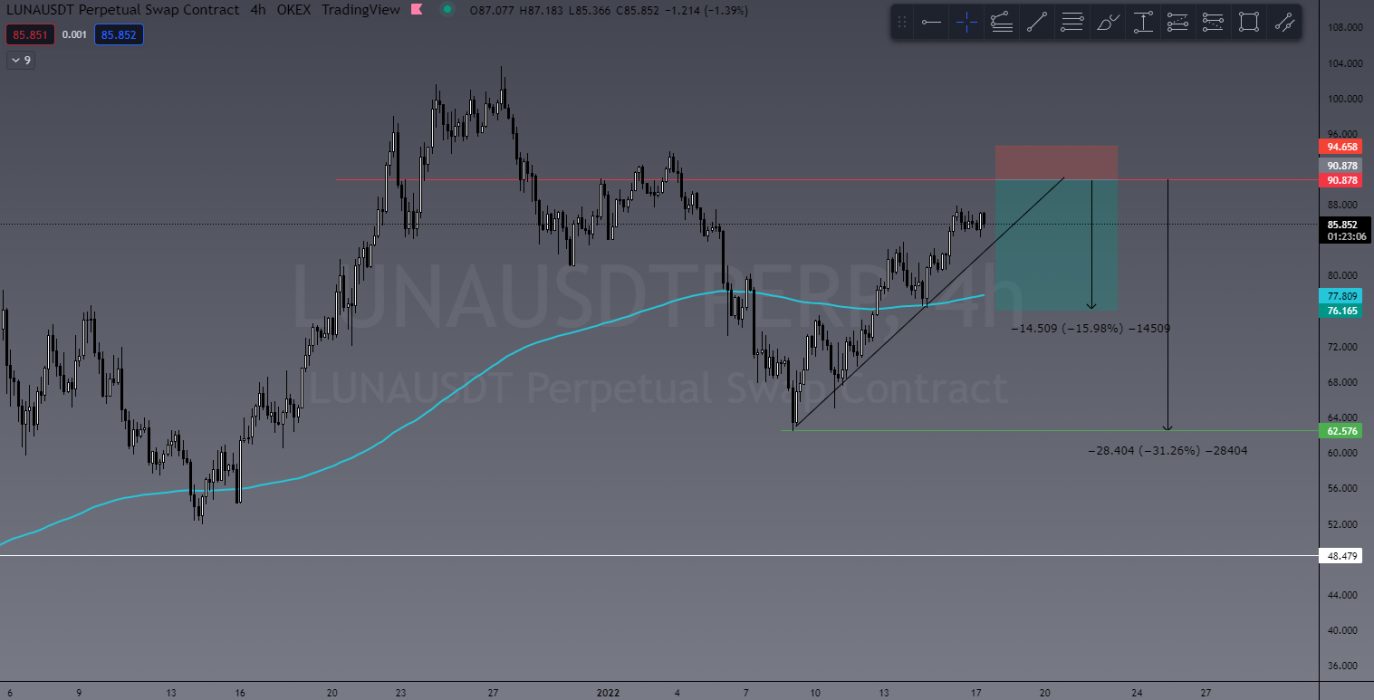
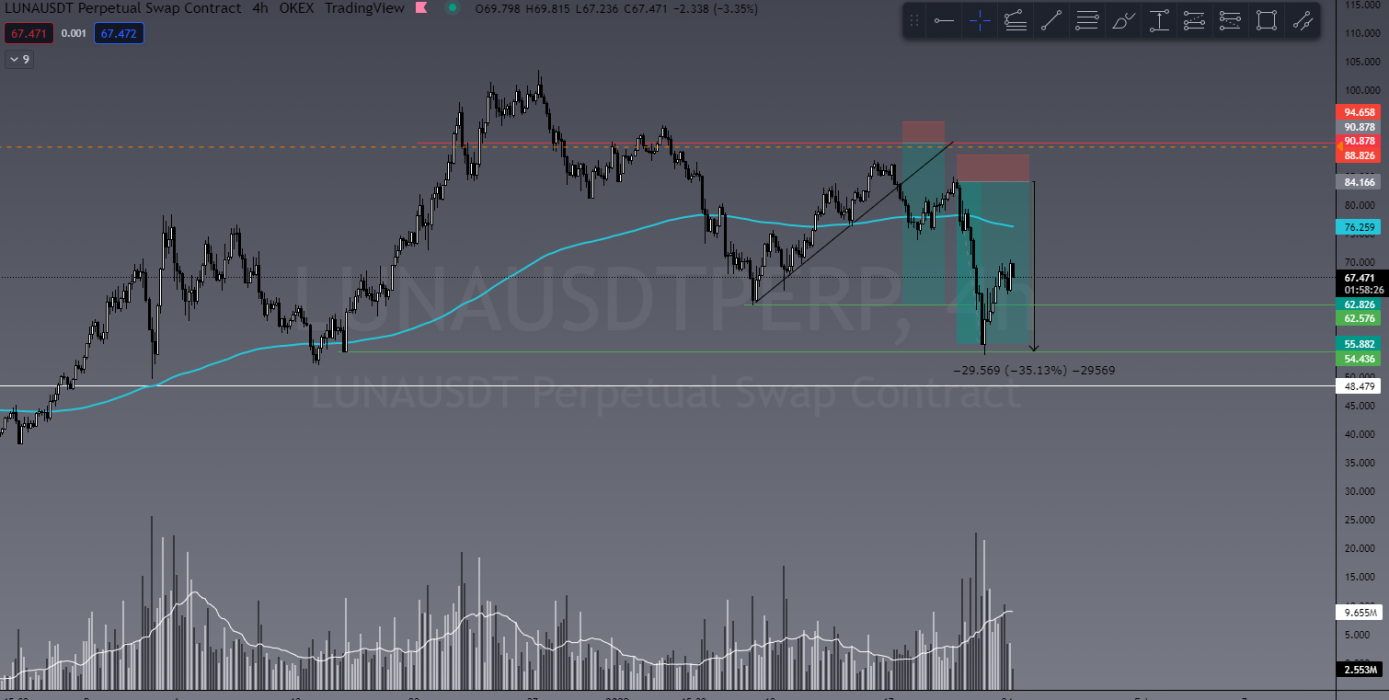
We had a great primary target for a LUNA short which unfortunately was missed, so we hit the secondary target at a retest. This was still a profitable 330% trade on only 10x leverage.

LUNA chart from last week
Current LUNA/USDT chart

NEAR/USDT

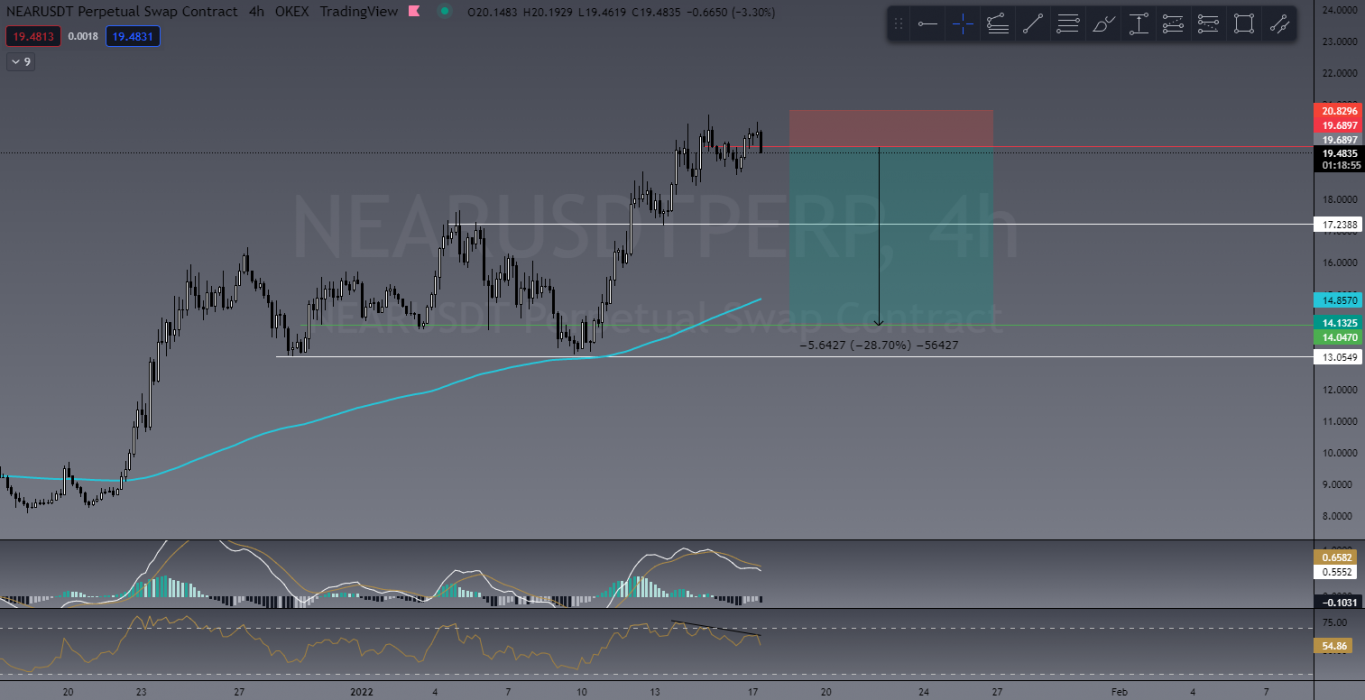
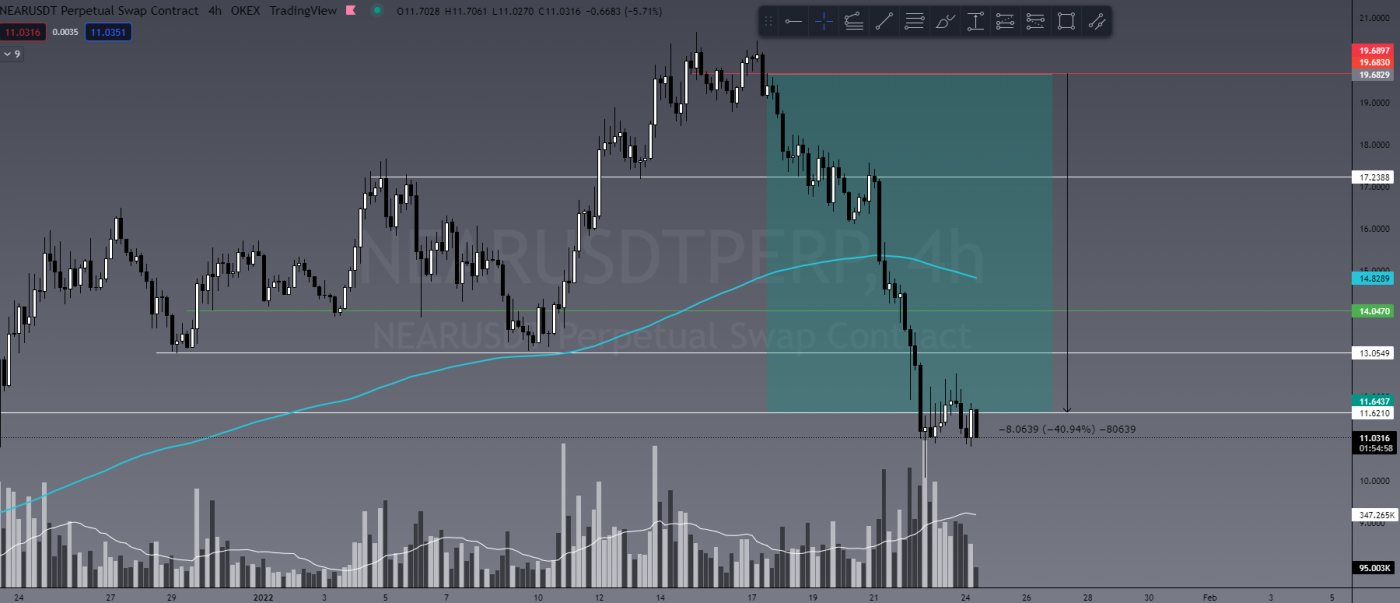
One of the biggest trades from last week was on NEAR, short closing in a whopping 400% on only 10x leverage. We correctly identified the bearish engulfing candle after some indecision and entered. This one well and truly exceeded our expectations, thanks to BTC!

BABYDOGE/USDT

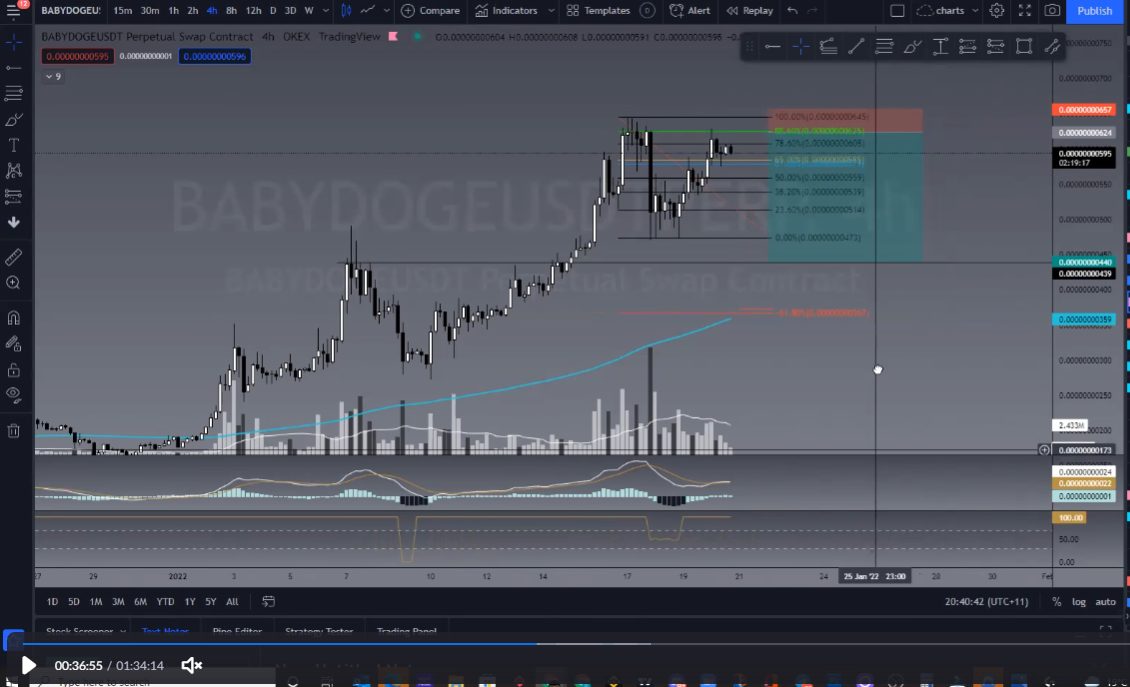
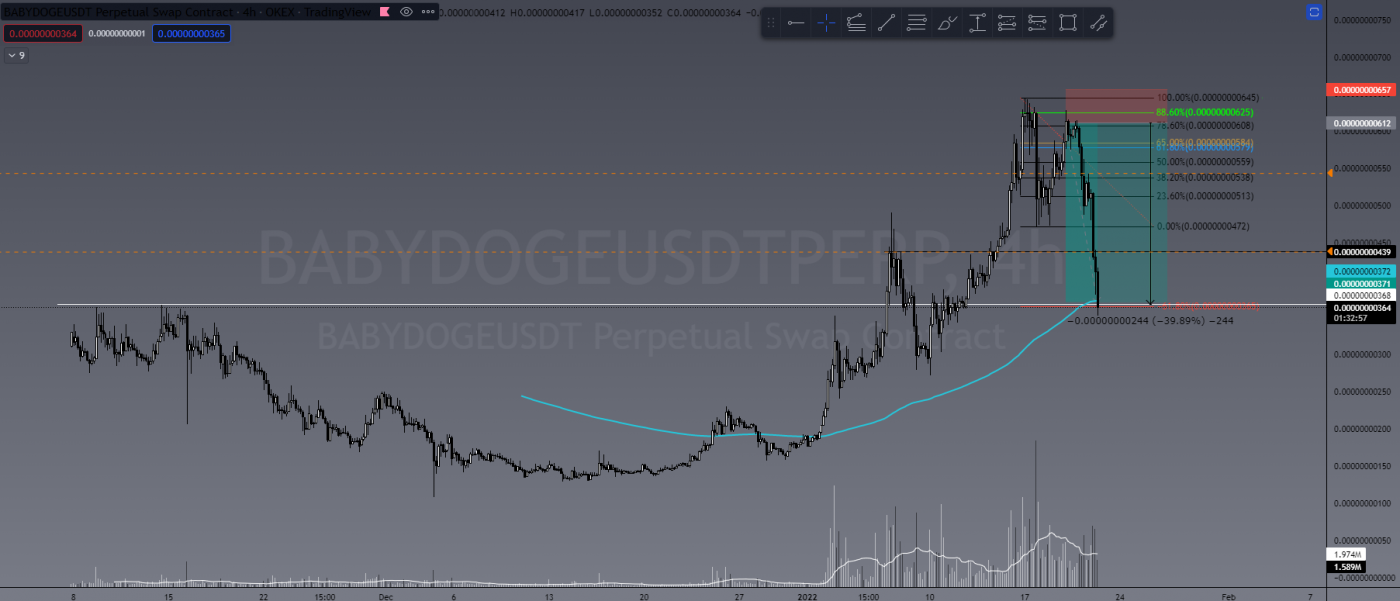
Easily my favourite trade of the week was on BABYDOGE. On a fundamental level, I have absolutely no idea what this coin even is or does and it sound ridiculous, but nevertheless the opportunity was there and we took it!

This short trade was identified in a TradeRoom live market scan and profits were taken at just under 500%. I still have some capital in this trade and have added to my position in the current relief rally. We’ll see how it plays out soon enough!

Screenshot from LIVE market scan
BABYDOGE/USDT

This Week’s Trades

BABYDOGE/USDT

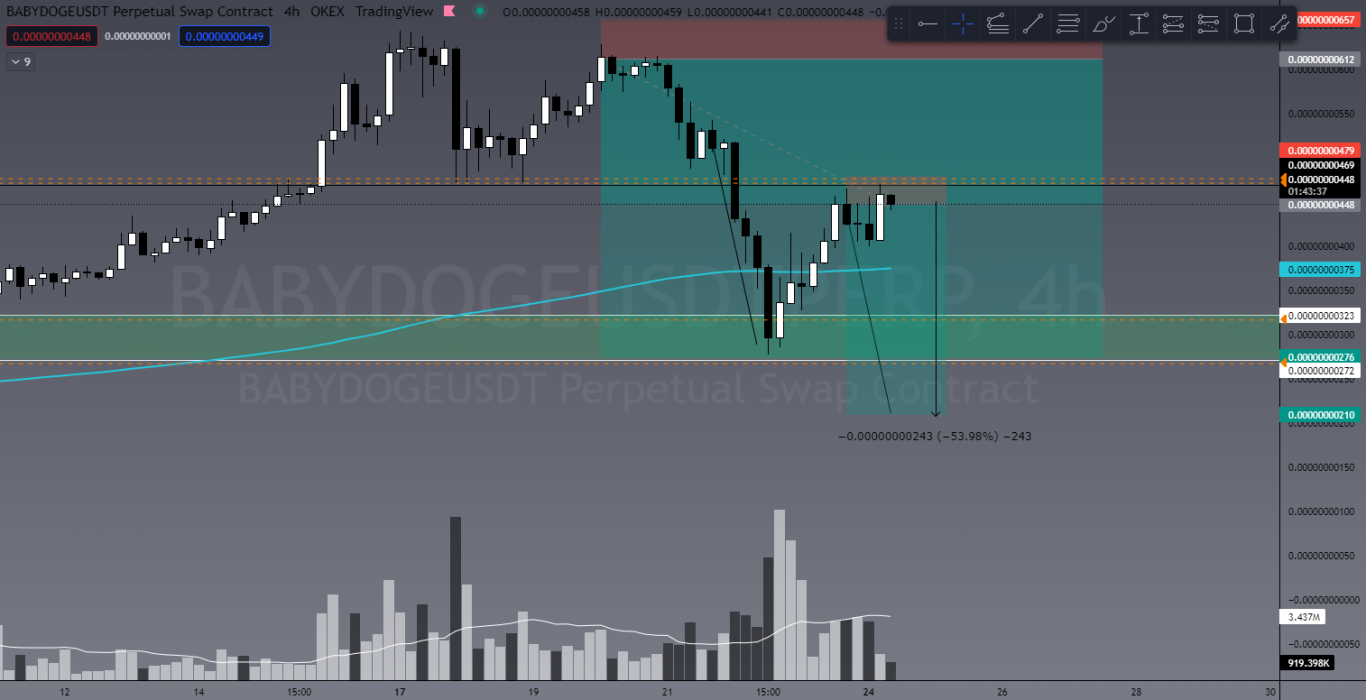
As mentioned above, I’ve added to my BABYDOGE short position here, which could be an opportunity for a new trade entry. If this plays out, it could prove to be another 500% on only 10x leverage.

BABYDOGE/USDT

ATOM/USDT

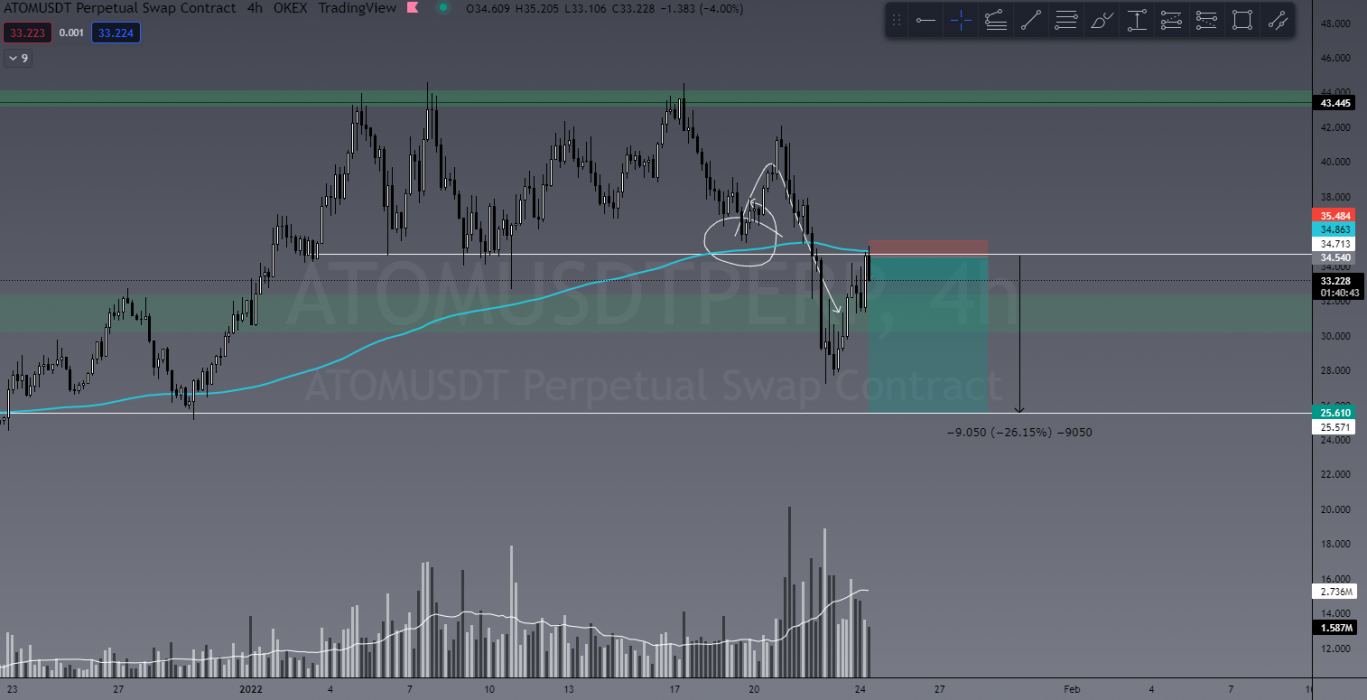
What we look for in a bearish market is the biggest relief rallies to present the better short entries. I think ATOM has painted a good push back to test previous support as resistance, and therefore presents great shorting opportunity here.

ATOM/USDT

When BTC has large dumps like this, the volatility is increased for both up and down swings, making it far less predictable than in a stable market. Because of this, we generally think it is wise to reduce capital input during times of uncertainty.


Learn to Trade

Unfortunately, due to COVID, we have had to postpone the start date for our upcoming trading course. The next live trading course for newcomers will be on Feb 28; see full details below.

The Crypto Den is holding its first of only two trading courses for 2022 on February 28! That’s right, we will only be running two programs in 2022! What makes us different? Our lessons are LIVE and come with a community where you submit your homework and receive feedback to ensure you understand what we teach!

Duration: 6 week course
Date/Time: Live trading course twice a week – Mon & Wed at 7pm AEST
Frequency: We now run our LIVE course only twice per year
Location: Zoom Webinar
From: February 28 to April 13

The Crypto Den’s Trading Fundamentals trading course is a LIVE interactive course designed to teach you how to trade the crypto markets from absolute beginner level!

Our six-week program teaches you how to set up your trade accounts using reputable exchanges and brokers, how to read the charts using technical analysis, and to protect your capital using effective risk management strategies.

We have taught thousands of students of the past five years how to trade these volatile and highly profitable markets. See our REAL reviews from REAL students.

Using ZOOM twice a week, all of our lessons are LIVE and recorded so you can access them over and over again in our structured course through our website and smartphone app. Lessons come with homework and online quizzes, as well as an amazing online and private community of students.

So what are you waiting for? Join now to start learning!


Already Know How to Trade?

Invite to Join our TradeRoom

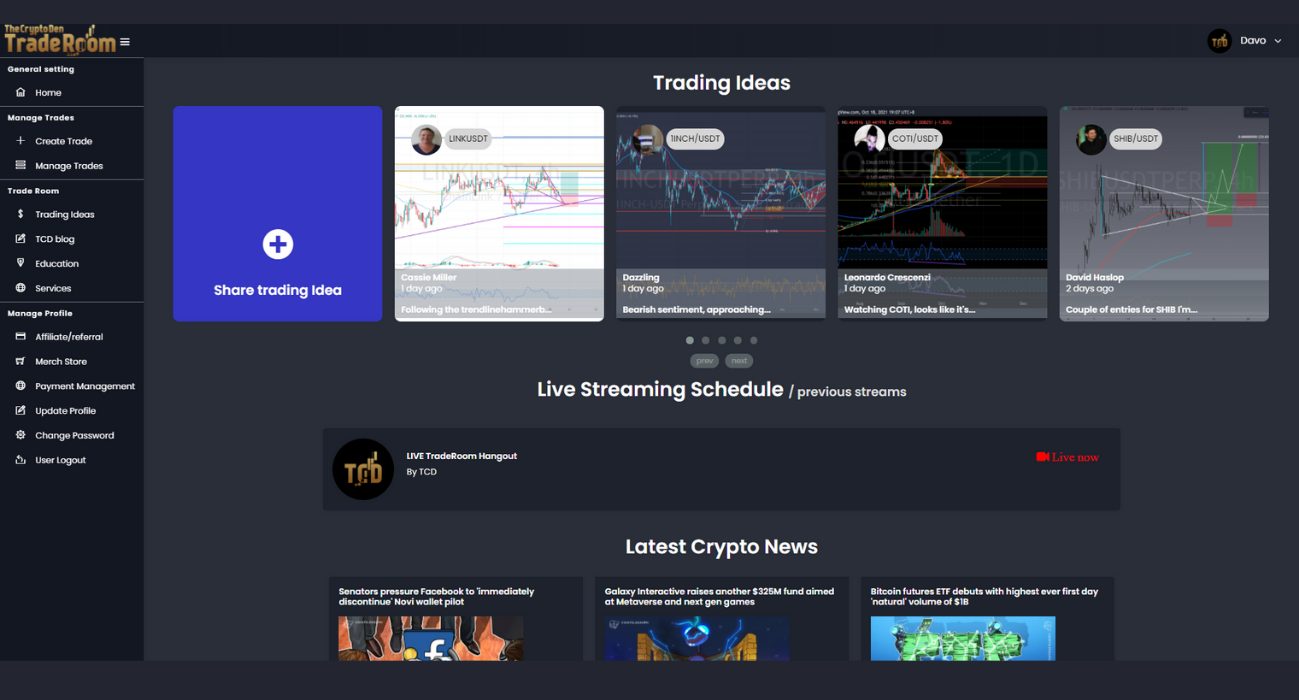
If you’d like to become a better trader, you’re invited to join our TradeRoom where we share daily charts and market analysis. In our community we strongly encourage and teach correct risk management strategies to keep our members safe in this new volatile crypto market.
Join our “Apprentice” plan now for your 7-day trial.


The Crypto Den was created in 2017 to help the rapidly growing crypto community learn and understand the fundamentals of digital currencies and how to trade them. 

Since then we have taught thousands of members the basics of technical analysis and trading strategies to further progress and perfect their trading abilities.

In the TradeRoom you will be included in a supportive environment which encourages personal growth, education and community support.

It’s a place to share your trading ideas and follow other experienced traders’ feeds to help keep your finger on the pulse of such a volatile market!

Categories
Binance Coin Crypto News Market Analysis Qtum Trading

Top 3 Coins to Watch Today: BNB, ONE, QTUM – January 24 Trading Analysis

Let’s take a closer look at today’s altcoins showing breakout signals. We’ll explain what the coin is, then dive into the trading charts and provide some analysis to help you decide.

1. Binance Coin (BNB)

Binance BNB is the biggest cryptocurrency exchange globally, based on daily trading volume. Binance aims to bring cryptocurrency exchanges to the forefront of world financial activity. Aside from being the largest cryptocurrency exchange, Binance has launched a whole ecosystem of functionalities for its users. The Binance network includes the Binance Chain, Binance Smart Chain, Binance Academy, Trust Wallet, and Research projects, which all employ the powers of blockchain technology to bring new-age finance to the world. Binance Coin is an integral part of the successful functioning of many of the Binance sub-projects.

BNB Price Analysis

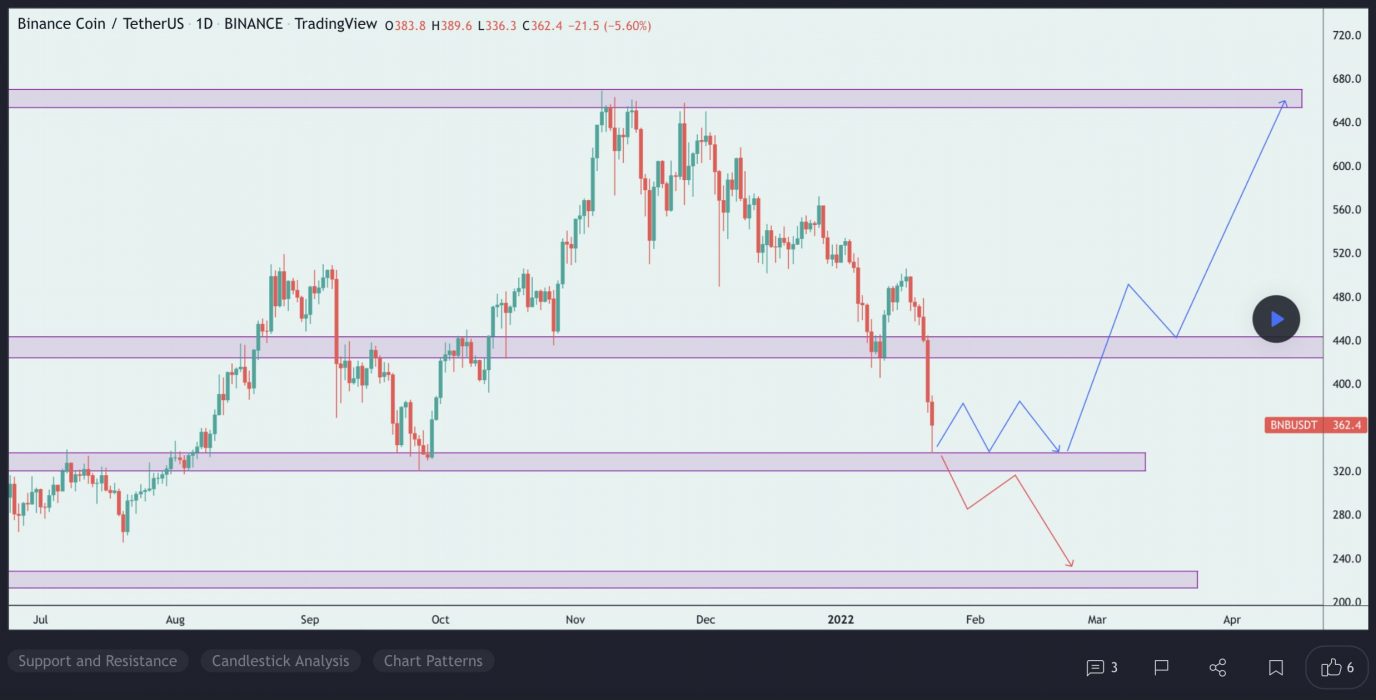
At the time of writing, BNB is ranked the 4th cryptocurrency globally and the current price is US$372.49. Let’s take a look at the chart below for price analysis:

Source: TradingView

After a 35% decline during January, BNB has ranged between $369 and $410.

The recent price recovery was approaching probable resistance near $388, but could be aiming for stops above the relatively equal highs near $395. Continuation of the trend could target the daily gap near $415.

Aggressive bulls might add to positions near $370 and $365. Price action near $360 may be more likely to provide support – if it gets there – during any retracements.

Relatively equal lows clustered around $354 seem likely to be swept if the bearish trend resumes. If this move occurs, the price might find support at the significant higher-timeframe level near $340.

2. Harmony (ONE)

Harmony ONE is a blockchain platform designed to facilitate the creation and use of decentralised applications (DApps). The network aims to innovate the way decentralised applications work by focusing on random state sharding, which allows creating blocks in seconds. Harmony was expected to introduce cross-shard contracts and a cross-chain infrastructure by the end of 2021.

ONE Price Analysis

At the time of writing, ONE is ranked the 47th cryptocurrency globally and the current price is US$0.2035. Let’s take a look at the chart below for price analysis:

Source: TradingView

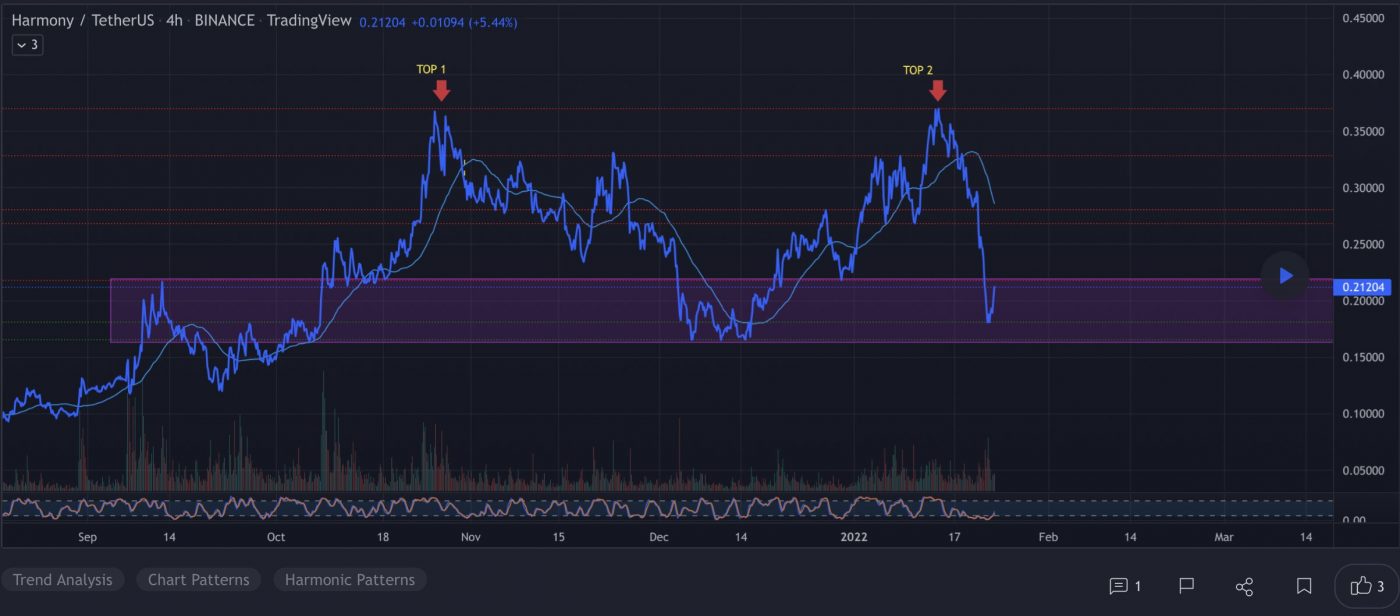
ONE‘s rally during January retraced over 55% after the price explored new monthly highs.

Resistance was formed near $0.3315 and $0.3095. With an uncertain market and traders potentially selling, these areas could continue to provide resistance and perhaps prompt a steeper move downward.

The recent market crash, overlapping with the last major down leg’s 41.8% and 55.6% retracements from $0.2167 to $0.2010, could mark an area of support. Inside this zone, $0.1940 to $0.1886 could provide a more sensitive reaction. 

A more extended downtrend might reach possible support between $0.1789 and $0.1634, near the origin of the last significant bullish move.

On the other hand, if altcoins resume their recovery trends, the 25% extension near $0.2820 could be the next area of significant profit-taking by bulls.

3. Quantum (QTUM)

Quantum QTUM is a proof-of-stake (PoS) smart contract open-source blockchain platform and value transfer protocol. It aims to bring together the strengths of Bitcoin and Ethereum in one chain. QTUM is built on Bitcoin’s UTXO transaction model, with the added functionality of smart contract execution and DApps. Recently, the platform added support for DeFi applications. 

QTUM Price Analysis

At the time of writing, QTUM is ranked the 104th cryptocurrency globally and the current price is US$5.63. Let’s take a look at the chart below for price analysis:

Source: TradingView

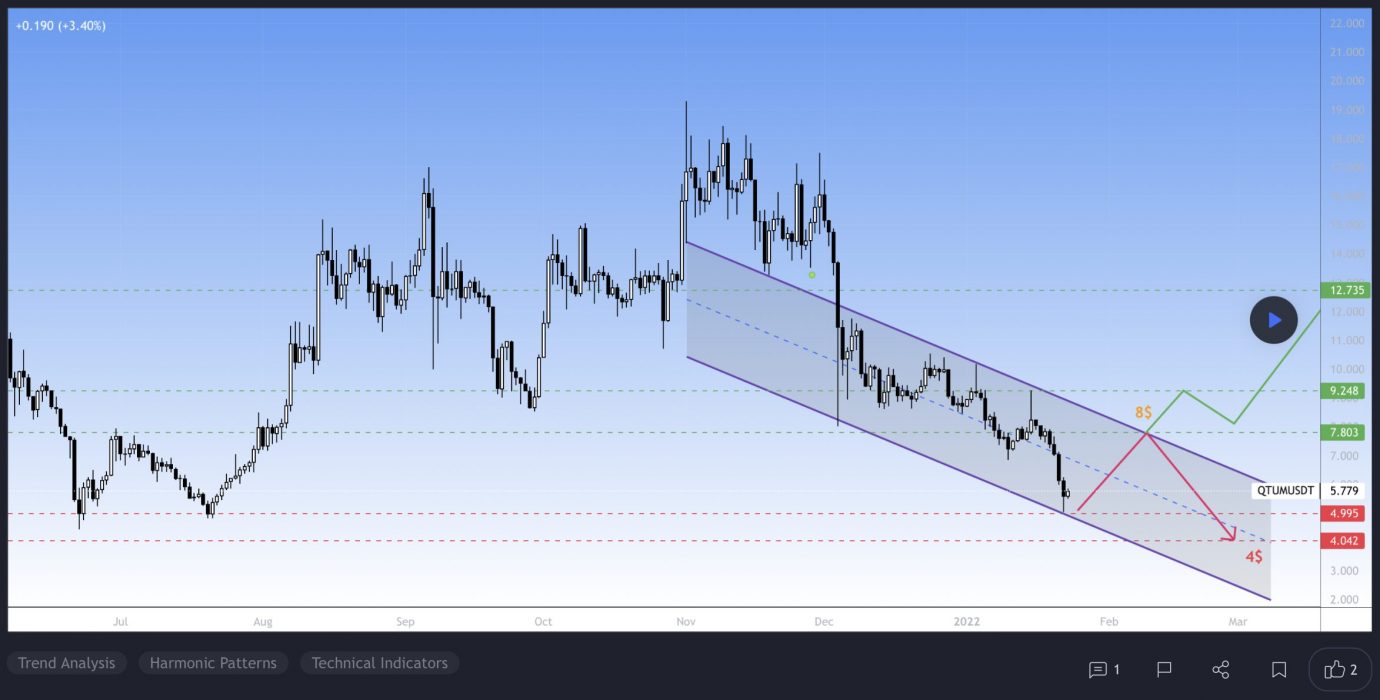
After dropping almost 80% from December, QTUM has been consolidating on previous price supports.

The recent sweep of the lows near $6.30 could set the stage for at least a short rally higher, with bulls possibly buying near $6.42 for a move toward the relatively equal highs near $6.59. A close over these highs might hint at a longer-term move toward probable resistance near $6.90, likely following a retracement.

Rejection from possible resistance near $5.80, potentially including a sweep of the highs around $5.94, could signal a run to the swing low near $5.40. If this move occurs, bears might target the swing low and support near $5.30 and $5.16.

Learn How to Trade Live!

Join Dave and The Crypto Den Crew and they’ll show you live on a webinar how to take your crypto trading to the next level.

Where to Buy or Trade Altcoins?

These coins have high liquidity on Binance Exchange, so that could help with trading on AUD/USDT/BTC pairs. And if you’re looking at buying and HODLing cryptos, then Swyftx Exchange is an easy-to-use popular choice in Australia.
Categories
Crypto News Litecoin Market Analysis Polkadot Trading

Top 3 Coins to Watch Today: LTC, DOT, ENJ – January 21 Trading Analysis

Let’s take a closer look at today’s altcoins showing breakout signals. We’ll explain what the coin is, then dive into the trading charts and provide some analysis to help you decide.

1. Litecoin (LTC)

Litecoin LTC is a cryptocurrency designed to provide fast, secure and low-cost payments by leveraging the unique properties of blockchain technology. The cryptocurrency was created based on the Bitcoin protocol, but it differs in terms of the hashing algorithm used, hard cap, block transaction times, and a few other factors. Litecoin has a block time of just 2.5 minutes and extremely low transaction fees, making it suitable for micro-transactions and point-of-sale payments.

LTC Price Analysis

At the time of writing, LTC is ranked the 24th cryptocurrency globally and the current price is US$141.29. Let’s take a look at the chart below for price analysis:

Source: TradingView

After setting a low during early January, LTC kicked off a recovery trend that gained nearly 33% to break the monthly highs.

The following 55% plummet found support near $127.36, sweeping under the 40 EMA into the 61.8% retracement level before bouncing to resistance beginning at $150.43.

This area could continue to provide resistance, possibly causing a retracement to the 9 EMA and 18 EMA near $162.12, where aggressive bulls might begin bidding. The level near $170.98, which has confluence with the 40 EMA, may see more interest from bulls loading up for an attempt on probable resistance beginning near $185.13. 

However, if Bitcoin continues its sideways trend, much lower prices could be seen. The old support near $120.18 could provide at least a short-term bounce. If this level fails, the old monthly lows near $112.44 might also give support and see the start of a new bullish cycle after retesting these support levels.

2. Polkadot (DOT)

Polkadot DOT is an open-source sharding multichain protocol that facilitates the cross-chain transfer of any data or asset types, not just tokens, thereby making a wide range of blockchains interoperable with each other. Polkadot’s native DOT token serves three clear purposes: providing network governance and operations, and creating parachains by bonding. The Polkadot protocol connects public and private chains, permissionless networks, oracles and future technologies, allowing these independent blockchains to trustlessly share information and transactions through the Polkadot relay chain.

DOT Price Analysis

At the time of writing, DOT is ranked the 10th cryptocurrency globally and the current price is US$25.28. Let’s take a look at the chart below for price analysis:

Source: TradingView

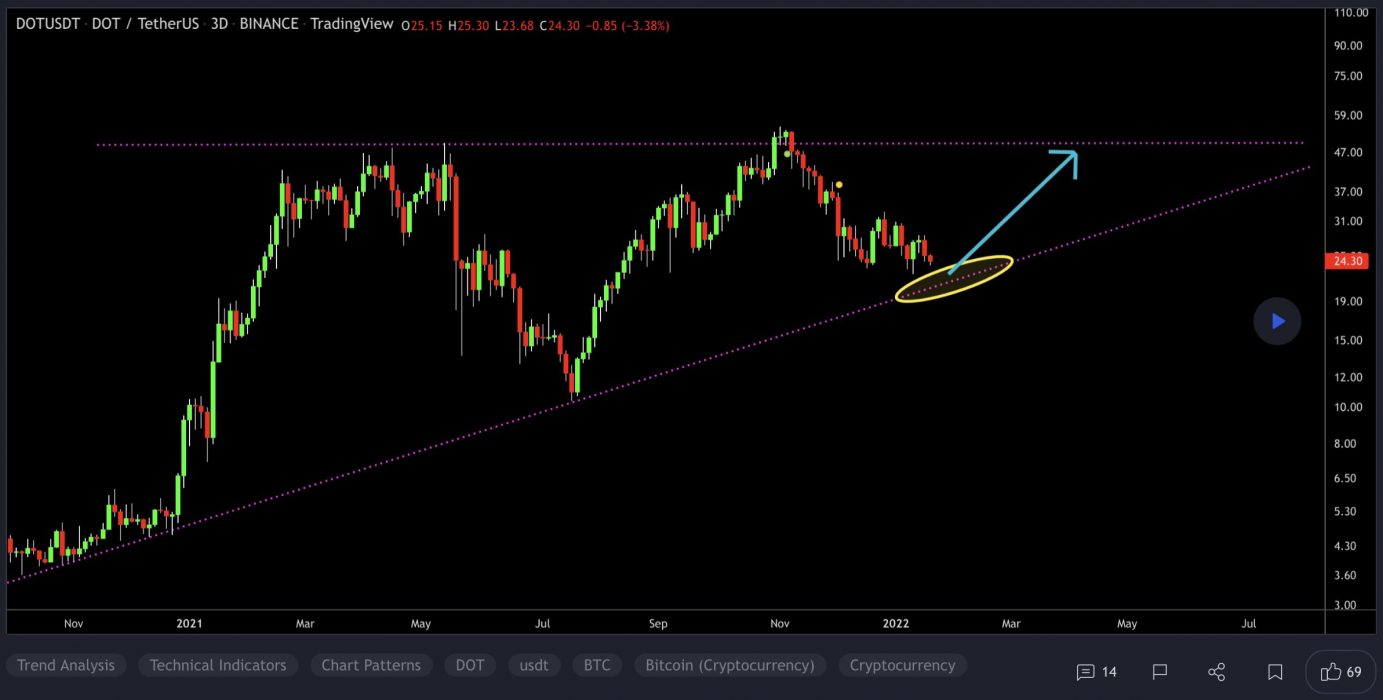
DOT has remained between approximately $23.76 and $35.25 since its retracement from November 2021.

Continual retests of the $22.54 level might signify that the price is ready to run to the larger range’s lows.

If this move down occurs, a broad zone from $21.50 to $19.54 may provide support. The upper portion of this zone may see more sensitivity.

Continued bearish market conditions could prompt continuation down through the level. If so, the next higher timeframe area of interest for bulls is likely near $17.86.

The 9, 18 and 40 EMAs, near $28.52, might provide resistance before running the range lows. This area has confluence with multiple swing highs and lows. 

However, the current proximity to the local range low could prompt a move toward the range highs. If so, $30.44 might be the near-term target for bulls. Before entering, traders might wait for confirmation that one direction is more likely to unfold.

If the overall market becomes more bullish, the price could continue through the local range highs. If so, a zone from $33.76 to $36.81 – particularly the lower half – could see profit-taking from bulls.

3. Enjin Coin (ENJ)

Enjin Coin ENJ is a project of Enjin, a company that provides an ecosystem of interconnected, blockchain-based gaming products. Enjin’s flagship offering is the Enjin Network, a social gaming platform through which users can create websites and clans, chat, and host virtual item stores. Enjin Coin is a digital store of value used to back the value of blockchain assets such as non-fungible tokens (NFTs).

ENJ Price Analysis

At the time of writing, ENJ is ranked the 60th cryptocurrency globally and the current price is US$2.34. Let’s take a look at the chart below for price analysis:

Source: TradingView

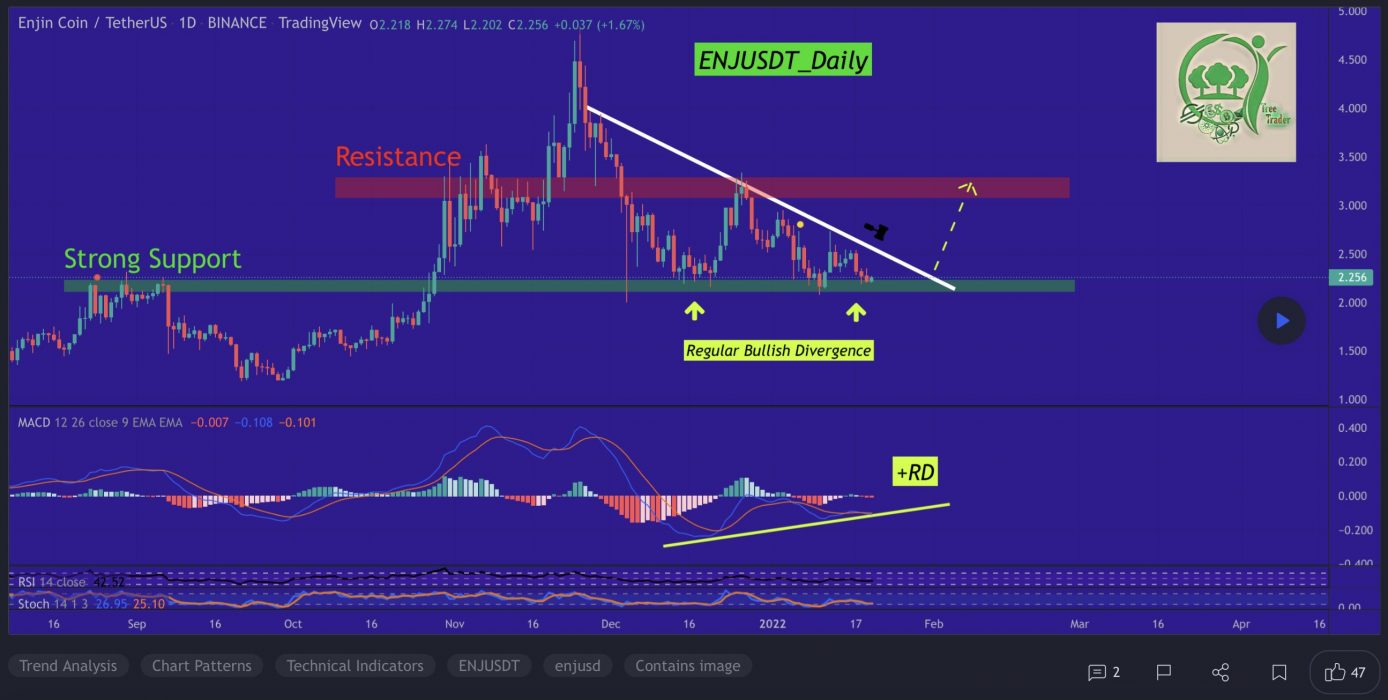
ENJ spent January ranging across the monthly open, reaching 18% over and 26% below. The price is currently consolidating between adjacent resistance and support at $2.39 with no clear higher-timeframe trend. A strong move over the monthly open could signal a run to resistance beginning near $2.50. 

This move would likely target the swing high at $2.57 and relatively equal highs near $2.64. A sustained bullish trend could reach up to the monthly high near $2.70.

Bulls might see a sweep of the relatively equal lows near $2.30 as a chance to buy at a discount. If this level fails to hold, the next significant area for the price to find buyers is likely near the consolidation around $2.25 and $2.15.

Learn How to Trade Live!

Join Dave and The Crypto Den Crew and they’ll show you live on a webinar how to take your crypto trading to the next level.

Where to Buy or Trade Altcoins?

These coins have high liquidity on Binance Exchange, so that could help with trading on AUD/USDT/BTC pairs. And if you’re looking at buying and HODLing cryptos, then Swyftx Exchange is an easy-to-use popular choice in Australia.
Categories
Crypto News Market Analysis Trading

Top 3 Coins to Watch Today: CRO, ROSE, CELO – January 20 Trading Analysis

Let’s take a closer look at today’s altcoins showing breakout signals. We’ll explain what the coin is, then dive into the trading charts and provide some analysis to help you decide.

1. Crypto Coin (CRO)

Crypto.com coin CRO is the native cryptocurrency token of Crypto.com Chain – a decentralised, open-source blockchain developed by the Crypto.com payment, trading and financial services company. Crypto.com Chain is one of the products in Crypto.com’s lineup of solutions designed to accelerate the global adoption of cryptocurrencies as a means of increasing personal control over money, safeguarding user data, and protecting users’ identities. The CRO blockchain serves primarily as a vehicle that powers the Crypto.com Pay mobile payments app.

CRO Price Analysis

At the time of writing, CRO is ranked the 17th cryptocurrency globally and the current price is US$0.4335. Let’s take a look at the chart below for price analysis:

Source: TradingView

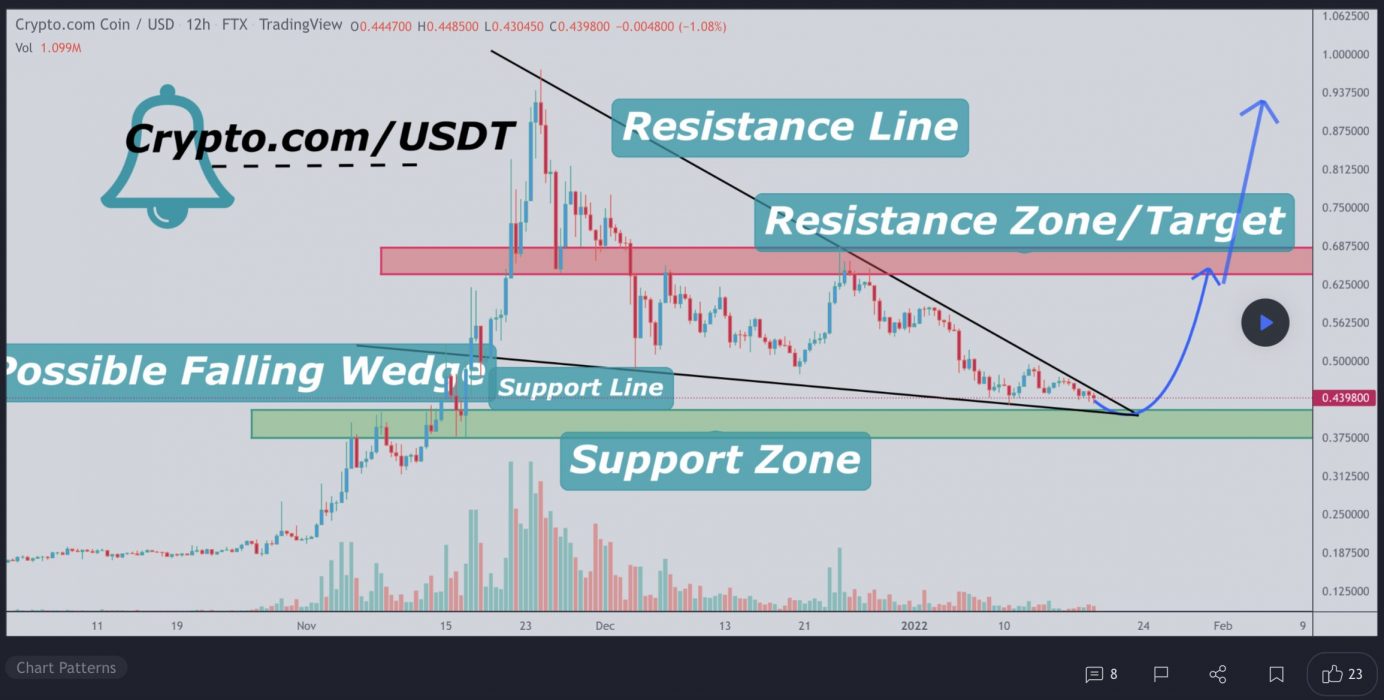
CRO went parabolic during November, reaching nearly 105% percent within a few days as it blasted through its old all-time high.

This fast move left little compelling higher-timeframe support near the current price. A level near $0.4122, which has confluence with the 8 EMA and 127% extension of H2 2021’s swing, could provide support.

Further below, near $0.3891, 2021’s previous monthly high could also provide some support on a retest. The last consolidation before the breakout, near December’s open, might give the most substantial support. However, this would require significant retracement from the current price point.

While next targets are impossible to predict, extensions from H1 2021’s move suggest that the 30% extension, near $0.5675, could provide some resistance. Above this level, the 42% extension near $0.6248 could also trigger bulls to take profits.

2. Oasis Network (ROSE)

The Oasis Network ROSE is the first privacy-enabled blockchain platform for open finance and a responsible data economy. Combined with its high throughput and secure architecture, the Oasis Network is able to power private, scalable DeFi, revolutionising Open Finance and expanding it beyond traders and early adopters to a mass market. Its unique privacy features can not only redefine DeFi but also create a new type of digital asset called Tokenised Data that can enable users to take control of the data they generate and earn rewards for staking it with applications – creating the first-ever responsible data economy.

ROSE Price Analysis

At the time of writing, ROSE is ranked the 68th cryptocurrency globally and the current price is US$0.4724. Let’s take a look at the chart below for price analysis:

Source: TradingView

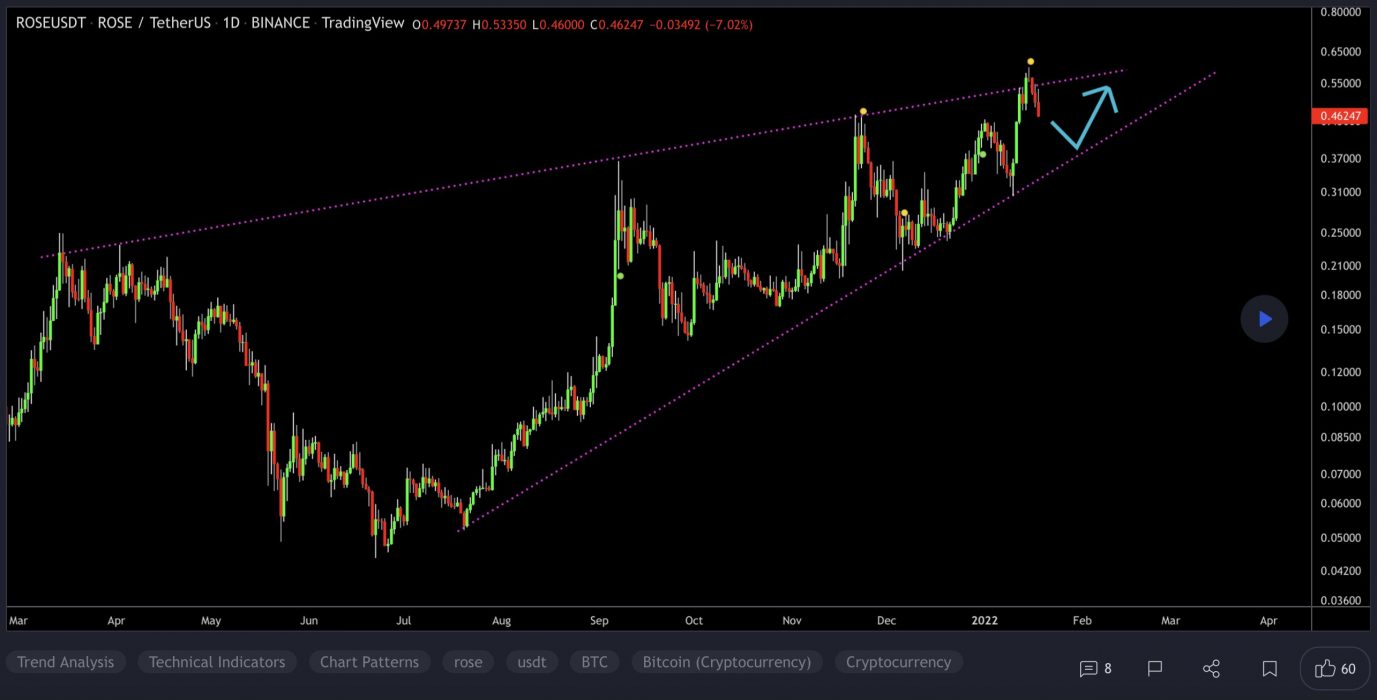
ROSE has dropped nearly 38% since late December and found a low in early January, with price action now trending upward through a higher-timeframe range.

The area beginning near $0.5946 has provided strong resistance and may do so again. However, relatively equal highs near $0.5112 offer a tempting target for bulls. A run of these highs may reach up into the daily gap near $0.5514.

Aggressive bulls might add to their positions near $0.4278. If the price breaks through this level, it may be reaching for the cluster of swing lows near $0.3954 and $0.3715. A more substantial move down may run stops below the relatively equal monthly lows, around $0.3466, into the daily gap at this level.

3. Celo (CELO)

Celo is a blockchain ecosystem focused on increasing cryptocurrency adoption among smartphone users. The network also allows for the creation of smart contracts and decentralised applications (DApps) as part of decentralised finance (DeFi). The platform has two native tokens. CELO is a proof-of-stake (PoS) token used for transaction fees, governance participation, and related activities. In the future, the platform aims to host various stablecoins, with one, the Celo Dollar (CUSD), already in use.

CELO Price Analysis

At the time of writing, CELO is ranked the 66th cryptocurrency globally and the current price is US$4.36. Let’s take a look at the chart below for price analysis:

Source: TradingView

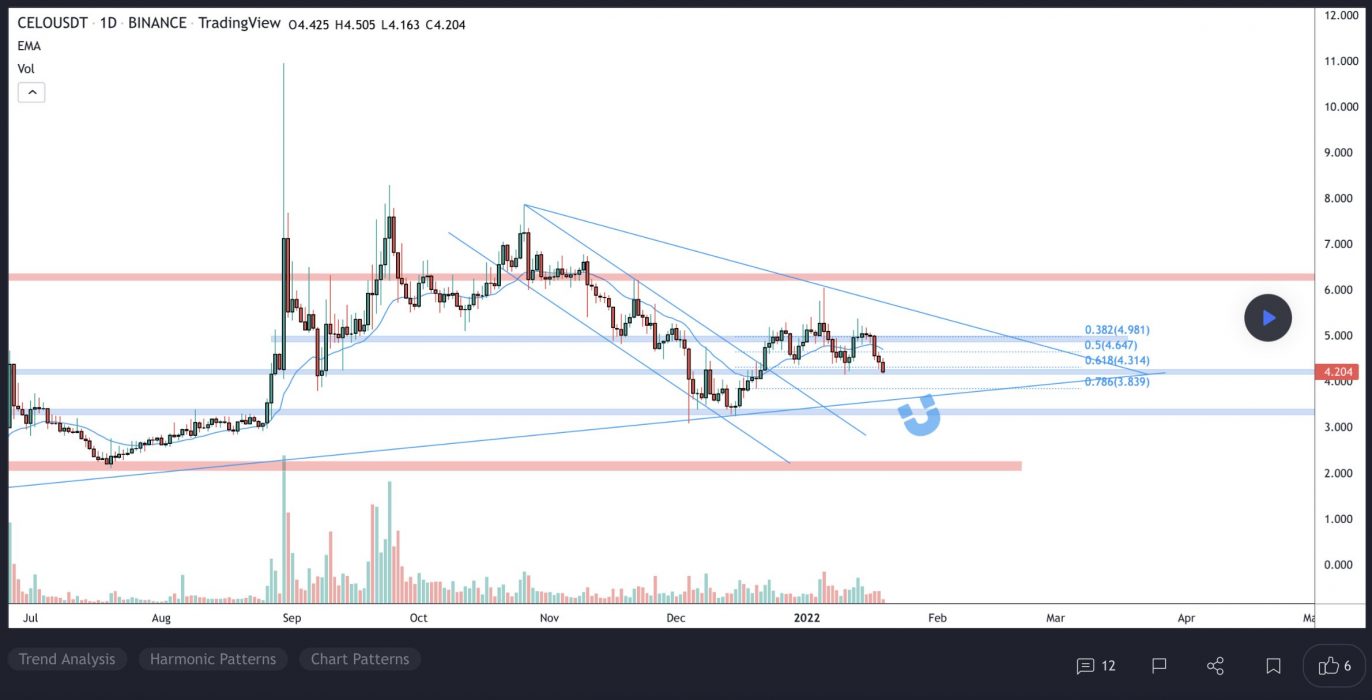
CELO continued its rally through the daily gap between $4.25 and $4.12, turning this region into an area of possible support. 

However, a stop run under the relatively equal lows at $3.97 could form a wick below this level, potentially reaching an untapped daily gap beginning near $3.80.

Resistance starting at $4.53 has seen significant profit-taking, shown by the long upper wicks on the daily candles. A break of this resistance may reach the next significant swing high at $4.75, continue into probable resistance just above, and possibly set new monthly highs at $4.93.

Learn How to Trade Live!

Join Dave and The Crypto Den Crew and they’ll show you live on a webinar how to take your crypto trading to the next level.

Where to Buy or Trade Altcoins?

These coins have high liquidity on Binance Exchange, so that could help with trading on AUD/USDT/BTC pairs. And if you’re looking at buying and HODLing cryptos, then Swyftx Exchange is an easy-to-use popular choice in Australia.