Categories
Crypto News Market Analysis Ripple Stratis Trading

Top 3 Coins to Watch Today: MATIC, STRAX, XRP – January 18 Trading Analysis

Let’s take a closer look at today’s altcoins showing breakout signals. We’ll explain what the coin is, then dive into the trading charts and provide some analysis to help you decide.

1. Polygon (MATIC)

Polygon MATIC is the first well-structured, easy-to-use platform for Ethereum scaling and infrastructure development. Its core component is Polygon SDK, a modular, flexible framework that supports building multiple types of applications. The MATIC token will continue to exist and will play an increasingly important role, securing the system and enabling governance.

MATIC Price Analysis

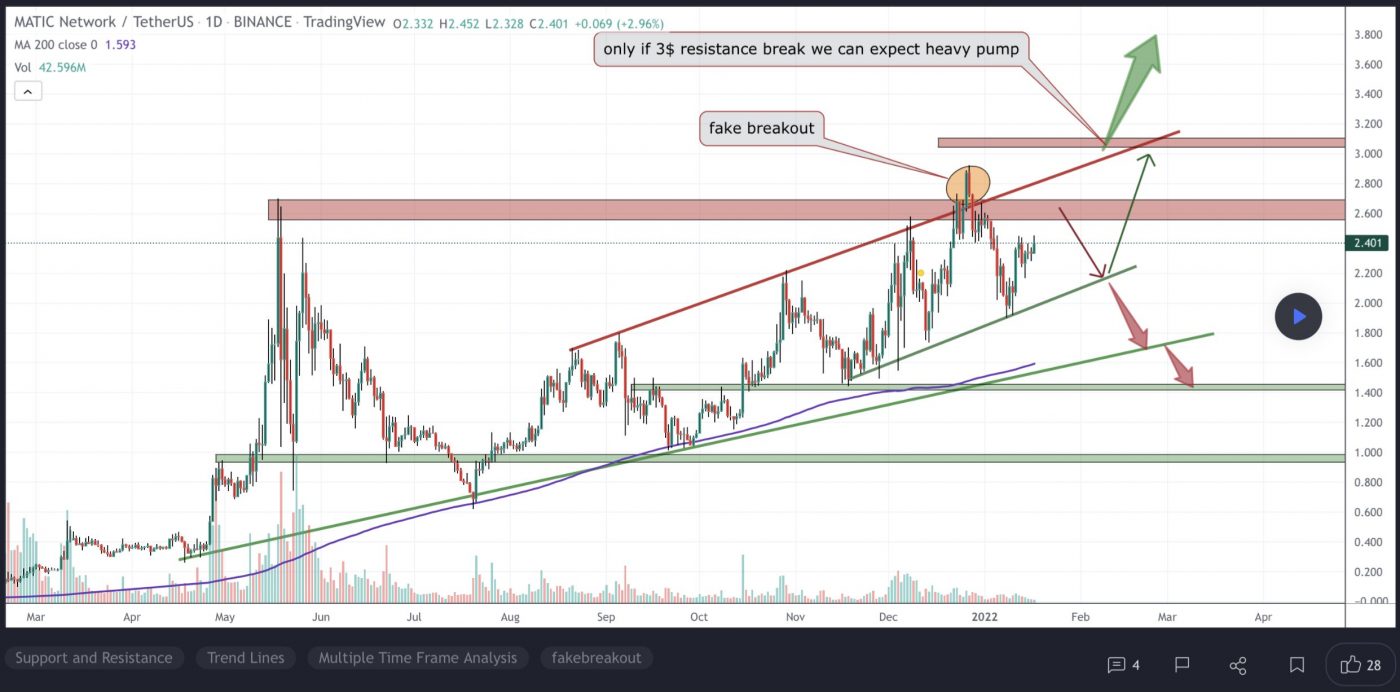
At the time of writing, MATIC is ranked the 13th cryptocurrency globally and the current price is US$2.25. Let’s take a look at the chart below for price analysis:
Source: TradingView

Since its July low, MATIC has been in a steady bullish trend – printing a 370% gain by late December. The price found support near $1.991, at the 78.6% retracement level, during early January’s decline.

Last week’s sharp impulse up may have marked the start of a new bullish swing. If this is so, higher timeframes suggest that $2.1940 (near the 61.8% retracement and the 9, 18 and 40 EMAs) might see interest from bulls. The price could reach lower, near $2.0674, and still find support.

Currently, the price is contesting a region between $2.2957 and $2.4028. Closes over this level could confirm it as new support, leading to a move higher.

However, bulls are contending with probable resistance near $2.421, while $2.5251 is also likely to be sensitive with the nearest support and resistance this close together.

Breaking this resistance level might see profit-taking near $2.6214, an inefficiently traded region. However, a move this high could suggest new all-time highs are on the cards. If so, the 0.618% extension, near $3.50, and the 100% extension, near $4.00, are possible targets.

2. Stratis (STRAX)

Stratis STRAX is a blockchain-as-a-service platform that offers several products and services for enterprises, including launching private sidechains, running full nodes, developing and deploying smart contracts, an initial coin offering platform, and a proof-of-identity application. The company also provides cryptocurrency wallets and blockchain consulting services. Stratis operates its own blockchain powered by a native token, STRAX.

STRAX Price Analysis

At the time of writing, STRAX is ranked the 300th cryptocurrency globally and the current price is US$1.36. Let’s take a look at the chart below for price analysis:

Source: TradingView

Since its 1,020% move in H1 2021, STRAX has been in a massive range between approximately $2.70 and $1.25. Long upper wicks during the second half of 2021 show distribution, while the daily chart shows a bearish trend since September.

The price is currently around the 78.6% retracement, near $2.4028. This level has seen interest from bulls since July and might provide support again for a short-term bounce.

The closest resistance may be at $1.428, near the 9, 18 and 40 EMAs. If the price breaks this level, bulls might target the old swing low near $1.660, another old swing low and inefficiently traded area near $1.823, and the consolidation around $1.960.

However, repeated tests of a level, plus the higher-timeframe downtrend, may cause an eventual breakdown of the current support near $1.379. If this occurs, old swing lows near $1.080 – particularly an inefficient region starting near $0.982 – may be the bearish target and the subsequent support.

3. Ripple (XRP)

Ripple XRP is the currency that runs on a digital payment platform called RippleNet, on top of a distributed ledger database called XRP Ledger. While RippleNet is run by a company called Ripple, the XRP Ledger is open-source and is not based on a blockchain, but rather the previously mentioned distributed ledger database.

XRP Price Analysis

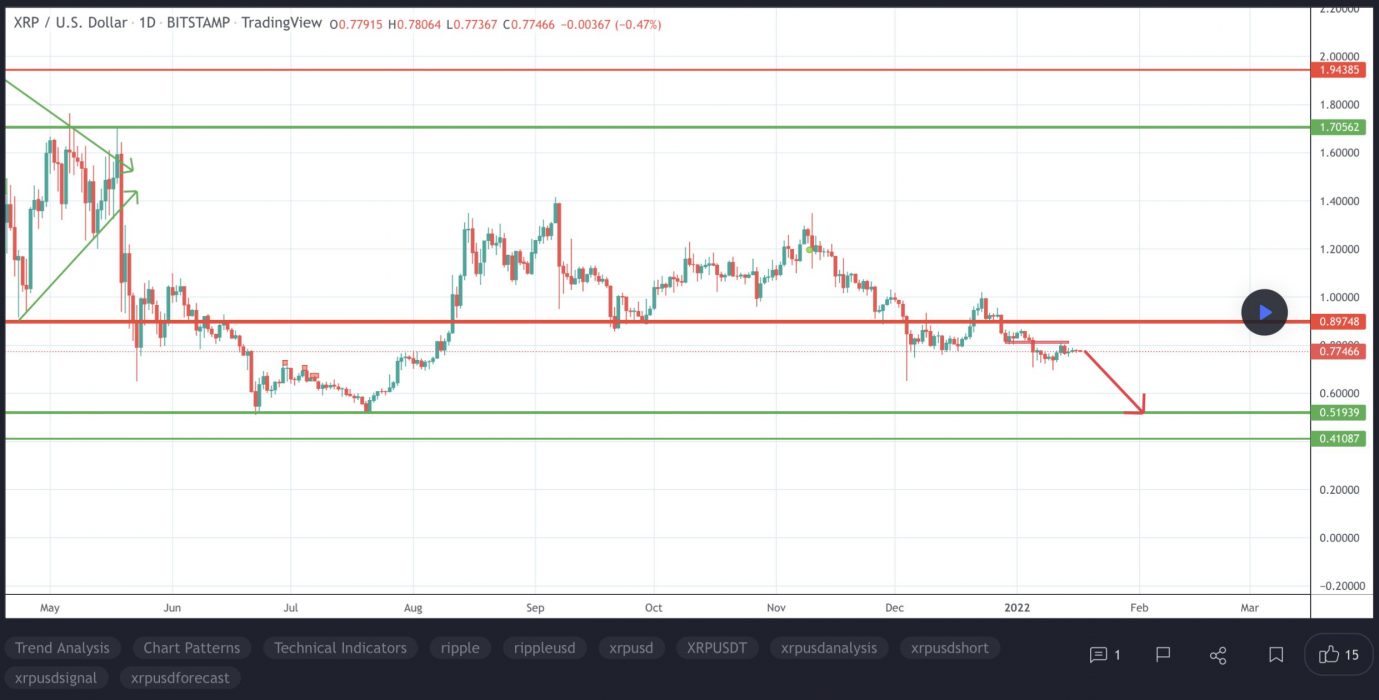
At the time of writing, XRP is ranked the 8th cryptocurrency globally and the current price is US$0.7548. Let’s take a look at the chart below for price analysis:
Source: TradingView

XRP also printed massive gains in H1 2021 before moving sideways for the rest of the year.

The price is in a downtrend, with the 9, 18 and 40 EMAs providing resistance on each attempt to rally. However, bulls are showing some interest at the 78.6% retracement, near $0.6952. If this level breaks, a move into possible support – just below the June and July lows near $0.4952 – seems likely.

If the price does rally through the swing high at $0.8160 – perhaps triggered by a sudden surge in Bitcoin – bulls might find some resistance at the 61.8% retracement level near $0.8350. 

Overlapping swing highs and lows near $0.9436 might provide the next target, where bears forced the price down in late December immediately.

More bullish market conditions could shift targets up near the midpoint of Q3’s consolidation, near $1.0735, where higher timeframes show an inefficiently traded zone.

Learn How to Trade Live!

Join Dave and The Crypto Den Crew and they’ll show you live on a webinar how to take your crypto trading to the next level.

Where to Buy or Trade Altcoins?

These coins have high liquidity on Binance Exchange, so that could help with trading on AUD/USDT/BTC pairs. And if you’re looking at buying and HODLing cryptos, then Swyftx Exchange is an easy-to-use popular choice in Australia.

Categories
Market Analysis The Crypto Den

TradeRoom: Our Weekly Crypto Trades Analysis – Jan 17, 2022

Welcome to this weekly series from the TradeRoom. My name is Dave and I’m the founder of The Crypto Den, an Australian-based crypto trading and education community aiming to give you the knowledge to take your trading game to the next level.

Crypto Market Outlook

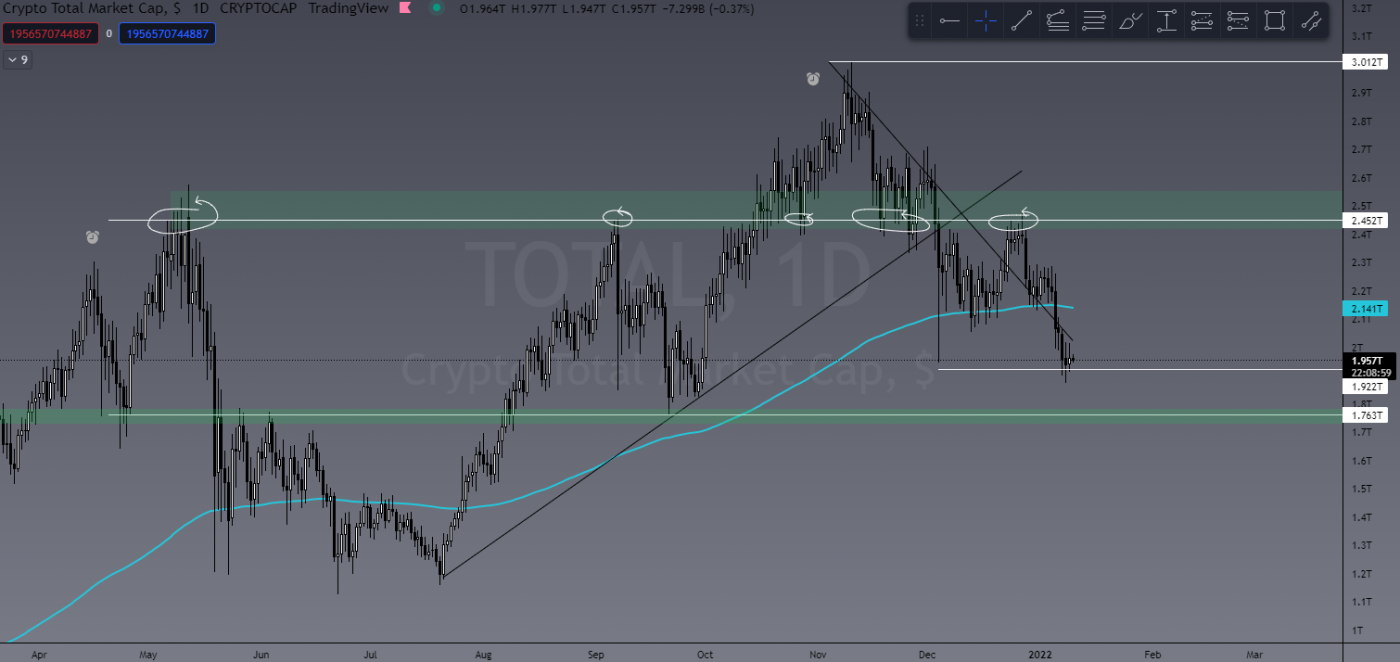
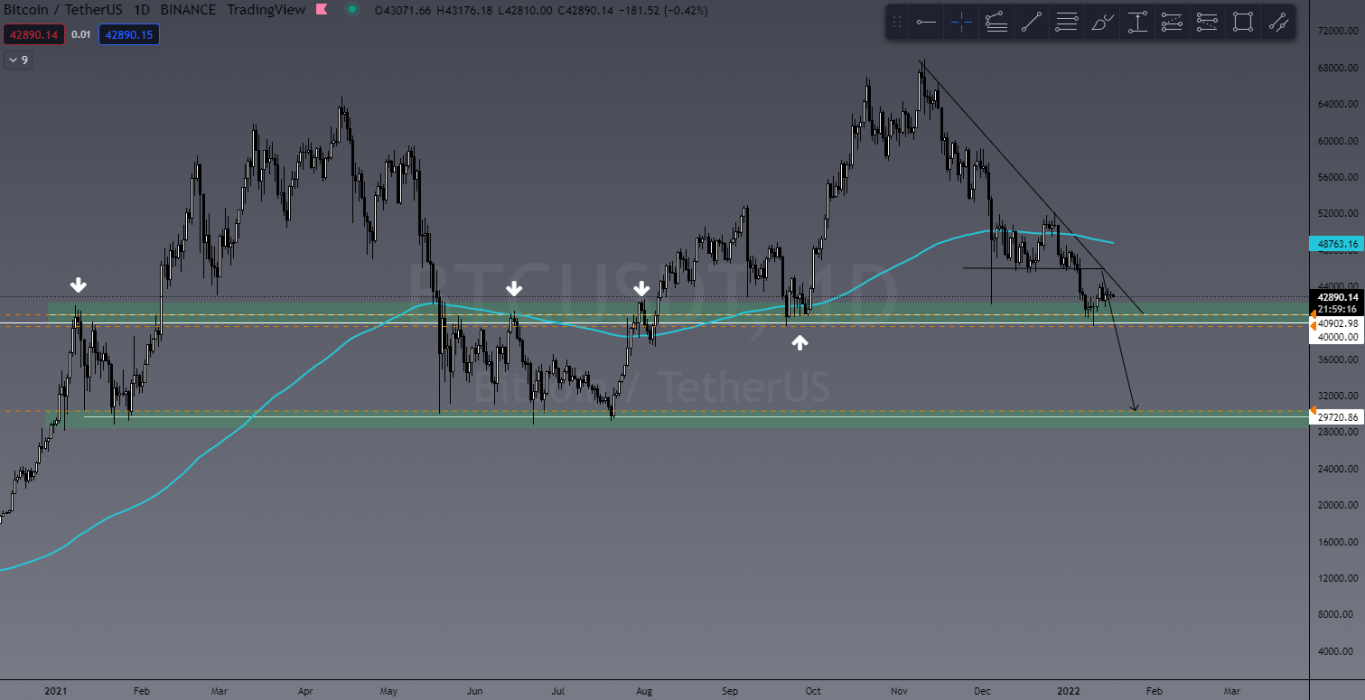
Well, as we expected last week, we’ve seen a slight push/relief rally on the TOTAL and BTC. Nothing to get too excited about unless you’re loading up on short selling positions. The TOTAL still shows bearish market structure below trend, below local resistance and below 200EMA on the daily. Nothing on this chart screams bullish to me at all.

TOTAL Market Cap

BTC/USD

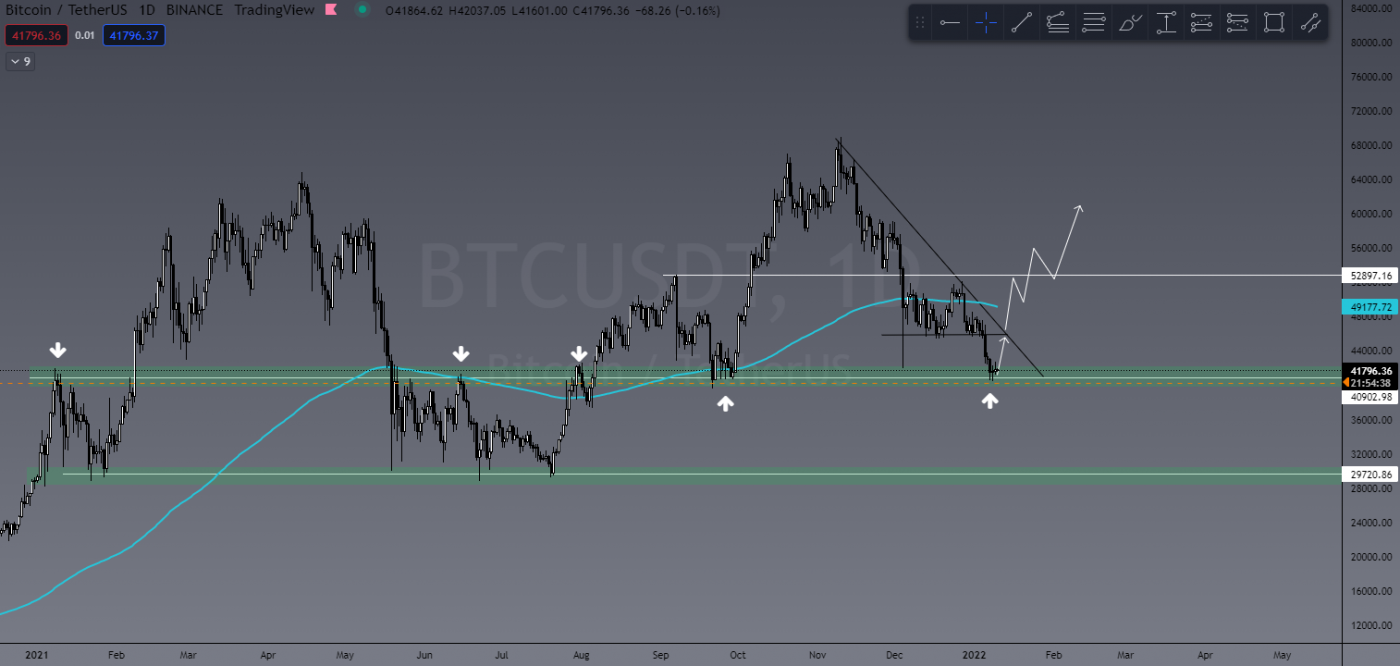
Last week I suggested we might see a small bullish push and that came with a warning – don’t get too excited! Too often I see crypto communities get a little FOMO and hype whenever BTC has a push after bearish price action, and it’s important to be able to read these relief rallies. A small push to a level of resistance on low volume will generally mean more downside to come.
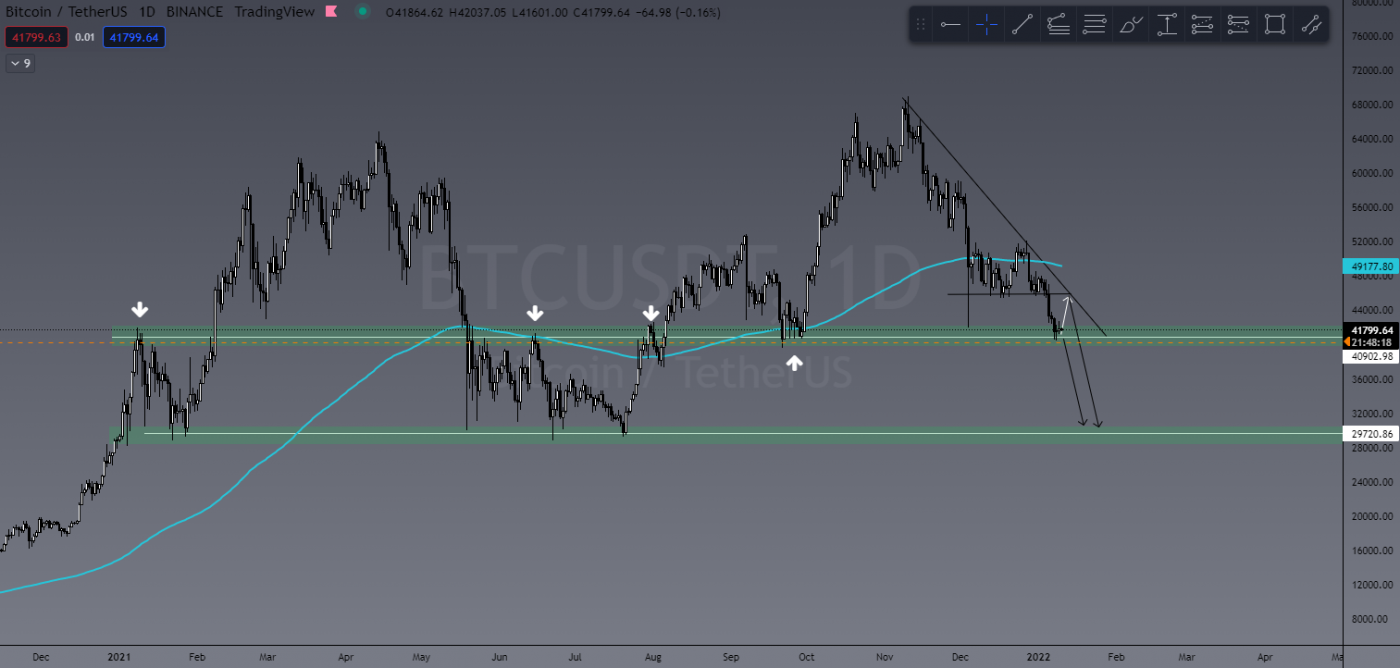
BTC is still in a bearish market structure and well and truly below the daily 200 EMA. It’s currently sitting at US$42,800 and we see no reason it can’t see US$35,000-30,000 in the coming days-weeks. As soon as the US$40,000 level of support breaks, it’s going to get bloody.

BTC/USDT

Last Week’s Performance

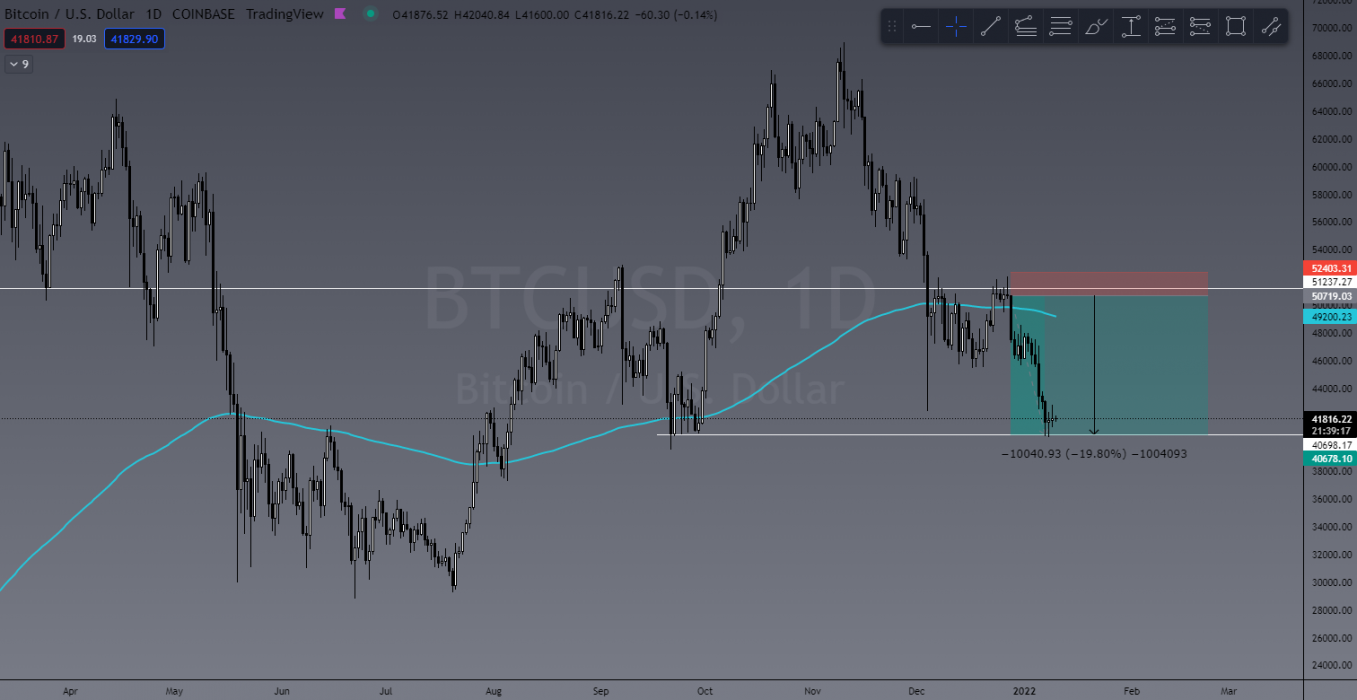
Last week my only trades were shorts in ETH and BTC, which played out very well and closed with great profit. So this week I’ll be sharing some killer trades by members of our TradeRoom.

GALA/USDT

Local TradeRoom LEGEND – Dazzling – entered a short trade on GALA. He shared this entry in the Trade-Chat channel and after winning the trade wrote: “One candle and a trendline told me to enter this yesterday afternoon. 87% full locked away. Now looking for next move confirmation to continue down.” THIS is what we love in our community.

He also entered a great short on BTC after one of our LIVE market scans. In the scan, the community was 50/50 in the direction of BTC at the time. I said up in price a bit more and he stuck to his guns, then said DOWN and he nailed it!

Dazzling’s GALA chart
Dazzling’s BTC chart

NEAR/USDT

One of our TradeRoom Team Leaders shared a great breakout trade on NEAR, pocketing over 400% on a 10x long trade. He identified bullish candlestick analysis at a level of support and breakout from a falling wedge and killed it with this trade!

Trade for NEAR chart

DASH/USDT

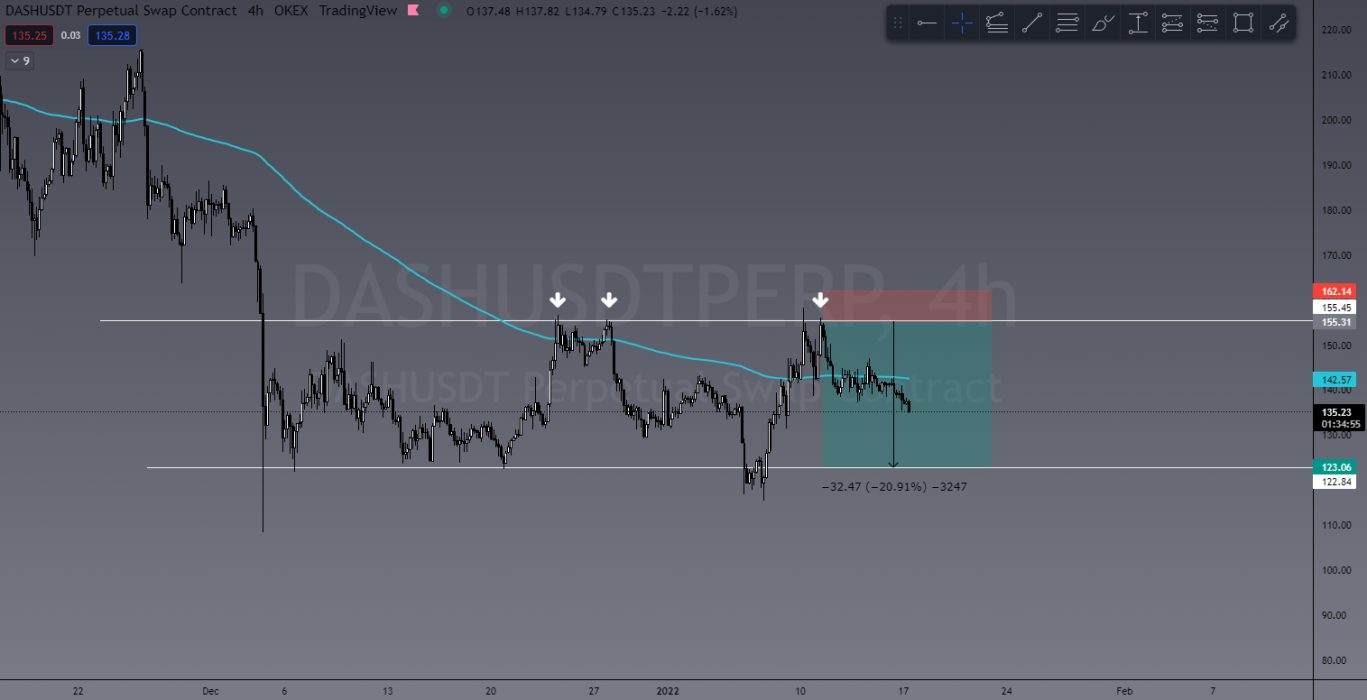
One I shared in the TradeRoom was DASH. Showing a very clear ranging pattern and an ideal short entry and resistance, it was a no-brainer for a 10x short. It’s sitting currently at around 130% and expecting to take some profit at 200% on the US$123.00 mark.

DASH/USDT – BEFORE
DASH/USDT – AFTER

This Week’s Trades

With the expectation of more bearish price action from BTC, we are looking for more shorts on coins that have seen a decent relief rally to maximise profits. Remember shorting/trading with leverage is HIGH RISK and should only be done by experienced traders!

LUNA/USDT

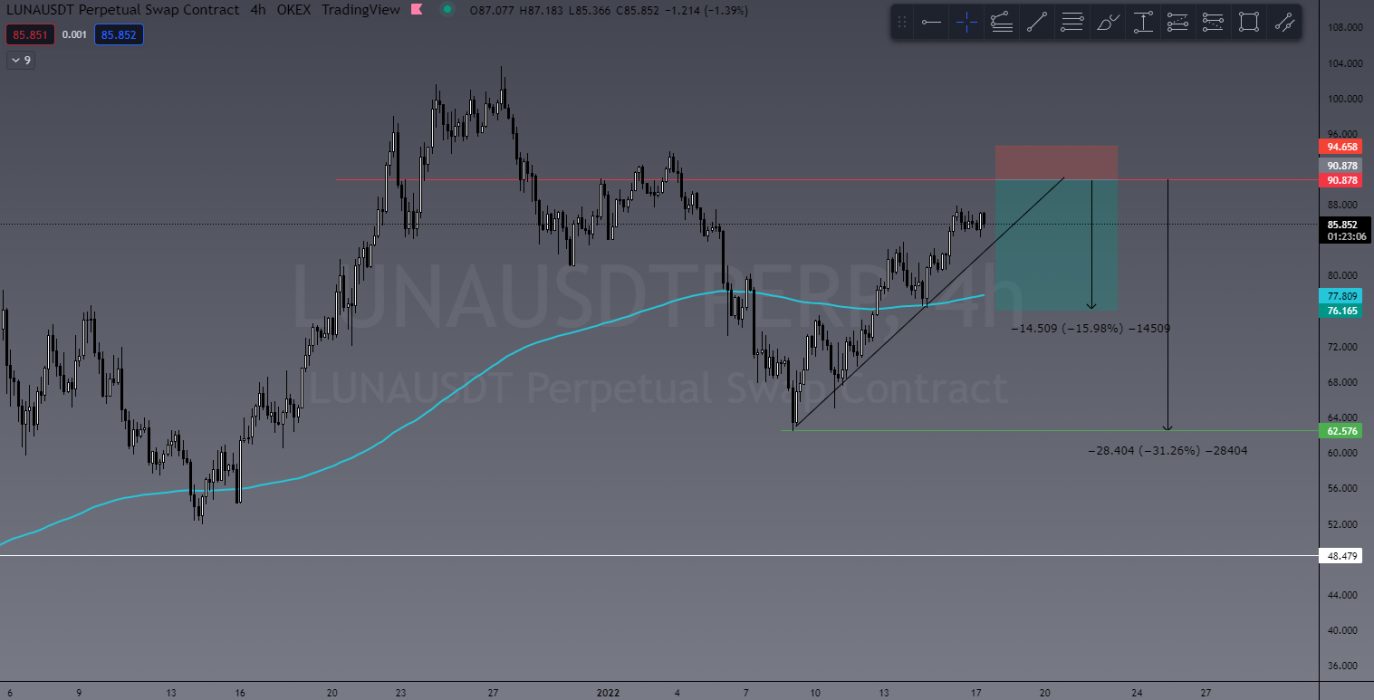
Luna has had some very nice bullish PA over the last week, and it’s coins like this that see just as big dumps when the market goes red! I’ll be looking at taking shorts at around US$90.00 on a 10x trade. Looking for 150% to 300% ROI.

LUNA/USDT


NEAR/USDT

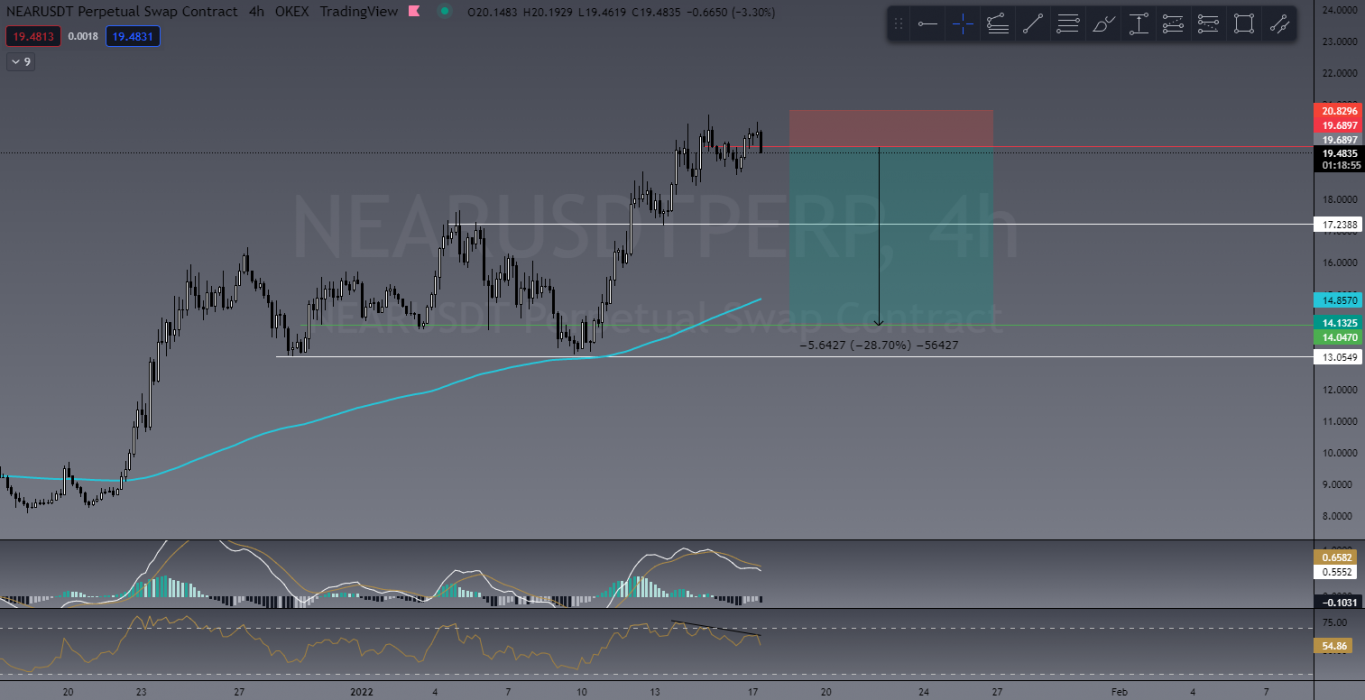
After our team leader’s great long trade mentioned above, I’m looking at NEAR for a good short trade as well. Like LUNA, it’s seen a strong push to the upside and seeking a corrective dump. If BTC goes red, a lot of these ALTS will do the same and NEAR looks overcooked!

NEAR/USDT


Learn to Trade

If you would like to learn how to read, understand and trade these charts, I have good news!

The Crypto Den is holding its first of only two trading courses for 2022 on February 7! That’s right, we will only be running two programs in 2022! What makes us different? Our lessons are LIVE and come with a community where you submit your homework and receive feedback to ensure you understand what we teach!

Duration: 6 week course
Date/Time: Live trading course twice a week on Mon and Wed at 7pm AEST
Frequency: We now run our LIVE course only twice per year
Location: Zoom Webinar
From: February 7 to March 21

The Crypto Den’s Trading Fundamentals trading course is a LIVE interactive course designed to teach you how to trade the crypto markets from absolute beginner level!

Our six-week program teaches you how to set up your trade accounts using reputable exchanges and brokers, how to read the charts using technical analysis, and to protect your capital using effective risk management strategies.

We have taught thousands of students of the past five years how to trade these volatile and highly profitable markets. See our REAL reviews from REAL students.

Using ZOOM twice a week, all of our lessons are LIVE and recorded so you can access them over and over again in our structured course through our website and smartphone app. Lessons come with homework and online quizzes, as well as an amazing online and private community of students.

So what are you waiting for? Join now to start learning!


Already Know How to Trade?

Invite to Join our TradeRoom

If you’d like to become a better trader, you’re invited to join our TradeRoom where we share daily charts and market analysis. In our community we strongly encourage and teach correct risk management strategies to keep our members safe in this new volatile crypto market.
Join our “Apprentice” plan now for your 7-day trial.


The Crypto Den was created in 2017 to help the rapidly growing crypto community learn and understand the fundamentals of digital currencies and how to trade them. 

Since then we have taught thousands of members the basics of technical analysis and trading strategies to further progress and perfect their trading abilities.

In the TradeRoom you will be included in a supportive environment which encourages personal growth, education and community support.

It’s a place to share your trading ideas and follow other experienced traders’ feeds to help keep your finger on the pulse of such a volatile market!

Categories
Cardano Crypto News Market Analysis Trading

Top 3 Coins to Watch Today: MANA, CRV, ADA – January 17 Trading Analysis

Let’s take a closer look at today’s altcoins showing breakout signals. We’ll explain what the coin is, then dive into the trading charts and provide some analysis to help you decide.

1. Decentraland (MANA)

Decentraland MANA defines itself as a virtual reality platform powered by the Ethereum blockchain that allows users to create, experience, and monetise content and applications. In this virtual world, users purchase plots of land that they can later navigate, build on and monetise. Decentraland uses two tokens: MANA and LAND. MANA is an ERC-20 token that must be burned to acquire non-fungible ERC-721 LAND tokens. MANA tokens can also be used to pay for a range of avatars, wearables, names, and more on the Decentraland marketplace.

MANA Price Analysis

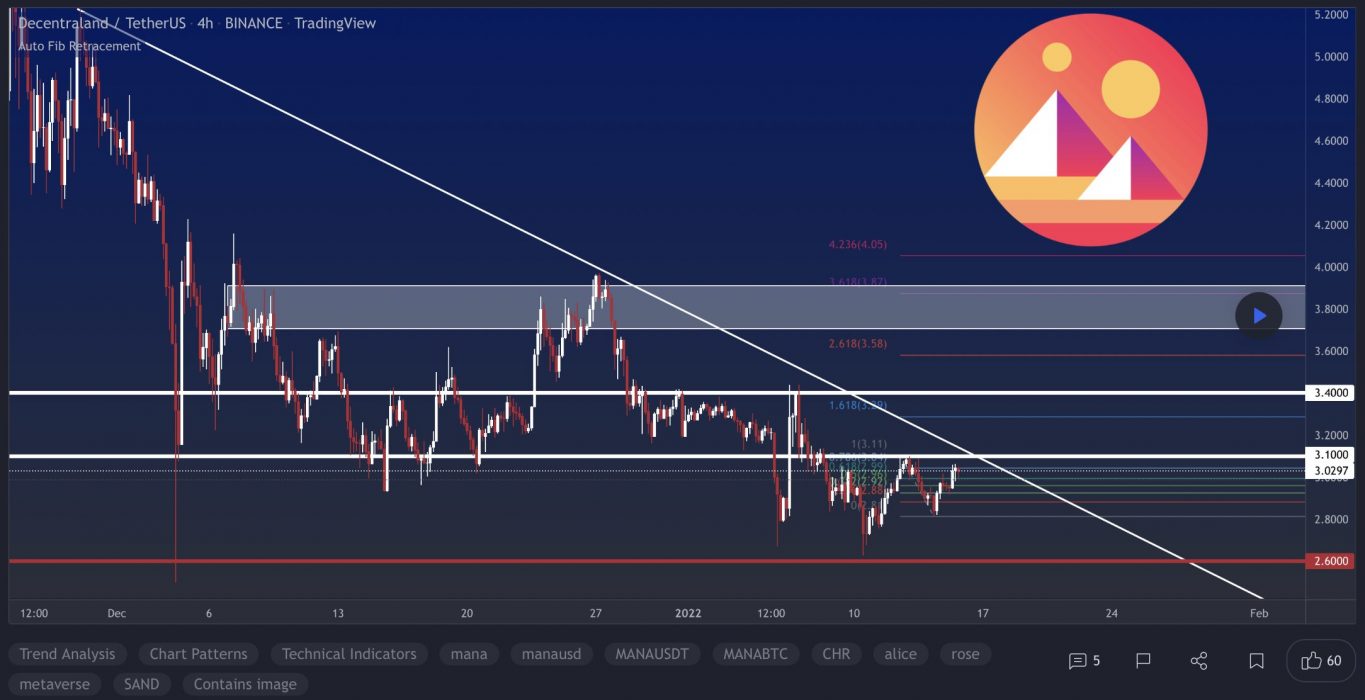
At the time of writing, MANA is ranked the 33rd cryptocurrency globally and the current price is US$3.08. Let’s take a look at the chart below for price analysis:

Source: TradingView

Like many other altcoins, MANA set a new all-time high during late November before retracing 45% to the low at $2.95 last week.

Price broke through resistance near $3.22, which may mark an area of possible support on a retracement. If this support fails, bulls might also step in near $2.93. However, a drop this far increases the chances of a stop run to $2.85 and possibly into support near $2.80. For now, continuing bullish market conditions could help $2.71 become support.

The swing high around $3.26 gives bulls a reasonable first target, with $3.35 also likely to draw the price upward. Higher-timeframe resistance beginning near $3.41 or $3.46 could cap the move or trigger consolidations. If bullish market conditions continue, bulls might test probable resistance near new monthly highs near $3.60.

2. Curve DAO Token (CRV)

Curve CRV is a decentralised exchange for stablecoins that uses an automated market maker (AMM) to manage liquidity. Curve has gained considerable attention by following its remit as an AMM specifically for stablecoin trading. The launch of the DAO and CRV token brought in further profitability, given CRV’s use for governance, as it is awarded to users based on liquidity commitment and length of ownership. The explosion in DeFi trading has ensured Curve’s longevity, with AMMs turning over huge amounts of liquidity and associated user profits.

CRV Price Analysis

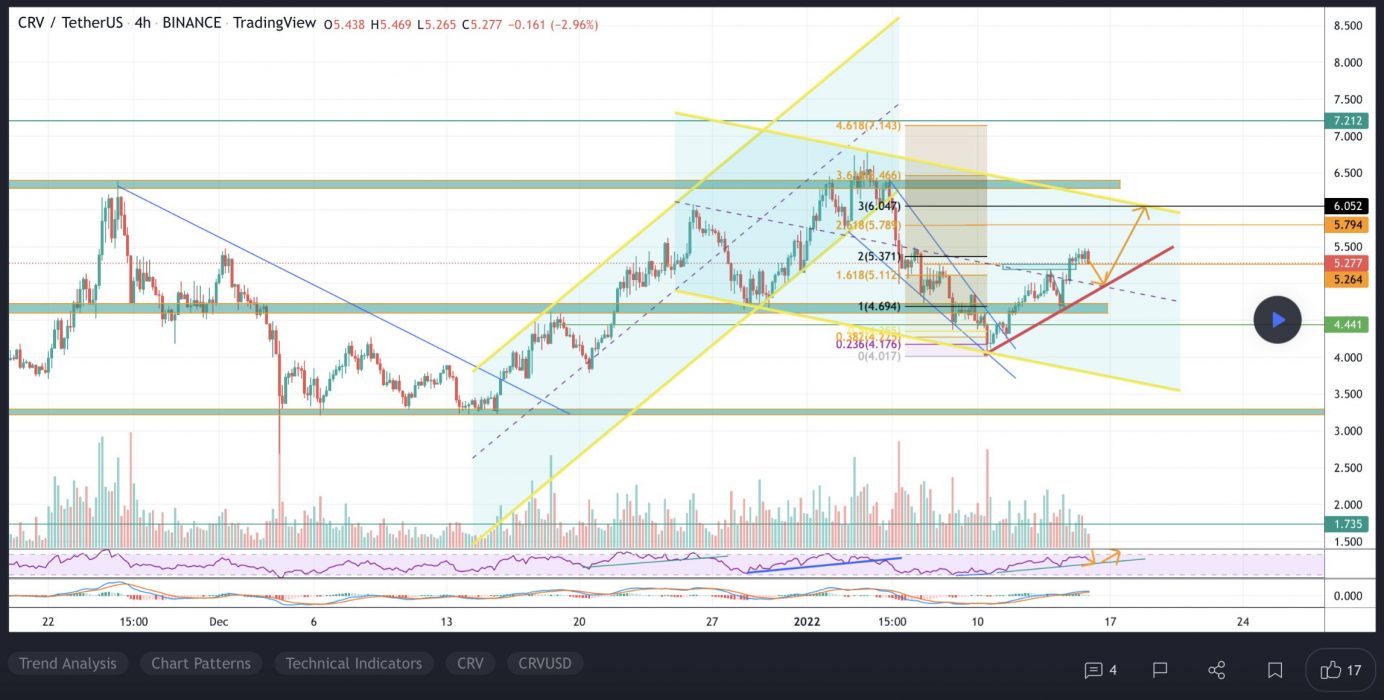
At the time of writing, CRV is ranked the 58th cryptocurrency globally and the current price is US$5.14. Let’s take a look at the chart below for price analysis:

Source: TradingView

Last week, bulls enjoyed 25% gains at CRV‘s peak before the price confirmed stiff resistance beginning at $5.44.

The 4-Hour chart shows that support may be forming between $5.00 and $4.85, near the monthly open. Aggressive bulls could enter in this area, although safer entries may be found much further below near $4.69 and $4.56 after a sweep of the current consolidation’s swing lows.

The last swing high near $5.36 provides a likely first target if the price does bounce from this region. Beyond this swing high, the 1.0 extension near $5.49 and the 2.0 extension near $5.70 and $5.94 may provide the next major targets.

3. Cardano (ADA)

Cardano ADA is a proof-of-stake blockchain platform whose stated goal is to allow “changemakers, innovators, and visionaries” to bring about positive global change. The open-source project also aims to “redistribute power from unaccountable structures to the margins to individuals”, helping to create a society that is more secure, transparent, and fair. Cardano is used by agricultural companies to track fresh produce from field to fork, while other products built on the platform allow educational credentials to be stored in a tamper-proof way, and retailers to clamp down on counterfeit goods.

ADA Price Analysis

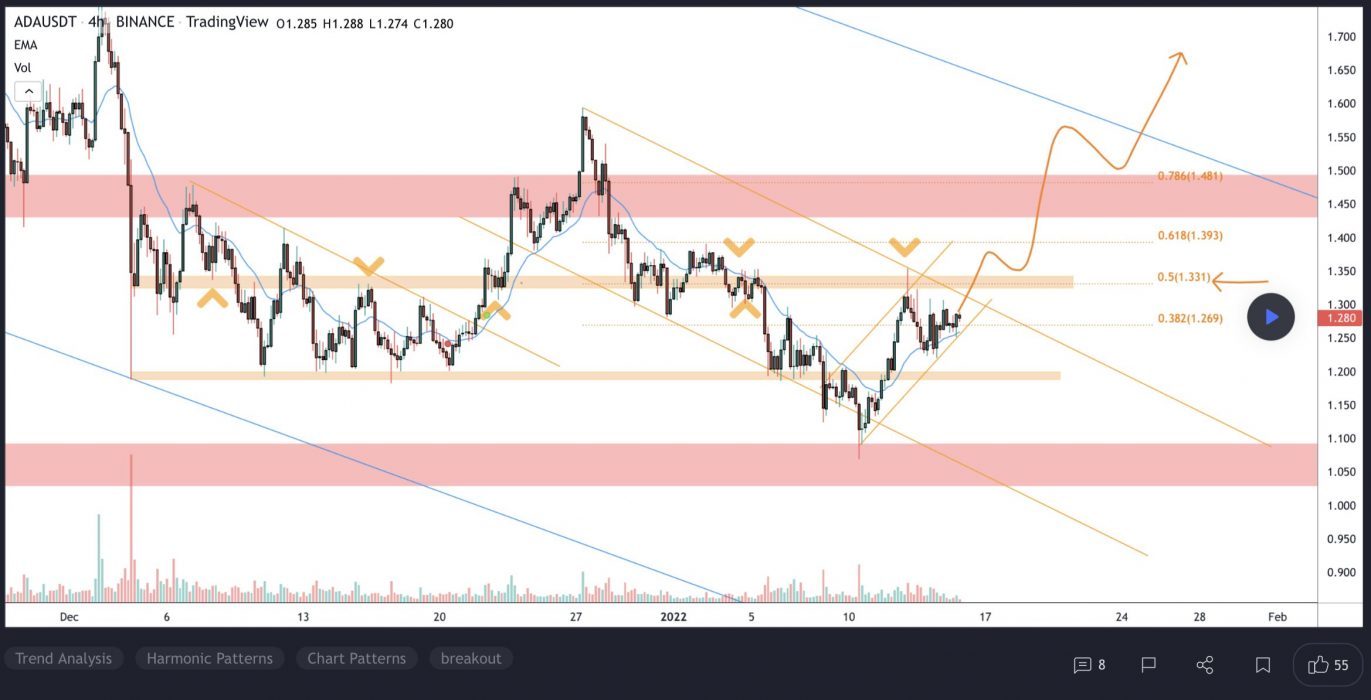
At the time of writing, ADA is ranked the 5th cryptocurrency globally and the current price is US$1.41. Let’s take a look at the chart below for price analysis:

Source: TradingView

ADA‘s nearly 75% drop from its November highs found a low near $1.12 last week before closing over a short-term high.

This daily close over the high could signal a shift in market structure that might reach probable resistance near $1.50. A sustained bullish move may target the swing high at $1.59. If this stop run occurs, a run beyond the high into probable resistance near $1.66 and $1.82 is possible.

Bulls could buy a retracement to possible support near $1.32, just above the monthly open. A bearish turn in the marketplace may propel the price toward possible support near $1.25. 

However, relatively equal lows near $1.18 and $1.12 provide an attractive target for bears if the market resumes its bearish trend. A run on these lows might find support between $1.07 and $1.02.

Learn How to Trade Live!

Join Dave and The Crypto Den Crew and they’ll show you live on a webinar how to take your crypto trading to the next level.

Where to Buy or Trade Altcoins?

These coins have high liquidity on Binance Exchange, so that could help with trading on AUD/USDT/BTC pairs. And if you’re looking at buying and HODLing cryptos, then Swyftx Exchange is an easy-to-use popular choice in Australia.

Categories
Crypto News Market Analysis NEO Trading

Top 3 Coins to Watch Today: 1INCH, NEO, ALGO – January 14 Trading Analysis

Let’s take a closer look at today’s altcoins showing breakout signals. We’ll explain what the coin is, then dive into the trading charts and provide some analysis to help you decide.

1. 1inch (1INCH)

1INCH is a decentralised exchange (DEX) aggregator, connecting several DEXes into one platform to allow its users to find the most efficient swapping routes across all platforms. In order for users to find the best price for a swap, they need to look at every exchange – DEX aggregators eliminate the need for manually checking, bringing efficiency to swapping on DEXes. 1inch has launched its 1INCH governance token, and the 1inch Network began to be governed by a decentralised autonomous organisation (DAO).

1INCH Price Analysis

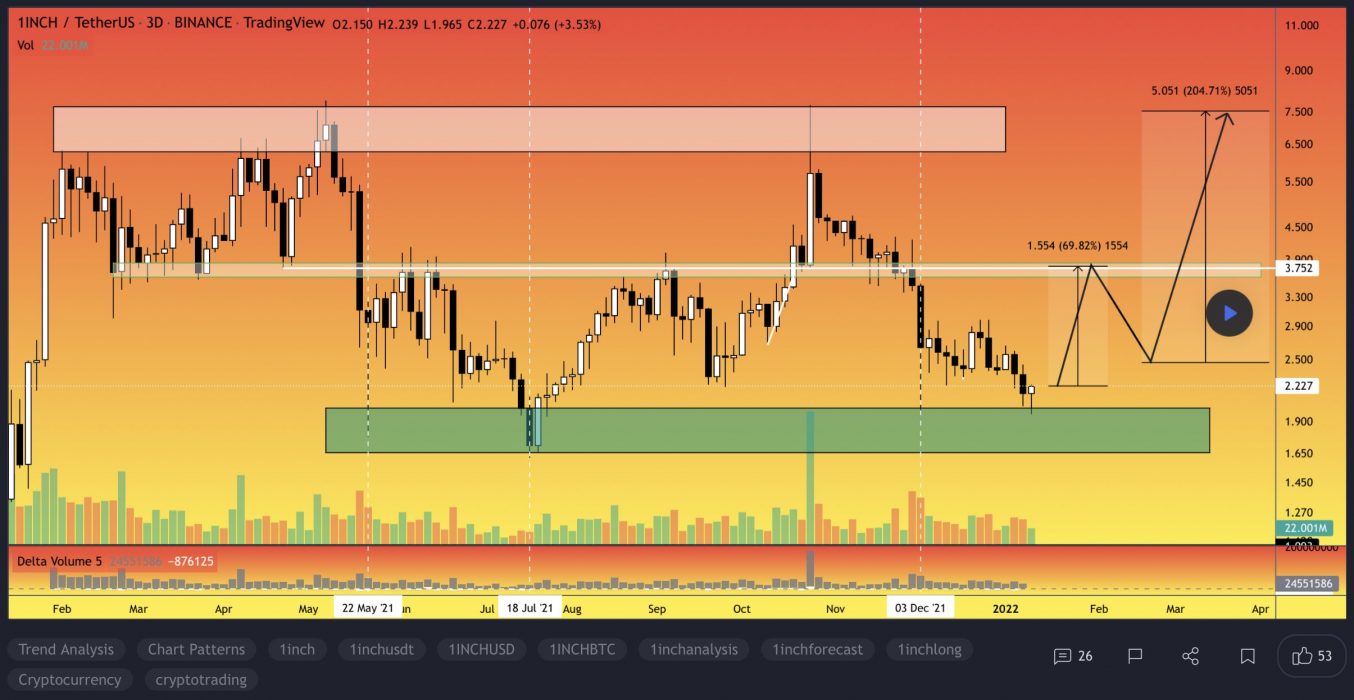
At the time of writing, 1INCH is ranked the 88th cryptocurrency globally and the current price is US$2.44. Let’s take a look at the chart below for price analysis:

Source: TradingView

After breaking its Q3 highs, 1INCH began a range that has been whiplashing both bulls and bears.

Resistance beginning near $2.80 has held the price down for the second half of December, although bulls have shown some strength near the 9 and 18 EMAs. 

A quick push to $2.58, or into the zone beginning near $2.60, could give bulls the fuel to push through the nearby resistance. If this resistance breaks, the high near $2.77 provides a reasonable target. 

A break of this level could move further into uncharted territory with the nearest probable resistances projected around $2.89 and $3.10.

More patient bulls might be waiting far below the 40 EMA with bids near the higher-timeframe range’s 45% retracement, near $2.13.

2. Neo (NEO)

NEO bills itself as a “rapidly growing and developing” ecosystem that has the goal of becoming the foundation for the next generation of the internet – a new economy where digitised payments, identities and assets come together. As well as creating a worldwide community of developers who create new infrastructure for the network and lower barriers to entry, the team behind this project operates an EcoBoost initiative that’s designed to encourage people to build decentralised apps and smart contracts on its blockchain.

NEO Price Analysis

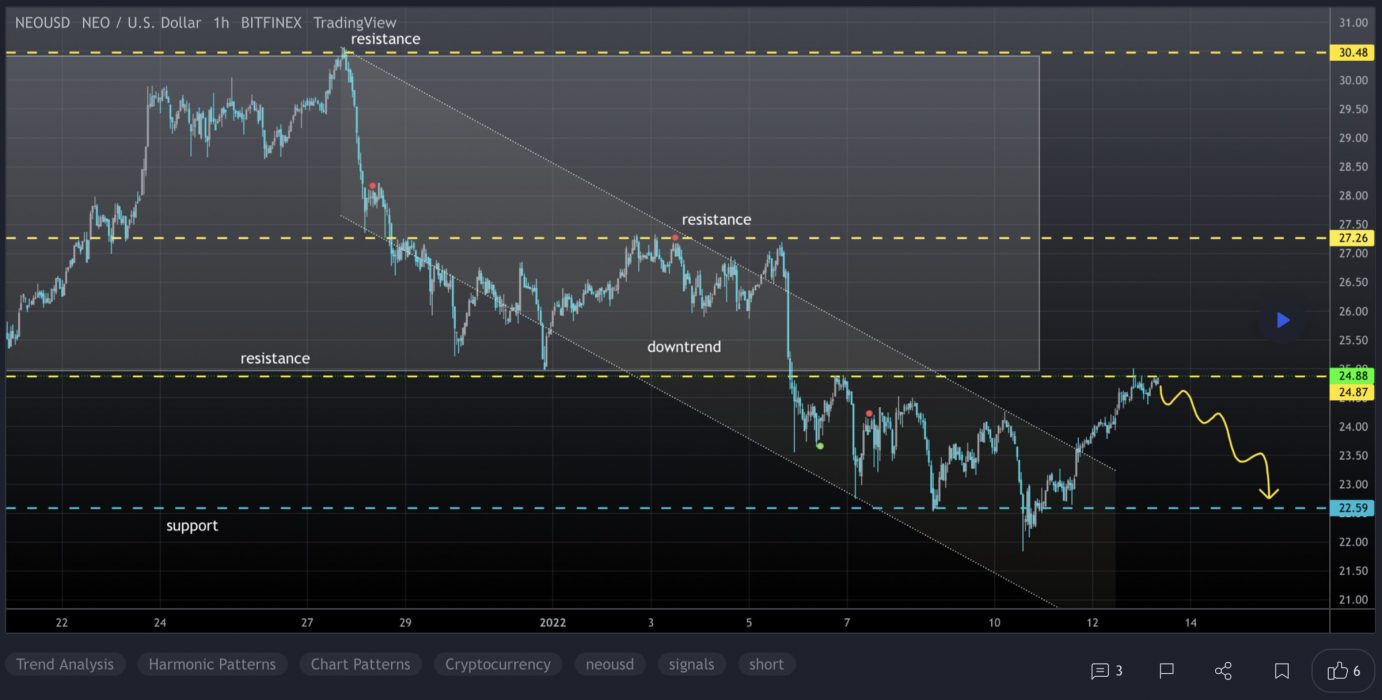
At the time of writing, NEO is ranked the 70th cryptocurrency globally and the current price is US$24.59. Let’s take a look at the chart below for price analysis:

Source: TradingView

After creating a second equal low during late December, NEO has gained nearly 30% into resistance that starts near $36.12.

Aggressive bulls looking for a continuation to the nearest cluster of relatively equal highs around $34.33 might look for bids near $39.86. More significant resistance rests above, near $42.15. A group of significant swing highs at $44.36, $46.55 and $47.23 give possible targets if this resistance breaks.

A stop run on the recent low at $22.00 into possible support beginning near $20.13 might see stronger bidding. This area also has a confluence with the August monthly open.

A bearish market shift could reach the swing low at $19.68 into possible support beginning near $17.84.

3. Algorand (ALGO)

The Algorand ALGO blockchain is a permissionless, pure proof-of-stake blockchain protocol. Unlike proof-of-work (PoW) blockchains, where the root block must be validated by randomly selected validators (using computing power), in the pure proof-of-stake approach all of the validators are known to one another and only have to agree on the next block in order to create a new block. Algorand was invented to speed up transactions and improve efficiency in response to the slow transaction times of Bitcoin and other blockchains.

ALGO Price Analysis

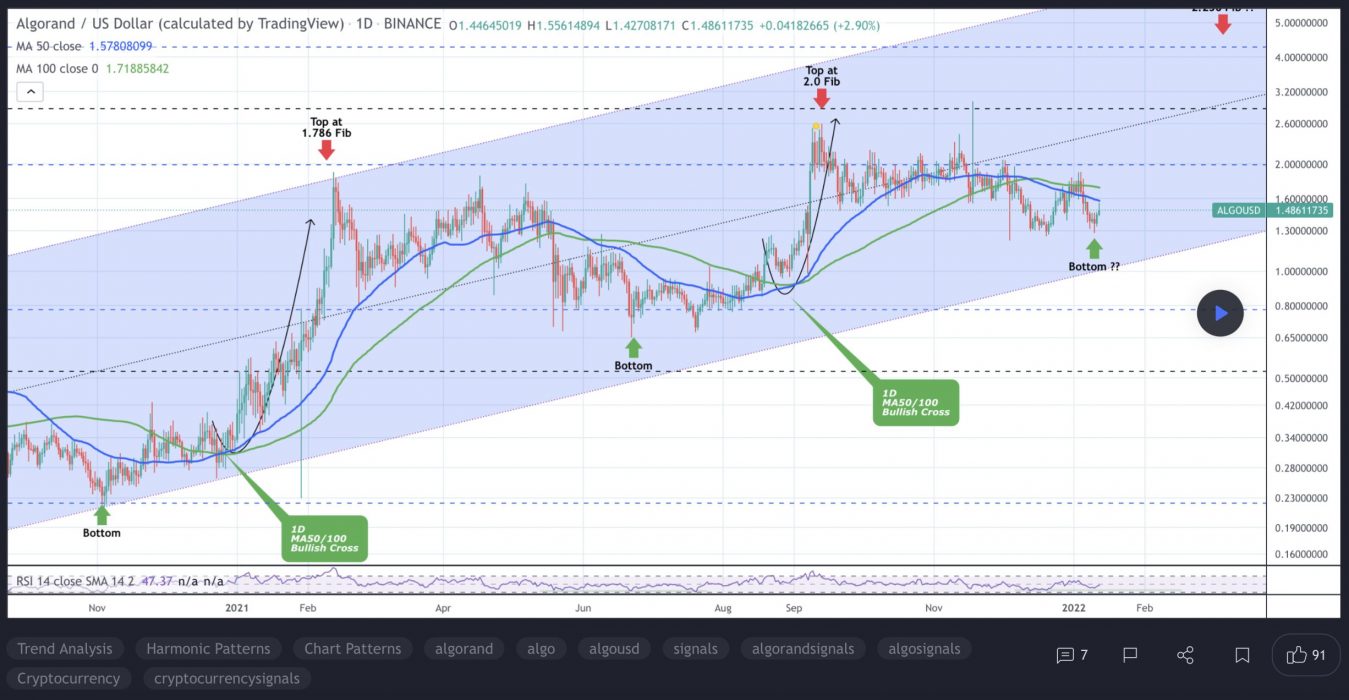
At the time of writing, ALGO is ranked the 23rd cryptocurrency globally and the current price is US$1.47. Let’s take a look at the chart below for price analysis:

Source: TradingView

After creating a second equal low in December, ALGO gained nearly 36% into resistance that starts near $1.75.

Swing traders looking for a continuation to the nearest cluster of relatively equal highs around $1.44 might look for bids near $1.36. More significant resistance rests above, near $1.58. A group of significant swing highs at $1.64 and $1.73 give possible targets if this resistance breaks.

A stop run on the recent low at $1.34 into possible support beginning near $1.30 might see stronger bidding. This area also has a confluence with the recent monthly lows.

Learn How to Trade Live!

Join Dave and The Crypto Den Crew and they’ll show you live on a webinar how to take your crypto trading to the next level.

Where to Buy or Trade Altcoins?

These coins have high liquidity on Binance Exchange, so that could help with trading on AUD/USDT/BTC pairs. And if you’re looking at buying and HODLing cryptos, then Swyftx Exchange is an easy-to-use popular choice in Australia.

Categories
Crypto News ICP Market Analysis Trading

Top 3 Coins to Watch Today: ICP, LINA, ONE – January 13 Trading Analysis

Let’s take a closer look at today’s altcoins showing breakout signals. We’ll explain what the coin is, then dive into the trading charts and provide some analysis to help you decide.

1. Internet Computer (ICP)

The Internet Computer ICP is the world’s first blockchain that runs at web speed with unbounded capacity. It also represents the third major blockchain innovation, alongside Bitcoin and Ethereum – a blockchain computer that scales smart contract computation and data, runs them at web speed, processes and stores data efficiently, and provides powerful software frameworks to developers. By making this possible, the Internet Computer enables the complete reimagination of software, providing a revolutionary new way to build tokenised internet services, pan-industry platforms, decentralised financial systems, and even traditional enterprise systems and websites.

ICP Price Analysis

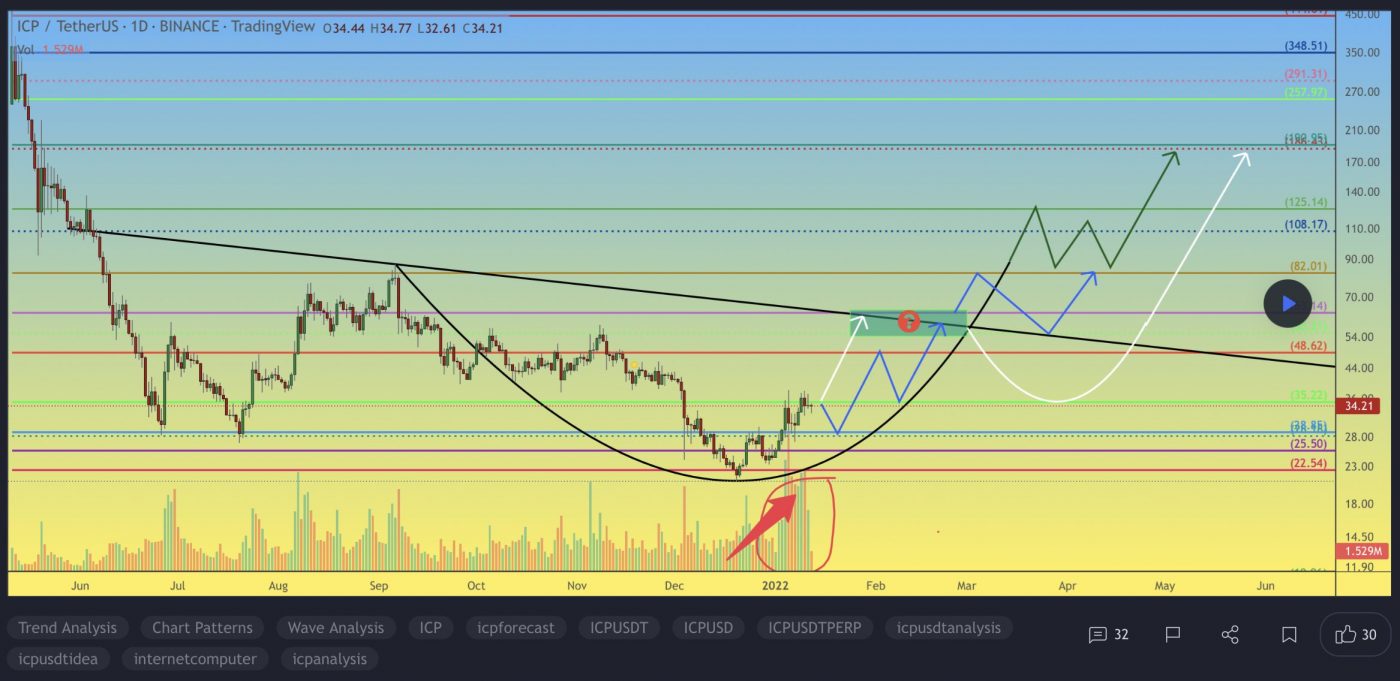
At the time of writing, ICP is ranked the 29th cryptocurrency globally and the current price is US$34.98. Let’s take a look at the chart below for price analysis:

Source: TradingView

During Q4 2021, ICP also turned the corner, breaking a key swing high. This move could suggest a longer-term bullish trend.

The swing high near $46.24 stands out as a bullish target and marks an area of probable resistance. Further continuation could reach into possible resistance starting near $58.35.

Even if the bearish trend continues, a stop run at the recent swing low near $32.30 into possible support beginning near $30.87 is reasonable. If the price reaches further down, the swing low and possible support near $29.27 might provide another downside target. 

The area near $27.85 could also provide support. However, a drop this far could suggest a stop run below the higher-timeframe relatively equal lows near $25.18 into possible support beginning around $24.73.

2. Linear (LINA)

Linear LINA is a decentralised delta-one asset protocol capable of instantly creating synthetic assets with unlimited liquidity. The project opens traditional assets like commodities, forex, market indices, and other thematic sectors to cryptocurrency users by supporting the creation of “Liquids”, Linear’s synthetic asset tokens. LINA is an ERC-20 token built on the Ethereum network whose main purpose is as collateral for Liquids (using Buildr), and for community governance of the protocol.

LINA Price Analysis

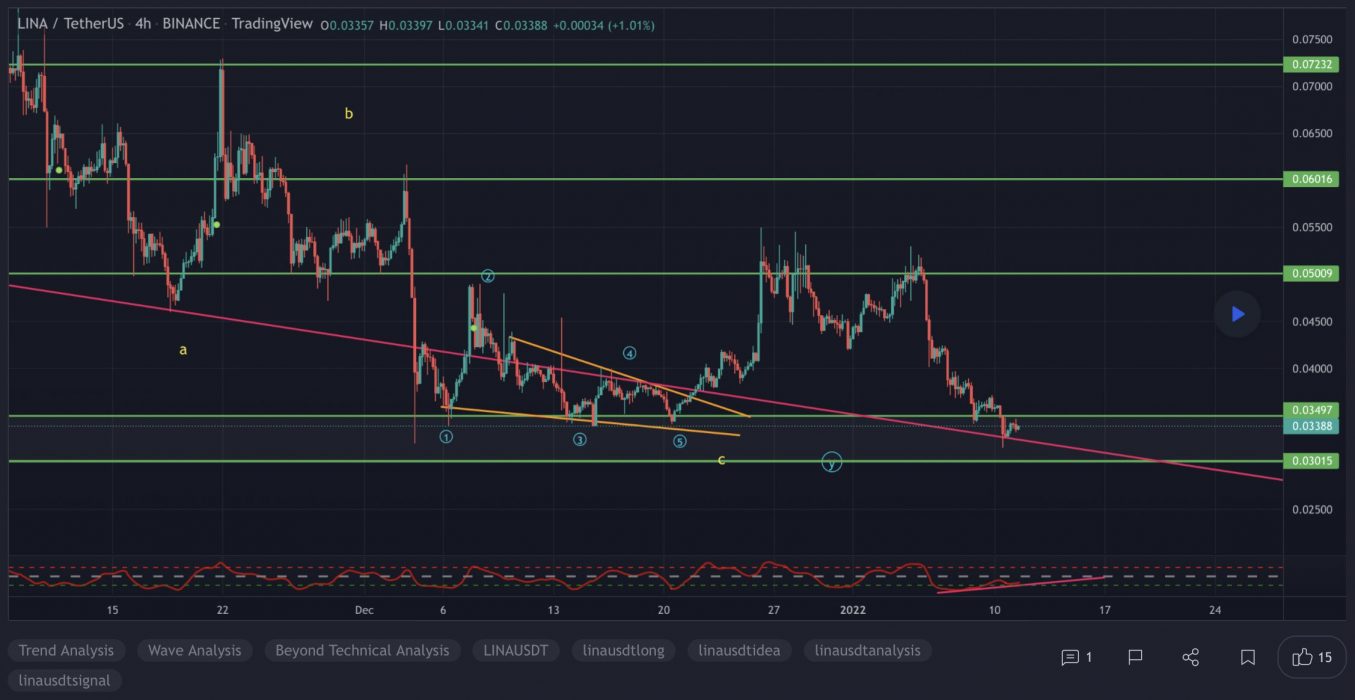
At the time of writing, LINA is ranked the 400th cryptocurrency globally and the current price is US$0.03626. Let’s take a look at the chart below for price analysis:

Source: TradingView

During December, LINA retraced almost 38%, breaking key swing lows early to mid-month. This could provide a solid support for swing traders.

The swing high near $0.04936 stands out as a bullish target and marks an area of probable resistance. Further continuation could reach into possible resistance starting near $0.05857.

Even if the bearish trend continues, a stop run at the recent swing low near $0.03312 into possible support beginning near $0.03145 is reasonable. If the price reaches further down, the swing low and possible support near $0.03010 might provide another downside target. 

3. Harmony (ONE)

Harmony ONE is a blockchain platform designed to facilitate the creation and use of decentralised applications (DApps). The network aims to innovate the way decentralised applications work by focusing on random state sharding, which allows creating blocks in seconds. Harmony was expected to introduce cross-shard contracts and a cross-chain infrastructure by the end of 2021.

ONE Price Analysis

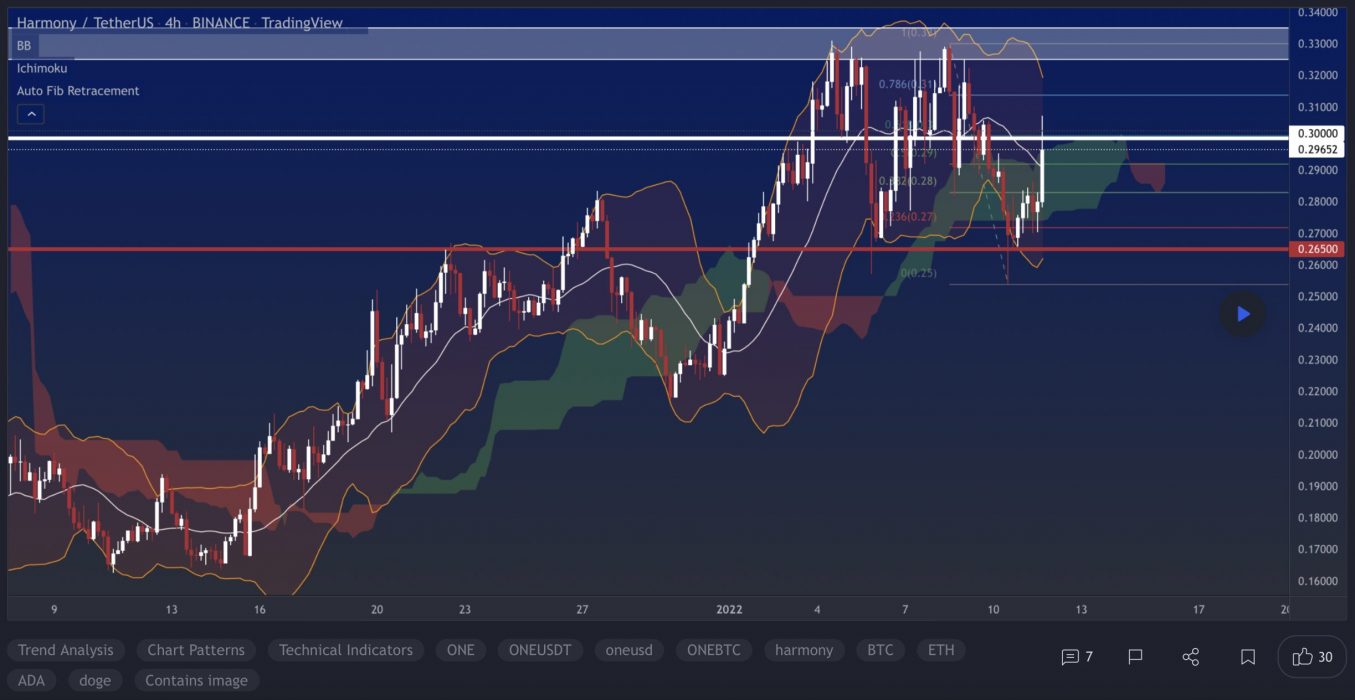
At the time of writing, ONE is ranked the 44th cryptocurrency globally and the current price is US$0.3259. Let’s take a look at the chart below for price analysis:

Source: TradingView

ONE‘s rally in mid-December stretched over 105% as the price explored new monthly highs.

Resistance has formed near $0.3415 and $0.3195. With an uncertain market and traders potentially selling, these areas could continue to provide resistance and perhaps prompt a steeper move downward.

The recent highs, overlapping with the last major leg’s 61.8% and 78.6% retracements from $0.2867 to $0.2620, could mark an area of support. Inside this zone, $0.2580 to $0.2416 could provide a more sensitive reaction. 

A more extended downtrend might reach possible support between $0.2289 and $0.2134, near the origin of the last significant bullish move.

On the other hand, if altcoins resume their bullish trends, the 25% extension near $0.3920 could be the next area of significant profit-taking by bulls.

Learn How to Trade Live!

Join Dave and The Crypto Den Crew and they’ll show you live on a webinar how to take your crypto trading to the next level.

Where to Buy or Trade Altcoins?

These coins have high liquidity on Binance Exchange, so that could help with trading on AUD/USDT/BTC pairs. And if you’re looking at buying and HODLing cryptos, then Swyftx Exchange is an easy-to-use popular choice in Australia.
Categories
Binance Coin Crypto News Market Analysis Ripple Trading

Top 3 Coins to Watch Today: BNB, XRP, SXP – January 12 Trading Analysis

Let’s take a closer look at today’s altcoins showing breakout signals. We’ll explain what the coin is, then dive into the trading charts and provide some analysis to help you decide.

1. Binance Coin (BNB)

Binance BNB is the biggest cryptocurrency exchange globally, based on daily trading volume. Binance aims to bring cryptocurrency exchanges to the forefront of world financial activity. Aside from being the largest cryptocurrency exchange, Binance has launched a whole ecosystem of functionalities for its users. The Binance network includes the Binance Chain, Binance Smart Chain, Binance Academy, Trust Wallet, and Research projects, which all employ the powers of blockchain technology to bring new-age finance to the world. Binance Coin is an integral part of the successful functioning of many of the Binance sub-projects.

BNB Price Analysis

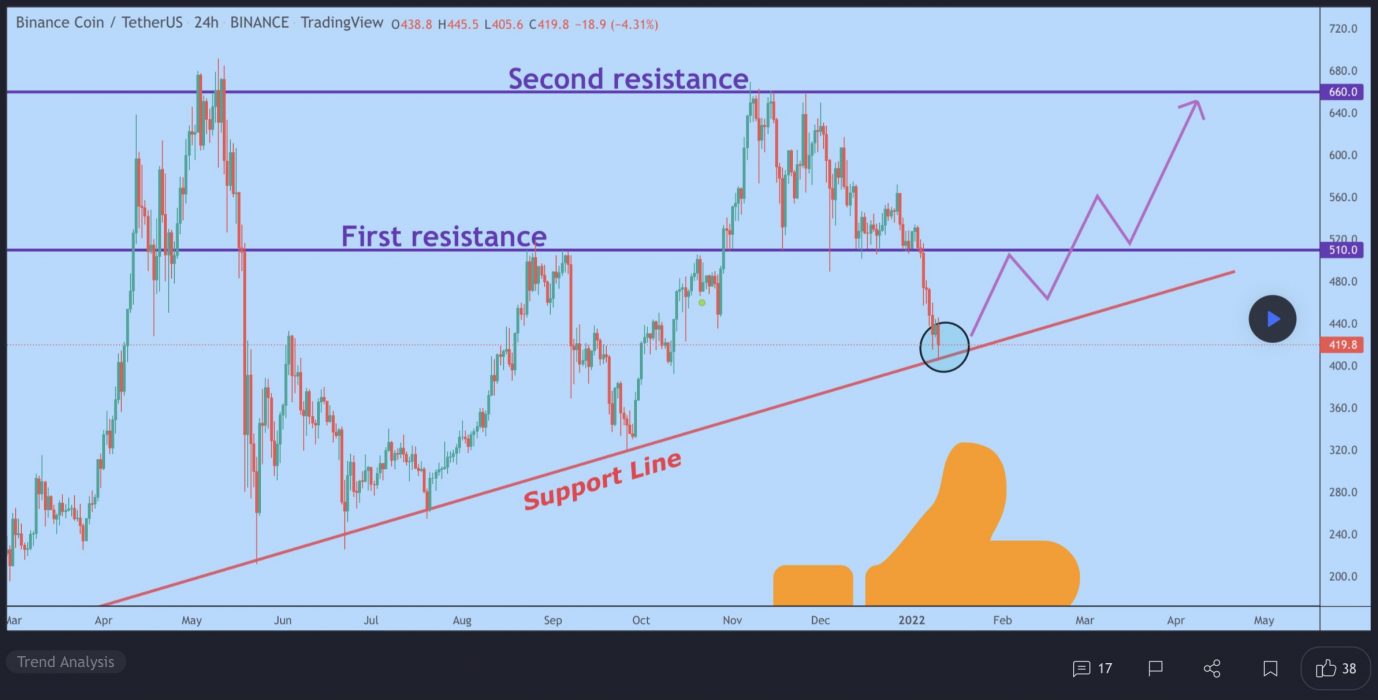
At the time of writing, BNB is ranked the 4th cryptocurrency globally and the current price is US$452.33. Let’s take a look at the chart below for price analysis:

Source: TradingView

After a 45% decline from December, BNB has ranged between $438 and $523.

The recent rally was approaching probable resistance near $470, but could be aiming for stops above the relatively equal highs near $485. Continuation of the bullish move could target the daily gap near $505.

Aggressive bulls might add to positions near $439 and $430. Price action near $421 may be more likely to provide support – if it gets there – during any retracements.

Relatively equal lows clustered around $411 seem likely to be swept if the bearish trend resumes. If this move occurs, the price might find support at the significant higher-timeframe level near $390.

2. Ripple (XRP)

Ripple XRP is the currency that runs on a digital payment platform called RippleNet, on top of a distributed ledger database called XRP Ledger. While RippleNet is run by a company called Ripple, the XRP Ledger is open-source and is not based on a blockchain, but rather the previously mentioned distributed ledger database.

XRP Price Analysis

At the time of writing, XRP is ranked the 8th cryptocurrency globally and the current price is US$0.7379. Let’s take a look at the chart below for price analysis:

Source: TradingView

XRP‘s 35% climb retracement from December reached to the monthly open, sweeping lows several times down to $0.7122. Last week, the price bounced from the monthly open near $0.7443 again, creating possible support near $0.7055. A quick sweep of this recent swing low could reach into a support area near $0.6812, while a sharp downturn in the market is likely to run for the relatively equal lows near $0.6525.

If the price breaks through the closest significant resistance near $0.7956, the swing high at $0.8434 is a likely target. This move could reach a daily gap of near $0.8932.

Strong bullish momentum could propel the price to resistance near $0.9425. If this move occurs, the significant swing high near $1.12 provides a reasonable goal.

3. Swipe (SXP)

Swipe SXP is a platform that looks to form a bridge between the fiat and cryptocurrency worlds with its API that is designed to create global payment cards powered by its native SXP token. Swipe also has an on-chain product called Swipe Swap, an Automated Market Maker which is forked by Uniswap, SushiSwap and THORchain, and is powered by Swipechain. This ecosystem is powered by the Swipe Token SXP, which functions as the fuel for the Swipe Network, and is used for paying transaction fees and securing Swipechain through bonding and governance.

SXP Price Analysis

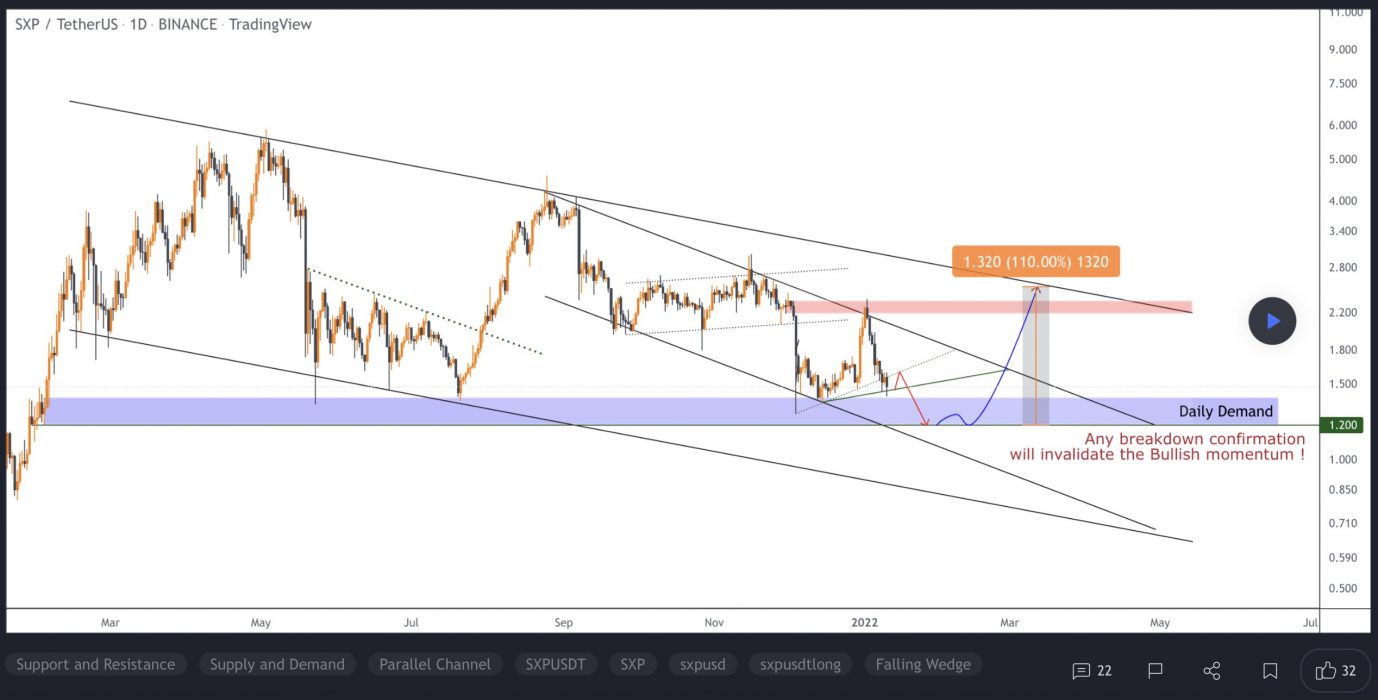
At the time of writing, SXP is ranked the 170th cryptocurrency globally and the current price is US$1.47. Let’s take a look at the chart below for price analysis:

Source: TradingView

SXP has retraced over 60% from last month as the price consolidates near the weekly gap beginning near $1.50.

The equal lows at this weekly gap are likely to see a stop run before any further move up. The area near $1.42 at the top of a daily gap could provide support. 

More probable support begins at the bottom of the gap, ranging from approximately $1.36 to the consolidation that started the massive move upward. If this level fails, traders could look for sensitivity near the middle of the monthly gap near $1.30.

Impulses upward during retracement are likely, but the most substantial resistance is likely just below the swing high near $1.56. This swing high provides a clear first target, with extensions near $1.63, $1.70 and $1.78.

Learn How to Trade Live!

Join Dave and The Crypto Den Crew and they’ll show you live on a webinar how to take your crypto trading to the next level.

Where to Buy or Trade Altcoins?

These coins have high liquidity on Binance Exchange, so that could help with trading on AUD/USDT/BTC pairs. And if you’re looking at buying and HODLing cryptos, then Swyftx Exchange is an easy-to-use popular choice in Australia.
Categories
Crypto News Market Analysis Polkadot Trading

Top 3 Coins to Watch Today: FTM, SAND, DOT – January 11 Trading Analysis

Let’s take a closer look at today’s altcoins showing breakout signals. We’ll explain what the coin is, then dive into the trading charts and provide some analysis to help you decide.

1. Fantom (FTM)

Fantom FTM is a directed acyclic graph (DAG) smart contract platform providing decentralised finance (DeFi) services to developers using its own bespoke consensus algorithm. Together with its in-house token FTM, Fantom aims to solve problems associated with smart-contract platforms – specifically transaction speed, which developers say they have reduced to under two seconds.

FTM Price Analysis

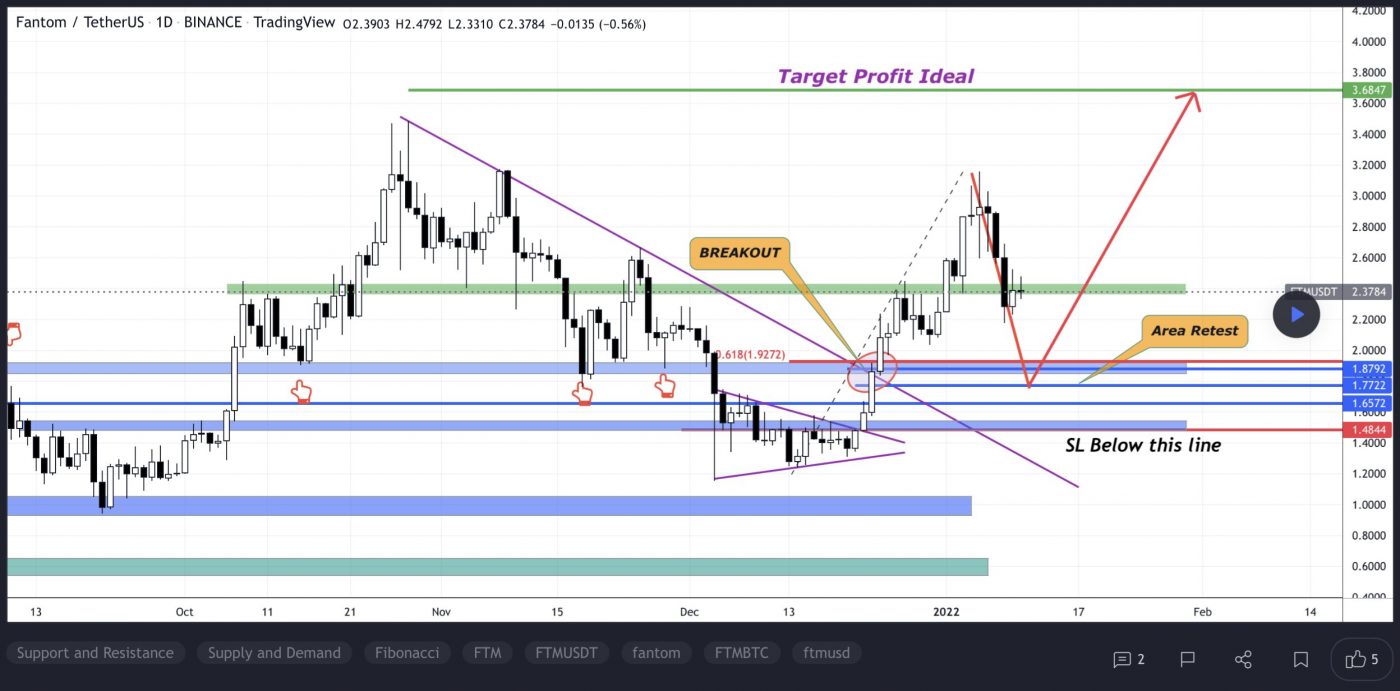
At the time of writing, FTM is ranked the 30th cryptocurrency globally and the current price is US$2.20. Let’s take a look at the chart below for price analysis:

Source: TradingView

FTM‘s 174% bounce from the December low ran into resistance near the old all-time highs. This rejection created a set of relatively equal highs near $3.15, possibly forming the next bullish leg’s target. Until then, the price will likely encounter resistance near $2.86.

Currently, the price is testing possible support near the January open, around $2.28. This level also has confluence with the 78.6% retracement of the current local range and the 18 and 40 EMAs. 

If this level fails to provide support, a zone from $1.90 to $1.71 might mark a possible swing low or consolidation area. This zone is between the 61.8% and 78.6% retracement of December’s swing.

A more bearish tone in the market could propel the price lower. The December lows, near $1.19, might mark an area of possible support as well as a bearish target.

2. The Sandbox (SAND)

The Sandbox SAND is a blockchain-based virtual world allowing users to create, build, buy and sell digital assets in the form of a game. By combining the powers of decentralised autonomous organisations (DAOs) and non-fungible tokens (NFTs), the Sandbox creates a decentralised platform for a thriving gaming community. The Sandbox employs the powers of blockchain technology by introducing the SAND utility token, which facilitates transactions on the platform.

SAND Price Analysis

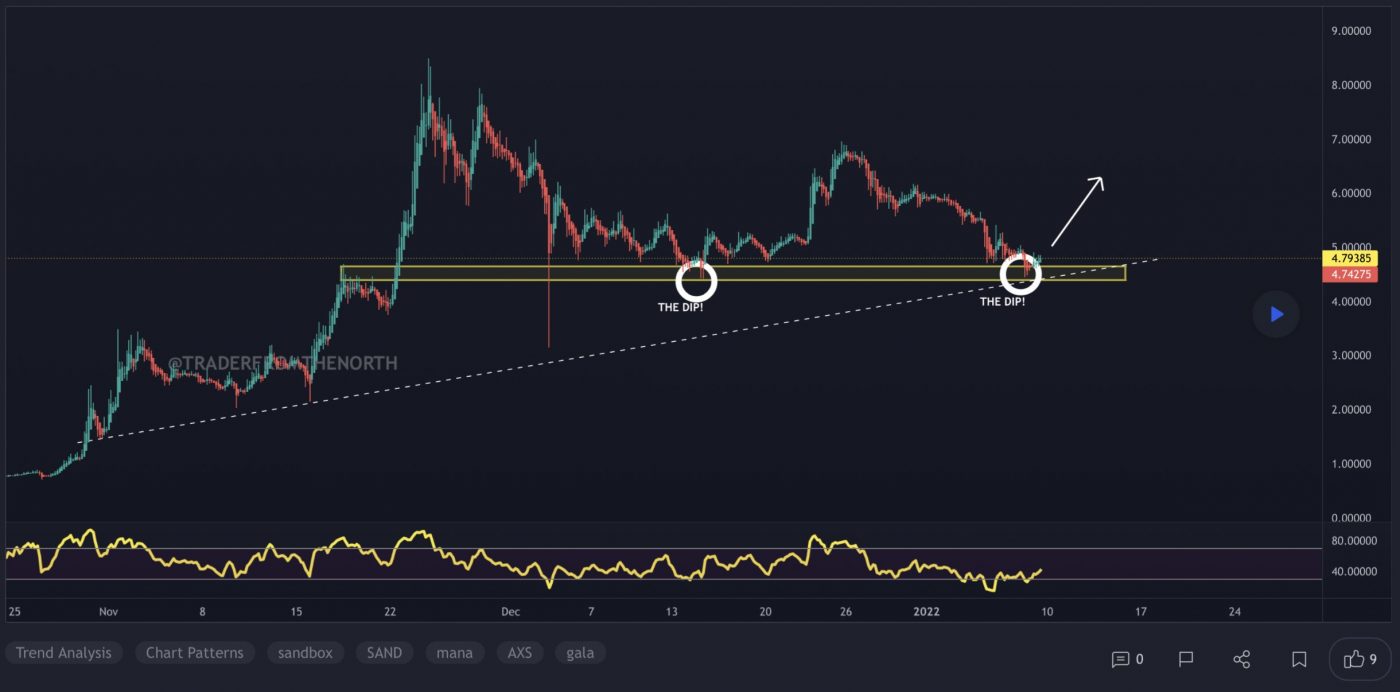
At the time of writing, SAND is ranked the 38th cryptocurrency globally and the current price is US$4.37. Let’s take a look at the chart below for price analysis:

Source: TradingView

SAND‘s impressive 1192% rally during Q4 halted at $8.48 before retracing 51% of the move. This price action created several areas of possible higher-timeframe resistance in the process.

The price found resistance on its last swing upward near $6.72 – an area that could provide resistance again. If this swing high breaks, the price might find resistance near $7.51. If this area does provide resistance, it would suggest the formation of a higher-timeframe consolidation.

The fast move up left little higher-timeframe support. However, a vast zone between $4.12 and $2.45 has provided support before and could give support again on a retest. This zone is between the 61.8%-to-78.6% retracement levels of Q4’s parabolic move.

Inside this zone, the consolidation high near $3.58 to $3.19 might see more sensitivity and mark the bearish target.

Continuation downward through this level, especially if the overall market remains bearish, could retrace most of Q4’s move to the next higher-timeframe support near $1.44.

3. Polkadot (DOT)

Polkadot DOT is an open-source sharding multichain protocol that facilitates the cross-chain transfer of any data or asset types, not just tokens, thereby making a wide range of blockchains interoperable with each other. Polkadot’s native DOT token serves three clear purposes: providing network governance and operations, and creating parachains by bonding. The Polkadot protocol connects public and private chains, permissionless networks, oracles and future technologies, allowing these independent blockchains to trustlessly share information and transactions through the Polkadot relay chain.

DOT Price Analysis

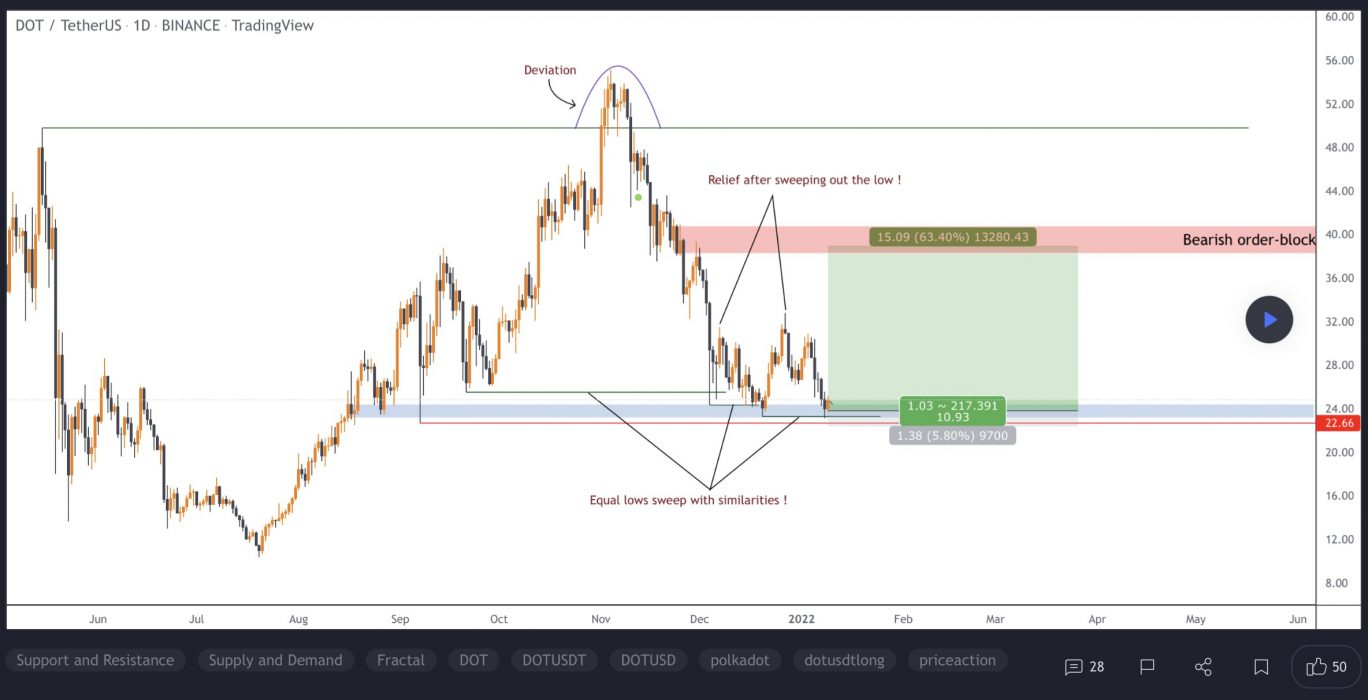
At the time of writing, DOT is ranked the 10th cryptocurrency globally and the current price is US$23.77. Let’s take a look at the chart below for price analysis:

Source: TradingView

DOT has remained between approximately $24.76 and $31.25 since its retracement from November 2021.

Continual retests of the $22.34 level might signify that the price is ready to run to the larger range’s lows – particularly if traders dump their holdings following the recent Bitcoin price crash. 

If this move down occurs, a broad zone from $21.56 to $19.84 may provide support. The upper portion of this zone may see more sensitivity.

Continued bearish market conditions could prompt continuation down through the level. If so, the next higher timeframe area of interest for bulls is likely near $17.96.

The 9, 18 and 40 EMAs, near $27.52, might provide resistance before running the range lows. This area has confluence with multiple swing highs and lows. 

However, the current proximity to the local range low could prompt a move toward the range highs. If so, $29.44 might be the near-term target for bulls. Before entering, traders might wait for confirmation that one direction is more likely to unfold.

If the overall market becomes more bullish, the price could continue through the local range highs. If so, a zone from $31.76 to $35.81 – particularly the lower half – could see profit-taking from bulls.

Learn How to Trade Live!

Join Dave and The Crypto Den Crew and they’ll show you live on a webinar how to take your crypto trading to the next level.

Where to Buy or Trade Altcoins?

These coins have high liquidity on Binance Exchange, so that could help with trading on AUD/USDT/BTC pairs. And if you’re looking at buying and HODLing cryptos, then Swyftx Exchange is an easy-to-use popular choice in Australia.

Categories
Market Analysis The Crypto Den

TradeRoom: Our Weekly Crypto Trades Analysis – Jan 10, 2022

Welcome to this weekly series from the TradeRoom. My name is Dave and I’m the founder of The Crypto Den, an Australian-based crypto trading and education community aiming to give you the knowledge to take your trading game to the next level.

Crypto Market Outlook

Welcome to my first analysis of 2022! I hope all of you had a wonderful break over the holiday period and have been keeping safe!

Bitcoin has seen some nice bearish price action over the holidays, which wasn’t overly unexpected. Coming into Christmas, the warning was basically to expect volatility as when the market loses liquidity it becomes easier for big swings to occur.

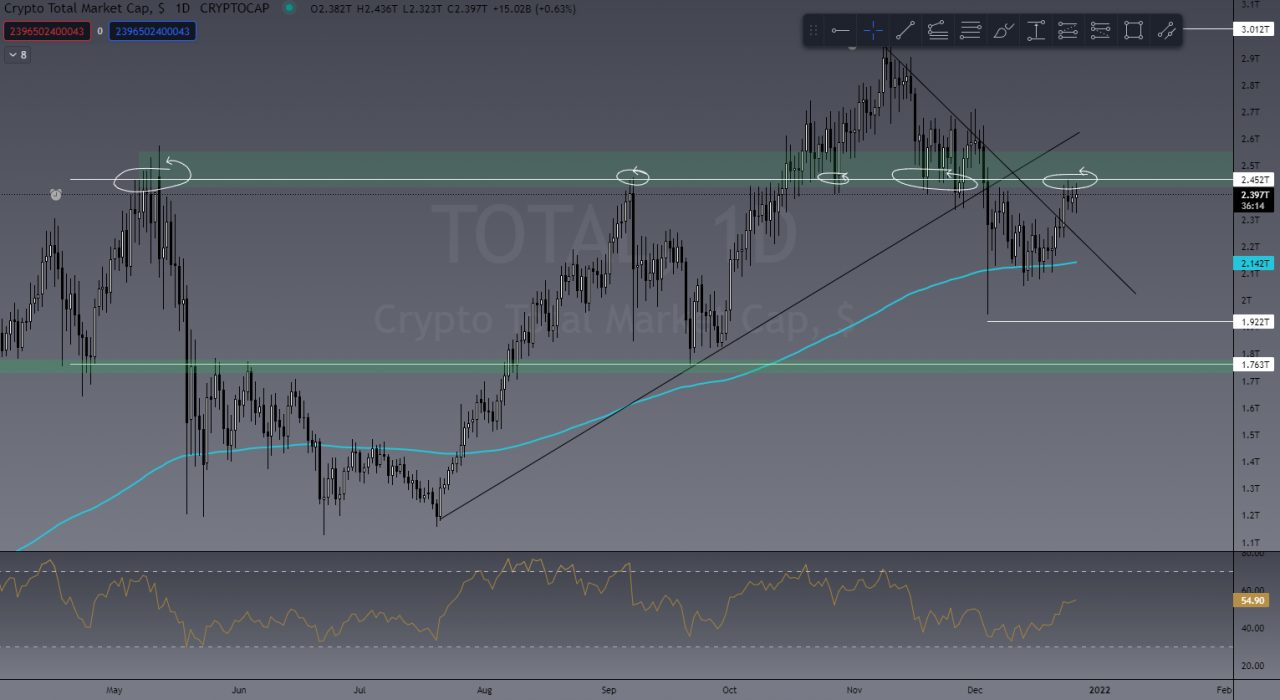
In my last article of 2021, I pointed out that the TOTAL market cap was hitting a key level of resistance and it failed to break through spectacularly, wiping off US$500 billion. There’s a pretty good chance we’ll see some consolidation before more downside to the US$1.7 trillion level.

TOTAL Market Cap

Image of TOTAL chart from last month
Current TOTAL chart

BTC/USD

Keeping it really basic this week, BTC is sitting right on what’s probably the most important level of support/resistance. If this US$40,000 level of support holds, my current analysis shows a bounce in price action to US$45,000, however, and here’s the warning – if there is low volume in such a move, I’d be confident in saying it’s a relief rally before further downside. The only point at which I’ll become full bull again is if BTC breaks and closes above US$53,000. Yep, US$10,000+ trading range needs to be cleared before I’m comfortable with a bullish cycle.

A bullish case for BTC

Does this mean I won’t trade within this range? No. As traders we stay fluid and move with the market, and trade the session we are in.

For me at the moment, the two most likely moves we will see from BTC are:

  • a relief rally to US$45,000, then a large sell-off of over US$10,000 taking us to US$35,000; or
  • this current level of support fails and we go straight to US$35,000-US$30,000.

Regardless, I’m still expecting more downside action.
My game plan? Well, I’m already in short trades on both BTC and ETH so I will keep these open until I see some candlestick analysis suggesting an uptick in price action. I will likely add to my positions if we hit the US$45,000 dead cat bounce.

Bearish case for BTC

In short, this level of support at US$40,000 must hold or things will get very red very soon.


Last Week’s Performance

Apart from my two shorts in BTC and ETH, I haven’t really been trading over the Christmas break so I don’t have any to share at this time. So I will share my entries on BTC and ETH:

BTC/USDT

My BTC short entry

After the first big sell-off from the beginning of December, BTC has seen a bounce in PA back to US$51,000, which was also the 61.8% Fibonacci retrace zone of the previous structure. My reason for entry was the four-day rejection at this key level and buyer exhaustion wicks. On a 20x trade, this short has yielded just under 400% profit in the most recent drop. This is basic price action trading using support and resistance (S&R).

ETH/USDT

My ETH short entry

Like BTC, my short entry on ETH was based on the basics of S&R and Fibonacci. ETH retraced 61.8% of the previous structure and after four days of bearish candles I entered from a buyer exhaustion wick. This is a 10x trade, currently sitting at 250% profit. The trade is still active.

This outlines the importance of understanding candlestick analysis at key levels of support and resistance and having the patience to wait for the market to come to you.


This Week’s Trades

This week I won’t be sharing any new trade entries. The reason for this is that I believe at this stage the market will see further downside, and most people are buying and selling assets as opposed to trading futures.

I will be keeping my short trades for BTC and ETH open unless candlestick analysis shows me a reason to close them. I might enter ALT short trades if a good setup is there, but that’s a big maybe. The market needs a clear direction first.


Learn to Trade

If you would like to learn how to read, understand and trade these charts, I have good news!

The Crypto Den is holding its first of only two trading courses for 2022 on February 7! That’s right, we will only be running two programs in 2022! What makes us different? Our lessons are LIVE and come with a community where you submit your homework and receive feedback to ensure you understand what we teach!

Duration: 6 week course
Date/Time: Live trading course twice a week on Mon and Wed at 7pm AEST
Frequency: We now run our LIVE course only twice per year
Location: Zoom Webinar
From: February 7 to March 21

The Crypto Den’s Trading Fundamentals trading course is a LIVE interactive course designed to teach you how to trade the crypto markets from absolute beginner level!

Our six-week program teaches you how to set up your trade accounts using reputable exchanges and brokers, how to read the charts using technical analysis, and to protect your capital using effective risk management strategies.

We have taught thousands of students of the past five years how to trade these volatile and highly profitable markets. See our REAL reviews from REAL students.

Using ZOOM twice a week, all of our lessons are LIVE and recorded so you can access them over and over again in our structured course through our website and smartphone app. Lessons come with homework and online quizzes, as well as an amazing online and private community of students.

So what are you waiting for? Join now to start learning!


Already Know How to Trade?

Invite to Join our TradeRoom

If you’d like to become a better trader, you’re invited to join our TradeRoom where we share daily charts and market analysis. In our community we strongly encourage and teach correct risk management strategies to keep our members safe in this new volatile crypto market.
Join our “Apprentice” plan now for your 7-day trial.


The Crypto Den was created in 2017 to help the rapidly growing crypto community learn and understand the fundamentals of digital currencies and how to trade them. 

Since then we have taught thousands of members the basics of technical analysis and trading strategies to further progress and perfect their trading abilities.

In the TradeRoom you will be included in a supportive environment which encourages personal growth, education and community support.

It’s a place to share your trading ideas and follow other experienced traders’ feeds to help keep your finger on the pulse of such a volatile market!

Categories
Crypto News Dash Market Analysis Stellar Trading

Top 3 Coins to Watch Today: CRV, XLM, DASH – January 10 Trading Analysis

Let’s take a closer look at today’s altcoins showing breakout signals. We’ll explain what the coin is, then dive into the trading charts and provide some analysis to help you decide.

1. Curve DAO Token (CRV)

Curve CRV is a decentralised exchange for stablecoins that uses an automated market maker (AMM) to manage liquidity. Curve has gained considerable attention by following its remit as an AMM specifically for stablecoin trading. The launch of the DAO and CRV token brought in further profitability, given CRV’s use for governance, as it is awarded to users based on liquidity commitment and length of ownership. The explosion in DeFi trading has ensured Curve’s longevity, with AMMs turning over huge amounts of liquidity and associated user profits.

CRV Price Analysis

At the time of writing, CRV is ranked the 59th cryptocurrency globally and the current price is US$4.59. Let’s take a look at the chart below for price analysis:

Source: TradingView

Last week, bulls enjoyed 65% gains at CRV‘s peak before the price confirmed stiff resistance beginning at $6.58.

The 4-Hour chart shows that support may be forming between $3.86 and $3.75, near the monthly open. Aggressive bulls could enter in this area, although safer entries may be found much further below near $4.29 and $4.05 after a sweep of the current consolidation’s swing lows.

The last swing high near $4.80 provides a likely first target if the price does bounce from this region. Beyond this swing high, the 1.0 extension near $5.26 and the 2.0 extension near $5.72 and $5.94 may provide the next major targets.

2. Stellar (XLM)

Stellar XLM is an open network that allows money to be moved and stored. When it was released, the goal was boosting financial inclusion by reaching the world’s unbanked – but soon after, its priorities shifted to helping financial firms connect with one another through blockchain technology. The network’s native token, lumens, serves as a bridge that makes it less expensive to trade assets across borders. All of this aims to challenge existing payment providers who often charge high fees for a similar service.

XLM Price Analysis

At the time of writing, XLM is ranked the 29th cryptocurrency globally and the current price is US$0.2573. Let’s take a look at the chart below for price analysis:

Source: TradingView

XLM set a high near $0.4257 in November before retracing nearly 75% to find a low near $0.2380. The price consolidated around this level before the strong bullish impulse during the past several weeks.

Probable resistance near $0.3578 is slowing the bullish advance down. However, another leg might target the last swing high at $0.4022 and relatively equal highs at $0.4336. Resistance near $0.4659 could cap the move before the second swing high. Beyond these levels, little stands in the bulls’ way before reaching the swing high near $0.5149.

A retracement before a move higher might find support in the daily gap near $0.2323, just above the monthly open. Relatively equal lows near $0.2275 could also provide support. A run-on stops at $0.2016 and $0.1931 might find support in the gap beginning near $0.1900 or a high-timeframe level near $0.1723.

3. Dash (DASH)

Dash is an open-source blockchain and cryptocurrency focused on offering a fast, cheap global payments network that is decentralised in nature. According to the project’s white paper, Dash seeks to improve on Bitcoin by providing stronger privacy and faster transactions. Dash’s governance system, or treasury, distributes 10% of the block rewards for the development of the project in a competitive and decentralised way.

DASH Price Analysis

At the time of writing, DASH is ranked the 70th cryptocurrency globally and the current price is US$143.97. Let’s take a look at the chart below for price analysis:

Source: TradingView

During December, DASH retraced over 63% before finding support near $120. Consolidation above this level has created a series of relatively equal lows, which are likely to be swept before any longer-term bullish trend begins. 

In the shorter term, the price might establish support near $138 before running the swing high at $155. If this bullish move occurs, the price could reach resistance near the November monthly open around $175, and may even sweep the swing high near $182.

Some support might exist at the daily gap near $128. A move this low would also fill the monthly gap and set the stage for a possible bullish reversal.

Learn How to Trade Live!

Join Dave and The Crypto Den Crew and they’ll show you live on a webinar how to take your crypto trading to the next level.

Where to Buy or Trade Altcoins?

These coins have high liquidity on Binance Exchange, so that could help with trading on AUD/USDT/BTC pairs. And if you’re looking at buying and HODLing cryptos, then Swyftx Exchange is an easy-to-use popular choice in Australia.

Categories
Crypto News Market Analysis Trading

Top 3 Coins to Watch Today: ATOM, AAVE, AVAX – January 7 Trading Analysis

Let’s take a closer look at today’s altcoins showing breakout signals. We’ll explain what the coin is, then dive into the trading charts and provide some analysis to help you decide.

1. Cosmos (ATOM)

Cosmos ATOM bills itself as a project that solves some of the “hardest problems” facing the blockchain industry. It aims to offer an antidote to “slow, expensive, unscalable and environmentally harmful” proof-of-work protocols, like those used by Bitcoin, by offering an ecosystem of connected blockchains. ATOM tokens are earned through a hybrid proof-of-stake algorithm and they help to keep the Cosmos Hub, the project’s flagship blockchain, secure. This cryptocurrency also has a role in the network’s governance.

ATOM Price Analysis

At the time of writing, ATOM is ranked the 25th cryptocurrency globally and the current price is US$38.53. Let’s take a look at the chart below for price analysis:

Source: TradingView

December provided respectable 115% gains for bulls who bought ATOM at the monthly open, with the price finding resistance near $42.12.

If bears take back control this month, the top of the former gap beginning at $35.44 may provide support for at least a short-term bounce. The top of the consolidation range starting near $33.58 is more likely to provide substantial support.

The most robust support is likely to be found in the overlapping consolidation ranges between $31.74 and $29.06, with a sharp slice through these levels possibly suggesting the end of the bull run.

The region from approximately $40.70 to the most recent swing high is likely to provide some resistance. The swing high provides a reasonable first target for a possible next leg up. 

If this high breaks, the 1.0 extension near $45.21 and the 2.0 extension near $52.90 may provide the next primary new high targets.

2. Aave (AAVE)

AAVE is a decentralised finance protocol that allows people to lend and borrow crypto. Lenders earn interest by depositing digital assets into specially created liquidity pools. Borrowers can then use their crypto as collateral to take out a flash loan using this liquidity. AAVE provides holders with discounted fees on the platform, and it also serves as a governance token – giving owners a say in the future development of the protocol.

AAVE Price Analysis

At the time of writing, AAVE is ranked the 49th cryptocurrency globally and the current price is US$223.61. Let’s take a look at the chart below for price analysis:

Source: TradingView

AAVE‘s strong downtrend that began in November has retraced most of its Q4 move, recently sweeping lows near $190 but struggling to find strong support.

A sweep of the relatively equal lows near $215 into possible support around $210, combined with bullish market conditions, could be the catalyst that begins to form a bottom. If this level fails, bulls might buy the monthly gap’s low near $197.

The swing high near $238 may form resistance to any sudden pumps as holders unload some of their position. A more substantial move might sweep relatively swing highs into probable resistance near $246, potentially reaching up to the new monthly high near $255 and $260.

3. Avalanche (AVAX)

Avalanche AVAX is the fastest smart contracts platform in the blockchain industry, as measured by time-to-finality, and has the most validators securing its activity of any proof-of-stake protocol. Avalanche is blazingly fast, low-cost, and green. Any smart contract-enabled application can outperform its competition on Avalanche. AVAX is the native token of Avalanche. It is a hard-capped, scarce asset that is used to pay for fees, secure the platform through staking, and provide a basic unit of account between the multiple subnets created on Avalanche.

AVAX Price Analysis

At the time of writing, AVAX is ranked the 11th cryptocurrency globally and the current price is US$94.61. Let’s take a look at the chart below for price analysis:

Source: TradingView

AVAX‘s 75% rally in December ended with an almost 49% retracement as the rest of the altcoin market dropped. Bulls stepped in near the 61.8% retracement of Q4’s move, creating a consolidation that ended with last week’s bullish impulse to resistance near $114.35.

With the 9, 18 and 40 EMAs stacked bullish and a bullish higher-timeframe trend, it’s reasonable to anticipate retracement to possible support before further bullish expansion. 

Near the 40 EMA, a broad zone from $96.12 to $84.35 could see interest from bulls before further expansion. If this level fails, bears might capitalise on any sharp moves down in Bitcoin, aiming for possible support near the 80% retracement, at $76.50, and potentially lower to a higher-timeframe support zone between $70.82 and $65.77.

If the higher-timeframe bullish trend resumes and the current resistance near $110.35 breaks, the wicks near $126.84 and the all-time high might see profit-taking. 

Learn How to Trade Live!

Join Dave and The Crypto Den Crew and they’ll show you live on a webinar how to take your crypto trading to the next level.

Where to Buy or Trade Altcoins?

These coins have high liquidity on Binance Exchange, so that could help with trading on AUD/USDT/BTC pairs. And if you’re looking at buying and HODLing cryptos, then Swyftx Exchange is an easy-to-use popular choice in Australia.