Categories
Bitcoin Cash Crypto News Market Analysis Stellar Trading Zcash

Top 3 Coins to Watch Today: BCH, XLM, ZEC – December 1 Trading Analysis

Let’s take a closer look at today’s altcoins showing breakout signals. We’ll explain what the coin is, then dive into the trading charts and provide some analysis to help you decide.

1. Bitcoin Cash (BCH)

Bitcoin Cash BCH is a peer-to-peer electronic cash system that aims to become sound global money with fast payments, micro fees, privacy, and high transaction capacity (big blocks). In the same way that physical money, such as a dollar bill, is handed directly to the payee, Bitcoin Cash payments are sent directly from one person to another. As a permissionless, decentralised cryptocurrency, Bitcoin Cash requires no trusted third parties and no central bank. Unlike traditional fiat money, Bitcoin Cash does not depend on monetary middlemen such as banks and payment processors.

BCH Price Analysis

At the time of writing, BCH is ranked the 22nd cryptocurrency globally and the current price is US$581.04. Let’s take a look at the chart below for price analysis:

Source: TradingView

October marked a turning point for BCH, with the price rocketing up almost 70% from its lows to probable resistance beginning near $716.22.

The price is currently struggling with the area between $615.43 and $465.76. This region could provide support after a close above – or resistance after a close below. 

A retracement could reach into the daily gap and possible support around $534.33. A more bearish shift in the marketplace will likely aim for the relatively equal lows near $510.21, and the potential support just below that begins around $490.64.

Continuation to the upside will likely target the monthly high near $612.30. However, probable resistance beginning at $648.55 and $692.05 could cap or slow down this move.

2. Stellar (XLM)

Stellar XLM is an open network that allows money to be moved and stored. When it was released, the goal was boosting financial inclusion by reaching the world’s unbanked – but soon after, its priorities shifted to helping financial firms connect with one another through blockchain technology. The network’s native token, lumens, serves as a bridge that makes it less expensive to trade assets across borders. All of this aims to challenge existing payment providers who often charge high fees for a similar service.

XLM Price Analysis

At the time of writing, XLM is ranked the 25th cryptocurrency globally and the current price is US$0.3457. Let’s take a look at the chart below for price analysis:

Source: TradingView

XLM set a high near $0.7197 in May before retracing nearly 85% to find a low near $0.2544. The price consolidated around this level before the strong bullish impulse during the past several weeks.

Probable resistance near $0.3778 is slowing the bullish advance down. However, another leg might target the last swing high at $0.4082 and relatively equal highs at $0.4534. Resistance near $0.4859 could cap the move before the second swing high. Beyond these levels, little stands in the bulls’ way before reaching the swing high near $0.5149.

A retracement before a move higher might find support in the daily gap near $0.2923, just above the monthly open. Relatively equal lows near $0.2775 could also provide support. A run-on stops at $0.2616 and $0.2531 might find support in the gap beginning near $0.2426 or a high-timeframe level near $0.2285.

3. Zcash (ZEC)

Zcash ZEC is a decentralised cryptocurrency focused on privacy and anonymity. It uses the zk-SNARK zero-knowledge proof technology that allows nodes on the network to verify transactions without revealing any sensitive information about those transactions. Zcash transactions, on the other hand, still have to be relayed via a public blockchain, but unlike pseudonymous cryptocurrencies, ZEC transactions by default do not reveal the sending and receiving addresses or the amount being sent.

ZEC Price Analysis

At the time of writing, ZEC is ranked the 60th cryptocurrency globally and the current price is US$224.28. Let’s take a look at the chart below for price analysis:

Source: TradingView

ZEC‘s recent bearish flip of the 9, 18 and 40 EMAs might cause bulls to be less aggressive in bidding. However, possible support near $215.87 and $205.96 – between the 61.8% and 78.6% retracements – could see at least a short-term bounce. 

Last year’s long-term consolidation suggests that the areas near $190.45 and $176.23 may be more likely to cause a longer-term trend reversal.

Bears are likely to add to their shorts at probable resistance beginning near $243.50, which has confluence with the 18 EMA. A fast break of this resistance could trigger more selling near $258.12, the start of the bearish move.

If an aggressive bullish move does appear, trapped buyers in the probable resistance beginning near $270.41 might provide a ceiling for this impulse.

Learn How to Trade Live!

Join Dave and The Crypto Den Crew and they’ll show you live on a webinar how to take your crypto trading to the next level.

Duration: 6 week course
From: November 15 to December 22
Date/Time: Twice a week, Mon and Wed at 7pm AEST
Location: Zoom webinar
Where to Buy or Trade Altcoins?

These coins have high liquidity on Binance Exchange, so that could help with trading on AUD/USDT/BTC pairs. And if you’re looking at buying and HODLing cryptos, then Swyftx Exchange is an easy-to-use popular choice in Australia.

Categories
Binance Coin Crypto News Market Analysis Trading

Top 3 Coins to Watch Today: BNB, ONE, XDC – November 30 Trading Analysis

Let’s take a closer look at today’s altcoins showing breakout signals. We’ll explain what the coin is, then dive into the trading charts and provide some analysis to help you decide.

1. Binance Coin (BNB)

Binance BNB is the biggest cryptocurrency exchange globally, based on daily trading volume. Binance aims to bring cryptocurrency exchanges to the forefront of world financial activity. Aside from being the largest cryptocurrency exchange, Binance has launched a whole ecosystem of functionalities for its users. The Binance network includes the Binance Chain, Binance Smart Chain, Binance Academy, Trust Wallet, and Research projects, which all employ the powers of blockchain technology to bring new-age finance to the world. Binance Coin is an integral part of the successful functioning of many of the Binance sub-projects.

BNB Price Analysis

At the time of writing, BNB is ranked the 3rd cryptocurrency globally and the current price is US$614.81. Let’s take a look at the chart below for price analysis:

Source: TradingView

One of the first coins to set its low during the May crash, BNB has since rallied over 215%. The price has rejected strong resistance near $661.70, with $622.70 marking a slightly weaker area of higher-timeframe resistance that could become relevant in the coming weeks.

However, an area of old consolidation near $573.00 has continued to provide support. Each time the price drives into this level, it forms a higher low. This zone could again provide support and has confluence with the 40 EMA.

A steeper retracement – perhaps caused by a bearish continuation in Bitcoin – could drive into an area of possible support between $509.90 and $463.90. This zone is just above the 61.8% retracement level and overlaps with old equal highs.

A more prolonged downtrend could reach possible support between $430.50 to $393.80, near the 78.6% retracement level and multiple old consolidations.

If the price can break through the current resistance, it could continue to an area between $850.00 and $920.00, where extensions suggest bulls might take significant profits.

2. Harmony (ONE)

Harmony ONE is a blockchain platform designed to facilitate the creation and use of decentralised applications (DApps). The network aims to innovate the way decentralised applications work by focusing on random state sharding, which allows creating blocks in seconds. Harmony is expected to introduce cross-shard contracts and a cross-chain infrastructure by the end of 2021.

ONE Price Analysis

At the time of writing, ONE is ranked the 60th cryptocurrency globally and the current price is US$0.2622. Let’s take a look at the chart below for price analysis:

Source: TradingView

ONE‘s rally, beginning in late June, stretched over 707% as the price explored new territory.

Resistance has formed near $0.3415 and between $0.2871 and $0.3095. With an uncertain market and traders potentially selling the cross-shard transaction news (or an announcement of its delay), these areas could continue to provide resistance and perhaps prompt a steeper move downward.

The March highs, overlapping with the last major leg’s 61.8% and 78.6% retracements (from $0.2167 to $0.1720), could mark an area of support. Inside this zone, $0.2080 to $0.1766 could provide a more sensitive reaction. 

A more extended downtrend might reach possible support between $0.1489 and $0.1214, near the origin of the last significant bullish move.

On the other hand, if altcoins resume their bullish trends, the 27% extension near $0.4500 could be the next area of significant profit-taking by bulls.

3. XDC Network (XDC)

XinFin XDC is an enterprise-ready hybrid blockchain technology company optimised for international trade and finance. The XinFin network is powered by the native coin called XDC. XinFin mainnet token XDC also creates an opportunity to utilise XinFin’s real-world use-cases, such as TradeFinex.org, and helps small and medium businesses or institutions originate their own financial requirements in a digital, fully structured manner so that they can distribute them to the bank or non-bank funders themselves, using a common distribution standard.

XDC Price Analysis

At the time of writing, XDC is ranked the 99th cryptocurrency globally and the current price is US$0.09428. Let’s take a look at the chart below for price analysis:

Source: TradingView

XDC‘s volatile whipsaws finally met their match at resistance near $0.16210, an area that is likely to provide stiff resistance again on any retest.

Before the price reaches this level, higher-timeframe charts and multiple highs and lows suggest that $0.12560 could also provide resistance.

Currently, the price is settling on possible support near $0.09037. The 78.6% retracement around $0.08160 is more likely to see interest from the bulls if the market continues trending downward. 

Consolidation here could lead to the uptrend resuming and gain the attention of more bulls if the 8, 16, and 40 EMAs flip bullish.

A longer bearish shift in the overall crypto market could send the price to (or below) possible support near the May and June consolidation, around $0.06301. This area started the most recent bullish trend. Below this level, little exists on higher-timeframe charts to offer support.

Learn How to Trade Live!

Join Dave and The Crypto Den Crew and they’ll show you live on a webinar how to take your crypto trading to the next level.

Duration: 6 week course
From: November 15 to December 22
Date/Time: Twice a week, Mon and Wed at 7pm AEST
Location: Zoom webinar

Where to Buy or Trade Altcoins?

These coins have high liquidity on Binance Exchange, so that could help with trading on AUD/USDT/BTC pairs. And if you’re looking at buying and HODLing cryptos, then Swyftx Exchange is an easy-to-use popular choice in Australia. You can also buy these coins from different exchanges listed on Coinmarketcap.

Categories
Market Analysis The Crypto Den

TradeRoom: Our Weekly Crypto Trades Analysis – Nov 29, 2021

Welcome to this weekly series from the TradeRoom. My name is Dave and I’m the founder of The Crypto Den, an Australian-based crypto trading and education community aiming to give you the knowledge to take your trading game to the next level.

Crypto Market Outlook

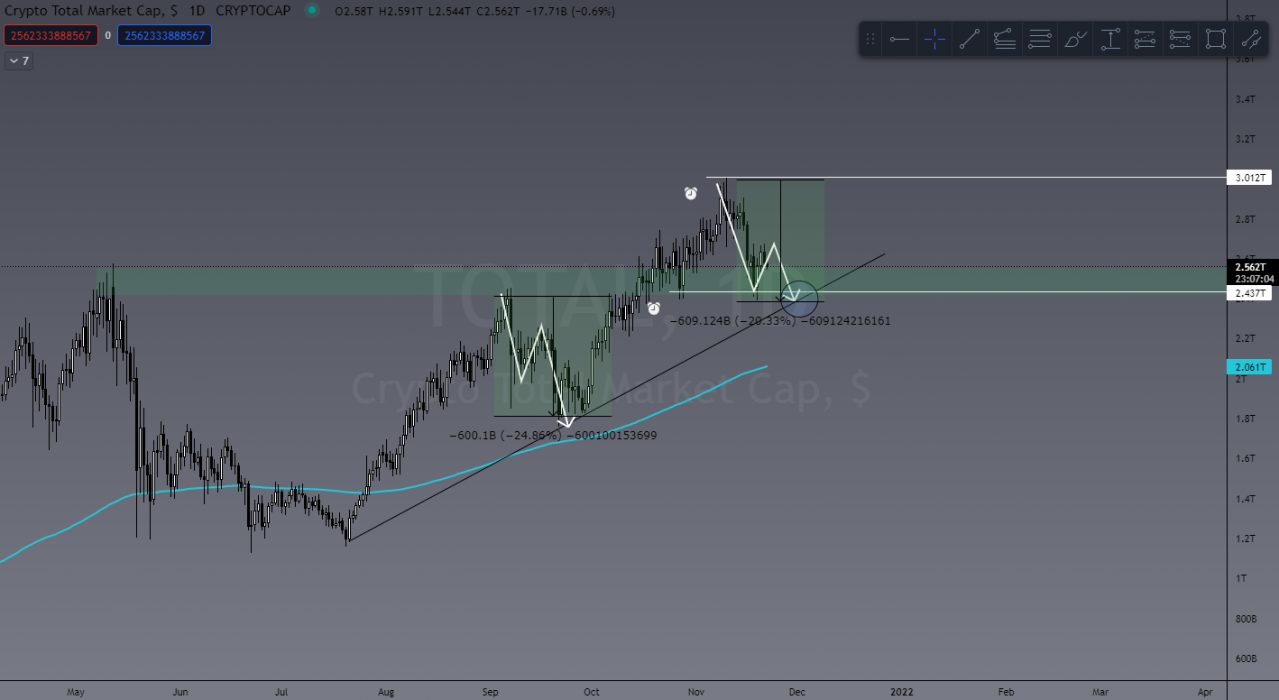
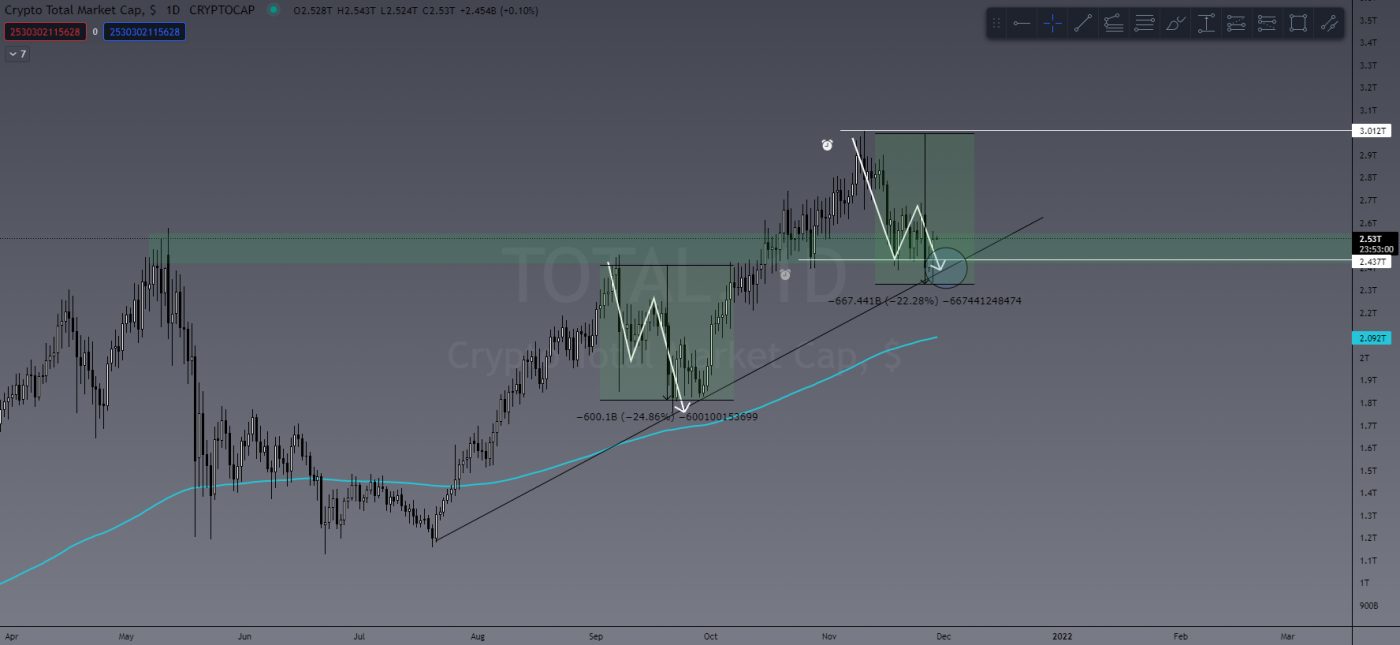
Last week I touched on the US$600 billion drop in TOTAL crypto market cap. I warned that we could see some more selling pressure but there was no reason to stress or start panic selling. You can see below that the TOTAL crypto cap has indeed pulled back further to retest its current uptrend. So far it’s showing a bullish test with a long wick to the downside and a strong bullish engulfing candle on the daily timeframe.

Image from last week’s update
TOTAL crypto market cap current value

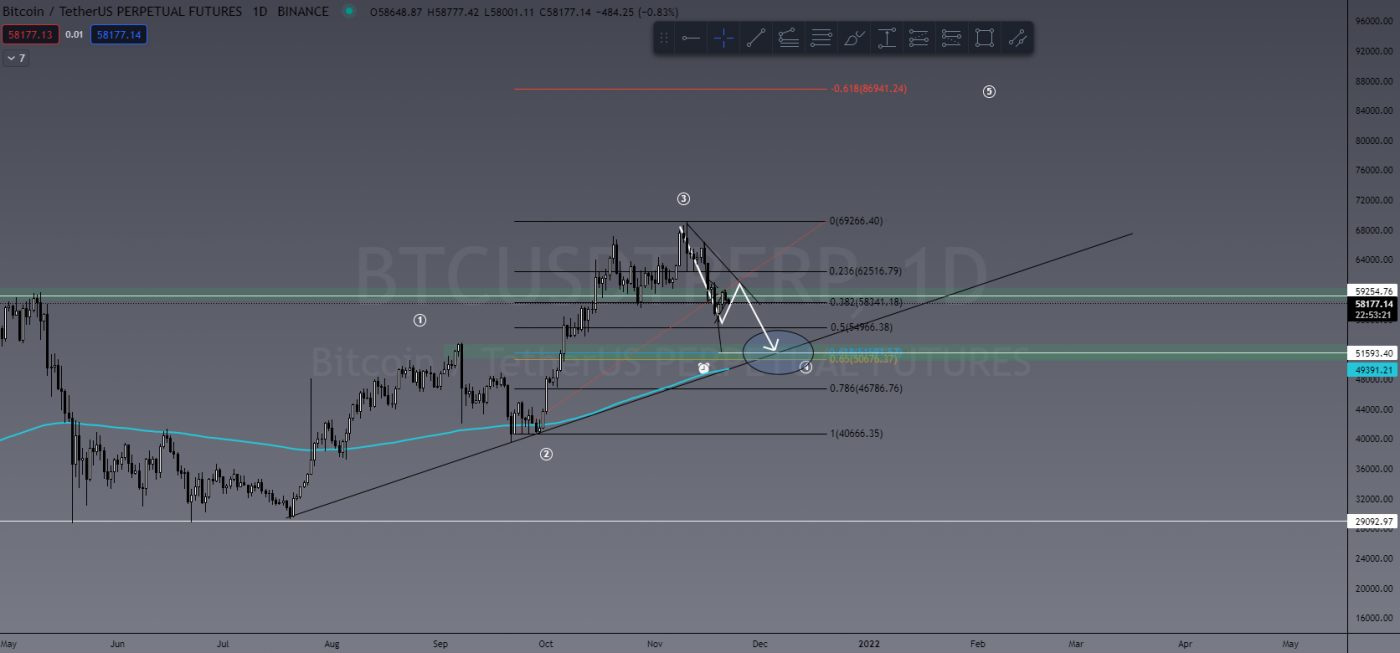
With the projection of the TOTAL heading down in value, I suggested BTC would follow this formation and see further bearish price action. My target being US$51,000, we haven’t hit that price YET. So far BTC is showing some signs of strength and the bottom of this local downtrend MIGHT be in, so it would serve you well to expect a bounce here and plan your trades accordingly.

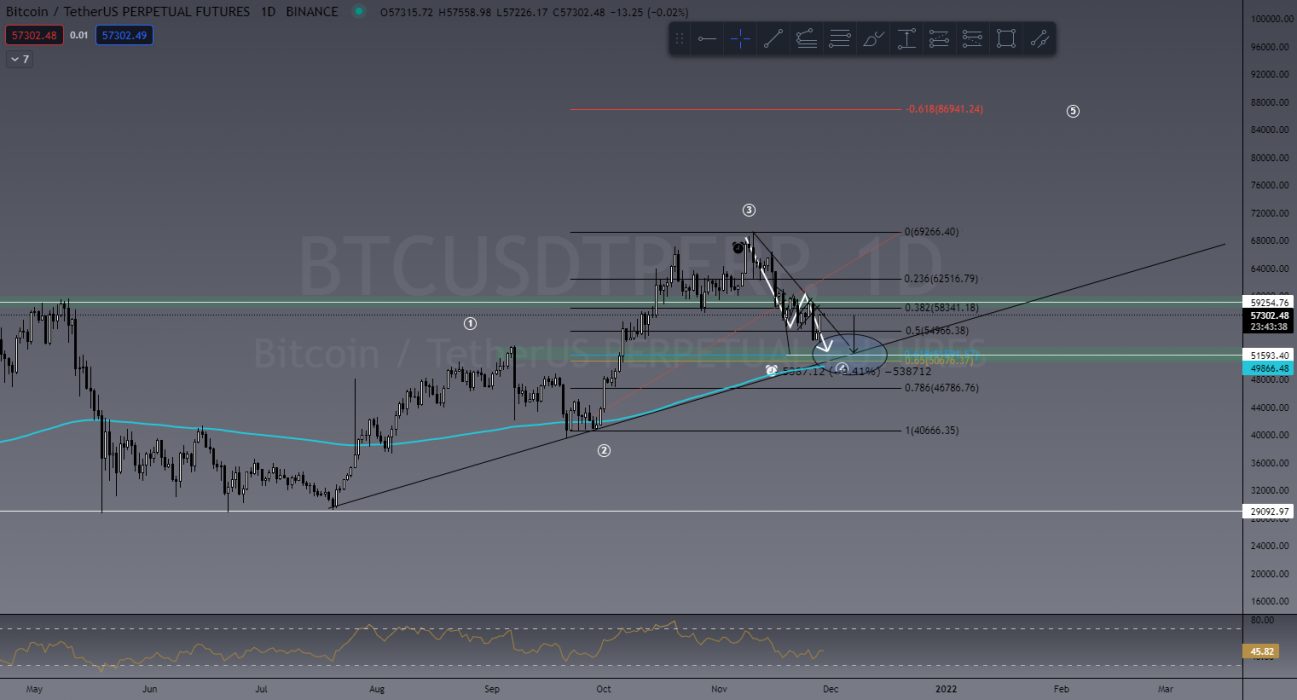
That said, we’re not out of the woods yet. While BTC is trending below that local downtrend line and forming lower lows/lower highs (bearish market structure), we could see it hit that suggested area of support at US$51,500.

Projection from last week’s article
Current BTC price action

What’s interesting about the US$51,500 level is the perfect storm forming. There are so many key identifiers converging in that one area. We have:

  • the 61.8% Fibonacci retrace level;
  • daily 200 Exponential Moving Average(EMA);
  • daily level of support;
  • daily uptrend;
  • daily Higher Low (excellent market structure);
  • all of which plays well into the Elliott Wave Theory of market cycles.

It’s almost the perfect trade setup and something we discussed in last Thursday’s market scan in the TradeRoom. You can catch a sneak peek on our YouTube channel.


Last Week’s Performance

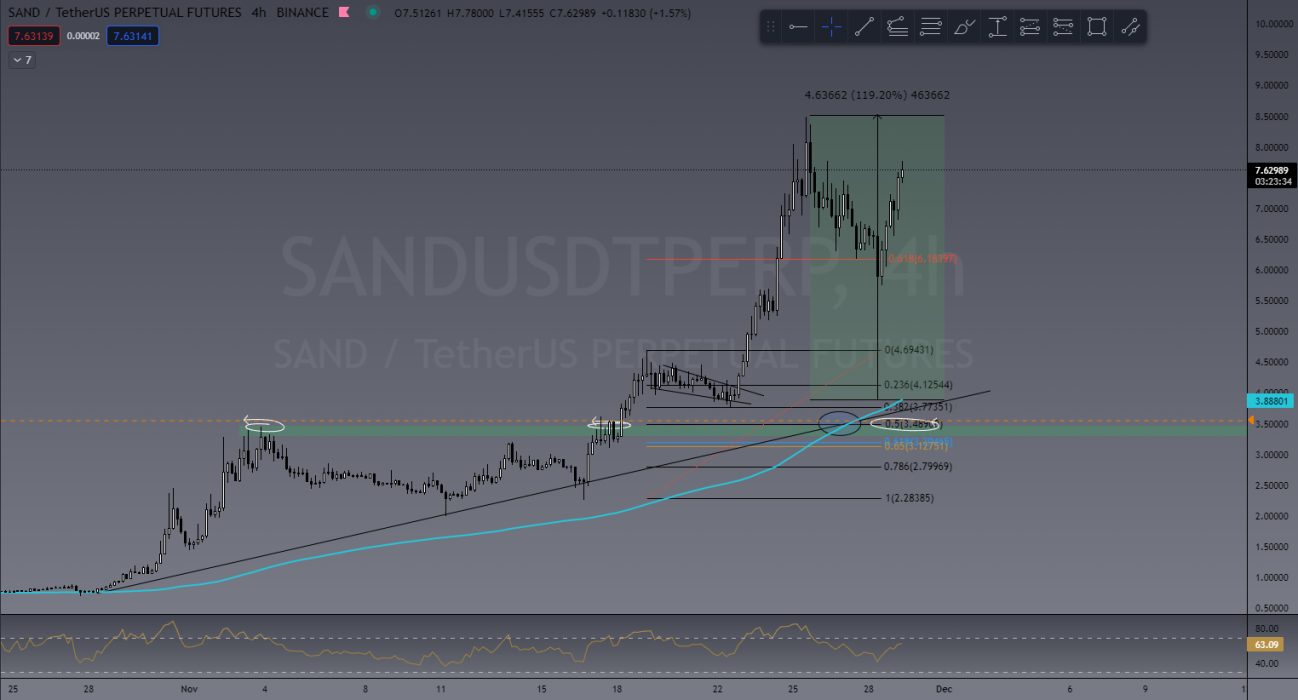
SAND/USDT

Last week in the TradeRoom, we were watching a lot of these Metaverse coins and SAND did not disappoint. I showed a bullflag forming on the 4H chart and was personally hoping to see a test of previous support and uptrend, but SAND didn’t want to wait. Breakout from the bullflag boasted a 120% push to the upside!

Bullflag breakout for SAND/USDT

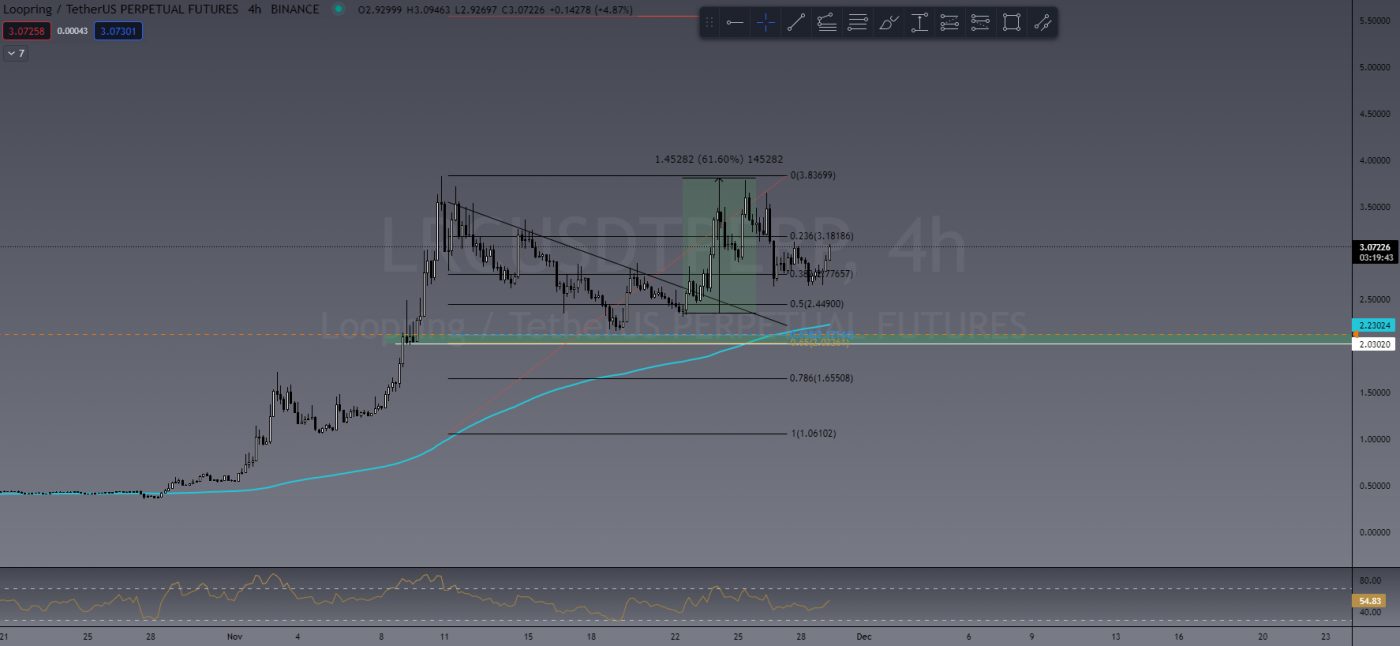
LRC/USDT

Like SAND, LRC didn’t want to wait for another test on support. Breaking out of a falling wedge identified by one of our team leaders, Pete, last week LRC sported a 60% bullish push and currently seems to be forming a new bullish market structure.

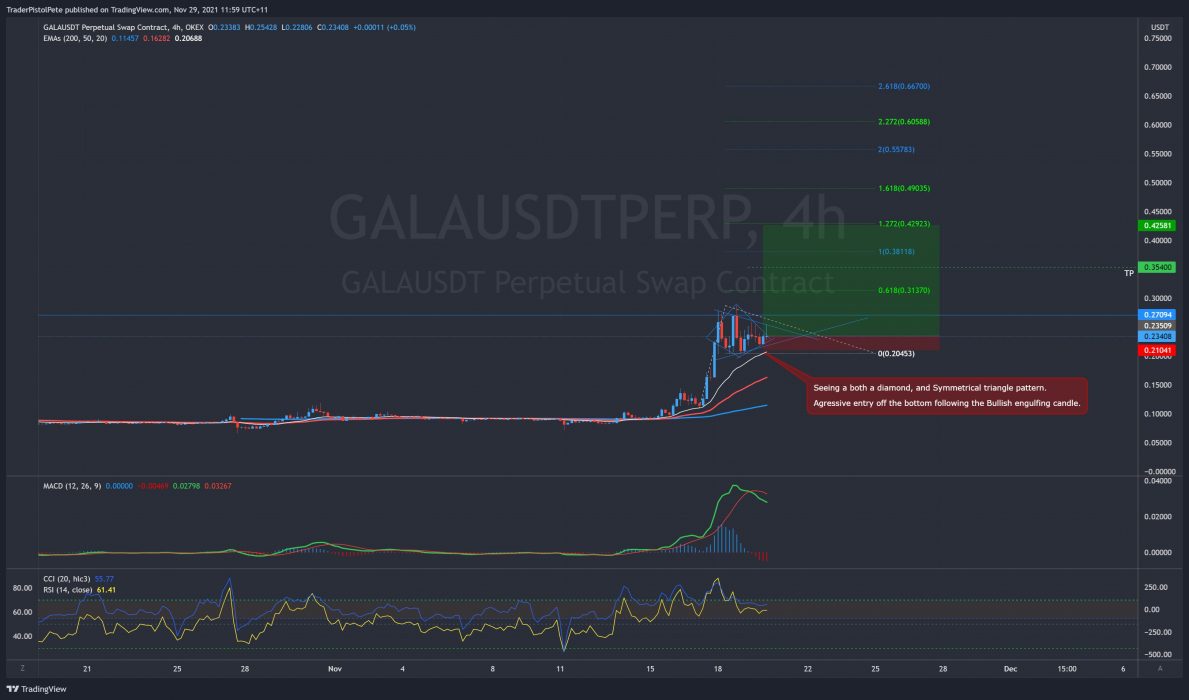
GALA/USDT

Trade of the week has to go to TCD team leader Pete for his massive GALA trade! With 10x leverage (considered a safe leverage for experienced traders), Pete’s profit is currently over 2000% while a spot trade would give a massive 262% from entry. Pete is a pattern trader and often enters trades based off certain chart patterns. In this case, he has seen a symmetrical triangle bullish continuation pattern.

GALA/USDT Before
GALA/USDT After

This Week’s Trades

ADA/USDT

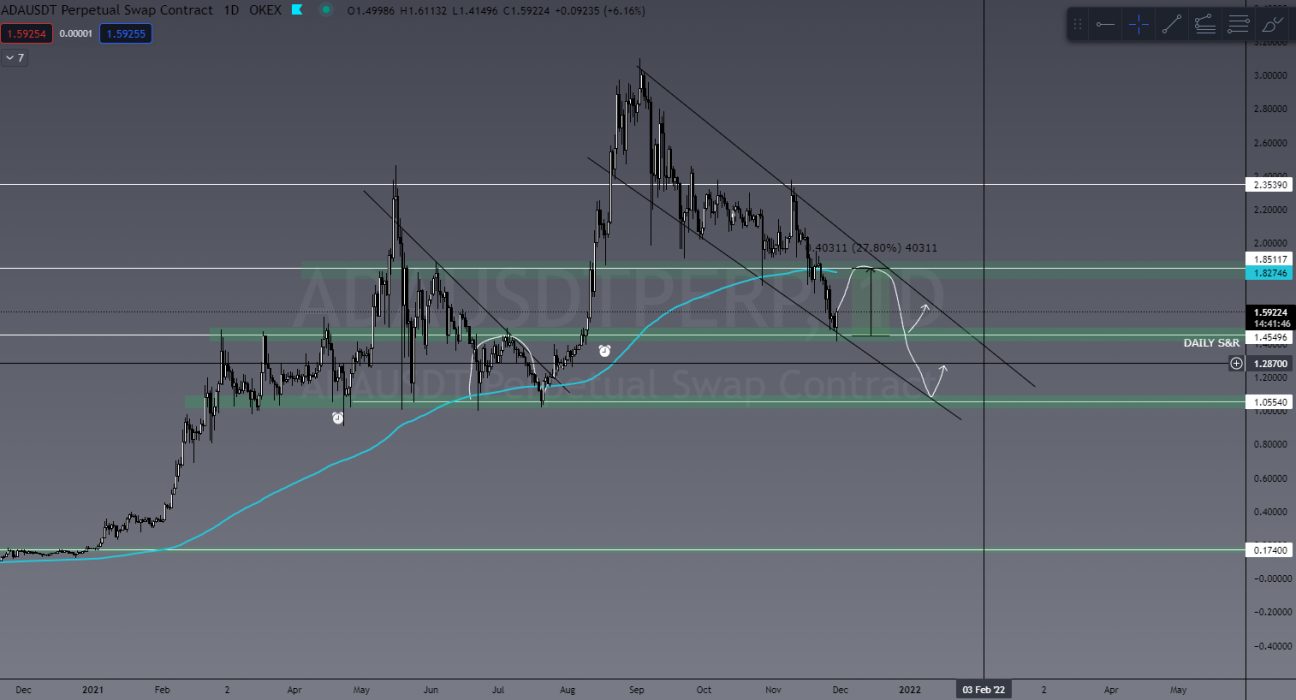
ADA has been trending down since the start of September and is really starting to come into some key levels here. This trade might play out this week or even over the next two weeks, but it’s certainly worth mentioning.

You can see in the chart below that ADA has currently found some bullish price action at the US$1.45 level of support. We could see a decent 30% push here, which would be great, and MAYBE even a breakout of the downtrend. However, I’m looking a little further ahead. If ADA rejected off the downtrend and pushed further below, the next, and likely last, level of support before revisiting US$0.30 is at the US$1 level.

This is a major level of both tested and psychological zone of support, and I’d expect to see some big money flow happen around here because failing to rally at US$1 would absolutely nuke ADA’s price action.

ADA/USDT

THETA/USDT

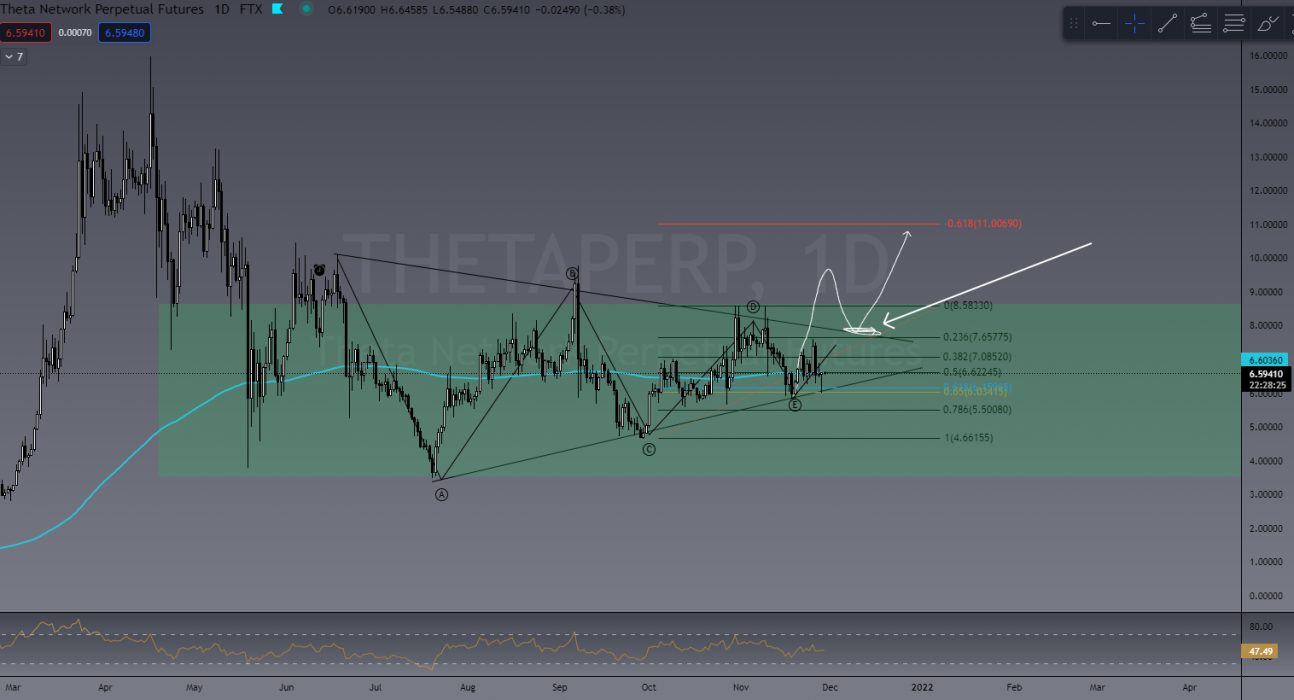
Another coin to keep an eye on is THETA. This is such a good coin to trade and will require a bit of patience to find the right entry.

After a period of consolidation, I’m looking to enter LONG/BUY at the RETEST of a breakout. This will of course highly depend on what BTC does this week, and it may stay in a consolidation zone a little longer. Nevertheless, it’s one to add to your watchlist.

THETA/USDT

OMG/USDT

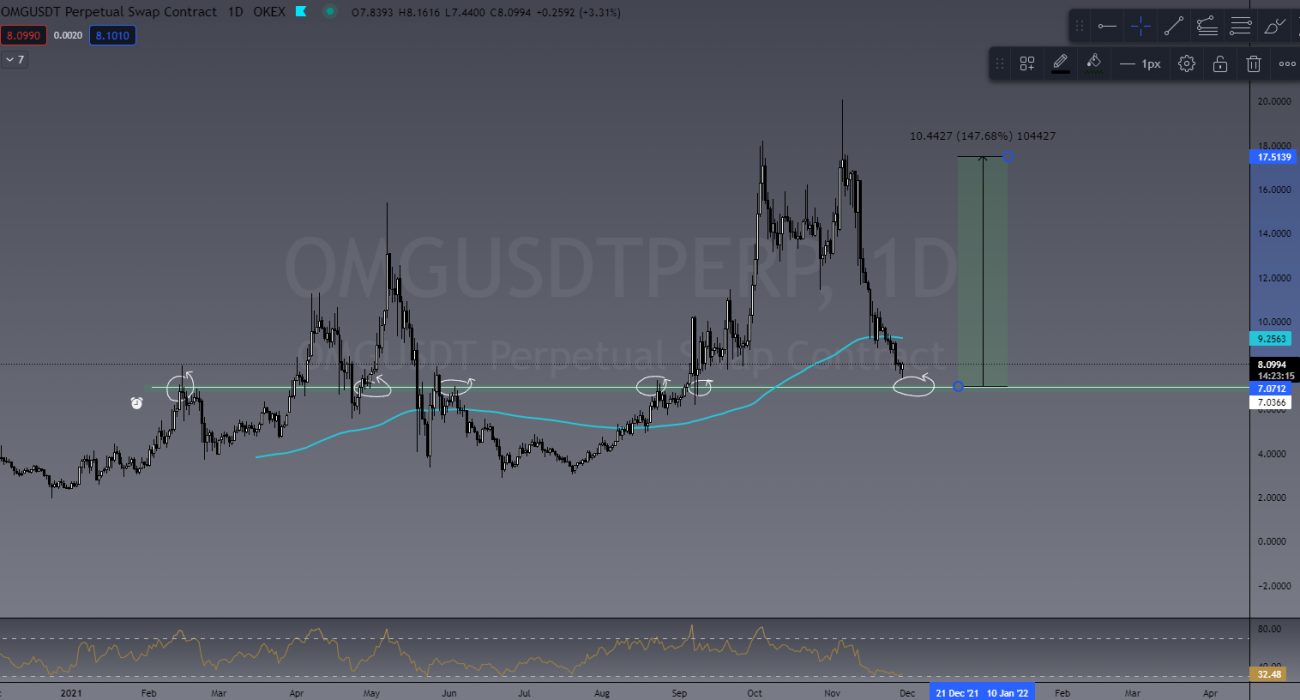
OMG could be coming into a key area of daily support, and is likely a rally point if BTC can behave a little. If OMG can push from US$7 and reclaim its previous high of US$17, we’ll see 150% growth. Another one to add to the watchlist.

OMG/USDT

Invite to Join our TradeRoom

If you’d like to become a better trader, you’re invited to join our TradeRoom where we share daily charts and market analysis. In our community we strongly encourage and teach correct risk management strategies to keep our members safe in this new volatile crypto market.
Join our “Apprentice” plan now for your 7-day trial.

TCD’s TradeRoom

The Crypto Den was created in 2017 to help the rapidly growing crypto community learn and understand the fundamentals of digital currencies and how to trade them. 

Since then we have taught thousands of members the basics of technical analysis and trading strategies to further progress and perfect their trading abilities.

In the TradeRoom you will be included in a supportive environment which encourages personal growth, education and community support.

It’s a place to share your trading ideas and follow other experienced traders’ feeds to help keep your finger on the pulse of such a volatile market!

Categories
Crypto News Market Analysis Siacoin Trading VeChain

Top 3 Coins to Watch Today: SC, VET, COCOS – November 29 Trading Analysis

Let’s take a closer look at today’s altcoins showing breakout signals. We’ll explain what the coin is, then dive into the trading charts and provide some analysis to help you decide.

1. Siacoin (SC)

Siacoin SC is the native utility token of Sia, a blockchain-based distributed, decentralised cloud storage platform. Sia acts as a secure, trustless marketplace for cloud storage in which users can lease access to their unused storage space. Agreements and transactions are enforced with smart contracts, and Siacoin is the medium of exchange for paying for storage on the network. The main goal of the project is to become the “backbone storage layer of the internet”.

SC Price Analysis

At the time of writing, SC is ranked the 94th cryptocurrency globally and the current price is US$0.02387. Let’s take a look at the chart below for price analysis:

Source: TradingView

After a 75% decline from September to October, SC has ranged between $0.01833 and $0.02575.

The recent rally is approaching probable resistance near $0.02740 but could be aiming for stops above the relatively equal highs near $0.02860. Continuation of the bullish move could target the daily gap near $0.03120.

Aggressive bulls might add to positions near $0.02150 and $0.02034. Price action near $0.01912 may be more likely to provide support – if the price reaches it – during any retracements.

Relatively equal lows clustered around $0.01844 seem likely to be swept if the bearish trend resumes. If this move occurs, the price might find support at the significant higher-timeframe level near $0.01695.

2. VeChain (VET)

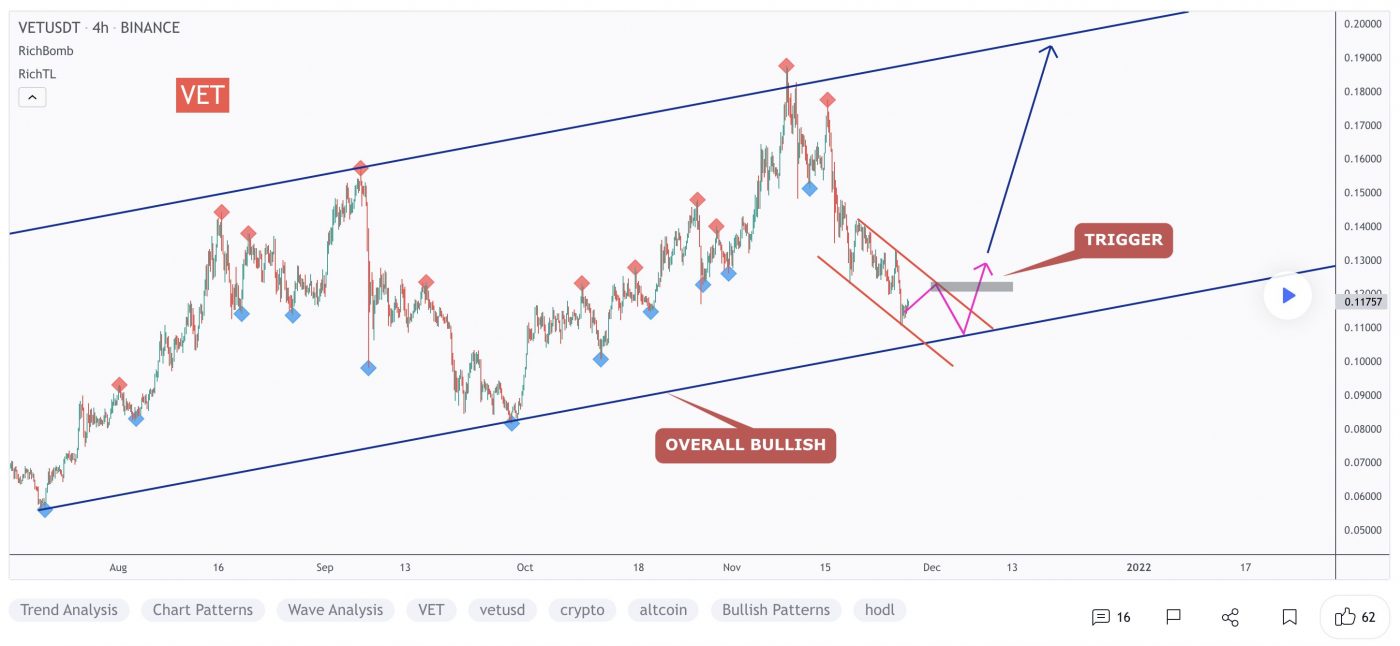
VeChain VET is a blockchain-powered supply chain platform. VeChain aims to use distributed governance and Internet of Things (IoT) technology to create an ecosystem that solves some of the major problems with supply chain management. The platform uses two in-house tokens, VET and VTHO, to manage and create value based on its VeChainThor public blockchain. The idea is to boost the efficiency, traceability and transparency of supply chains while reducing costs and placing more control in the hands of individual users.

VET Price Analysis

At the time of writing, VET is ranked the 29th cryptocurrency globally and the current price is US$0.1105. Let’s take a look at the chart below for price analysis:

Source: TradingView

VET‘s 129% move during October ran into resistance near $0.1750, at the 27% extension of the Q2 swing.

An old high and the 18 EMA have provided support near $0.1259 and might give support again on a retest. This area also has confluence with the 50% and 61.8% retracements of November’s swing.

Just below, near $0.1029, the 61.8% retracement of the current Q4 swing might also mark an area of support.

If the market remains bearish, $0.08862 is unlikely to be revisited but could see interest from bulls during any deeper retracement.

An area near $0.1711, at the 50% extension of the summer’s swing, could see some profit-taking if bulls break the current resistance near $0.1778. Above, old consolidations near $0.1832 and $0.1941 might also provide some resistance before another round of price discovery.

3. Cocos-BCX (COCOS)

Cocos-BCX COCOS is a public blockchain platform aiming to create a complete run-time environment for games with multi-game system compatibility, providing game developers with a user-friendly platform for blockchain game development; while it starts by merely using fungible tokens for the in-game economy, its final goal is to fully move onto a blockchain.

COCOS Price Analysis

At the time of writing, COCOS is ranked the 377th cryptocurrency globally and the current price is US$3.96. Let’s take a look at the chart below for price analysis:

Source: TradingView

Mid-November marked a turning point for COCOS, with the price rocketing up almost 425% from its lows to probable resistance beginning near $5.10.

The price is currently struggling with the area between $3.70 and $4.15. This region could provide support after a close above, or resistance after a close below. 

A retracement could reach into the daily gap and possible support around $3.80. A more bearish shift in the marketplace will likely aim for the relatively equal lows near $3.68, and the potential support just below that begins around $3.43.

Continuation to the upside will likely target the monthly high near $4.56. However, probable resistance beginning at $4.78 and $4.90 could cap or slow down this move.

Learn How to Trade Live!

Join Dave and The Crypto Den Crew and they’ll show you live on a webinar how to take your crypto trading to the next level.

Duration: 6 week course
From: November 15 to December 22
Date/Time: Twice a week, Mon and Wed at 7pm AEST
Location: Zoom webinar

Where to Buy or Trade Altcoins?

These coins have high liquidity on Binance Exchange, so that could help with trading on AUD/USDT/BTC pairs. And if you’re looking at buying and HODLing cryptos, then Swyftx Exchange is an easy-to-use popular choice in Australia.

Categories
Crypto News Dogecoin Market Analysis Mithril Trading

Top 3 Coins to Watch Today: DOGE, MANA, MITH – November 26 Trading Analysis

Let’s take a closer look at today’s altcoins showing breakout signals. We’ll explain what the coin is, then dive into the trading charts and provide some analysis to help you decide.

1. Dogecoin (DOGE)

Dogecoin DOGE is based on the popular “Doge” Internet meme and features a Shiba Inu as its logo. The open-source digital currency was created by Billy Markus from Portland, Oregon, and Jackson Palmer from Sydney, Australia, and was forked from Litecoin in December 2013. Dogecoin’s creators envisaged it as a fun, light-hearted cryptocurrency that would have greater appeal beyond the core Bitcoin audience since it was based on a dog meme.

DOGE Price Analysis

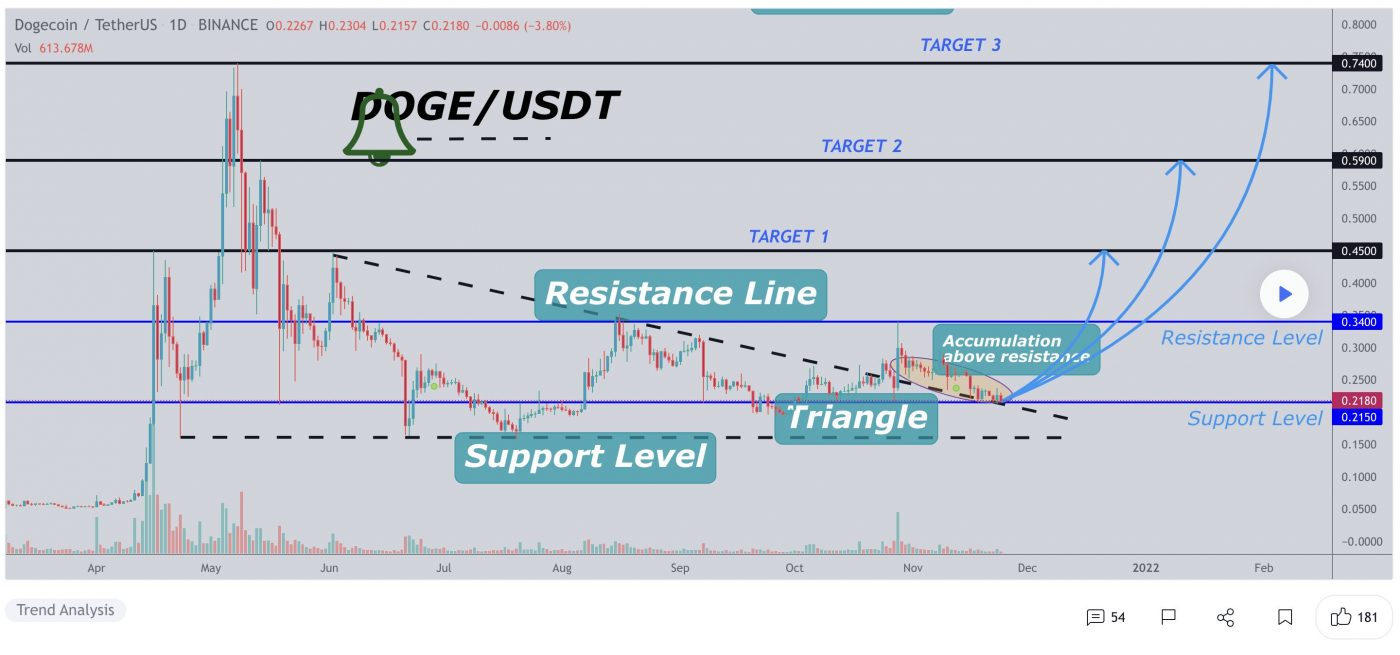
At the time of writing, DOGE is ranked the 10th cryptocurrency globally and the current price is US$0.2221. Let’s take a look at the chart below for price analysis:

Source: TradingView

DOGE marines continue holding the price, printing nearly 35% gains during November.

The consolidation near $0.2435 is likely to provide support as the price continues exploring new highs. However, a set of relatively equal lows near $0.2159 provides a tempting target for a stop run into probable support near $0.2050.

A decidedly bearish shift in the market could reach probable support near $0.1980, near October’s monthly open.

Almost no resistance lies overhead, although low-timeframe traders can use the resistance below recent highs near $0.2847 as a first target. Beyond this level, extensions near $0.3067, $0.3252 and $0.3566 give reasonable higher-timeframe targets.

2. Decentraland (MANA)

Decentraland MANA defines itself as a virtual reality platform powered by the Ethereum blockchain that allows users to create, experience, and monetise content and applications. In this virtual world, users purchase plots of land that they can later navigate, build upon and monetise. Decentraland uses two tokens: MANA and LAND. MANA is an ERC-20 token that must be burned to acquire non-fungible ERC-721 LAND tokens. MANA tokens can also be used to pay for a range of avatars, wearables, names and more on the Decentraland marketplace.

MANA Price Analysis

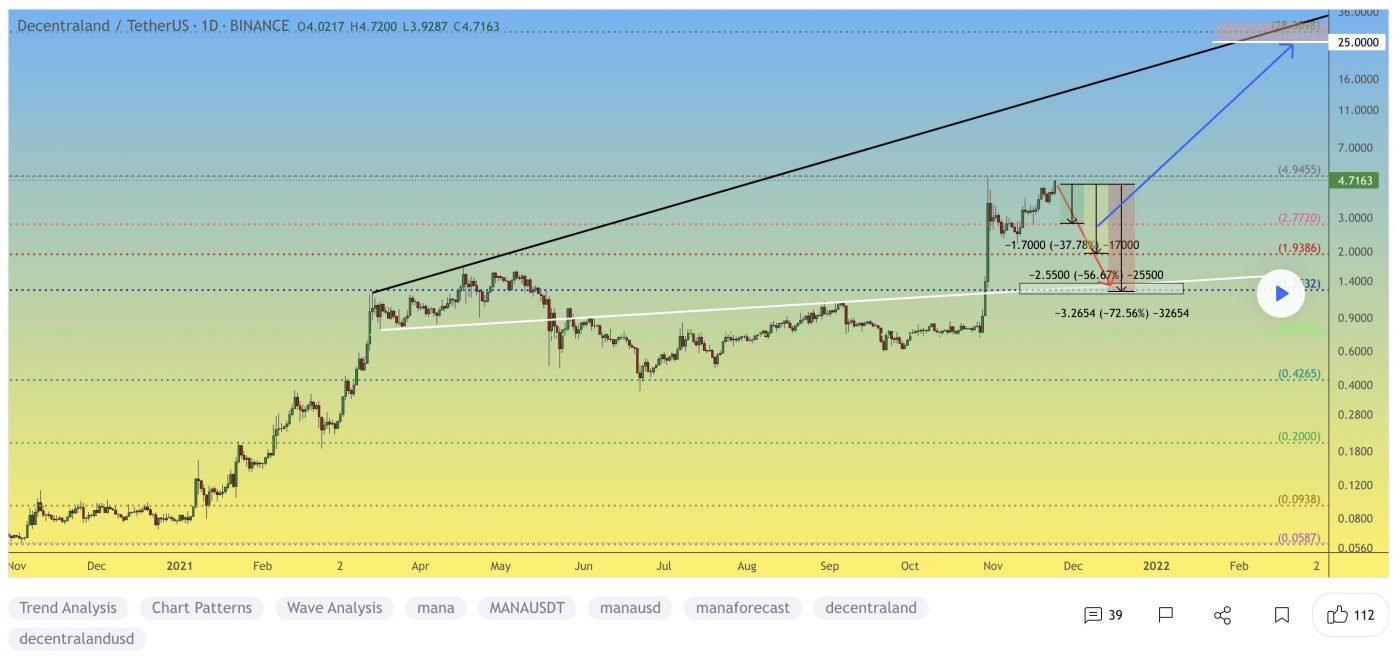
At the time of writing, MANA is ranked the 23rd cryptocurrency globally and the current price is US$5.09. Let’s take a look at the chart below for price analysis:

Source: TradingView

Like many other altcoins, MANA set a new all-time high during mid-November before retracing 35% to the low at $4.35 last week.

Price broke through resistance near $4.86, which may mark an area of possible support on a retracement. If this support fails, bulls might also step in near $4.73. However, a drop this far increases the chances of a stop run to $4.60 and possibly into support near $4.55. For now, continuing bullish market conditions could help $4.90 become support.

The swing high around $5.15 gives bulls a reasonable first target, with $5.20 also likely to draw the price upward. Higher-timeframe resistance beginning near $5.25 or $5.30 could cap the move or trigger consolidations. If bullish market conditions continue, bulls might test probable resistance near new all-time highs near $5.40.

3. Mithril (MITH)

Mithril MITH is a decentralised social media platform on the Ethereum Blockchain that rewards users for creating content. The team plans to partner with existing social platforms to drive the adoption of its ERC-20 MITH token, which can reportedly be integrated with any social media platform. In addition to storing funds, the Mithril Vault wallet can be used for staking and swapping into other currencies.

MITH Price Analysis

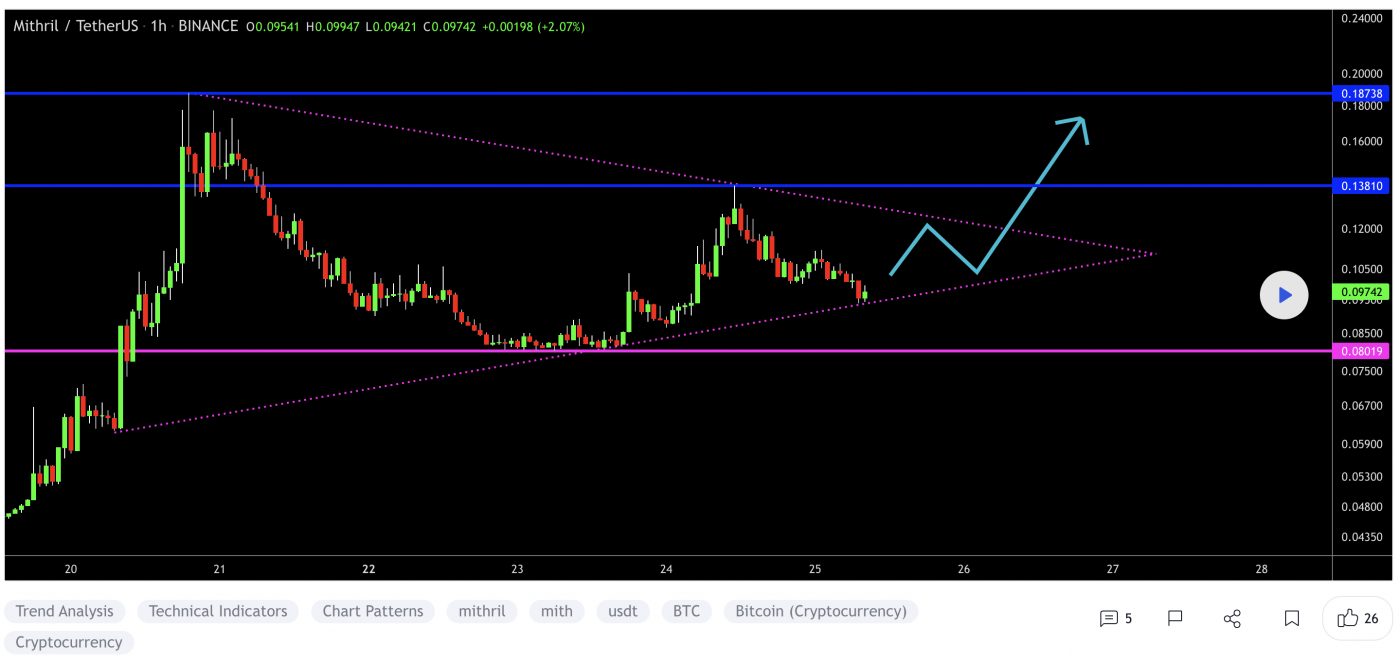
At the time of writing, MITH is ranked the 494th cryptocurrency globally and the current price is US$0.09727. Let’s take a look at the chart below for price analysis:

Source: TradingView

During November high, MITH‘s 58% drop marks the current range as a reasonable area to expect accumulation.

The recent bearish flip of the 9, 18 and 40 EMAs might cause bulls to be less aggressive in bidding. However, possible support near $0.08522 and $0.08255 – between the 61.8% and 78.6% retracements – could see at least a short-term bounce. 

Long-term consolidation suggests that the areas near $0.1137 and $0.1354 may be more likely to cause a longer-term trend reversal.

Bears are likely to add to their shorts at probable resistance beginning near $0.1523, which has confluence with the 18 EMA. A fast break of this resistance could trigger more selling near $0.1640, the start of the bearish move.

Learn How to Trade Live!

Join Dave and The Crypto Den Crew and they’ll show you live on a webinar how to take your crypto trading to the next level.

Duration: 6-week course
From: November 15 to December 22
Date/Time: Twice a week, Mon and Wed at 7pm AEST
Location: Zoom webinar

Where to Buy or Trade Altcoins?

These coins have high liquidity on Binance Exchange, so that could help with trading on AUD/USDT/BTC pairs. And if you’re looking at buying and HODLing cryptos, then Swyftx Exchange is an easy-to-use popular choice in Australia.
Categories
Crypto News Market Analysis Trading

Top 3 Coins to Watch Today: DOT, ALICE, IDEX – November 25 Trading Analysis

Let’s take a closer look at today’s altcoins showing breakout signals. We’ll explain what the coin is, then dive into the trading charts and provide some analysis to help you decide.

1. Polkadot (DOT)

Polkadot DOT is an open-source sharding multichain protocol that facilitates the cross-chain transfer of any data or asset types, not just tokens, thereby making a wide range of blockchains interoperable with each other. Polkadot’s native DOT token serves three clear purposes: providing network governance and operations, and creating parachains by bonding. The Polkadot protocol connects public and private chains, permissionless networks, oracles, and future technologies, allowing these independent blockchains to trustlessly share information and transactions through the Polkadot relay chain.

DOT Price Analysis

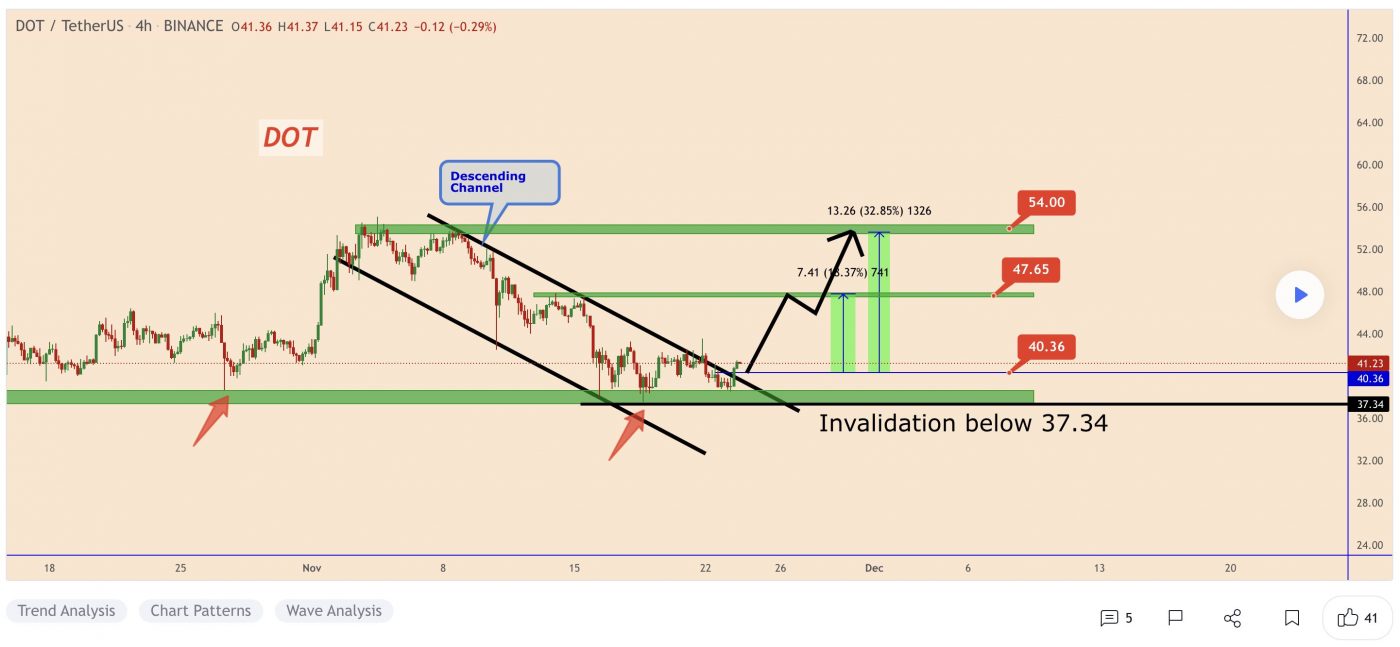
At the time of writing, DOT is ranked the 8th cryptocurrency globally and the current price is US$38.77. Let’s take a look at the chart below for price analysis:

Source: TradingView

DOT consolidates between $36.44 and $45.70 at the 100% extension of September’s consolidation after a sharp move up through all-time during November.

The current consolidation could provide support if the price breaks the zone’s high near $37.51. A better risk-to-reward entry could present itself near the daily candle bodies of the last swing high near $35.67, which also has confluence with the 18 EMA and the 61.8% retracement. This potential drop could reach to possibly support the October open and 78.6% retracement, near $33.68.

A sharper downturn in the market could send the price as low as $29.89, near the last significant swing high in this leg, although a move this low could signal the start of a bearish trend.

Extensions from September’s consolidation indicate that the 150% extension, near $46.70, and the 200% extension, near $55.62, could be the next significant targets.

2. MyNeighborAlice (ALICE)

ALICE is a multiplayer builder game where anyone can buy and own virtual islands, collect and build exciting items and meet new friends. Inspired by successful games such as Animal Crossing, the game combines the best of the two worlds – a fun narrative for regular players who want to enjoy the gameplay experience, as well as an ecosystem for players who want to collect and trade Non-Fungible Tokens (NFTs).

ALICE Price Analysis

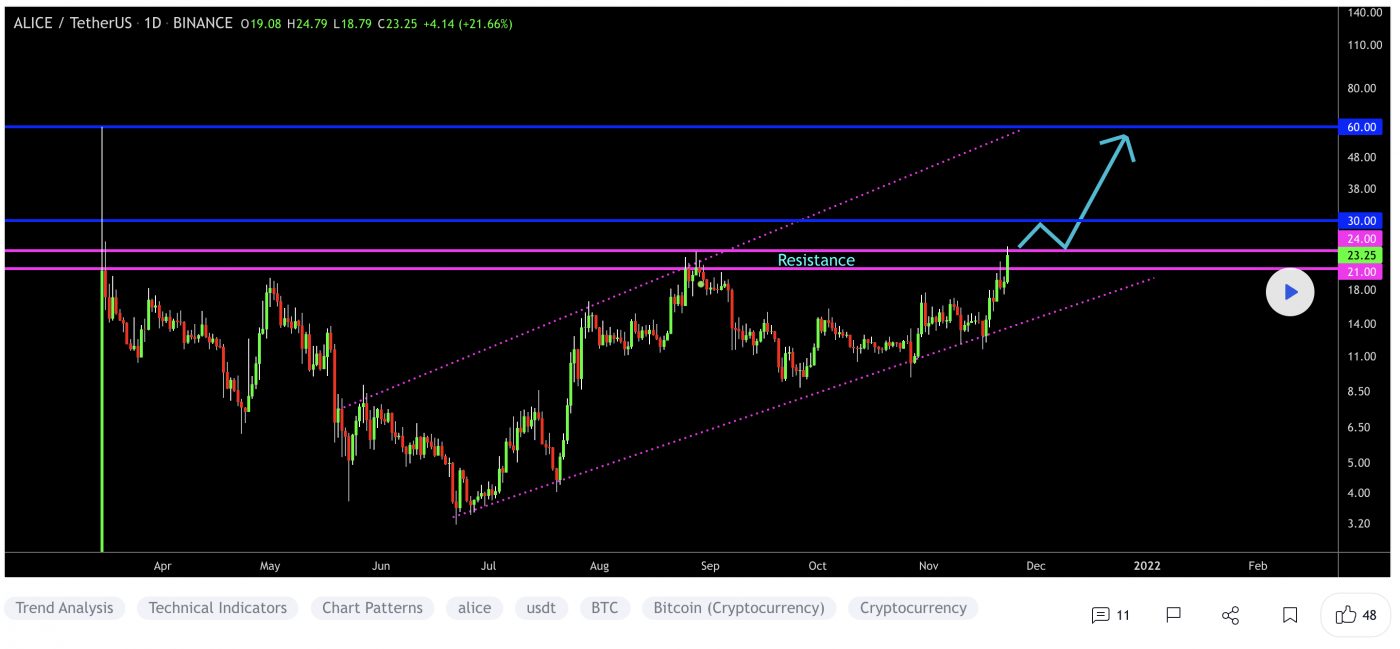
At the time of writing, ALICE  is ranked the 124th cryptocurrency globally and the current price is US$26.90. Let’s take a look at the chart below for price analysis:

Source: TradingView

After accumulating under the November monthly open, ALICE rallied 112% in a week before retracing to support near $24.55. Buyers continue to snatch up dips under the weekly open, suggesting that accumulation is still taking place. 

Bulls could look for entries in this region while being conscious of a potential stop run below the cluster of lows at $23.82. Two areas of support, beginning near $22.57 and $20.29, provide probable buys if the price dips this low.

The equal highs near $28.63 provide a first reasonable bullish target. If the price takes this target and penetrates the surrounding resistance, the next probable resistance begins near $30.66. Possible targets include the old highs just above this resistance near $32.83, $33.46 and $34.39.

3. Idex (IDEX)

IDEX claims to be the first hybrid liquidity DEX that combines an order book model with an automated market maker. It blends the performance and features of a traditional order book model with the security and liquidity of an AMM. Idex takes an innovative approach to decentralised exchanges by combining an off-chain trading engine with an on-chain trade settlement. Users benefit from that in several ways. The instant trade execution means front-running or sandwich attacks are not possible and users can trade without waiting for previous trades to settle.

IDEX Price Analysis

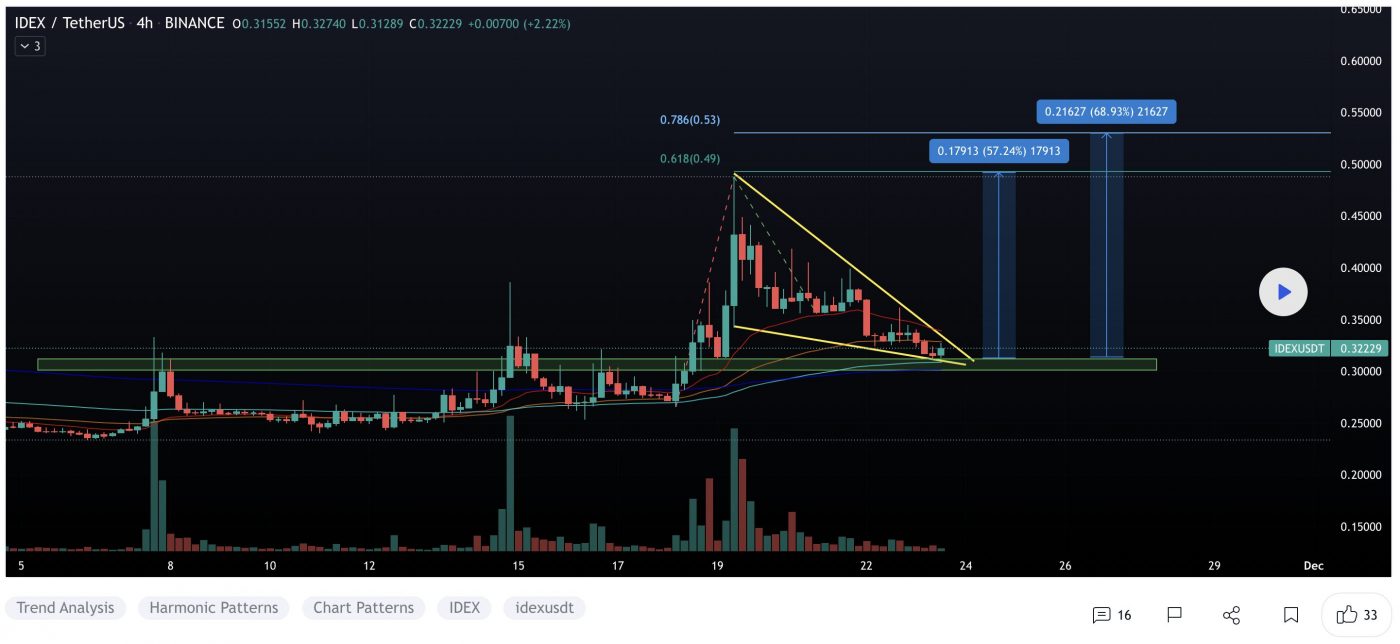
At the time of writing, IDEX is ranked the 318th cryptocurrency globally and the current price is US$0.3986. Let’s take a look at the chart below for price analysis:

Source: TradingView

IDEX‘s 75% move from late October’s lows ran into resistance near $0.4022, at the 27% extension of the summer’s swing.

An old high and the 18 EMA have provided support near $0.3254 and may give support again on a retest. This area also has confluence with the 50% and 61.8% retracement of November’s swing.

Just below, near $0.3050, the 61.8% retracement of the current Q4 swing might also mark an area of support.

If the market remains bullish, $0.4390 is unlikely to be revisited but could see interest from bulls during any deeper retracement.

An area near $0.4530, at the 50% extension of the summer’s swing, could see some profit-taking if bulls break the current resistance near $0.4812. Above, old consolidations near $0.5088 and $0.5361 may also provide some resistance before another round of price discovery.

Learn How to Trade Live!

Join Dave and The Crypto Den Crew and they’ll show you live on a webinar how to take your crypto trading to the next level.

Duration: 6-week course
From: November 15 to December 22
Date/Time: Twice a week, Mon and Wed at 7pm AEST
Location: Zoom webinar

Where to Buy or Trade Altcoins?

These coins have high liquidity on Binance Exchange, so that could help with trading on AUD/USDT/BTC pairs. And if you’re looking at buying and HODLing cryptos, then Swyftx Exchange is an easy-to-use popular choice in Australia.

Categories
Crypto News Ethereum Market Analysis Ripple Trading

Top 3 Coins to Watch Today: ETH, XRP, LUNA – November 24 Trading Analysis

Let’s take a closer look at today’s altcoins showing breakout signals. We’ll explain what the coin is, then dive into the trading charts and provide some analysis to help you decide.

1. Ethereum (ETH)

Ethereum ETH is a decentralised open-source blockchain system that features its own cryptocurrency, Ether. ETH works as a platform for numerous other cryptocurrencies, as well as for the execution of decentralised smart contracts. Ethereum’s own purported goal is to become a global platform for decentralised applications, allowing users from all over the world to write and run software that is resistant to censorship, downtime, and fraud.

ETH Price Analysis

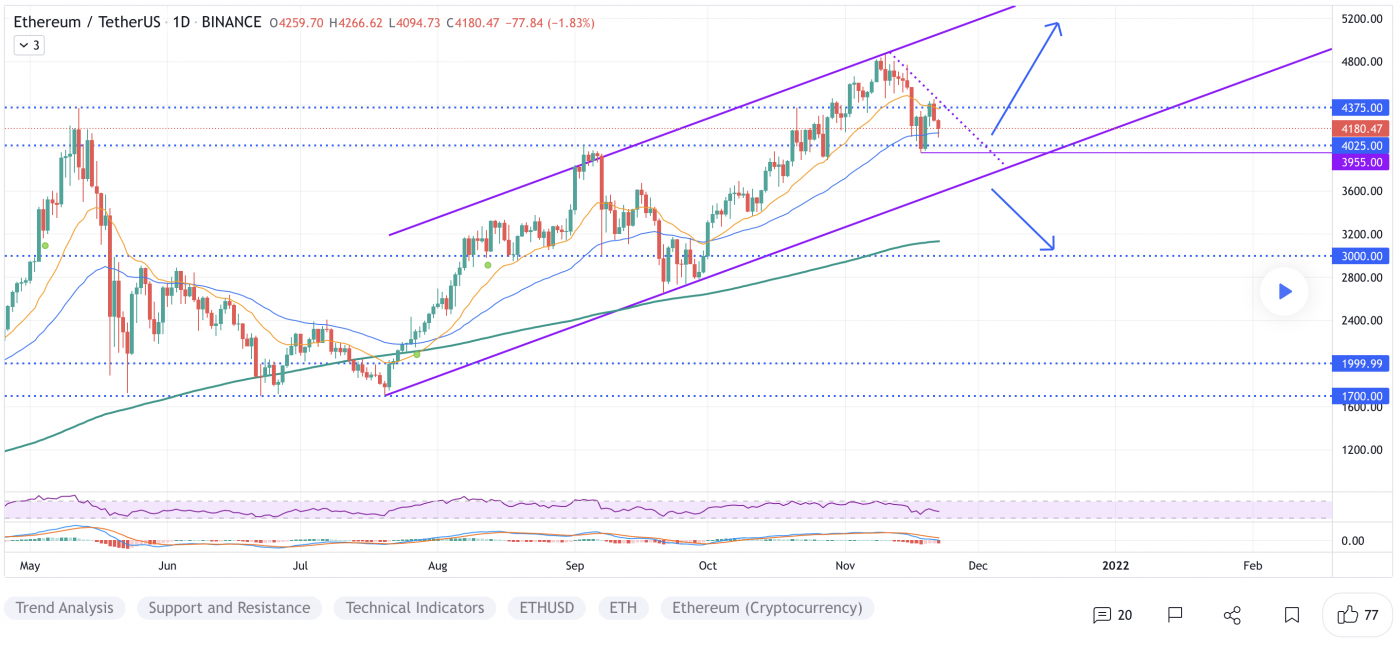
At the time of writing, ETH is ranked the 2nd cryptocurrency globally and the current price is US$4,326.81. Let’s take a look at the chart below for price analysis:

Source: TradingView

ETH‘s long-term range from November’s high could be coming to an end. The 9, 18, and 40 EMAs flipped bullish at the beginning of October after late September’s retracement, showing strength as BTC rallied. Currently, the price is hovering just under the all-time high as bulls take some profits.

Two swing highs and the 9 EMA could mark $4180.87 to $4026.72 as an area of possible support. A deeper retracement will likely find some buyers around the 61.8% retracement near $3867.59.

The all-time high will likely see some profit-taking, but the area near the 27% extension, at $4650.12, could also provide some resistance. The 61.8% extensions of the last two swings converge near $4820.54, which could be the target for an all-time high break before a new setup emerges.

2. Ripple (XRP)

Ripple XRP is the currency that runs on a digital payment platform called RippleNet, which is on top of a distributed ledger database called XRP Ledger. While RippleNet is run by a company called Ripple, the XRP Ledger is open-source and is not based on blockchain, but rather the previously mentioned distributed ledger database.

XRP Price Analysis

At the time of writing, XRP is ranked the 7th cryptocurrency globally and the current price is US$1.05. Let’s take a look at the chart below for price analysis:

Source: TradingView

XRP‘s 87% climb during early August returned to the monthly open, sweeping lows several times down to $0.9233. Last week, the price bounced from the monthly open near $1.03 again, creating possible support near $1.10. A quick sweep of this recent swing low could reach into a support area near $0.9834, while a sharp downturn in the market is likely to run for the relatively equal lows near $0.9160.

If the price breaks through the closest significant resistance near $1.17, the swing high at $1.25 is a likely target. This move could reach the daily gap near $1.28.

Strong bullish momentum could propel the price to resistance near $1.3o. If this move occurs, the significant swing high near $1.33 provides a reasonable goal.

3. Terra (LUNA)

Terra LUNA is a blockchain protocol that uses fiat-pegged stablecoins to power price-stable global payments systems. According to its whitepaper, Terra combines the price stability and wide adoption of fiat currencies with the censorship-resistance of Bitcoin and offers fast and affordable settlements. Terra’s native token, LUNA, is used to stabilise the price of the protocol’s stablecoins. LUNA holders are also able to submit and vote on governance proposals, giving it the functionality of a governance token.

LUNA Price Analysis

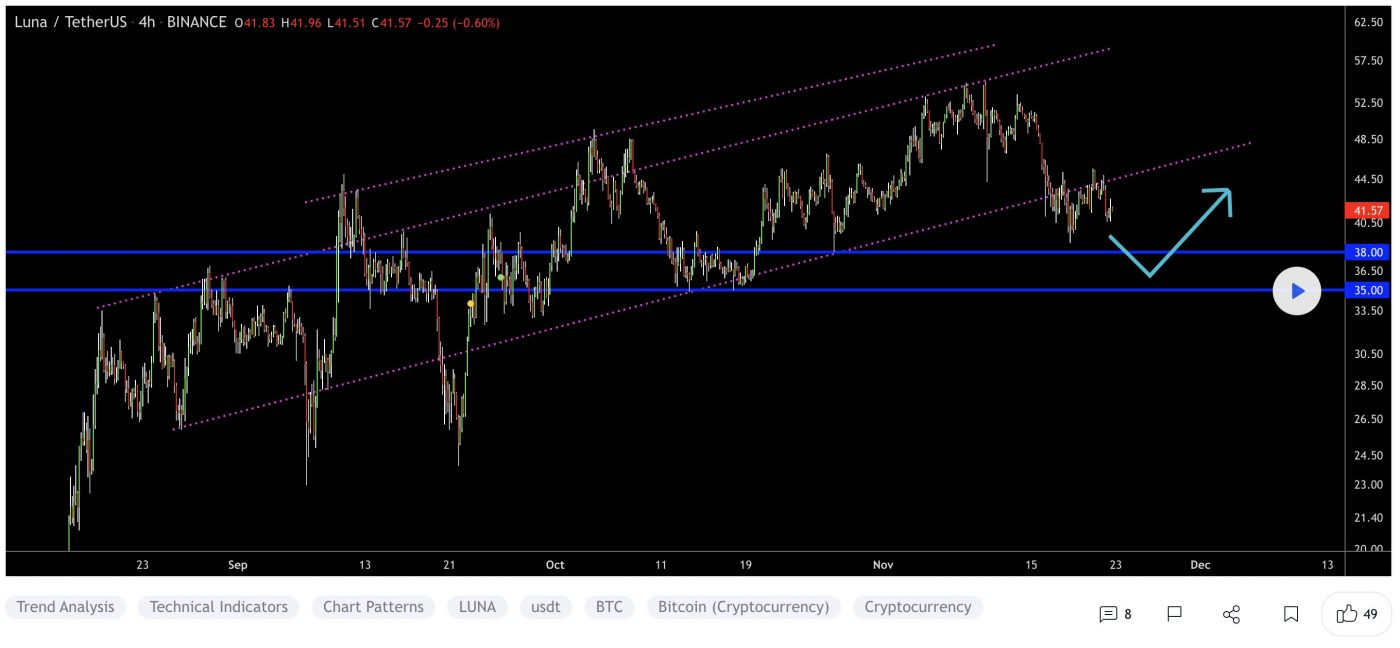
At the time of writing, LUNA is ranked the 14th cryptocurrency globally and the current price is US$42.01. Let’s take a look at the chart below for price analysis:

Source: TradingView

After breaking its October highs,  LUNA began a range that has been whiplashing both bulls and bears.

Resistance beginning near $49.35 held the price down for the second half of November, although bulls have shown some strength near the 9 and 18 EMAs. 

A quick drop to $40.37, or into the zone beginning near $44.87, could give bulls the fuel to push through the nearby resistance. If this resistance breaks, the high near $50.47 provides a reasonable target. 

A break of this level could move further into uncharted territory with the nearest probable resistances projected around $58.28 and $60.57.

More patient bulls might be waiting far below the 40 EMA with bids near the higher-timeframe range’s 61.8% retracement, near $35.59.

Learn How to Trade Live!

Join Dave and The Crypto Den Crew and they’ll show you live on a webinar how to take your crypto trading to the next level.

Duration: 6-week course
From: November 15 to December 22
Date/Time: Twice a week, Mon and Wed at 7pm AEST
Location: Zoom webinar

Where to Buy or Trade Altcoins?

These coins have high liquidity on Binance Exchange, so that could help with trading on AUD/USDT/BTC pairs. And if you’re looking at buying and HODLing cryptos, then Swyftx Exchange is an easy-to-use popular choice in Australia.

Categories
Crypto News Market Analysis Trading

Top 3 Coins to Watch Today: STX, BZRX, TABOO – November 23 Trading Analysis

Let’s take a closer look at today’s altcoins showing breakout signals. We’ll explain what the coin is, then dive into the trading charts and provide some analysis to help you decide.

1. Stacks (STX)

Stacks STX is a layer-1 blockchain solution that is designed to bring smart contracts and decentralised applications (DApps) to Bitcoin (BTC). These smart contracts are brought to Bitcoin without changing any of the features that make it so powerful – including its security and stability. The platform is powered by the Stacks token (STX), which is used for fuelling the execution of smart contracts, processing transactions, and registering new digital assets on the Stacks 2.0 blockchain.

STX Price Analysis

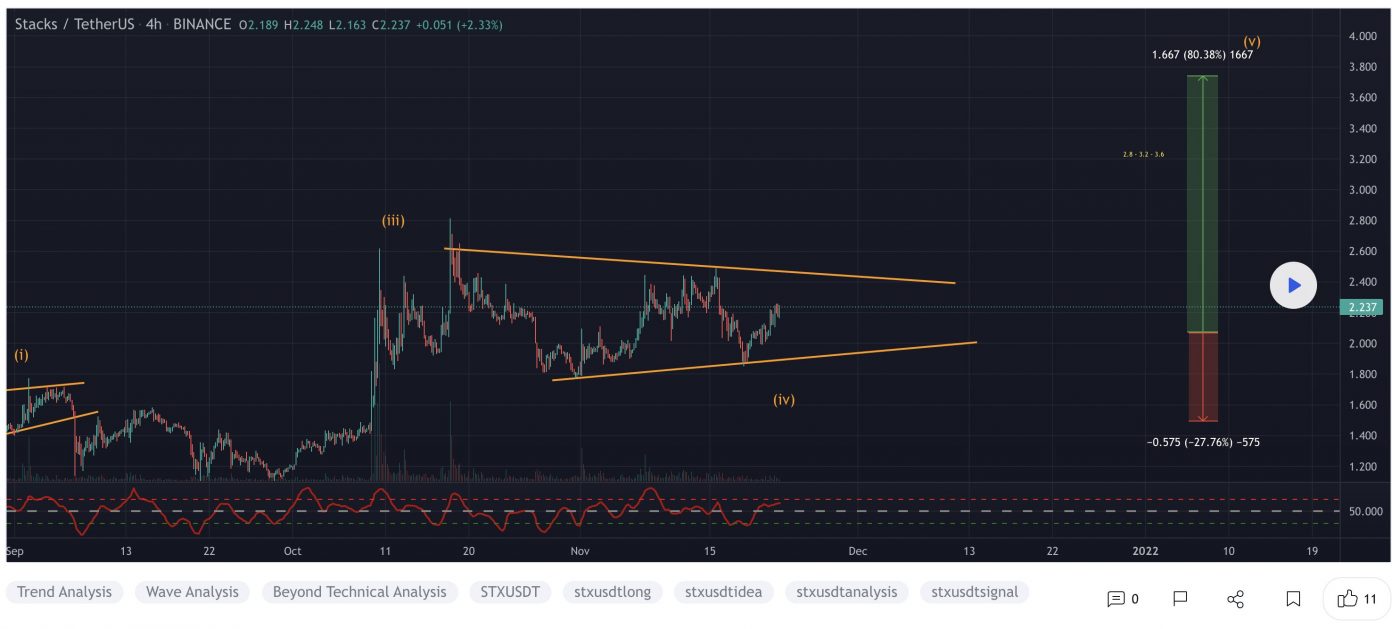
At the time of writing, STX is ranked the 60th cryptocurrency globally and the current price is US$2.19. Let’s take a look at the chart below for price analysis:

Source: TradingView

STX has been in a steady bullish trend since its June lows, reaching 463% by its mid-October high.

The price found resistance near $2.381, around the Q2 2021 highs, and continues to reject each climb into this level. While this price action shows significant selling, each tap is likely to weaken the resistance.

Just below the current price, $2.140 could offer support. The 9, 18, and 40 EMAs have stacked in this area, near the midpoint of the current range.

The price might sweep the range lows into possible support near $1.723, perhaps as excitement fades after the ALEX mainnet release on November 27. This area has confluence with the 61.8% retracement level and a swing high formed during early September.

The last consolidation before early October’s rally, near $1.440, could also offer some support on a steeper drop – perhaps caused by a significant bearish movement in Bitcoin.

A break through the resistance from $2.567 may begin price discovery. If this move occurs, extensions suggest that bulls might take significant profits in an area between $3.800 and $4.200.

2. Bzx Protocol (BZRX)

The Bzx protocol BZRX is an Ethereum-based decentralised platform built for DeFi lending and margin and leverage trading that differentiates itself from competitors through a smart contract-powered token system. Bzx’s trading front-end Fulcrum allows users to trade and/or lend crypto assets through tokenised loans (iTokens) and tokenised positions (pTokens). Torque serves as bZx’s lending front-end web interface, allowing users to borrow funds for any purpose at a fixed interest rate.

BZRX Price Analysis

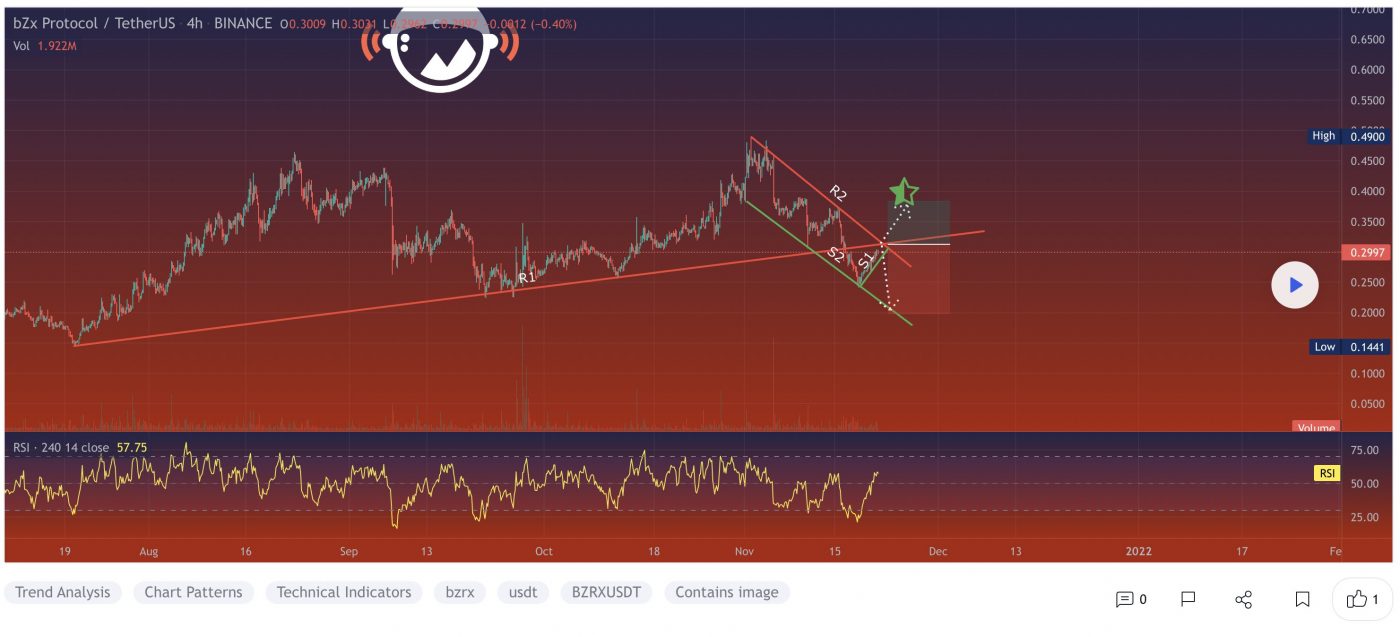
At the time of writing, BZRX is ranked the 475th cryptocurrency globally and the current price is US$0.2922. Let’s take a look at the chart below for price analysis:

Source: TradingView

BZRX rallied 240% from its July lows, creating a massive high-timeframe range before a sharp 50% decline during November.

With over a week to go before the token split and rebranding, the bounce could continue – or possibly turn into a more significant move.

An area of possible support near $0.2606 has provided a bounce. It remains to be seen if bulls can sustain this bounce and turn a contested area between $0.2929 and $0.2695, around the 61.8% retracement of the higher-timeframe range, into support. 

Lower, July’s swing high and the 78.6% retracement level could provide more substantial support near $0.2286. A sharp drop could reach as low as possible support near $0.1948, where June’s decline found some accumulation.

Any rallies are likely to encounter some resistance near the range highs near $0.4054 and $0.4900. A break from this range might find bulls taking some profits near the range’s 27% extension, near $0.5739, and a wide area of probable resistance beginning near the 61.8% extension, from $0.7093 to $0.7917.

3. TABOO Token (TABOO)

TABOO is an adult NFT and streaming media project specialising in highly exclusive content. With models, its content is not like other adult tokens. Its marketplace is cutting-edge, with creation by the Enjin Coin Marketplace Developers. Its NFT Marketplace and media platform will be cross-chain, utilising layer 2 solution protocols with the lowest fees and fastest transactions. An asset bridge to the ERC20 Network, along with Version 1 of the marketplace, aims to bring ERC721 and ERC1155 compatible NFTs to the Taboo Ecosystem on the Binance Smart Chain.

TABOO Price Analysis

At the time of writing, TABOO is ranked the 273rd cryptocurrency globally and the current price is US$0.03192. Let’s take a look at the chart below for price analysis:

Source: TradingView

TABOO has retraced 68% of its over 5,000% rally that began in early October.

A large bearish daily candle found support at the 40 EMA in a daily gap, near $0.01916, before retracing to its opening price, near $0.02766. 

The 9 and 18 EMAs near the opening price might provide support if the uptrend resumes. The recent swing low, near $0.01722, could also offer support again. 

However, the higher-timeframe consolidation, near $0.01167, may be seen as a safer bid by many bulls after any drop following November 23’s marketplace launch and exchange listing.

Some charts showed the price rallying into possible resistance near $0.03047 on November 22. If genuine and sustained, this resistance could flip to support for a further rally into resistance near $0.03714 and $0.05020.

If the price reaches beyond these levels, it will enter discovery, perhaps drawing toward possible resistance near $0.075.

Learn How to Trade Live!

Join Dave and The Crypto Den Crew and they’ll show you live on a webinar how to take your crypto trading to the next level.

Duration: 6-week course
From: November 15 to December 22
Date/Time: Twice a week, Mon and Wed at 7pm AEST
Location: Zoom webinar

Where to Buy or Trade Altcoins?

These coins have high liquidity on Binance Exchange, so that could help with trading on AUD/USDT/BTC pairs. And if you’re looking at buying and HODLing cryptos, then Swyftx Exchange is an easy-to-use popular choice in Australia. You can also buy these coins from different exchanges listed on Coinmarketcap.
Categories
Market Analysis The Crypto Den

TradeRoom: Our Weekly Crypto Trades Analysis – Nov 22, 2021

Welcome to this weekly series from the TradeRoom. My name is Dave and I’m the founder of The Crypto Den, an Australian-based crypto trading and education community aiming to give you the knowledge to take your trading game to the next level.

Crypto Market Outlook

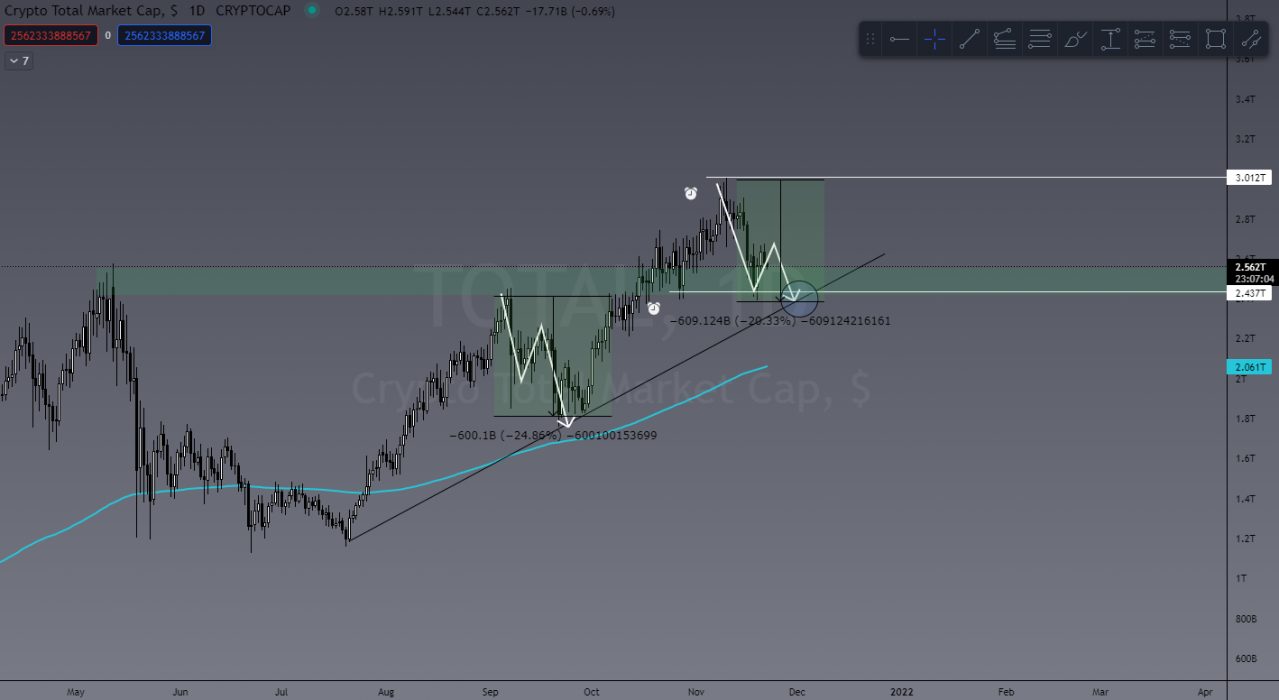
The crypto markets took a pretty decent hit after a US$500 billion sell-off in the past week. If you’re one of those people I’m seeing across all socials freaking out about this, DON’T STRESS!
You can see in the TOTAL chart below that the entire crypto cap took a US$600 billion hit back in September and recovered quite well. At this point I’m expecting the same to happen again.

TOTAL Crypto market cap

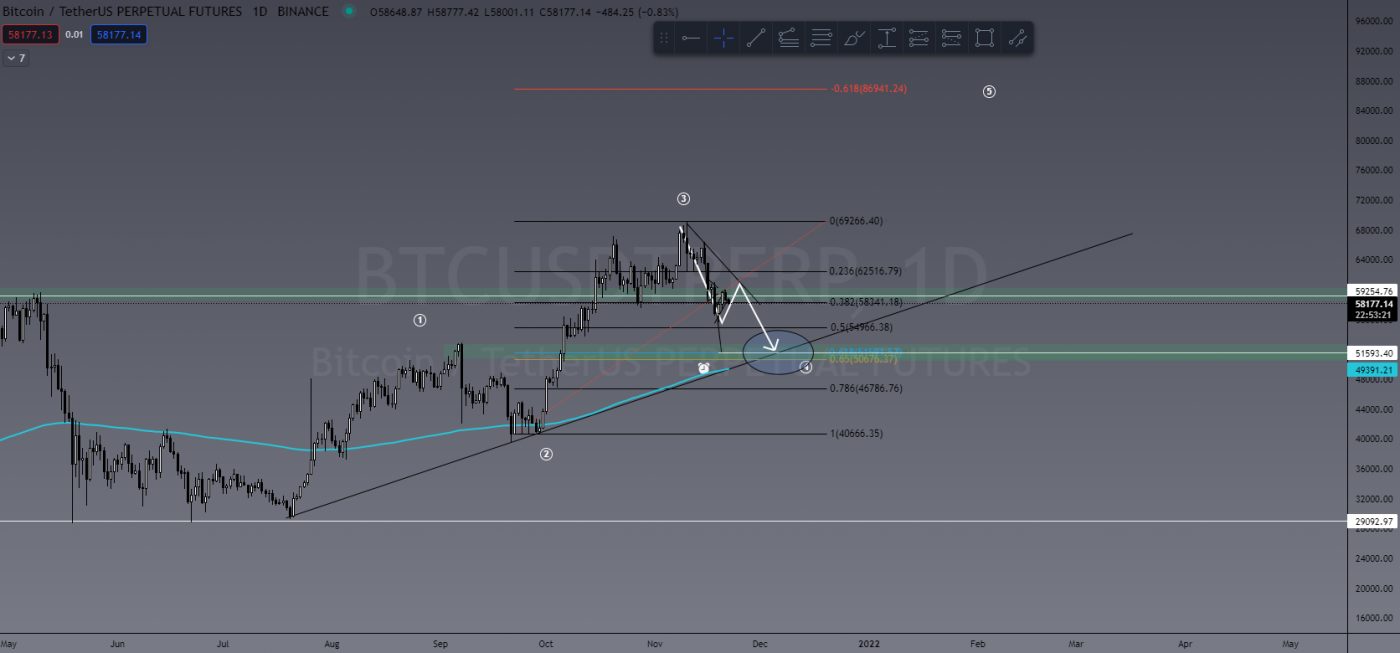
Looking at Bitcoin, we are seeing a bit of Elliott Wave Theory in play here. For those who don’t know what that is, it’s essentially investor psychology and sentiment presented as recurring patterns in the market – a 5 wave pattern, 3 waves up (impulse waves) and 2 waves down (corrective waves).

BTC is currently in the middle of wave 4 having a small bounce on the 50% Fibonacci level. We are expecting to to see further downside to a level of confluence between the current uptrend, 61.8% Fibonacci level and daily support level at US$51,500. All of which supports the Elliott Wave Theory.

BTC/USDT

Keep in mind wave 4 is a corrective wave. So this doesn’t mean doom and gloom. It would indicate BTC is simply having a healthy correction before the next leg up. I stand by our initial targets of US$78,000 as target 1 and US$87,000 as target 2.


Last Week’s Performance

MANA/USDT

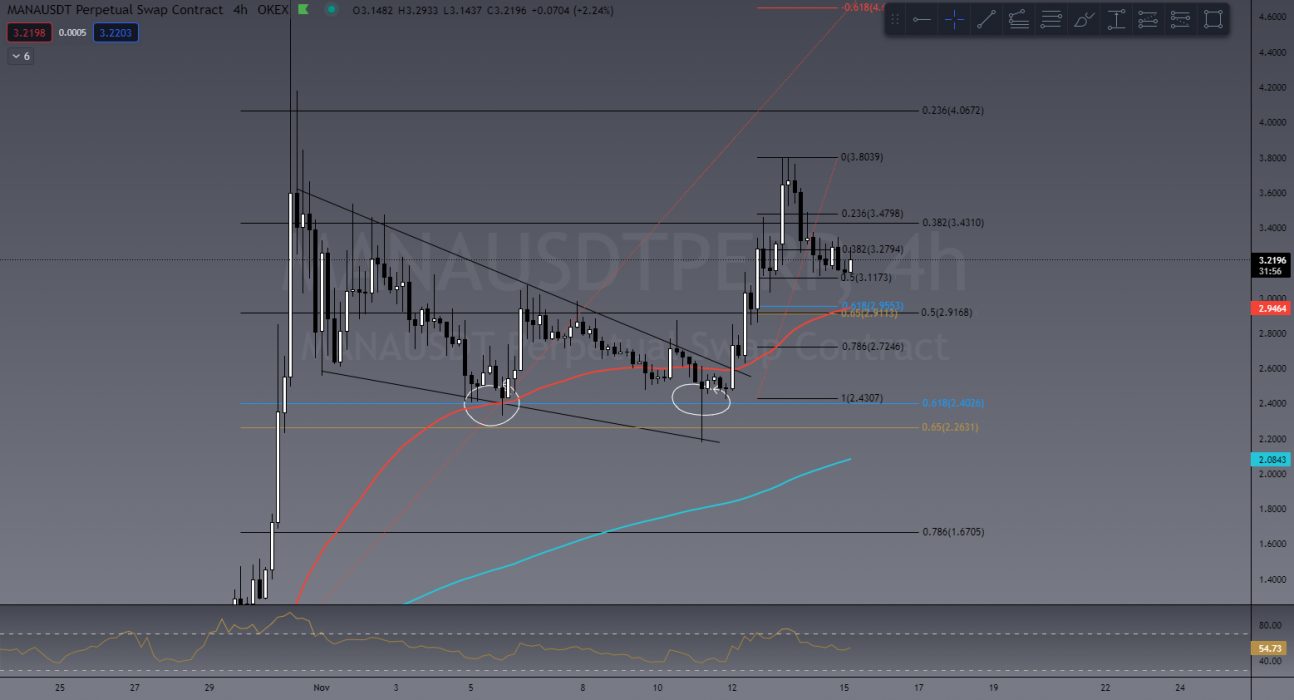
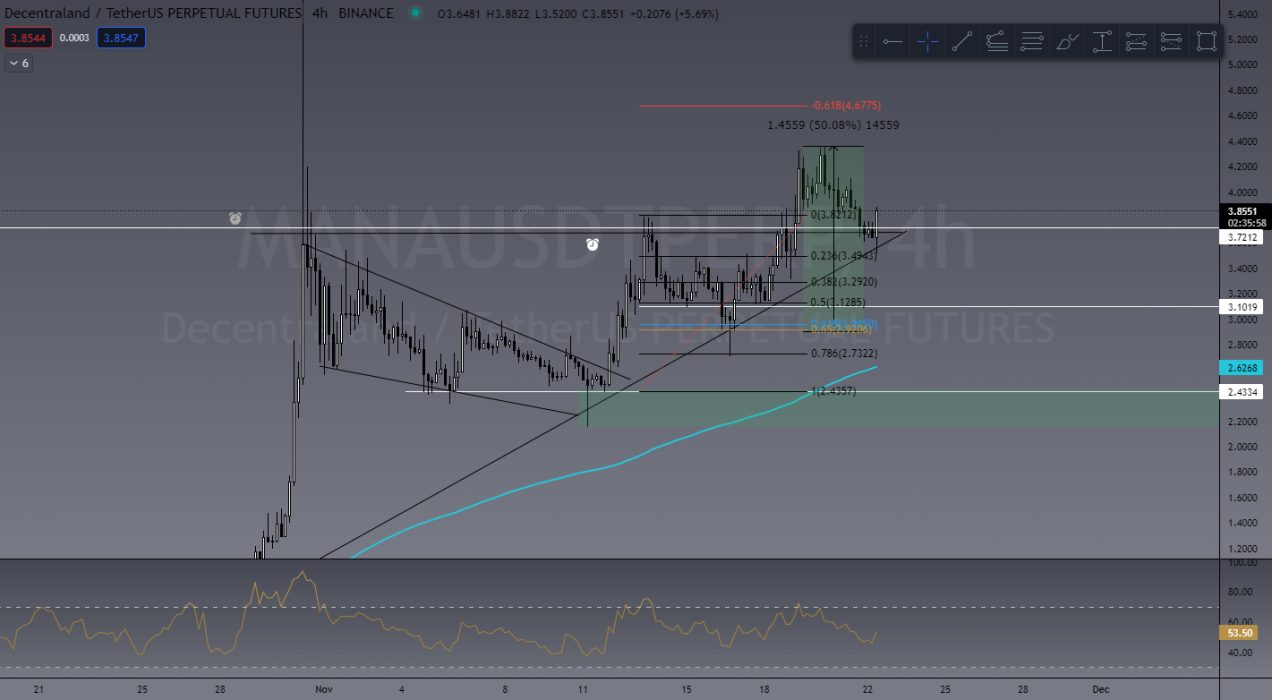
MANA has again made the list this week for top performers. In the TradeRoom, these metaverse tokens have been going crazy despite BTC itself seeing bearish action. In last week’s article I mentioned MANA would likely see a pullback into that 61.8% Fib level, which it did before a continuation up. It performed perfectly with a price increase of 50%.

MANA/USDT chart from last week’s article
Current MANA/USDT Chart


ENJ/USDT

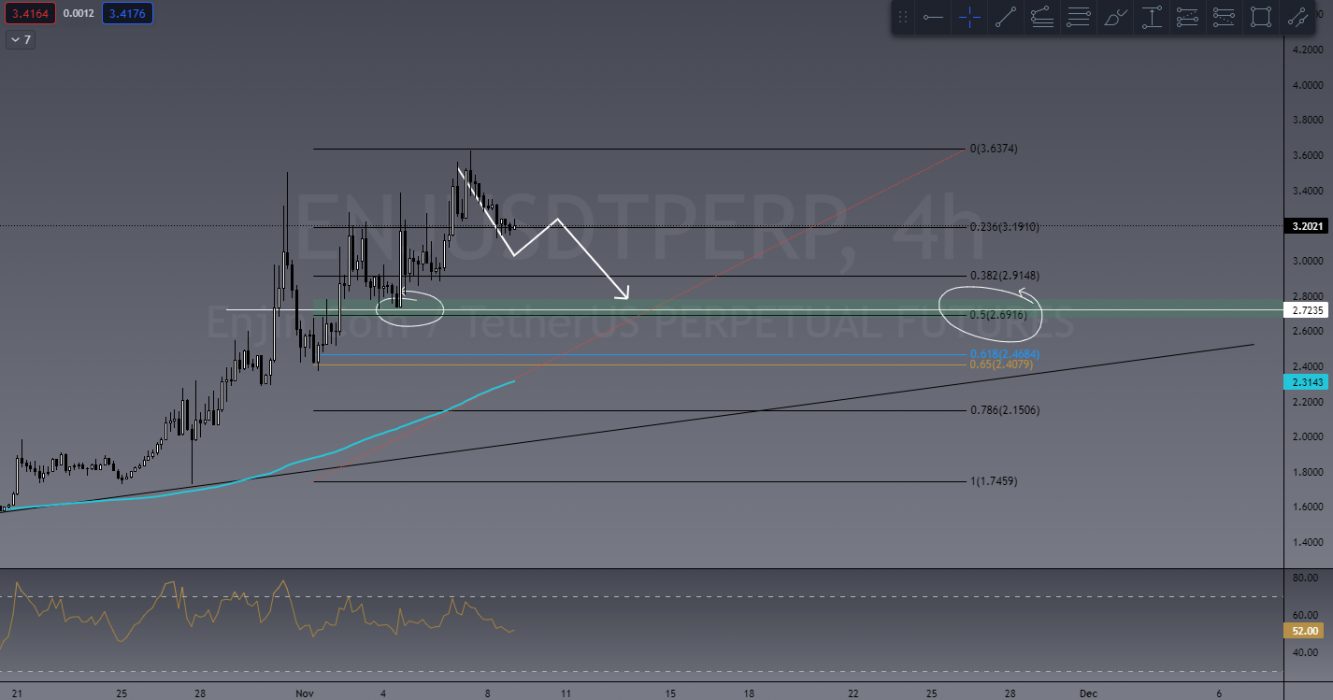
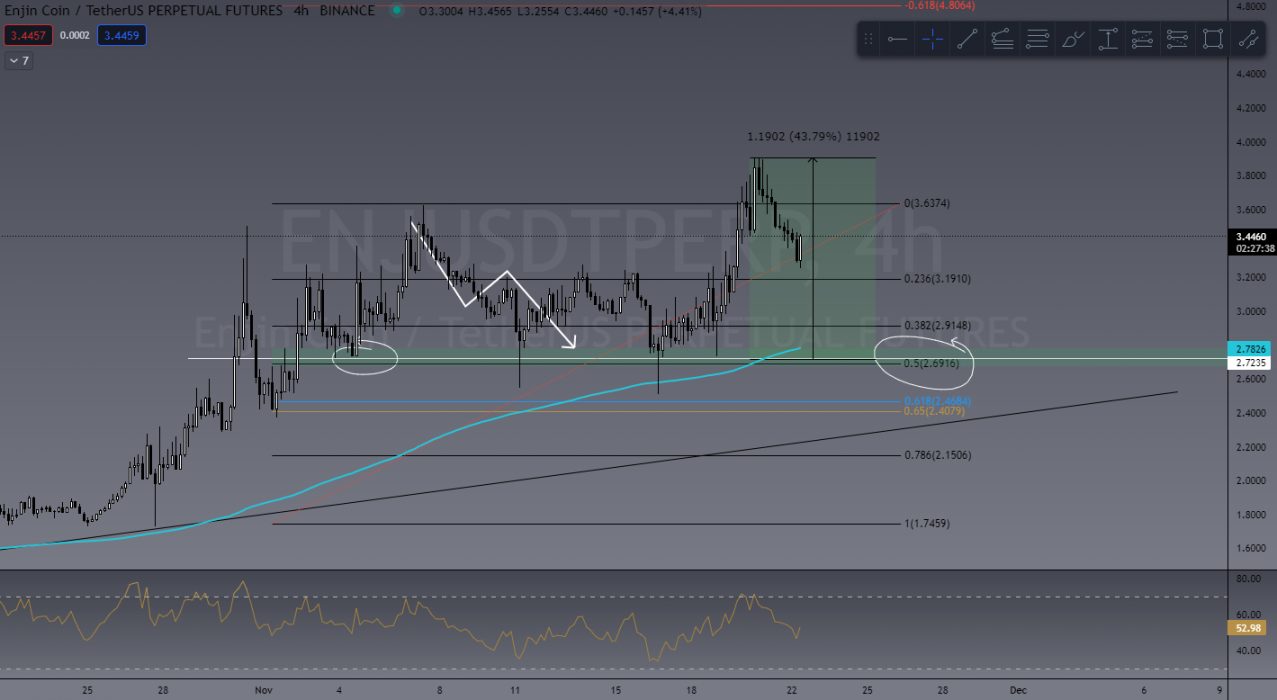
Another metaverse coin that performed well last week was Enjin: a nice clean pullback to a solid support level and the 50 Fib, and away she went with a nice 43% rise.

ENJ/USDT chart shared in our TradeRoom
ENJ/USDT Chart currently

This Week’s Trades

AXS/USDT

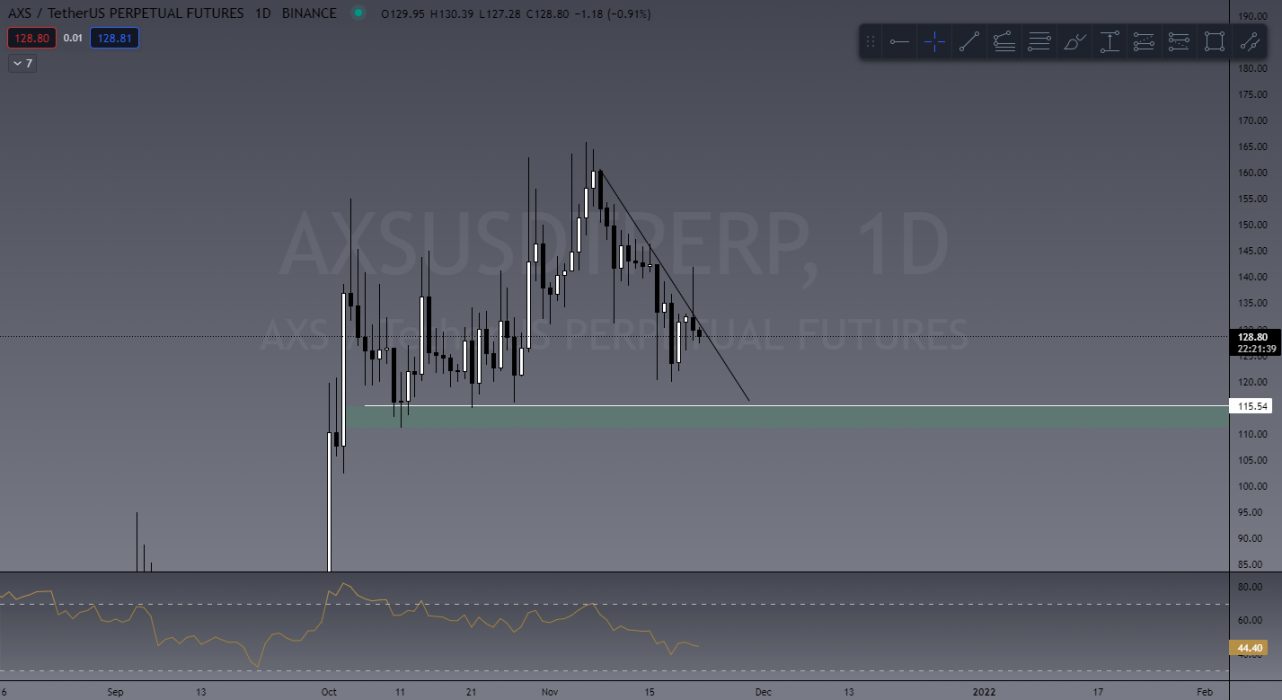
Sticking with the metaverse theme this week, we can’t go past AXS. Hoping to see a pullback to a good buy zone at the US$115 mark, where I’ll be looking for entries. If AXS continues to perform well with the BTC drops, who knows how high this beast can go?

AXS/USDT

SAND/USDT

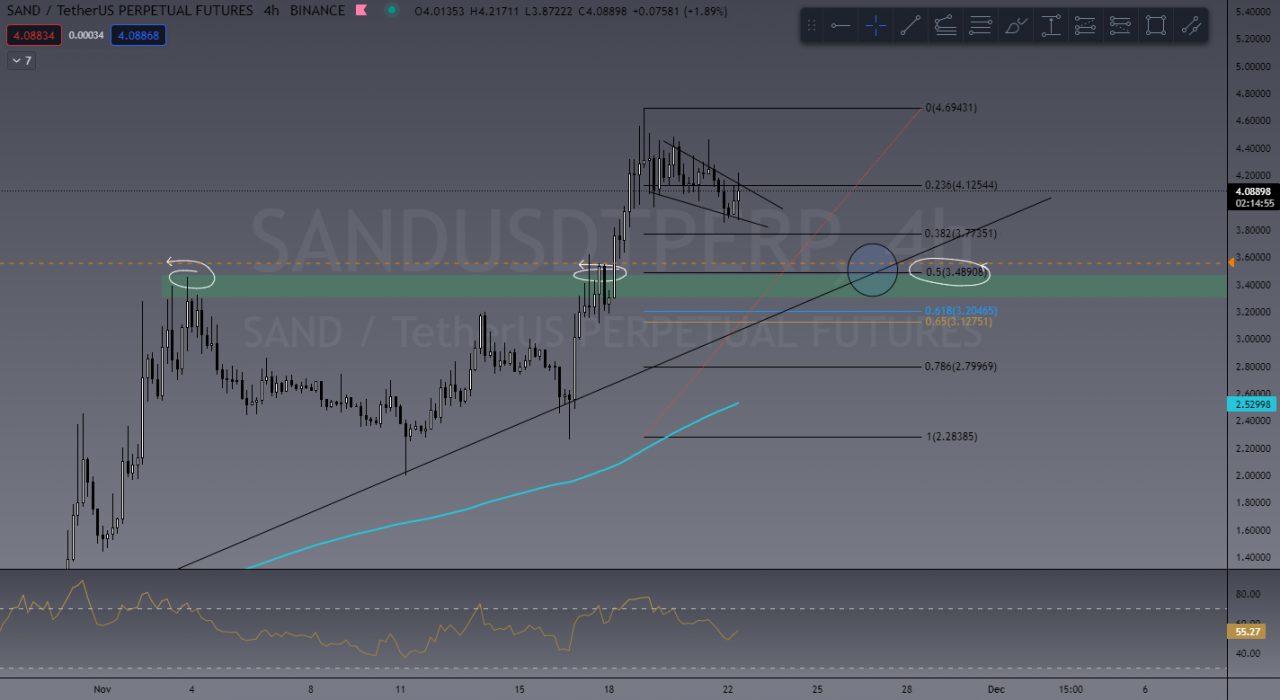
Again with the MV coins I know but hey, profit is profit. SAND is currently looking to be forming a bit of a bull pennant, however I’m personally hoping to see a bigger pullback into a healthier buy zone at around the US$3.48 area. Why? Well, it’s a good test on what will be a new level of support, test on current uptrend and the 50% Fib retrace.
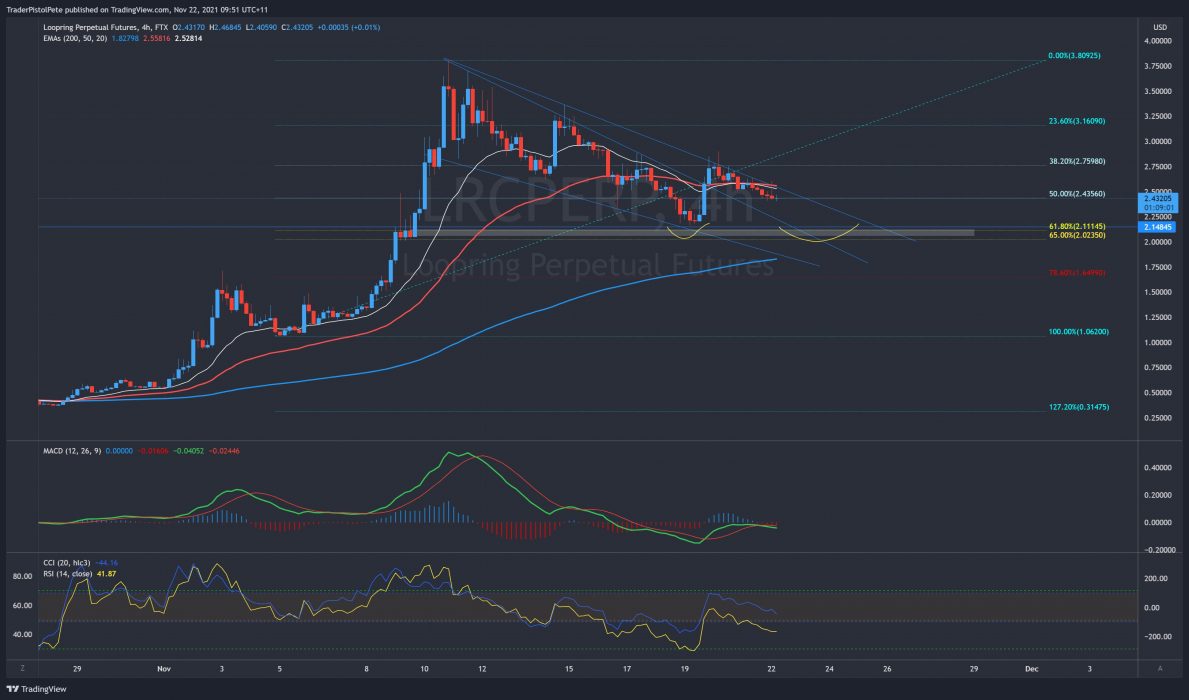
LRC/USDT

LRC is showing a really good pullback into a buy zone. In a chart posted in the TradeRoom by one of our team leaders, Pete, this morning you could see the buy zone clearly displayed in the 61.8% Fib level, which again is a common retracement level and Pete has also drawn a bullflag, which is a strong bullish continuation pattern. Target is US$2.10.

Pete’s LRC/USDT chart

Invite to Join our TradeRoom

If you’d like to become a better trader, you’re invited to join our TradeRoom where we share daily charts and market analysis. In our community we strongly encourage and teach correct risk management strategies to keep our members safe in this new volatile crypto market.

TCD’s TradeRoom

The Crypto Den was created in 2017 to help the rapidly growing crypto community learn and understand the fundamentals of digital currencies and how to trade them. 

Since then we have taught thousands of members the basics of technical analysis and trading strategies to further progress and perfect their trading abilities.

In the TradeRoom you will be included in a supportive environment which encourages personal growth, education and community support.

It’s a place to share your trading ideas and follow other experienced traders’ feeds to help keep your finger on the pulse of such a volatile market!

Categories
Cardano Crypto News Market Analysis Trading

Top 3 Coins to Watch Today: ADA, AVAX, SLP – November 22 Trading Analysis

Let’s take a closer look at today’s altcoins showing breakout signals. We’ll explain what the coin is, then dive into the trading charts and provide some analysis to help you decide.

1. Cardano (ADA)

Cardano ADA is a proof-of-stake blockchain platform that says its goal is to allow “changemakers, innovators and visionaries” to bring about positive global change. The open-source project also aims to “redistribute power from unaccountable structures to the margins to individuals”, helping to create a society that is more secure, transparent, and fair. Cardano is used by agricultural companies to track fresh produce from field to fork, while other products built on the platform allow educational credentials to be stored in a tamper-proof way, and retailers to clamp down on counterfeit goods.

ADA Price Analysis

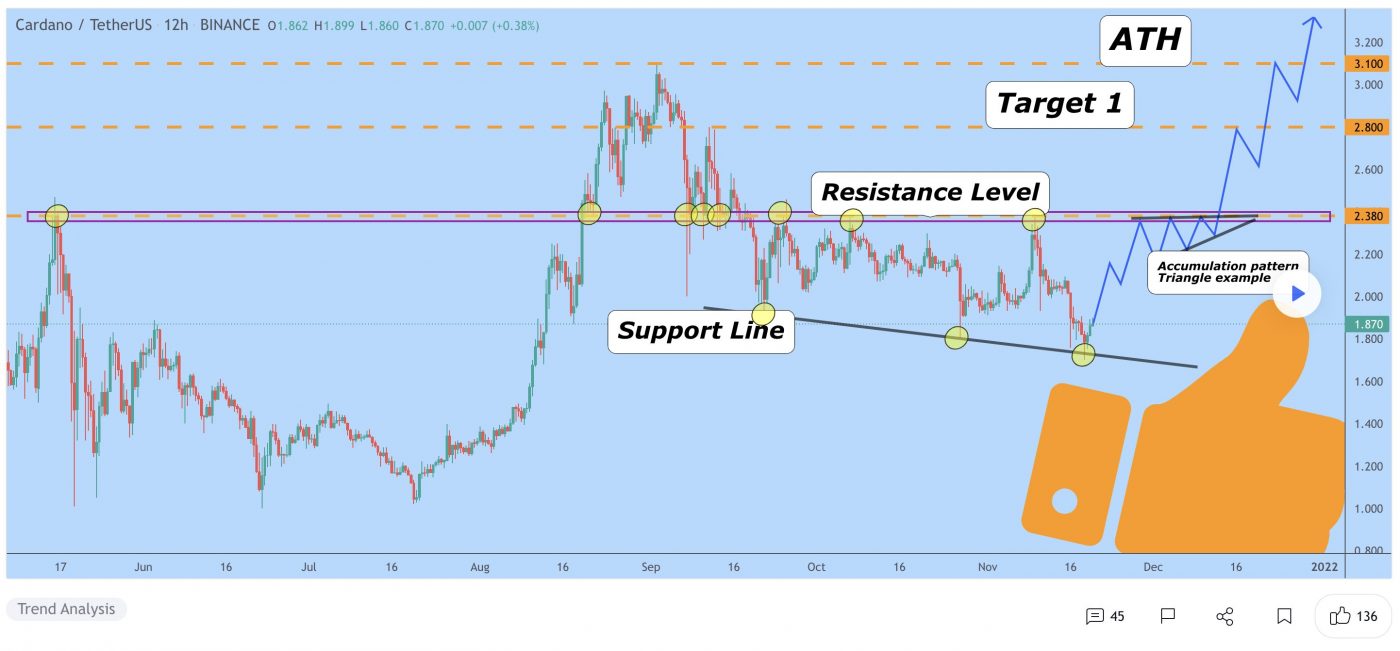
At the time of writing, ADA is ranked the 6th cryptocurrency globally and the current price is US$1.88. Let’s take a look at the chart below for price analysis:

Source: TradingView

ADA‘s nearly 56% drop from its August highs found a low near $1.60 during last week before closing over a short-term high around $1.90.

This daily close over the high could signal a shift in market structure that might reach probable resistance near $1.98. A sustained bullish move may target the swing high at $2.19. If this stop run occurs, a run beyond the high into probable resistance near $2.37 and $2.45 is possible.

Bulls could buy a retracement to possible support near $1.70, just above the monthly open. A bearish turn in the marketplace may propel the price toward possible support near $1.64. 

However, relatively equal lows near $1.60 and $1.54 provide an attractive target for bears if the market resumes its bearish trend. A run on these lows might find support between $1.48 and $1.40.

2. Avalanche (AVAX)

Avalanche AVAX is the fastest smart contracts platform in the blockchain industry, as measured by time-to-finality, and has the most validators securing its activity of any proof-of-stake protocol. Avalanche is blazingly fast, low-cost, and green. Any smart contract-enabled application can outperform its competition on Avalanche. AVAX is the native token of Avalanche. It is a hard-capped, scarce asset that is used to pay for fees, secure the platform through staking, and provide a basic unit of account between the multiple subnets created on Avalanche.

AVAX Price Analysis

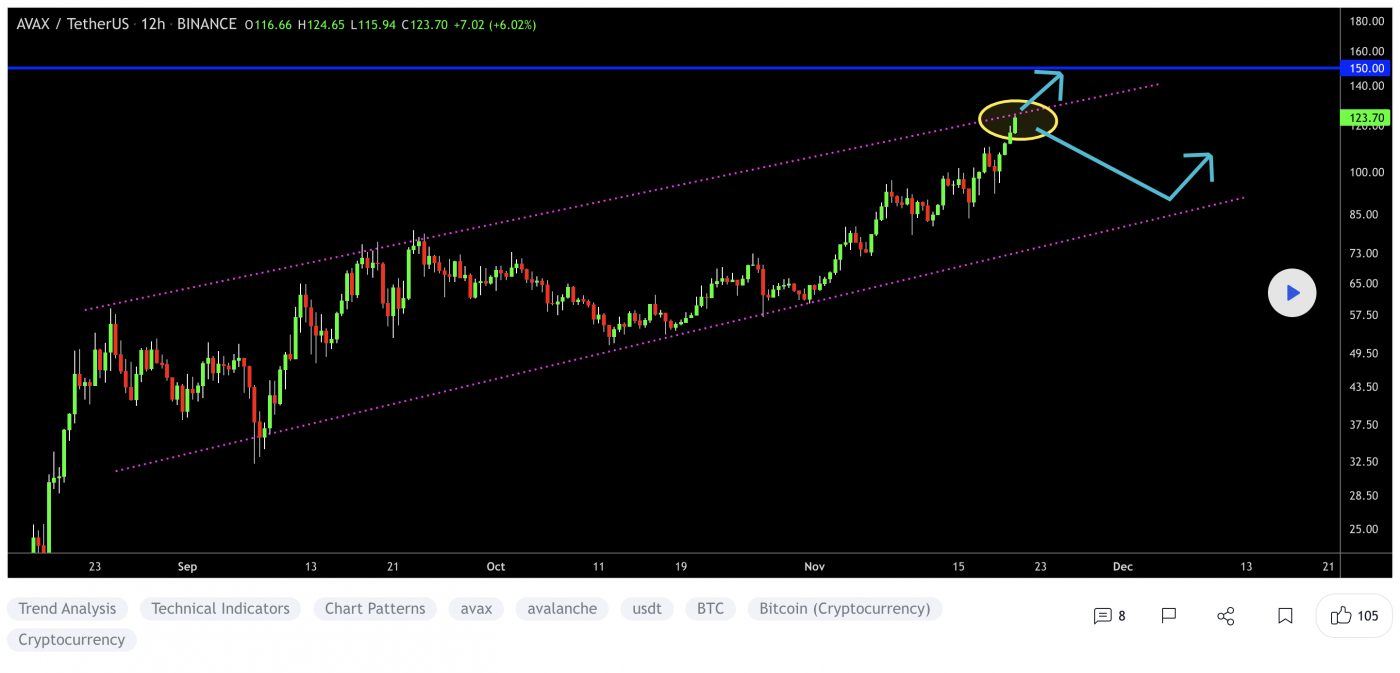
At the time of writing, AVAX is ranked the 10th cryptocurrency globally and the current price is US$136.48. Let’s take a look at the chart below for price analysis:

Source: TradingView

AVAX continued its rally through the daily gap between $98.45 and $96.25, turning this region into an area of possible support. 

However, a stop run under the relatively equal lows at $93.34 could form a wick below this level, potentially reaching an untapped daily gap beginning near $88.14.

Resistance starting at $144 has seen significant profit-taking, shown by the long upper wicks on the daily candles. A break of this resistance may reach the next significant new swing high at $155, continue into probable resistance just above, and possibly set new all-time highs at $163.

3. Smooth Love Potion (SLP)

Smooth Love Potion SLP tokens are earned by playing the Axie Infinity game. This digital asset serves as a replacement for experience points. SLP are ERC-20 tokens, and they can be used to breed new digital pets known as Axies. The cost of breeding begins at 100 SLP but increases gradually, rising to 200 SLP for the second breed, 300 for the third, 500 for the fourth, 800 for the fifth, and 1,300 for the sixth. Axies can be bred a maximum of seven times, and the seventh breed costs 2,100 SLP. This limit exists in order to prevent hyperinflation in the marketplace.

SLP Price Analysis

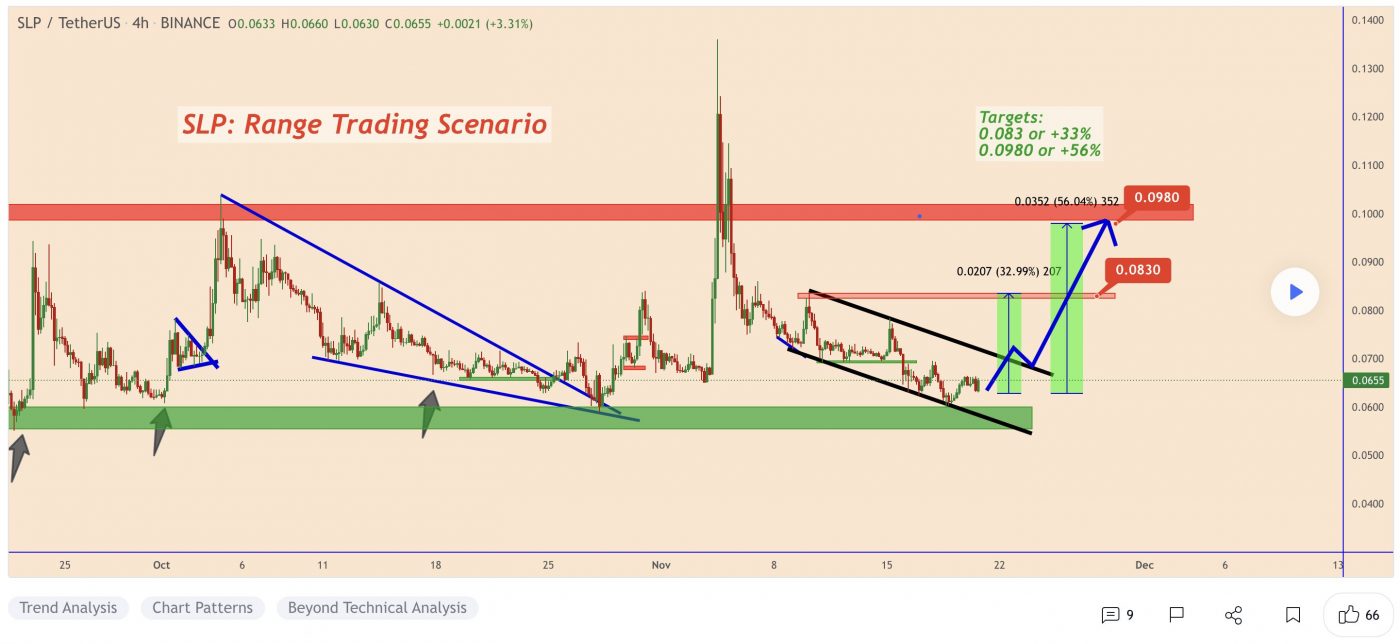
At the time of writing, SLP is ranked the 327th cryptocurrency globally and the current price is US$0.06923. Let’s take a look at the chart below for price analysis:

Source: TradingView

SLP‘s 160% pump during early July ran into 85% retracement near $0.05983 in late September. Since then, the price has been consolidating in a 120% range between $0.06124 and $0.07655.

Just below the mid-September low, $0.06327 is the first level likely to provide substantial support. If the price breaks down through this level, overlapping levels near $0.06122 might cap a run on the lows near $0.05914 and $0.05793.

The higher-timeframe analysis points to the area near $0.07795 as the next substantial resistance. Significant selling has been occurring here on the daily chart. If this level breaks, the swing highs near $0.083367 and $0.08620 may be the next targets.

Learn How to Trade Live!

Join Dave and The Crypto Den Crew and they’ll show you live on a webinar how to take your crypto trading to the next level.

Duration: 6-week course
From: November 15 to December 22
Date/Time: Twice a week, Mon and Wed at 7pm AEST
Location: Zoom webinar

Where to Buy or Trade Altcoins?

These coins have high liquidity on Binance Exchange, so that could help with trading on AUD/USDT/BTC pairs. And if you’re looking at buying and HODLing cryptos, then Swyftx Exchange is an easy-to-use popular choice in Australia.