Categories
Crypto News Market Analysis Trading

NPXS Coin Pumps +74% in a Single Day Amid Token Swap into PundiX Rebrand

The Cryptocurrency NPXS just went up +74% in a single day by breaking a Rising wedge pattern with strong buying volume and surges over +120% in a week.

What is NPXS?

Pundi X (NPXS) aims to make the use of cryptocurrency as a form of payment, a reality for retailers and consumers alike. By applying the technology to a series of real-world use cases such as cards and the XPOS point-of-sale devices, the team has built products that could accept the NPXS token for goods and services. With the goals of supporting retail intelligence, marketing & loyalty programs as well as inventory & order management systems, the Pundi X Point-of-Sale device could help to support digital commerce worldwide.

NPXS Quick Stats

SYMBOL:NPXS
Global rank:74
Market cap:$1,483,133,873 AUD
Current price:$0.007274
All time high price:$0.0201 AUD
1 day:+74.41%
7 day:+120.79%
1 year:+4313.95%

NPXS Price Analysis

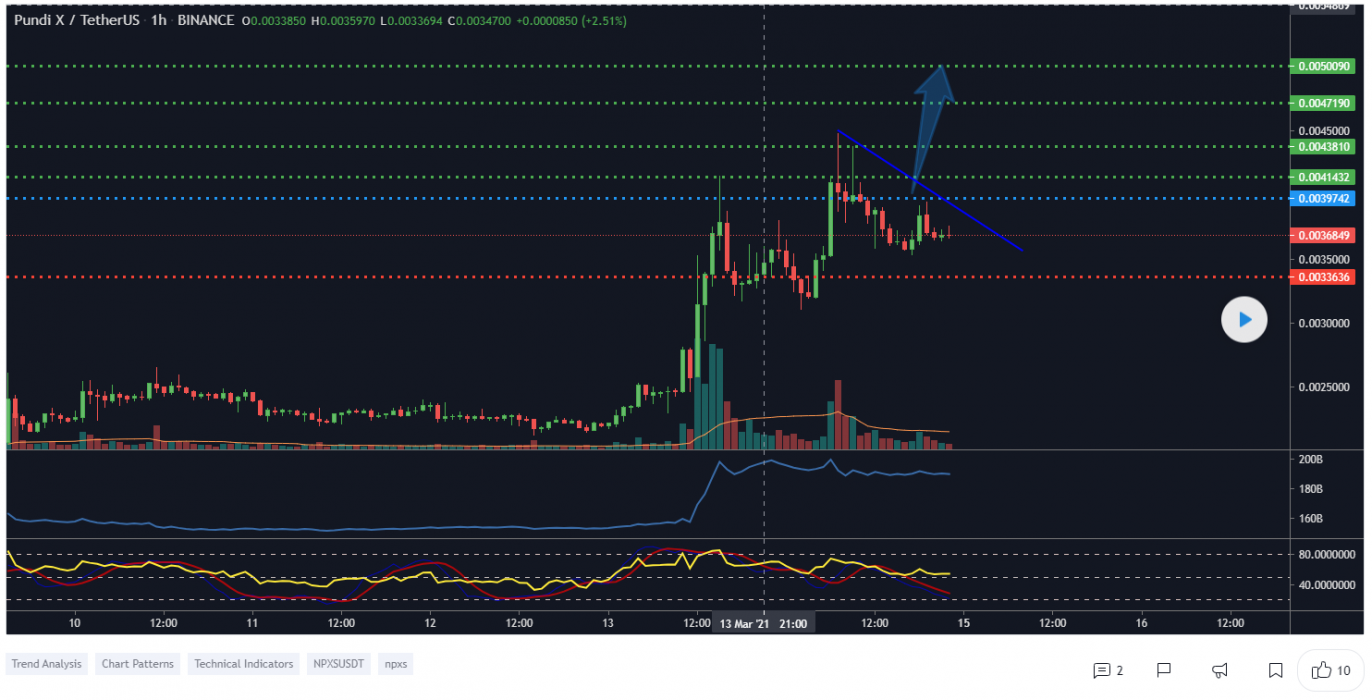
At the time of writing, NPXS is ranked 74th cryptocurrency globally and the current price is $0.007274 AUD. This is a +120.79% increase since 13th March 2021 (7 days ago) as shown in the chart below.
Source: TradingView

If we see the above 1-hour candle chart, NPXS did a strong parabolic breakout from the rising wedge pattern while trading sideways from the last few days around $0.005624 AUD price levels & is now heading towards its major resistance around $0.009588 AUD. After BTC made a new all-time high in its price and Altcoins are also rising in a bullish trend, NPXS looks well-positioned to hit the next high price levels.

“A rising wedge is a technical indicator, suggesting a reversal pattern frequently seen in bear markets. This pattern shows up in charts when the price moves upward with pivot highs and lows converging toward a single point known as the apex.”

What do the technical indicators say?

The NPXS TradingView indicators (on the 1 day) mainly indicate NPXS as a buy, except the Oscillators which indicate NPXS as a neutral.

So Why did NPXS Breakout?

General market sentiment suggests we are in the middle of the bull run season which could have contributed to the recent breakout. Another reason for this sudden pump in price could be the whales secretly buying NPXS for the next Altcoins rally & it could also be contributed to some of the recent news of the token redenomination swap on 30th March 2021.

Recent NPXS News & Events:

Where to Buy or Trade NPXS?

PundiX NPXS has the highest liquidity on Binance Exchange so that would help for trading NPXS/USDT or NPXS/ETH pairs. However, if you’re just looking at buying some quick and hodling then Swyftx Exchange is a popular choice in Australia.

Categories
Crypto News Litecoin Market Analysis Stellar Trading VeChain

3 Coins that Might Breakout this Week: LTC, VET, XLM – Altcoins Trading Analysis

For today’s trading news, we’re looking at three Altcoins that might breakout this week by showing bullish trends in the charts.

1. Litecoin (LTC)

Litecoin is a cryptocurrency that was designed to provide fast, secure, and low-cost payments by leveraging the unique properties of blockchain technology.

The cryptocurrency was created based on the Bitcoin protocol, but it differs in terms of the hashing algorithm used, hard cap, block transaction times, and a few other factors. Litecoin has a block time of just 2.5 minutes and extremely low transaction fees, making it suitable for micro-transactions and point-of-sale payments.

Litecoin Price Analysis

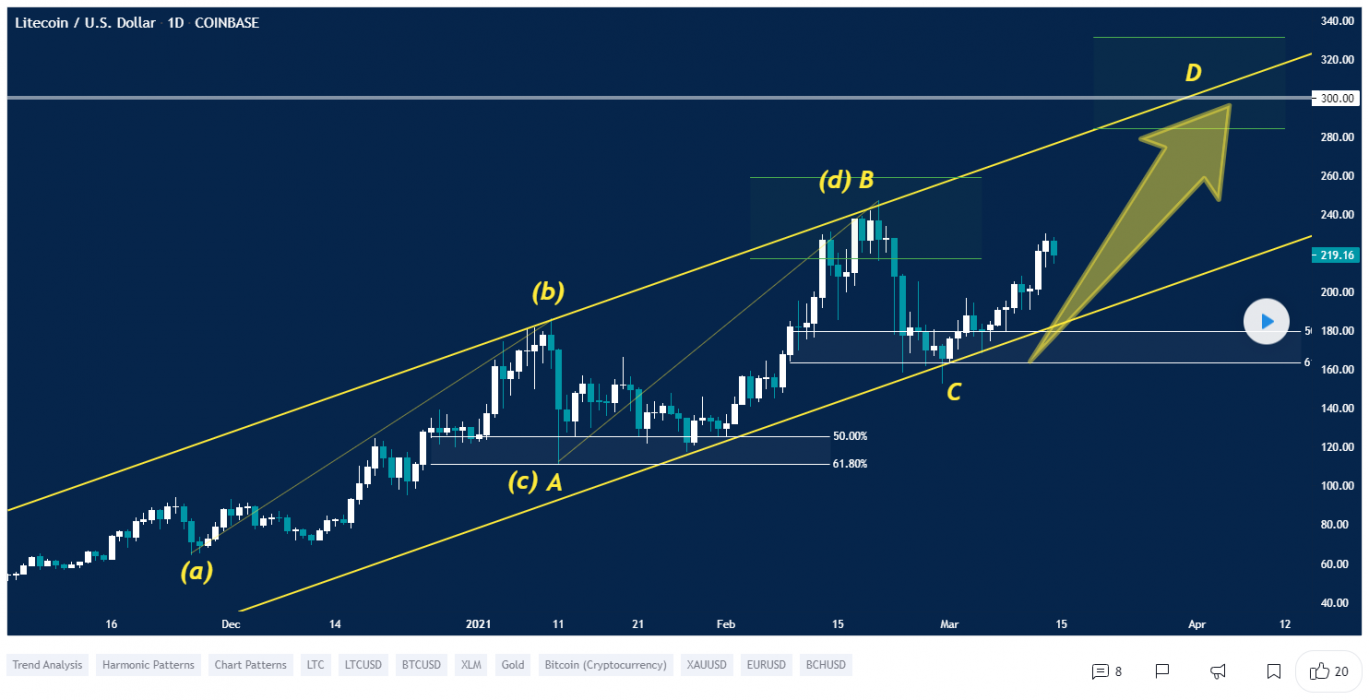
At the time of writing, LTC is ranked 9th cryptocurrency globally and the current price is $261.43 AUD. Let’s take a look at the chart below for price analysis.

Source: TradingView

March brought an instant turn in LTC’s retracement as the price pumped nearly +41% into the resistance near $256 AUD.

A daily gap and down candle between $238 AUD and $215 AUD may support a push through the high of around $297 AUD.

Bulls looking for longer-term plays could wait for a retracement to probable support near $210 AUD and potentially down to support at $195 AUD.

Extensions based on February’s retracement suggest that $385 AUD and $470 AUD may be the following primary targets. The swing high’s resistance near $296 AUD provides a logical area to take first profits.

2. VeChain (VET)

VeChain is a blockchain-powered supply chain platform. VeChain aims to use distributed governance and Internet of Things (IoT) technology to create an ecosystem that solves some of the major problems with supply chain management.

The platform uses two in-house tokens, VET and VTHO, to manage and create value based on its VeChainThor public blockchain. The idea is to boost the efficiency, traceability, and transparency of supply chains while reducing costs and placing more control in the hands of individual users.

VeChain Price Analysis

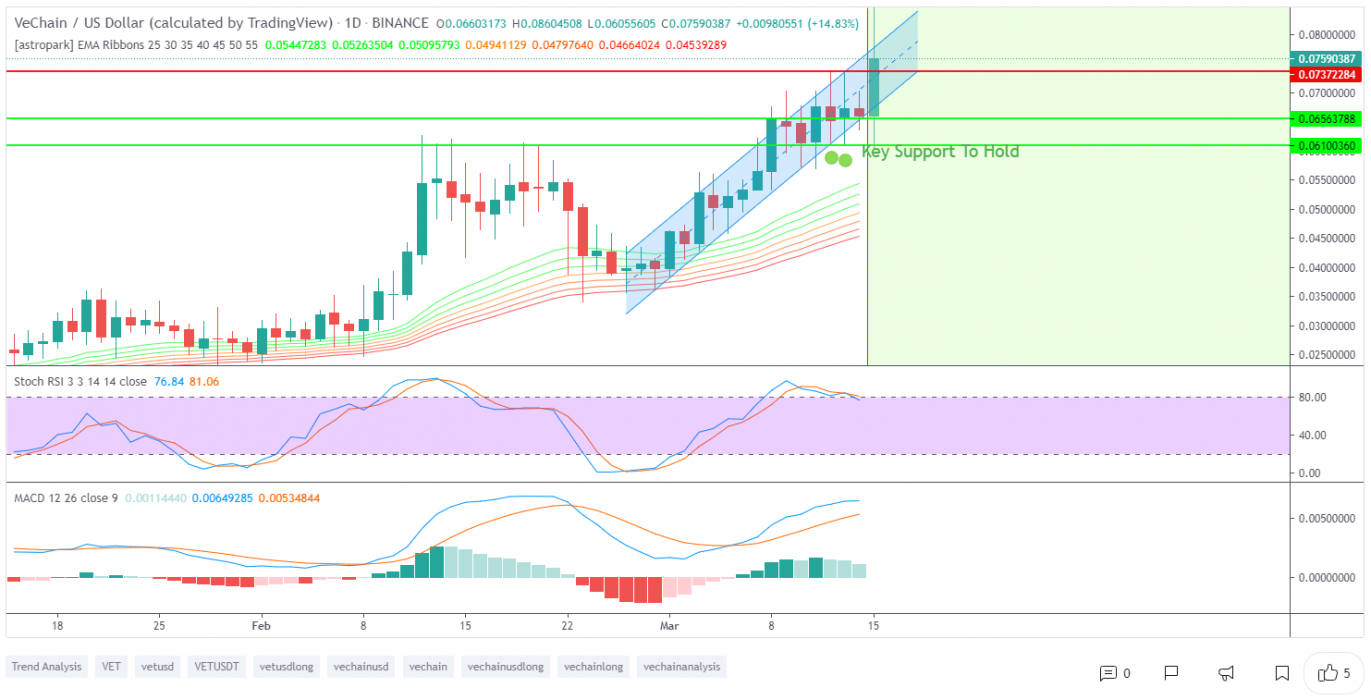
At the time of writing, VET is ranked 18th cryptocurrency globally and the current price is $0.0983 AUD. Let’s take a look at the chart below for price analysis.

Source: TradingView

VET shot up nearly +84% from the February open as the price aggressively challenges the last high and resistance near $0.0985 AUD.

Bulls waiting to get on board could watch support near $0.0853 AUD, just above the series of swing highs near $0.0834 AUD.

A deeper retracement to end the month could reach as low as $0.0755 AUD, which would run the swing lows down to $0.0735 and provide a better entry.

Overlapping extensions hint at the areas around $0.1145 AUD and $0.1250 AUD as logical take-profit zones.

3. Stellar (XLM)

Stellar is an open network that allows money to be moved and stored. One of its goals was boosting financial inclusion by reaching the world’s unbanked — but soon afterward, its priorities shifted to helping financial firms connect with one another through blockchain technology.

The network’s native token, lumens, serves as a bridge that makes it less expensive to trade assets across borders. All of this aims to challenge existing payment providers, who often charge high fees for a similar service.

Stellar Price Analysis

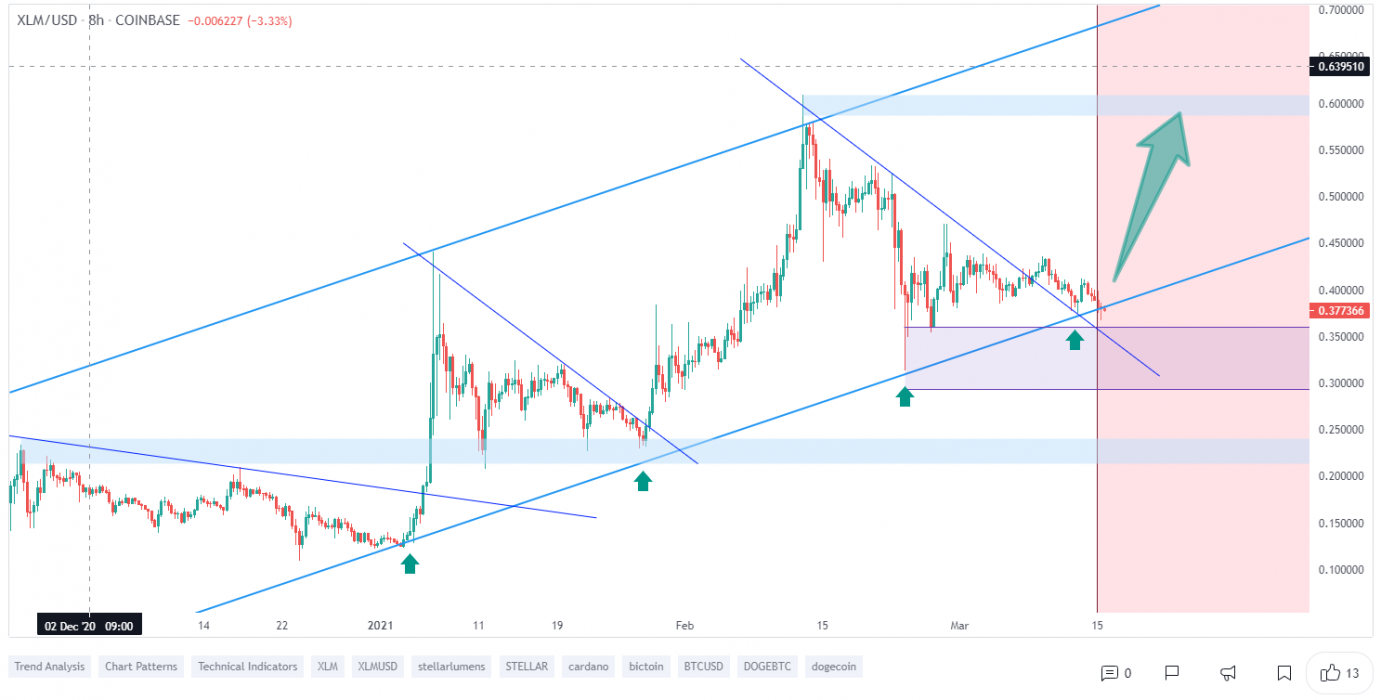
At the time of writing, XLM is ranked 13th cryptocurrency globally and the current price is $0.4919 AUD. Let’s take a look at the chart below for price analysis.

Source: TradingView

XLM’s bullish February turned into March consolidation, which is likely to break upward if market conditions remain bullish.

Support may be forming around the current area near $0.5021 AUD, giving bulls an aggressive entry with a wide stop.

A sweep of February 23rd’s low near $0.4125 AUD into the support just below would give a much higher risk-reward entry. If the price drops this far, it could reach support near $0.3846 AUD.

Overhead, several layers of resistance rest near $0.5381 AUD, $0.6137 AUD, and $0.6641 AUD. Confident bulls could take profits at the swing highs accompanying this resistance. 

More patient bulls waiting for higher risk-reward entries could watch for setups to form in potential retracements from these levels.

Where to Buy or Trade Altcoins?

These 3 Altcoins have the highest liquidity on Binance Exchange so that would help for trading on USDT or BTC pairs. However, if you’re just looking at buying some quick and hodling then Swyftx Exchange is an easy to use popular choice in Australia.

Categories
Crypto News Fan Tokens Market Analysis NFTs Sports Tokens

Chiliz Token is Red Hot! CHZ Pumps 7,000% In 3 Months Amid Big Sports Partnerships

Chiliz’s native token CHZ saw over 7,000 percent increase over the past 3 months, going from just US $0.012 to $0.87 between 13th December to 13th March 2021. It’s currently sitting at around $0.66.

The Chiliz token exchange platform powers the Sports Fan Tokens, which are digital assets that allow users to participate and vote in club polls, as well as provide access to VIP rewards, exclusive club and sponsor promotions.

This new sports token ecosystem could be a win-win for fans and clubs alike. With fans disconnected physically from their fandom, and this helps bridge that gap and engage more with their favourite sports. And for the clubs it’s essentially a new revenue stream.

Chiliz Token Exchange

Some facts:

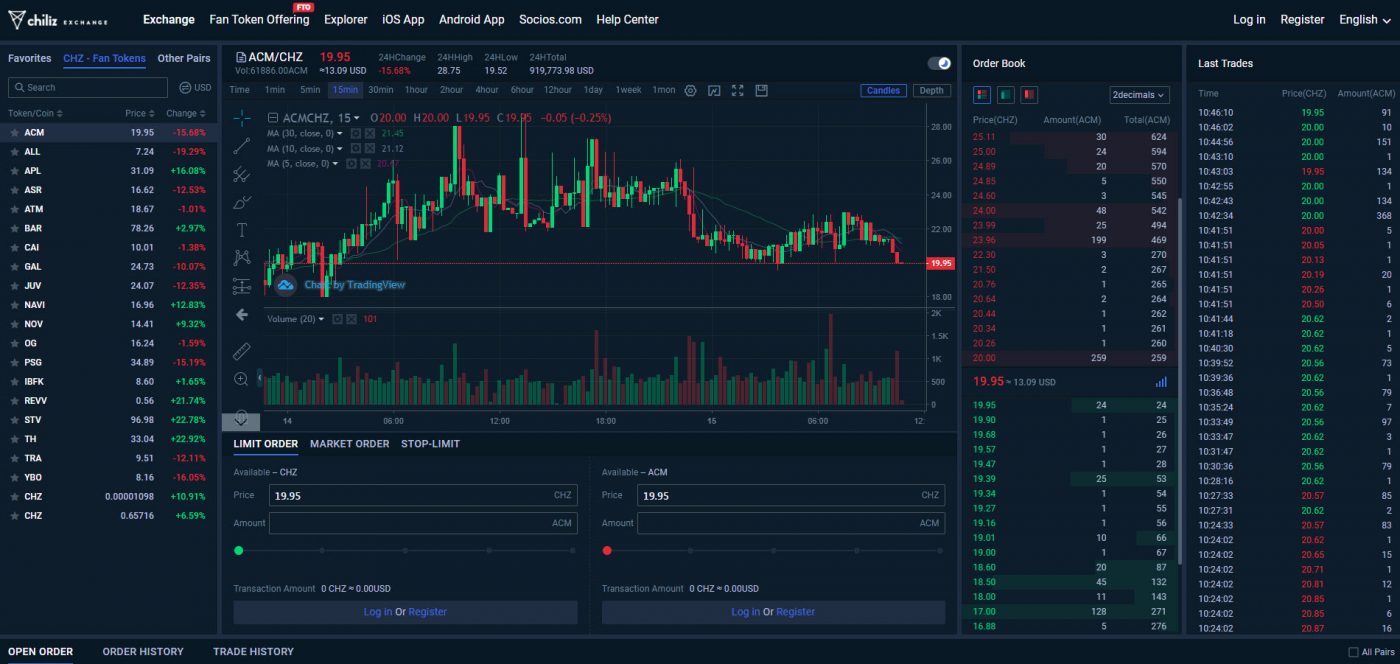
  • Chiliz runs its own exchange. You can see the live token transactions on its blockchain explorer.
  • The Chiliz token ($CHZ) is both an ERC-20 utility token on the Ethereum blockchain and a BEP-2 token on Binance Chain.
  • There are 8,888,888,888 $CHZ (8.8 Billion) tokens in total supply, with 5.5 Billion in circulation.
  • Binance has invested directly into the Chiliz project. This might explain why the sports club tokens such as PSG/BAR got listed on Binance so quickly.
  • Alexandre Dreyfus is the founder and CEO of both Chiliz and Socios.com – watch his keynote speech.
  • The Chiliz blockchain relies on a Proof-of-Authority (PoA) side chain consensus mechanism for security (as opposed to PoW or PoS).

Socios App

Promoted as “the worlds first fan influence platform”, the Socios App is where you can buy the Official tokens of sports clubs that have partnered with them.

Socios Soccer Partnerships

The Socios app has some big names as Partners including the following Football (Soccer) teams.

It looks like a pretty amazing advertising opportunity for them, leveraging their brand, banners and TV coverage at sports events to promote their token.

NFTs is also fuelling the mania with more sports club NFTs expected to be released this year.

Future Socios Partnerships

Fan Token Offering Pre-Sale Partner Tokens via “Locker Rooms”

You can pre-buy your fan tokens through the Fan Token Offerings, although the term “locker rooms” might be a bit misleading to fans thinking they are actually getting to be in the locker room of their favourite sports people. That’s not the case. Instead, it’s basically a token pre-sale, opened before they have even sealed the deal with the sports clubs.

How the pre-sale works:

  • You buy the CHZ token and they lock it up for 120 days (giving you a 10% yield).
  • Should the potential partner club decide to launch on Socios.com, Locker One Tokens are transformed into official Fan Tokens at a 1:1 ratio.
  • Should the potential partner decide against launching a Fan Token, users who have purchased Locker One Tokens will receive a full refund of the $CHZ pledged to their Socios.com account once the 120 day window has elapsed or the Locker closes.

This provides the platform an indication of the demand for a sport/club while reserving the CHZ token (which in turn helps price support levels). It might also incentivise the company getting the deal over the line if they can demonstrate enough demand on the pre-sale of the potential Partner token.

$50 Million Investment to Expand Into the USA

“We head to the U.S. with a proven track record in generating millions of dollars of revenue for some of Europe’s biggest sporting organisations. In 2020, we shared more than $30 million with our partners, but this year we’re targeting a minimum of $60 million,” said Chiliz CEO Alexandre Dreyfus to Reuters.

There are rumours that the purpose of this investment is to venture into USA to form a partnership with the NFL. But that is yet to be seen.

Socios VISA Card

There are plans for Socios to launch a VISA card. You can apply for the waiting list. Perks include cashback in CHZ token and extra rewards when shopping at various sport shops.

Conclusions

The CHZ token has seen incredible gains over the past few months, but buying when FOMO peaks and price is at an all-time high usually doesn’t look like the best idea.

Personally, I think the token economy is coming, and this is just the start of it. At this pace, it seems pretty much everything will be tokenised soon.

Categories
Crypto News Market Analysis Trading

VITE Coin pumps +80% in a Single Day amid Integration with Binance Smart Chain

Vite coin is trading in an uptrend here like many other altcoins. The Cryptocurrency VITE just went up +80% in a single day by breaking a Falling wedge pattern with strong buying volume and surges over +123% in a week.

What is Vite?

Vite has built a Directed Acyclic Graph (DAG) based smart-contract platform, with a Snapshot Chain structure to facilitate zero-fee transactions and optimize transaction speed, reliability, and security. The Snapshot Chain of Vite utilizes Hierarchical Delegated Proof of Stake (“HDPoS”) to achieve network consensus, while supernodes take only staking rewards and no transaction fees. Vite virtual machine maintains compatibility with EVM, and utilizes asynchronous smart contract language, Solidity++.

The VITE token is the currency for simple token transactions and smart-contract executions on the Vite network, with users staking VITE for transaction quota instead of consuming gas. VITE can also be used to vote for Snapshot Block Producers (aka supernodes). In addition, a VITE staker with an unused transaction quota can lease such quota to dApps in exchange for their tokens. For instance, users can stake VITE in exchange for ViteX’s native decentralized exchange token, VX.

VITE Quick Stats

SYMBOL:VITE
Global rank:395
Market cap:$84,847,245 AUD
Current price:$0.1867 AUD
All time high price:$0.2203 AUD
1 day:+80.38%
7 day:+123.96%
1 year:+814.94%

VITE Price Analysis

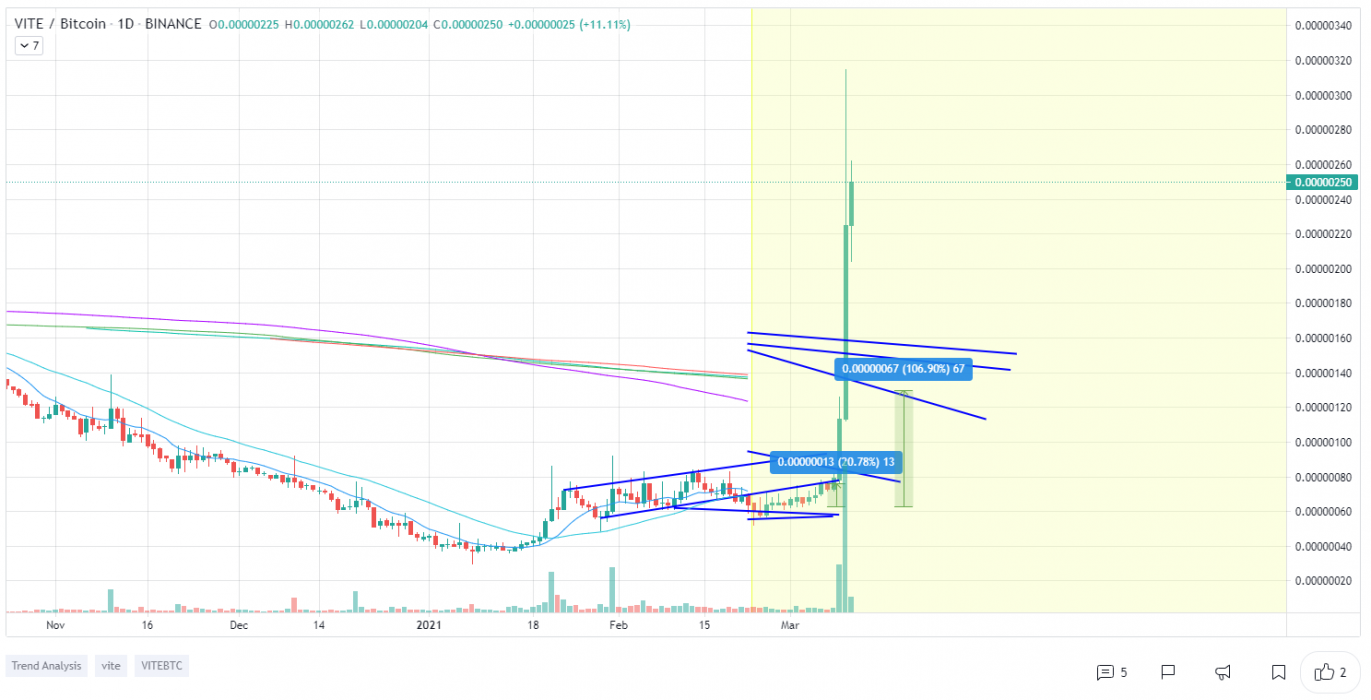
At the time of writing, VITE is ranked 395th cryptocurrency globally and the current price is $0.1867 AUD. This is a +123.96% increase since 4th March 2021 (7 days ago) as shown in the chart below.

Source: TradingView

After looking at the above candle chart, we can clearly see that VITE was trading inside the falling wedge pattern on the VITE/BTC pair. The first resistance was on the $0.1146 AUD price levels which VITE broke with a strong bullish trend buying volume and is now heading towards the all-time high price in AUD. Seeing that many altcoins are holding strong this week, VITE is likely to continue to increase in the uptrend if the traders keep buying with high volume.

“The Falling Wedge is a bullish pattern that begins wide at the top and contracts as prices move lower. This price action forms a cone that slopes down as the reaction highs and reaction lows converge.”

What do the Technical indicators say?

The Vite Coin TradingView indicators (on the 1 day) mainly indicate VITE as a buy, except the Oscillators which indicate VITE as a neutral.

So Why did VITE Breakout?

General market sentiment suggests we are in the middle of the bull run season which could have contributed to the recent breakout. Another reason for this sudden pump in price could be the whales secretly buying VITE for the next Altcoins rally & it could also be contributed to some of the recent news of the VITE Integration with Binance Smart Chain.

Recent VITE News & Events:

Where to Buy or Trade VITE?

Vite has the highest liquidity on Binance Exchange so that would help for trading VITE/BTC or VITE/USDT pairs. However, if you’re just looking at buying some quick and hodling then Swyftx Exchange is a popular choice in Australia.

Categories
Bitcoin Bitcoin Mining Market Analysis Mining

On-Chain Data Suggests Bitcoin Miners Have Finally Stopped Selling Bitcoin

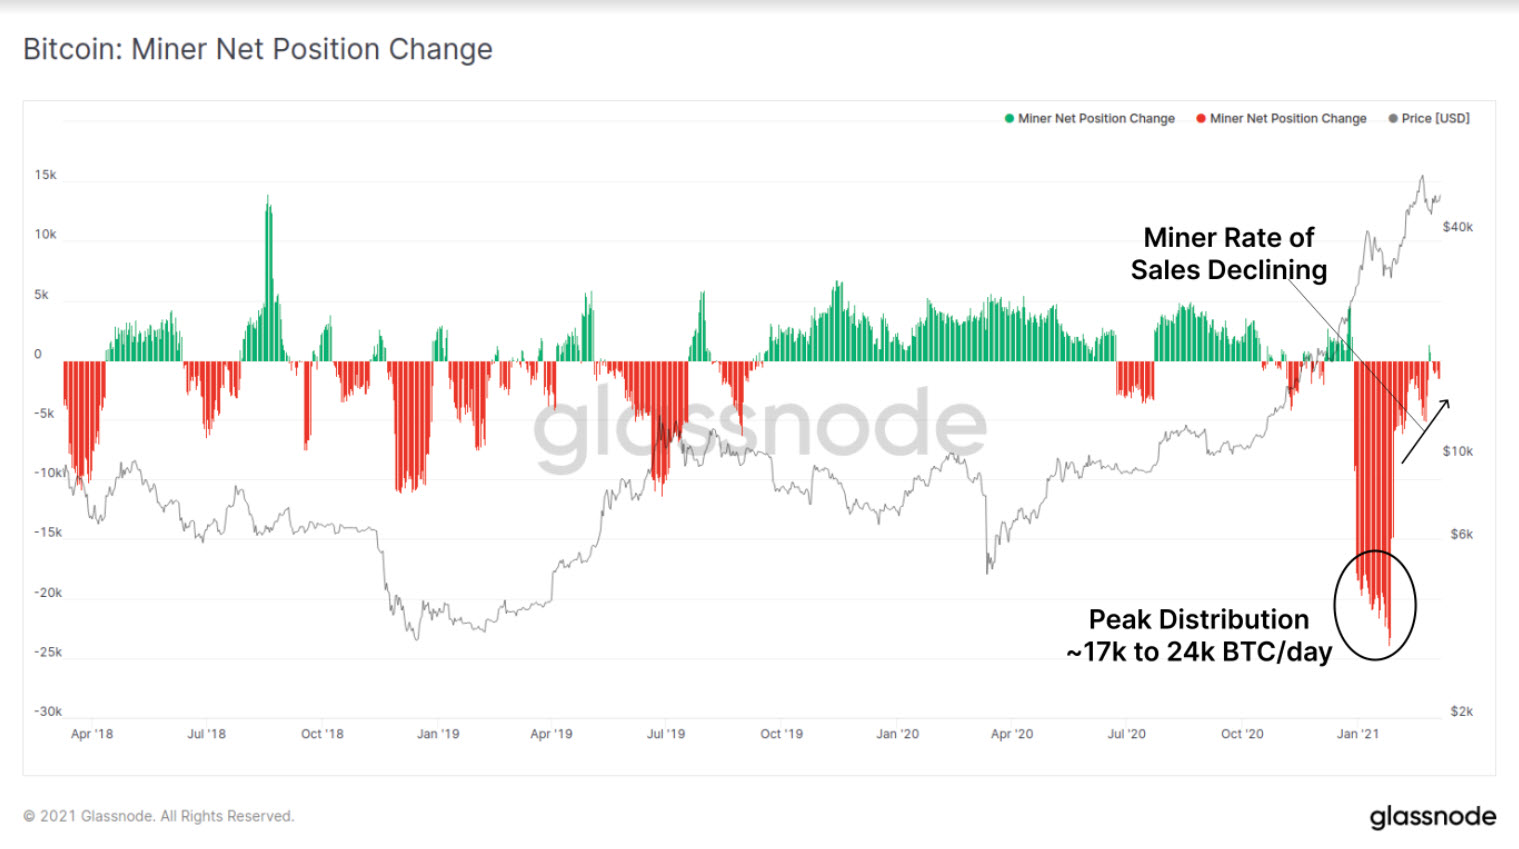
On-chain data suggests that Bitcoin miners have finally stopped selling their accumulated supplies of BTC. The recent dip in Bitcoin price was linked to miners selling their Bitcoin as China closes its mining operations.

The sell off may finally be over, as you can see from the graph below, the red indicates that the miners are now creating daily negative positions in terms of the BTC held in the miners blockchain addresses. And you can clearly see the rate of sales is declining.

Bitcoin Miner Net Position Change by Glassnode

The Miner Position Change metric factors in all balances for all newly minted coins and thus provides us with a big picture view on the full mining landscape.

Despite newly minted coins representing only a fraction of daily trade volume it appears that even miners are returning to neutral or accumulation mode.

The on-chain data suggests a relatively strong bull case for Bitcoin this week.

Categories
Cardano Crypto News Market Analysis Trading

3 Coins that Might Breakout this Week: ADA, DUSK, KAVA – Altcoins Trading Analysis

For today’s trading news, we’re looking at three Altcoins that might breakout this week by showing bullish trends in the charts.

1. Cardano (ADA)

Cardano is a proof-of-stake blockchain platform that says its goal is to allow “changemakers, innovators and visionaries” to bring about positive global change.

The open-source project also aims to “redistribute power from unaccountable structures to the margins to individuals” — helping to create a society that is more secure, transparent, and fair.

Cardano Price Analysis

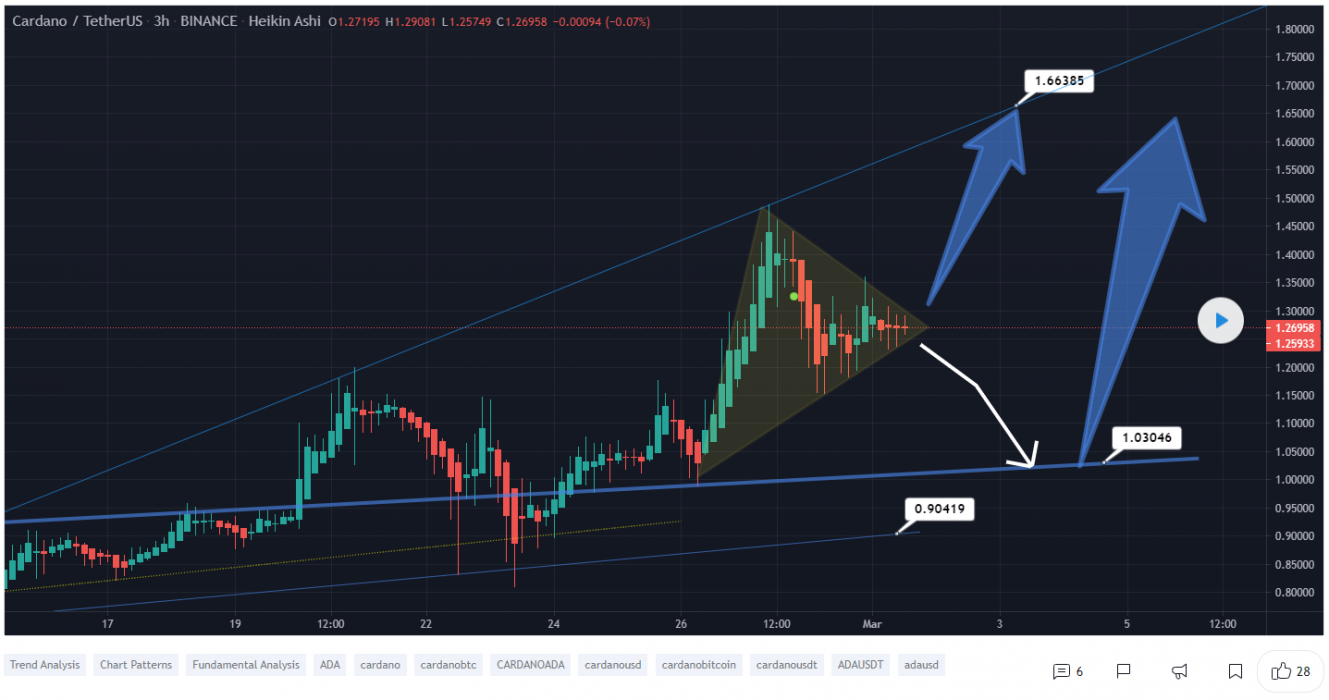
At the time of writing, ADA is ranked 3rd cryptocurrency globally and the current price is $1.60 AUD. Let’s take a look at the chart below for price analysis.

Source: TradingView

February provided respectable +348% gains for bulls who bought at the monthly open, with the price finding resistance near $1.58 AUD last Saturday.

If bulls take back control this week, the top of the former gap beginning at $1.36 AUD may provide support for at least a short-term bounce. The top of the consolidation range starting near $1.25 AUD is more likely to provide substantial support.

The most robust support is likely to be found in the overlapping consolidation ranges between $1.12 AUD and $0.95 AUD, with a sharp slice through these levels possibly suggesting the end of the bull run.

The region from approximately $1.46 AUD to the most recent swing high is likely to provide some resistance. The swing high provides a reasonable first target for a possible next leg up.

If this high breaks, the 1.0 extension near $2.28 AUD and the 2.0 extension near $2.86 AUD may provide the next primary targets.

2. Dusk Network (DUSK)

Dusk Network describes itself as a blockchain for programmable and confidential securities, powered by Zero-Knowledge proofs and novel Private PoS leader extraction-based consensus protocol. Dusk Network is a privacy blockchain for financial applications. It is a layer-1 blockchain that powers the Confidential Security Contract (XSC) standard and supports native confidential smart contracts.

Dusk Network aims to address the requirements and needs of financial markets. Central to its design is a scalable public infrastructure, direct settlement finality of transactions, and strict data privacy.

DUSK Price Analysis

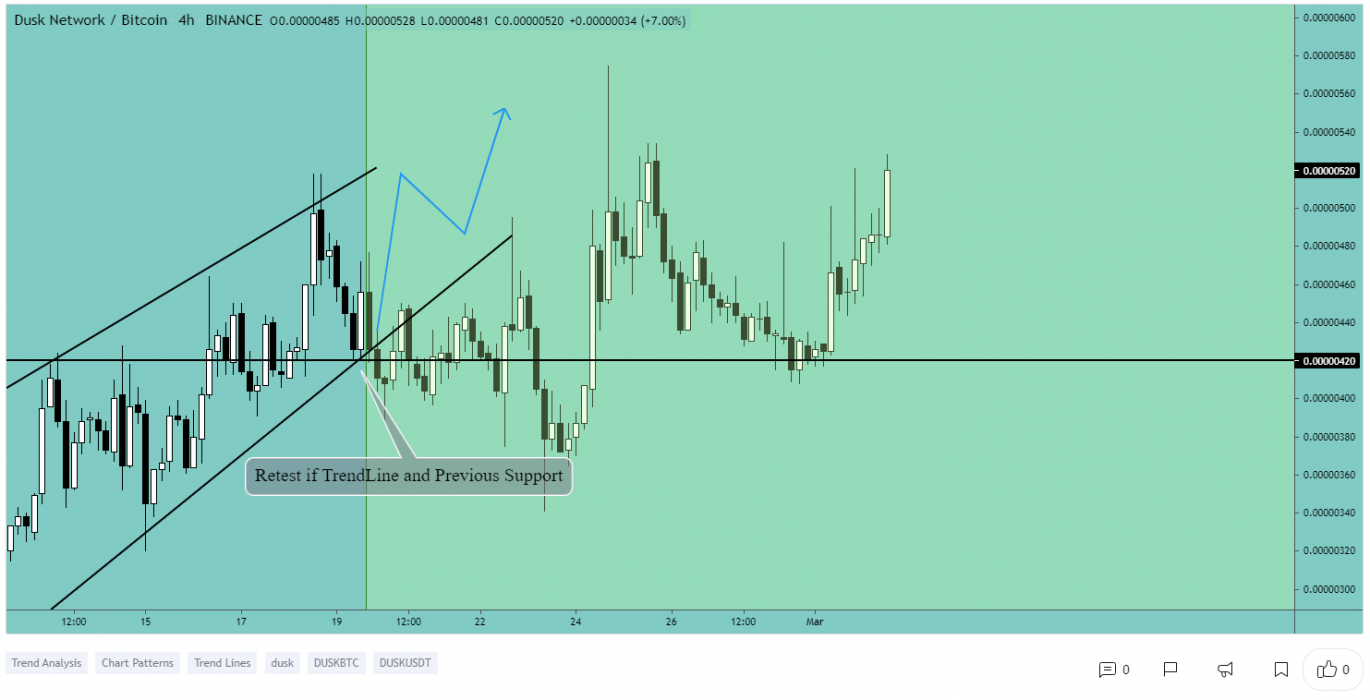
At the time of writing, DUSK is ranked 292nd cryptocurrency globally and the current price is $0.3312 AUD. Let’s take a look at the chart below for price analysis.

Source: TradingView

Last month’s bulls enjoyed +300% gains at DUSK’s peak before the price confirmed stiff resistance beginning at $0.2876 AUD.

The four-hour chart shows that support may be forming between $0.2263 AUD and $0.2498 AUD, near the monthly open.

Aggressive bulls could enter in this area, although safer entries may be found much further below near $0.1670 AUD and $0.1473 AUD after a sweep of the current consolidation’s swing lows.

The last swing high near $0.3288 AUD provides a likely first target if the price does bounce from this region. Beyond this swing high, the 1.0 extension near $0.5824 AUD and the 2.0 extension near $0.7957 AUD may provide the next major targets.

3. Kava.io (KAVA)

Kava is a cross-chain DeFi lending platform that allows users to borrow USDX stablecoins and deposit a variety of cryptocurrencies to begin earning a yield.

The Kava DeFi hub operates as a decentralized bank for digital assets, allowing users to access a range of decentralized financial services, including its native USD-pegged stablecoin USDX, as well as synthetics and derivatives. Through Kava, users are able to borrow USDX tokens by depositing collateral, effectively leveraging their exposure to crypto-assets.

KAVA Price Analysis

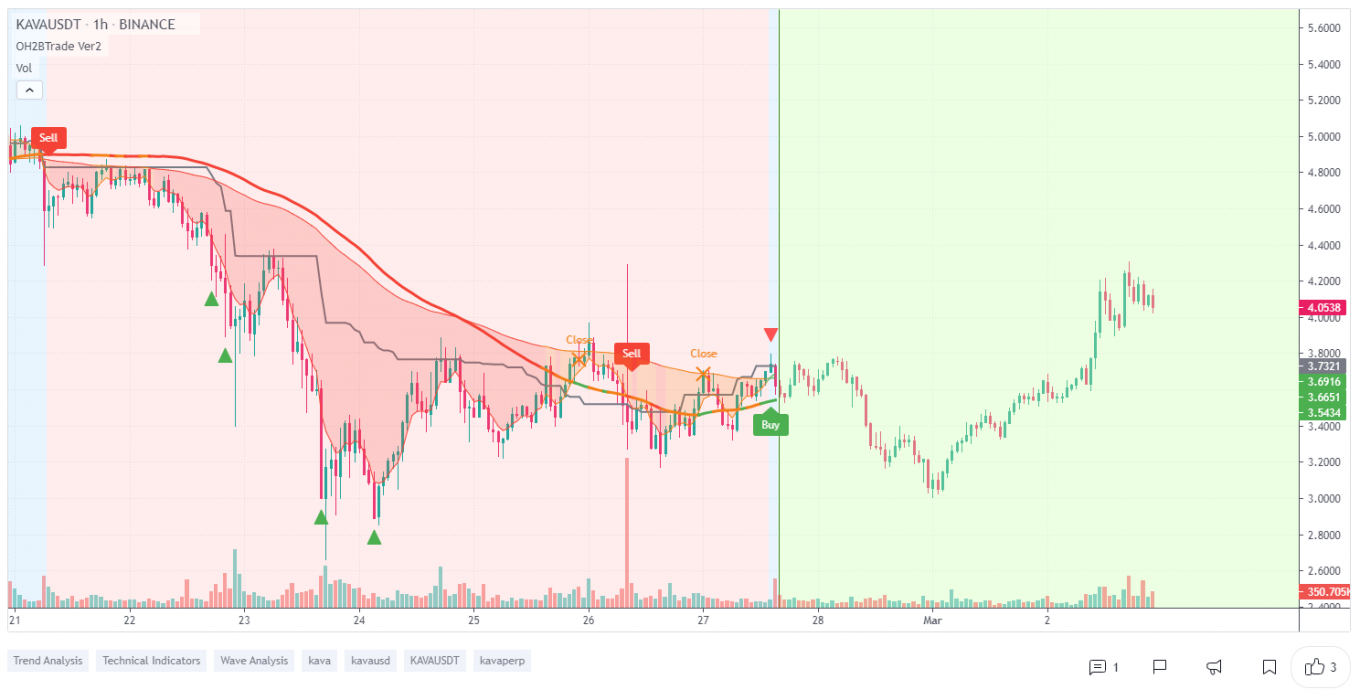
At the time of writing, KAVA is ranked 128th cryptocurrency globally and the current price is $5.26 AUD. Let’s take a look at the chart below for price analysis.

Source: TradingView

KAVA’s +161% February run retraced almost to its origin, narrowly missing probable support near $3.98 AUD before bears swatted down the bounce near resistance around $4.85 AUD.

With the daily gap between $3.66 AUD and $3.75 AUD below this level. However, the safer entry is still in probable support between $3.90 AUD and $3.83 AUD, which would also sweep the lows of last week’s bounce.

The relatively equal highs near $5.45 AUD provide a likely first target on lower timeframes. However, the resistance beginning at $5.33 AUD may initially suppress a further move up.

A clean breakthrough this resistance will need to contend with the next resistance near $5.40 AUD, under the last swing high. This swing high at $5.80 AUD gives a reasonable take-profit area before a possible move to the 1.0 extension near $8.55 AUD.

Where to Buy or Trade Altcoins?

These 3 Altcoins have the highest liquidity on Binance Exchange so that would help for trading on USDT or BTC pairs. However, if you’re just looking at buying some quick and hodling then Swyftx Exchange is a popular choice in Australia.

Categories
Bitcoin Crypto News Market Analysis

Data Shows People have Been Taking Profits on Bitcoin – NRPL/NUPL

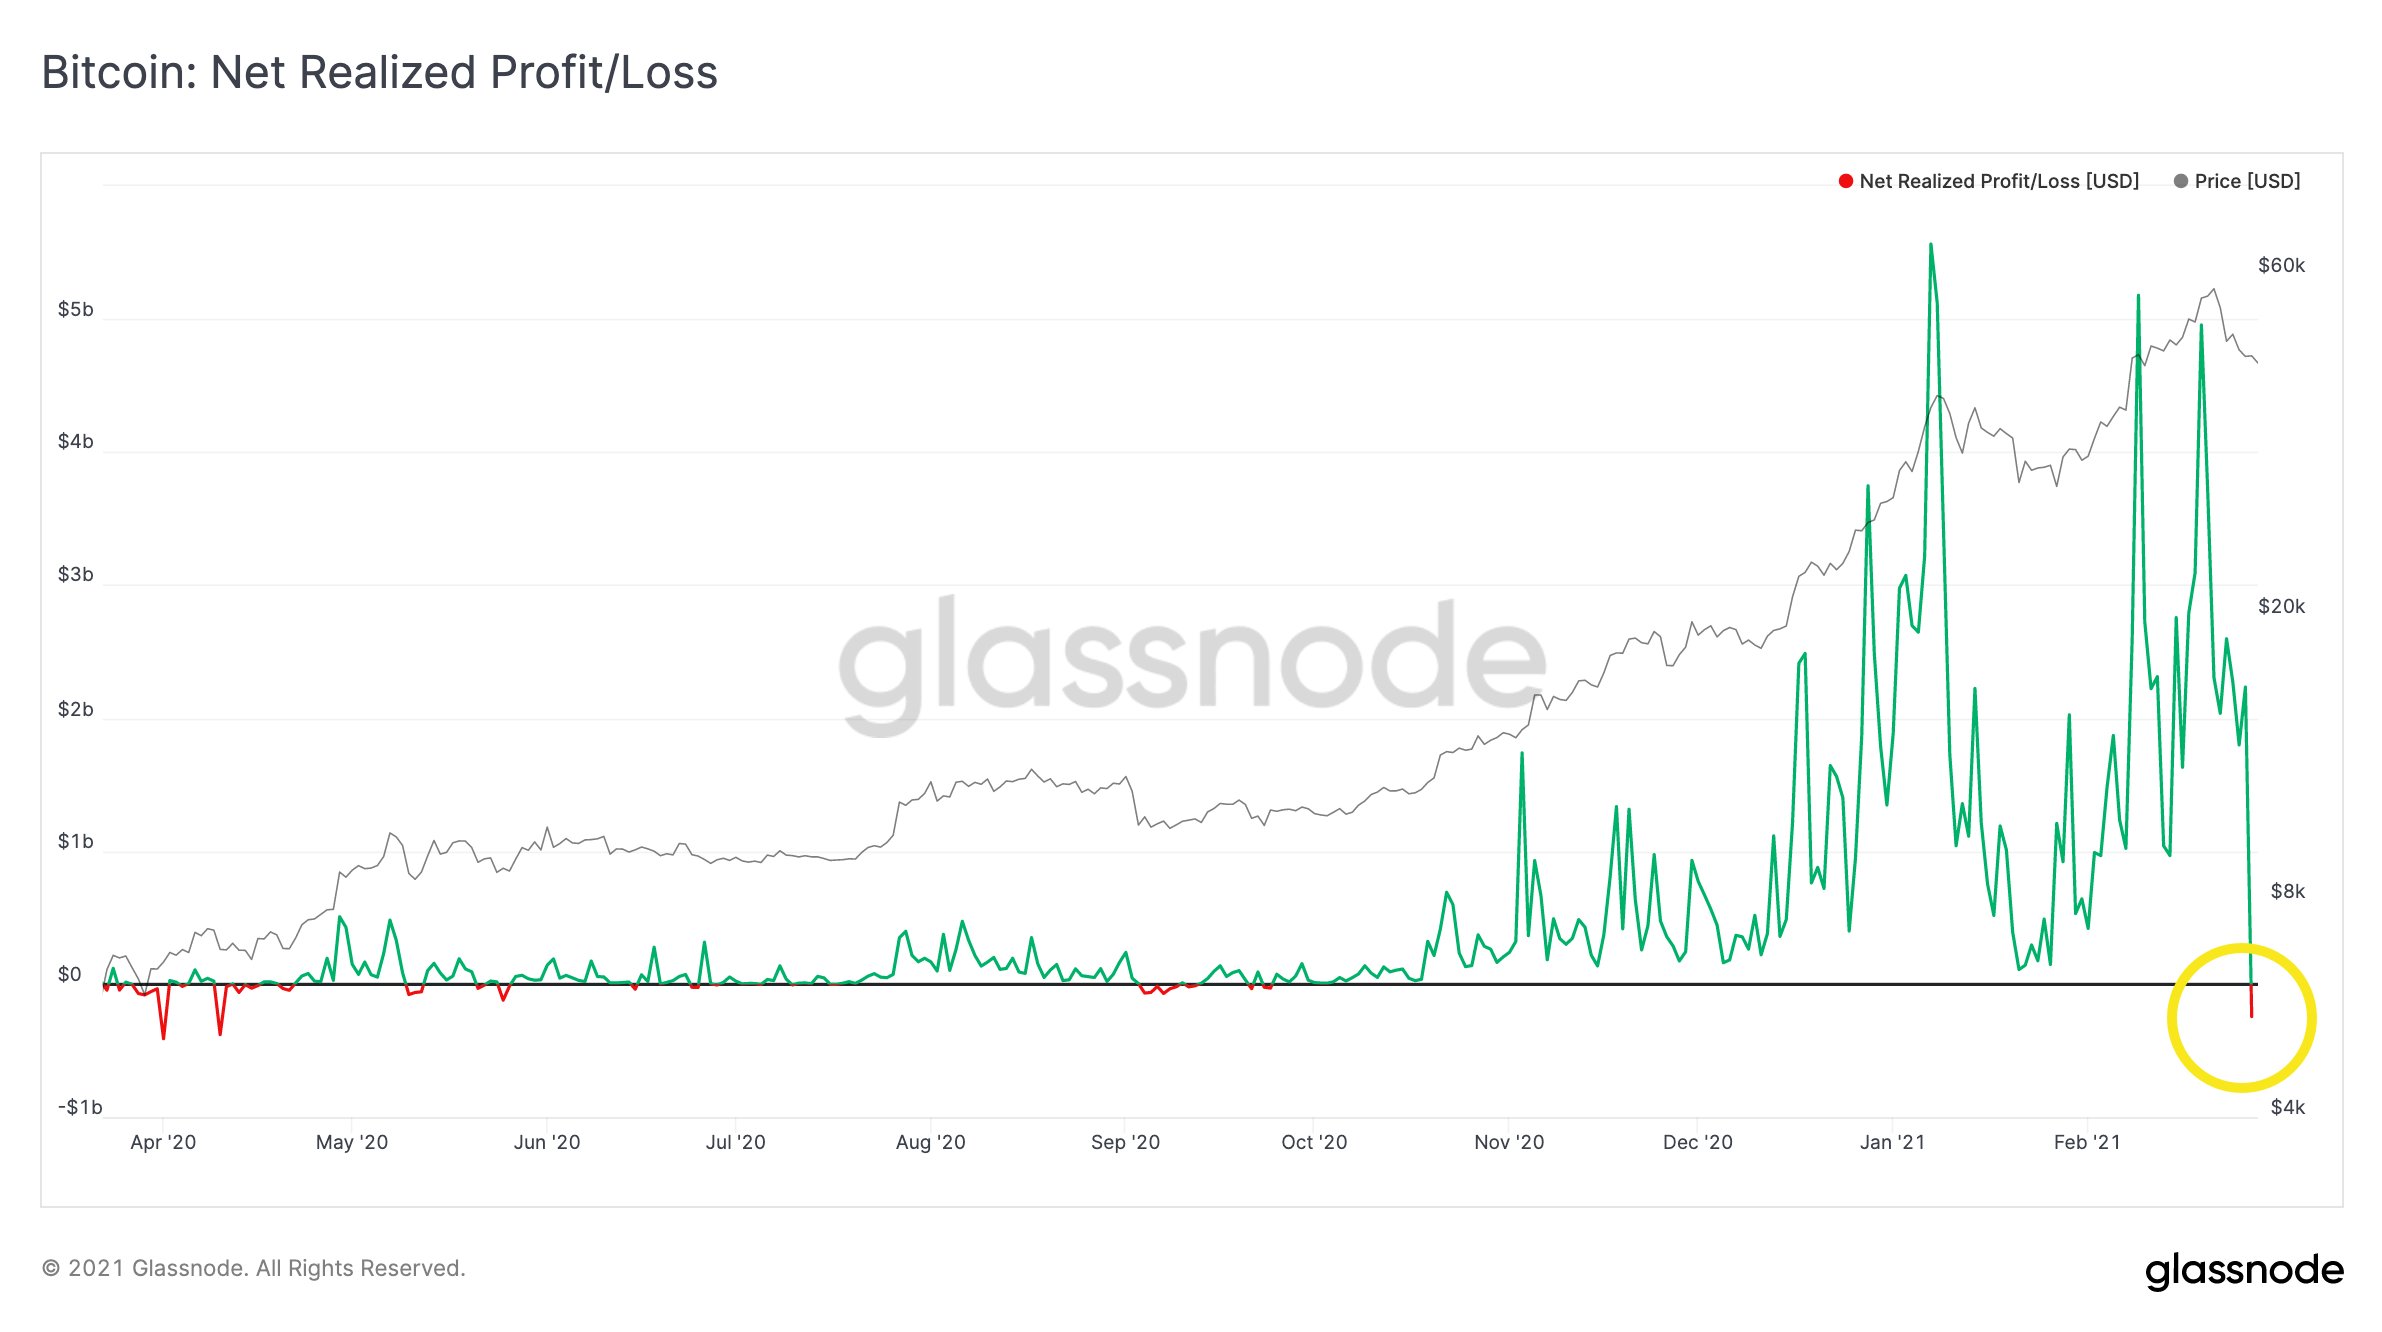
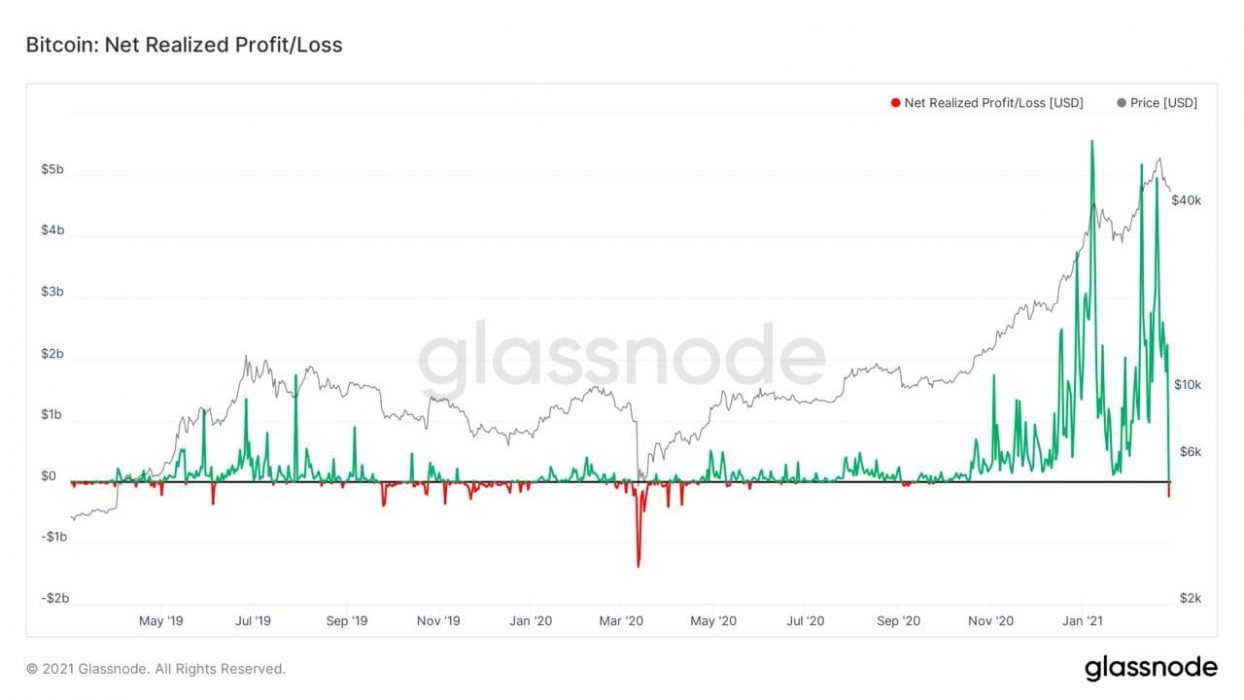
A data metric called NRPL (Net Realized Profit/Loss) shows that people have been taking profits – with the metric dropping negative for the first time since September 2020.

For example – if all the Bitcoin held were sold today, would the investors sell at a profit or a loss? Green indicates selling at a profit and red indicates selling at a loss.

Source

This recent dip into the red is linked to those investors that took profits recently and we can take a look at another metric called NUPL to determine the Net Unrealised Profits/Loss.

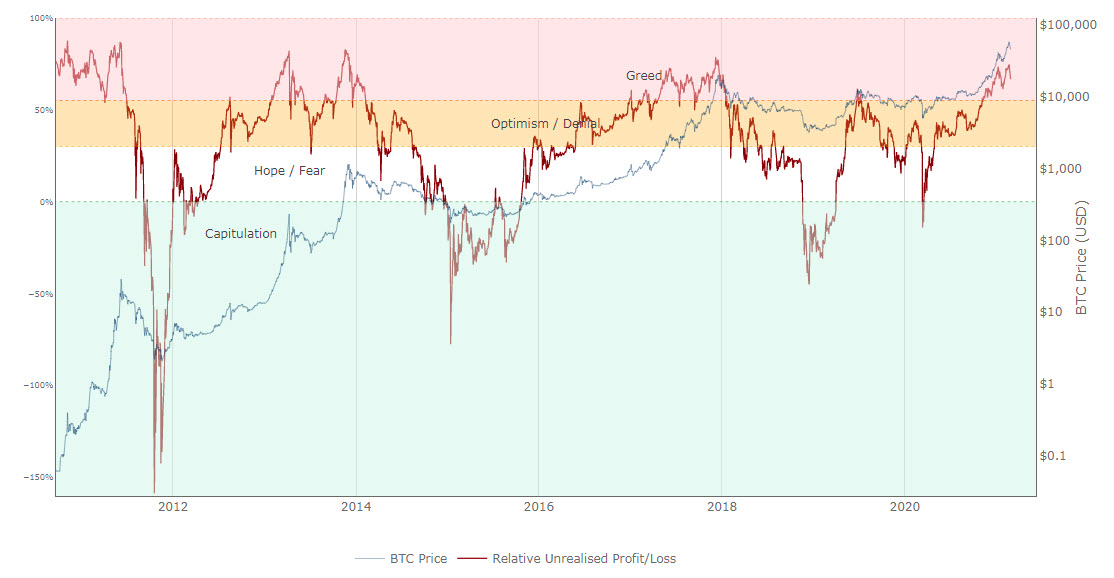
We can see by the chart below that the NUPL metric is entering the red section indicating that investors may be getting greedy. Whenever we have seen this metric hit past the “greed” levels into “euphoria” levels it has aligned with five market tops in bitcoin’s price history.

Source

Some traders are now seeing this as a bullish flag with the weak hands exiting Bitcoin where a new bottom price can be established. However there are arguments both ways with March being historically a bad month for Bitcoin, and Billions being invested still by Institutions.

By identifying which stage of the market cycle we are currently in, the NUPL indicator can help traders to set entries and identify exit points. For instance, a trader may want to go long on bitcoin when the NUPL indicator suggests that a move from the capitulation phase to the hope-fear phase is completed, and then to take profits once the market enters the belief-denial phase. 

The weakness of the NUPL indicator, as with all on-chain metrics, is that bitcoins transacted off-chain are not accounted for and therefore is an incomplete picture of profits and losses. Nevertheless, the NUPL indicator has been accurate since 2010 in identifying market tops, and to a lesser extent, bottoms.

Categories
Bitcoin Market Analysis

Bitcoin Lending Grows to $24 Billion in Q4 2020

A recent report by Arcane Research shows that the crypto lending market is growing. And although it’s only around $20-30 Billion at the moment, experts are suggesting it could grow into the Trillions.

A growing lending market could be very bullish for bitcoin. Crypto-backed fiat loans allow users to employ their bitcoin to serve their everyday fiat-needs, without requiring the hodlers to sell and realize profits.

Put simply, the loans involves offering your Bitcoin to a company who in return loans you “dollars” (could be in the form of stablecoin such as USDC, USDT which you can sell for dollars). And then you pay interest on the loan (for example 36% per year interest paid in crypto). If the value of Bitcoin drops you may be asked to put more in to keep it above a specific loan to crypto collateral ratio. If you want your Bitcoin back you simply can pay the loan off.

Why Use BTC as Collateral for Loans?

There could be many reasons why you might not want to sell your crypto and get a loan instead, these include:

  • Tax deferment
  • The need for fiat
  • Leverage up and buy more crypto
  • Arbitrage
  • Market-making
  • Miners covering costs
  • Simply not wanting to sell your BTC
  • Loans without counter party risk and credit risk

Bitcoin can be transferred around the world, instantly, at almost no cost, any time of the day, and any day of the year, and with full finality. No other assets can match these properties today, making bitcoin the perfect collateral asset for the future.

Options to Get a Bitcoin Backed Loan in Australia

We’re doing some research into the best options for Australia at the moment, so stay tuned as we’ll publish this soon.

In the meantime checkout Binance Crypto Loans and BlockFi Crypto Loans.

Categories
Crypto News Market Analysis Trading

Fantom FTM Coin pumps +73% in a Single Day amid Collaboration with YFI Yearn Finance

Fantom FTM is trading in an uptrend here like many other altcoins. The Cryptocurrency FTM just went up +73% in a single day by breaking a Falling wedge pattern with strong buying volume and surges over +272% in a week.

What is Fantom?

Fantom is a directed acyclic graph DAG smart contract platform providing decentralized finance DeFi services to developers using its own bespoke consensus algorithm.

Together with its in-house token FTM, Fantom aims to solve problems associated with smart-contract platforms, specifically transaction speed, which developers say they have reduced to under two seconds.

FTM Quick Stats

SYMBOL:FTM
Global rank:44
Market cap:$2,450,093,091 AUD
Current price:$1.02 AUD
All time high price:$1.12 AUD
1 day:+73.38%
7 day:+272.96%
1 year:+11172.81%

FTM Price Analysis

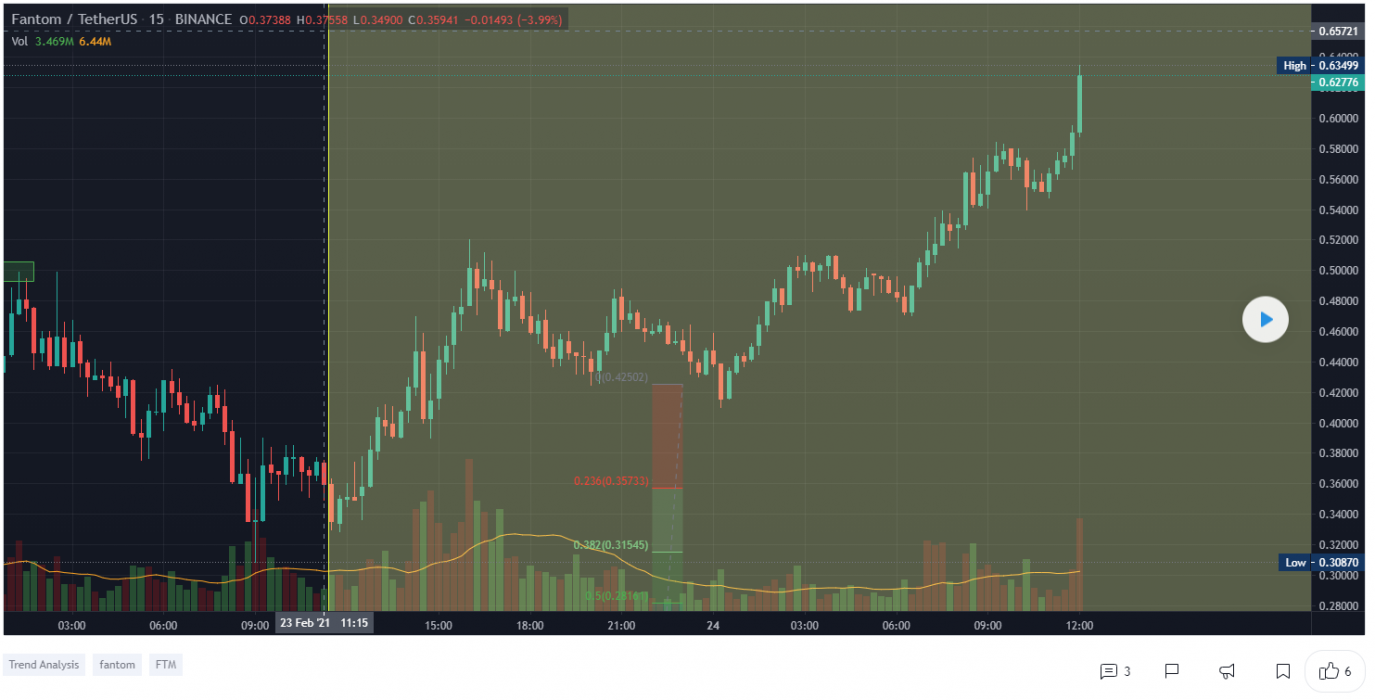
At the time of writing, FTM is ranked 44th cryptocurrency globally and the current price is $1.02 AUD. This is a +272.96% increase since 19th February 2021 (7 days ago) as shown in the chart below.

Source: TradingView

After looking at the above candle chart, we can clearly see that FTM was trading inside the falling wedge pattern on the FTM/USD pair. The first resistance was on the $0.5672 AUD price levels which FTM broke with a strong bullish trend buying volume and is now heading towards the all-time high price in AUD. Seeing that many altcoins are crashing this week, FTM is likely to continue to increase in the uptrend.

“The Falling Wedge is a bullish pattern that begins wide at the top and contracts as prices move lower. This price action forms a cone that slopes down as the reaction highs and reaction lows converge.”

What do the Technical indicators say?

The Fantom FTM TradingView indicators (on the 1 day) mainly indicate FTM as a buy, except the Oscillators which indicate FTM as a sell

So Why did FTM Breakout?

General market sentiment suggests we are in the middle of the bull run season which could have contributed to the recent breakout. Another reason for this sudden pump in price could be the whales secretly buying FTM for the next Altcoins rally & it could also be contributed to some of the recent news of the following 3 reasons why FTM price continues to surge high:

  • Yearn. Finance helps facilitate a cross-chain bridge to Ethereum
  • On-chain governance boosts community involvement
  • Fantom plans to integrate staking and DeFi features

Recent FTM News & Events:

Where to Buy or Trade FTM?

Fantom has the highest liquidity on Binance Exchange so that would help for trading FTM/BTC or FTM/USDT pairs. However, if you’re just looking at buying some quick and hodling then Swyftx Exchange is a popular choice in Australia.
Categories
Bitcoin Market Analysis

Trends Show Bitcoin is Mostly Bearish in March – 80% Chance

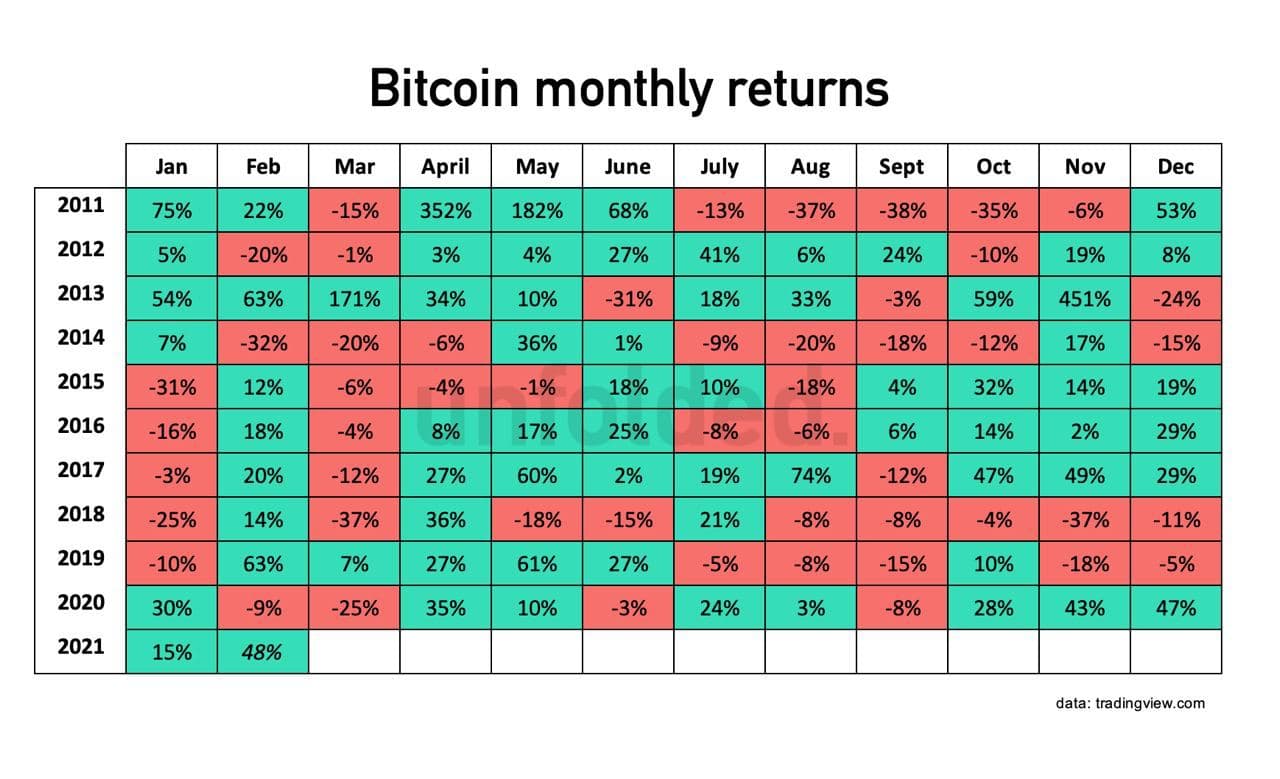
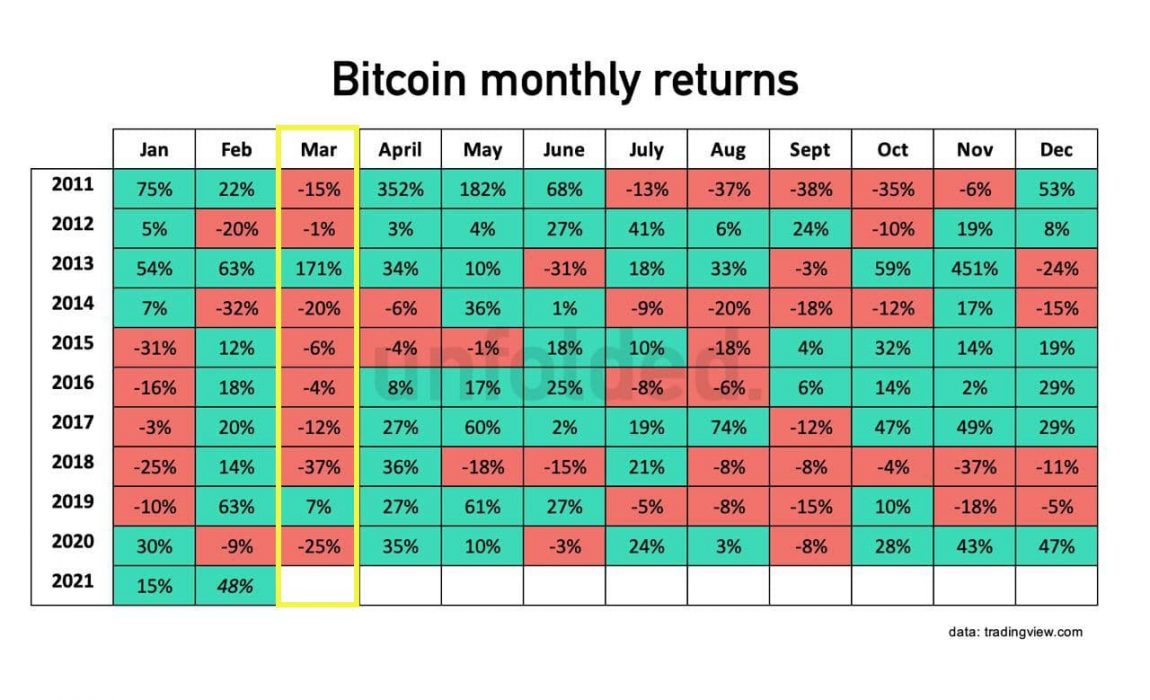
Historically, the statistics show that Bitcoin monthly returns in March are mostly negative. To date, this is one the most consistent seasonal patterns shown in Bitcoin in terms of price return.

Although statistically there is an 80% chance Bitcoin will be negative returns for March this year, the sentiment going around is that March will still be bullish. Traders are saying that there is a bullish triangle breakout, exchanges are saying the demand is high, individuals are saying “buy the dip”, and institutions continue to buy BTC in the 1000’s.

Bitcoin Yearly Returns

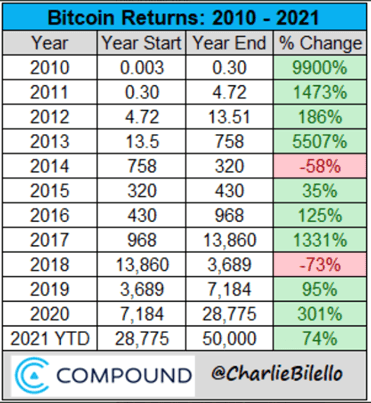
If you take a look at the yearly returns, they have slowed down from the 1000%+ gains of the early Bitcoin years. This is mainly due to the marketcap growing as it was easier to double from $1 to $2 then $10,000 to $20,000 and so on.

Over the decade, bitcoin has delivered a 370% compound annual growth rate (that’s the rate of return assuming you reinvest your profits at the end of each year).

Will this March show negative returns? tune in next month where we see if the trend continues!