Categories
Crypto News Kadena Market Analysis Swipe Trading WAX

Top 3 Coins to Watch Today: KDA, SXP, WAX – August 2 Trading Analysis

Let’s take a closer look at today’s altcoins showing breakout signals. We’ll explain what the coin is, then dive into the trading charts and provide some analysis to help you decide.

1. Kadena (KDA)

Kadena KDA is a proof-of-work blockchain that combines the PoW consensus mechanism from Bitcoin with directed acyclic graph (DAG) principles to offer a scalable version of Bitcoin. Kadena claims it can provide the security of Bitcoin while being able to offer unparalleled throughput that makes the blockchain usable to enterprises and entrepreneurs alike. Kadena’s unique infrastructure is decentralised and built for mass adoption because of its multi-chain approach. 

KDA Price Analysis

At the time of writing, KDA is ranked the 102nd cryptocurrency globally and the current price is US$1.96. Let’s take a look at the chart below for price analysis:

Source: TradingView

KDA climbed 65% from its mid-June low, creating a bullish market structure break on the daily chart.

Aggressive bulls might find the closest support near the August open, around $2.01. This level will likely show inefficient trading on the daily chart after Monday’s candle closes.

If this level breaks, the next support might be near $1.73. This level is near the 61.8% retracement. It’s also near the 9, 18 and 40 EMAs and the high of accumulation on the weekly chart.

A dip lower could reach $1.54, where bulls rejected bears on the weekly. However, a move this low could go significantly lower. Bulls’ stops near $1.34 and a large area of inefficient trading on the weekly offer little support to stop a more significant drop.

The closest resistance is from $2.20 to $2.30, near the June monthly open. This area showed inefficient trading on the weekly chart. The price has passed through this zone multiple times, but it could provide some resistance again.

If the market’s rally does continue, $2.47 might offer the next resistance. This level shows inefficient trading on the daily chart. It’s also at the low end of inefficient trading on the weekly and monthly charts. If the price does bounce from $1.73, the 68% and 100% extensions of the prior swing add more confluence to this area.

2. Swipe (SXP)

Swipe SXP is a platform that looks to form a bridge between the fiat and cryptocurrency worlds with its API that is designed to create global payment cards powered by its native SXP token. Swipe also has an on-chain product called Swipe Swap, an Automated Market Maker which is forked by Uniswap, SushiSwap and THORchain, and is powered by Swipechain. This ecosystem is powered by the Swipe Token SXP, which functions as the fuel for the Swipe Network, and is used for paying transaction fees and securing Swipechain through bonding and governance.

SXP Price Analysis

At the time of writing, SXP is ranked the 136th cryptocurrency globally and the current price is US$0.4405. Let’s take a look at the chart below for price analysis:

Source: TradingView

SXP has consolidated in a tight range since its 51% drop in early June. Near $0.4080, an area of inefficient trading might offer support. This level is near the 9, 18 and 40 EMAS.

It’s reasonable for the price to drop slightly lower to the next area of inefficient trading, near $0.3876. Moving to this level would allow bulls to enter near the July open.

An area of inefficient trading, near $0.5293, may offer the closest resistance. This level is near the June open and could be the target as SXP shares its metaverse vision.

A move this high could reach slightly higher, near $0.5668. Bears rejected bulls on the weekly here in early June. It’s also near an old December 2020 weekly swing low.

If the market continues climbing, it could reach as high as $0.6550. This area shows inefficient trading on the monthly and weekly charts. 

If the bullish move fails, bears might aim for an area near $0.2705. This level is near the midpoint of March 2020’s swing low wick. On the weekly, it shows that bulls rejected bears. Reaching this level would allow bears to sweep bulls’ stops under relatively equal lows into inefficient trading on the daily chart.

3. Wax (WAXP)

WAXP is a purpose-built blockchain, released in 2017, designed to make e-commerce transactions faster, simpler and safer for every party involved. The WAX blockchain uses delegated proof-of-stake (DPoS) as its consensus mechanism. It is fully compatible with EOS. The custom features and the incentive mechanisms developed by WAX are intended to optimise the blockchain’s utility specifically for use in e-commerce, with the goal of encouraging voting on proposals.

WAX Price Analysis

At the time of writing, WAX is ranked the 130th cryptocurrency globally and the current price is US$0.1153. Let’s take a look at the chart below for price analysis:

Source: TradingView

WAX dropped 54% in early June before entering a consolidation range. The price has just swept bulls’ stops above relative equal highs into an area of inefficient trading near $0.1145. This zone, up to $0.1223, could provide resistance.

If this level breaks, the price could climb to $0.1622. This move would let bulls run bears’ stops above June 2’s swing high. It would also fill in inefficient trading on the weekly and monthly charts. 

However, macroeconomic conditions are still bearish. As of now, the economic climate makes it less probable that the price can reach this far.

Below, a relatively wide area from $0.1037 to $0.0955 could provide support. This area saw accumulation before the recent move up, shows inefficient trading on the daily, and overlaps with the 61.8% and 78.6% extensions.

Bulls rejected bears on the weekly chart, near $0.0842. This level may provide support if bears run bulls’ stops under July’s swing lows.

A more bearish turn in the market could propel the price significantly lower. The next downside target may be near $0.0560. Here, the weekly chart and monthly chart both show inefficient trading.

Learn How to Trade Live!

Join Dave and The Crypto Den Crew and they’ll show you live on a webinar how to take your crypto trading to the next level.

Where to Buy or Trade Altcoins?

These coins have high liquidity on Binance Exchange, so that could help with trading on AUD/USDT/BTC pairs. And if you’re looking at buying and HODLing cryptos, then Swyftx Exchange is an easy-to-use popular choice in Australia.

Categories
BitTorrent Crypto News IOST Market Analysis Swipe Trading

Top 3 Coins to Watch Today: BTT, IOST, SXP – February 22 Trading Analysis

Let’s take a closer look at today’s altcoins showing breakout signals. We’ll explain what the coin is, then dive into the trading charts and provide some analysis to help you decide.

1. BitTorrent (BTT)

BitTorrent BTT is a popular peer-to-peer (P2P) file-sharing and torrent platform which has become increasingly decentralised in recent years. Since its acquisition, BitTorrent has added various new tools, with a dedicated native cryptocurrency token, BTT, released in February 2019. BTT was launched on TRON’s own blockchain, using its TRC-10 standard. According to its official literature, BitTorrent is currently the world’s “largest decentralised P2P communications protocol”.

BTT Price Analysis

At the time of writing, BTT is ranked the 50th cryptocurrency globally and the current price is US$0.00000201. Let’s take a look at the chart below for price analysis:

Source: TradingView

BTT has been in a higher-timeframe downtrend since its 4,790% pump during Q1 2021. From late June 2021, the price has ranged between approximately $0.000004598 and $0.000002677.

Old swing lows near the current price recently broke. This approximate area, near the higher-timeframe range low, could offer support again on higher-timeframes. 

However, the current macro market conditions suggest further downside. Multiple retests of a level – in this case, the fourth retest – and traders “selling the news” of February 22’s Mainnet launch increase the probability of this region turning to resistance. 

The daily chart suggests that a zone around the February open, from $0.0000020300 to $0.0000021078, may offer resistance – although the price might reach as high as $0.0000021799.

A break of this resistance could run short stops into higher-timeframe resistance around $0.000002557 – near the 2022 yearly open. If the price does reach this far, volatile price action in this area hints at resistance between $0.000002557 and $0.000003382. 

Short-term rallies may occur, but the price is more likely to find a long-term bottom in an inefficient area above 2020’s accumulation range. This area reaches from $0.000001042 to $0.0000005337, with $0.0000009500 starting higher-probability support.

2. Iost (IOST)

IOST‘s blockchain infrastructure is open-source and designed to be secure and scalable, all in the hope that it will serve as the backbone for online services in the future. One of the biggest challenges that IOST aims to resolve centres on how big companies may not be able to embrace blockchains in a customer-facing environment unless they are scalable. The Internet of Services Token is put forward as a way of tackling this problem.

IOST Price Analysis

At the time of writing, IOST is ranked the 134th cryptocurrency globally and the current price is US$0.02334. Let’s take a look at the chart below for price analysis:

Source: TradingView

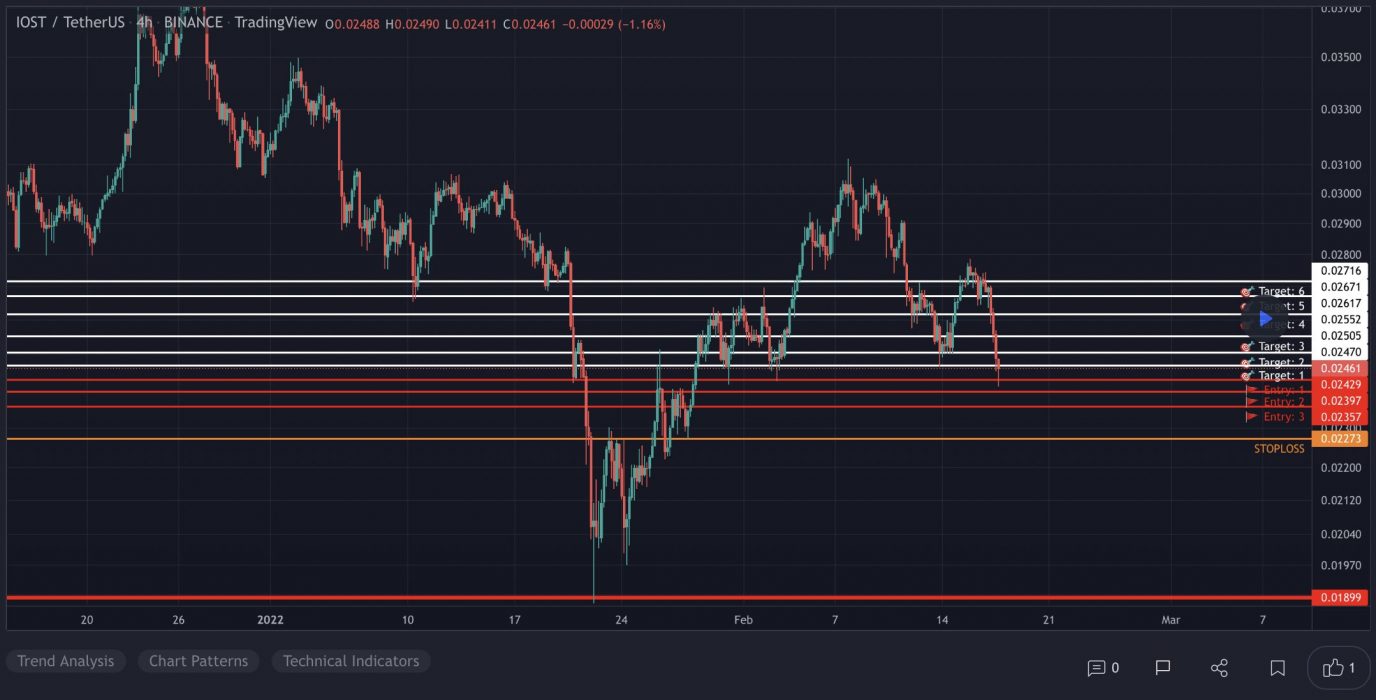
IOST rallied 436% during Q3 2021 and almost set new all-time highs before selling off 78% into its January 2022 low.

A retest of the 2022 yearly open, near $0.03125, started a new wave of selling in early February. The subsequent break of the February monthly open created a new area of resistance between $0.02459 and $0.02643 – an area that is also inefficiently traded and has confluence with the 9 and 18 EMAs.

If this resistance breaks, a move toward the 2021 yearly open might find resistance between $0.02874 and $0.03200. Any potential move through this resistance will likely find a ceiling near an inefficient higher-timeframe level at $0.03499.

Old support near $0.01889 created a sharp bullish reaction in late January. This region, down to $0.01774, could provide support again. 

However, a longer-term bottom is more likely to be found between $0.01427 and $0.00696, perhaps after Q1’s releases finalise, where higher-timeframe charts show an inefficiently traded area.

3. Swipe (SXP)

Swipe SXP is a platform that looks to form a bridge between the fiat and cryptocurrency worlds with its API that is designed to create global payment cards powered by its native SXP token. Swipe also has an on-chain product called Swipe Swap, an Automated Market Maker which is forked by Uniswap, SushiSwap and THORchain, and is powered by Swipechain. This ecosystem is powered by the Swipe Token SXP, which functions as the fuel for the Swipe Network, and is used for paying transaction fees and securing Swipechain through bonding and governance.

SXP Price Analysis

At the time of writing, SXP is ranked the 178th cryptocurrency globally and the current price is US$1.28. Let’s take a look at the chart below for price analysis:

Source: TradingView

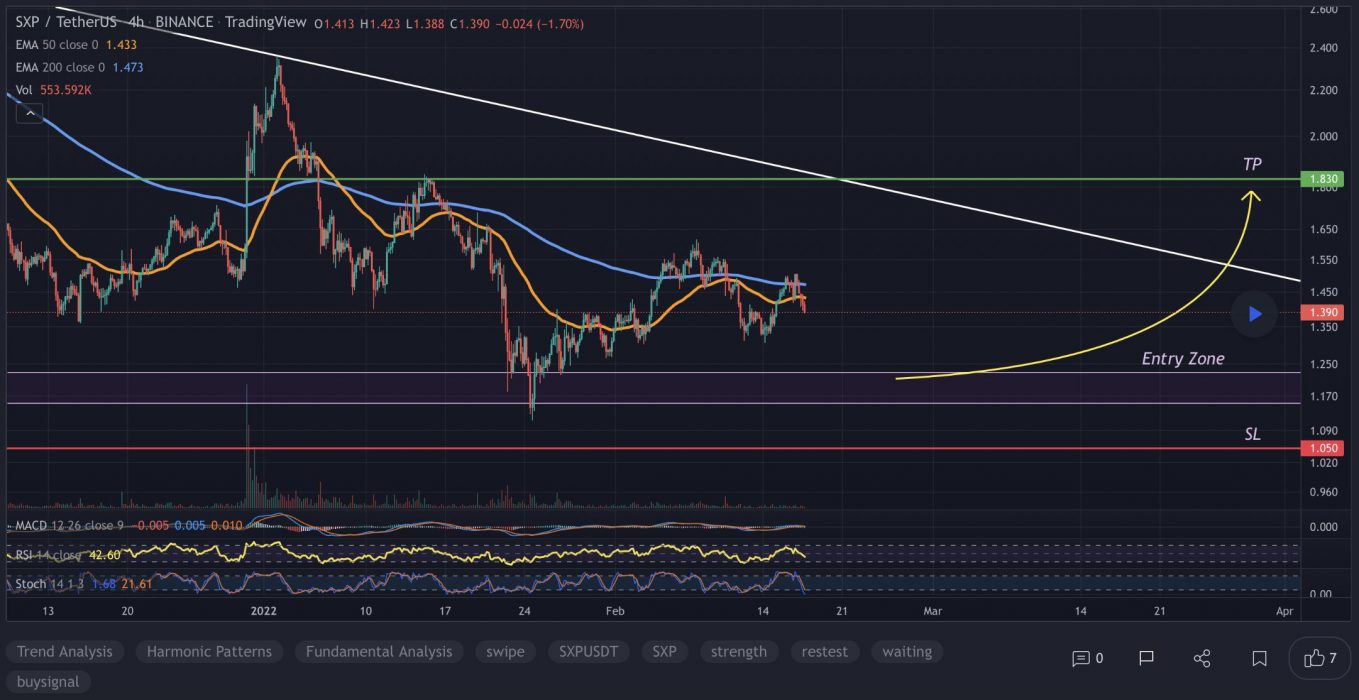
SXP retraced 81% from its May 2021 all-time high and is entering an area of possible higher-timeframe support.

Multiple resistance areas on the daily chart converge between $1.303 and $1.418, with the February monthly open and the 9 and 18 EMAs marking the middle of this zone. 

However, an inefficient area on higher timeframes that could offer support starts nearby at $1.244, although $1.203 and below may be a more sensitive area. This proximity of resistance and support might trigger consolidation in the short term.

This higher-timeframe possible support covers a wide area and could fill down to $0.742, where January 2021’s bullrun began. Bears may be taking profits in this area. Meanwhile, bulls might wait for signs of genuine demand (not just mild rallies from short-covering) to begin more significant accumulation.

A break of the current resistance might reach overlapping old consolidation ranges between $1.532 and $1.641. If this potential resistance breaks, the 2022 yearly open near $2.025 might mark the next possible resistance level. A move to this level could signify the start of a more extensive accumulation range or trend reversal.

Learn How to Trade Live!

Join Dave and The Crypto Den Crew and they’ll show you live on a webinar how to take your crypto trading to the next level.

Where to Buy or Trade Altcoins?

These coins have high liquidity on Binance Exchange, so that could help with trading on AUD/USDT/BTC pairs. And if you’re looking at buying and HODLing cryptos, then Swyftx Exchange is an easy-to-use popular choice in Australia.