Categories
Crypto News Ethereum Classic ICP Market Analysis Trading

Top 3 Coins To Watch Today: ETC, MATIC, ICP – October 14 Trading Analysis

Let’s take a closer look at today’s altcoins showing breakout signals. We’ll explain what the coin is, then dive into the trading charts and provide some analysis to help you decide.

1. Ethereum Classic (ETC)

Ethereum Classic ETC is a hard fork of Ethereum that launched in July 2016. Its main function is as a smart contract network, with the ability to host and support decentralised applications (DApps). Its native token is ETC. Since its launch, Ethereum Classic has sought to differentiate itself from Ethereum, with the two networks’ technical roadmaps diverging further and further from each other with time. Ethereum Classic first set out to preserve the integrity of the existing Ethereum blockchain after a major hacking event led to the theft of 3.6 million ETH.

ETC Price Analysis

At the time of writing, ETC is ranked the 29th cryptocurrency globally and the current price is A$70.88. Let’s take a look at the chart below for price analysis:

Source: TradingView

During August, ETC broke several swing highs that could be the signal for a new bullish trend.

Last week’s break of the most recent swing low could suggest some downside in the short term. It formed probable resistance near A$78.46 and may target the swing low and possible support near A$68.22.

The swing low and possible support near A$66.82 could be the second bearish target if the move down continues. The relatively equal lows near A$65.30 and possible support underneath near A$63.54 could provide more substantial support.

The last swing high near A$80.44 gives a near-term target if bullish continuation continues. However, resistance beginning around A$82.69 could cap this move. A break of this resistance might continue to probable resistance near A$86.27 and reach above the cluster of relatively equal highs near A$92.15.

2. Polygon (MATIC)

Polygon MATIC is the first well-structured, easy-to-use platform for Ethereum scaling and infrastructure development. Its core component is Polygon SDK, a modular, flexible framework that supports building multiple types of applications. The MATIC token will continue to exist and will play an increasingly important role, securing the system and enabling governance.

MATIC Price Analysis

At the time of writing, MATIC is ranked the 22nd cryptocurrency globally and the current price is A$1.64. Let’s take a look at the chart below for price analysis:

Source: TradingView

August marked a turning point for MATIC, with the price rocketing up almost 85% from its lows to probable resistance beginning near A$2.35.

The price is currently struggling with the area between A$1.75 and A$1.41. This region could provide support after a close above – or resistance after a close below. 

A retracement could reach into the daily gap and possible support around A$1.60. A more bearish shift in the marketplace will likely aim for the relatively equal lows near A$1.55, and the potential support just below that begins around A$1.49.

Continuation to the upside will likely target the monthly high near A$1.77. However, probable resistance beginning at A$1.84 and A$1.90 could cap or slow down this move.

3. Internet Computer (ICP)

The Internet Computer ICP is the world’s first blockchain that runs at web speed with unbounded capacity. It also represents the third major blockchain innovation, alongside Bitcoin and Ethereum – a blockchain computer that scales smart contract computation and data, runs them at web speed, processes and stores data efficiently, and provides powerful software frameworks to developers. By making this possible, the Internet Computer enables the complete reimagination of software, providing a revolutionary new way to build tokenised internet services, pan-industry platforms, decentralised financial systems, and even traditional enterprise systems and websites.

ICP Price Analysis

At the time of writing, ICP is ranked the 27th cryptocurrency globally and the current price is A$56.97. Let’s take a look at the chart below for price analysis:

Source: TradingView

In mid-August, ICP also turned the corner, breaking a key swing high in early September. This move could suggest a longer-term bullish trend.

The swing high near A$74.24 stands out as a bullish target and marks an area of probable resistance. Further continuation could reach into possible resistance starting near A$80.35.

Even if the bullish trend continues, a stop run at the recent swing low near A$54.30 into possible support beginning near A$50.87 is reasonable. If the price reaches further down, the swing low and possible support near A$48.27 might provide another downside target. 

The area near A$46.75 could also provide support. However, a drop this far could suggest a stop run below the higher-timeframe relatively equal lows near A$42.18 into possible support beginning around A$40.73.

Where to Buy or Trade Altcoins?

These coins have high liquidity on Binance Exchange, so that could help with trading on AUD/USDT/BTC pairs. And if you’re looking at buying and HODLing cryptos, then Swyftx Exchange is an easy-to-use popular choice in Australia.

Categories
Crypto News Market Analysis Trading

ARPA Surges +80% in a Single Day amid Meeting with Randcast ARPA Roadmap Update

ARPA is trading in an uptrend, like many other Altcoins. The cryptocurrency ARPA just went up +80% in a single day by breaking a rising wedge pattern with strong buying volume on multiple exchanges and surges over +130% in a week.

What is ARPA Chain?

ARPA is a blockchain-based layer 2 solution for privacy-preserving computation, enabled by Multi-Party Computation (“MPC”). The goal of ARPA is to separate data utility from ownership and enable data renting. ARPA’s MPC protocol creates ways for multiple entities to collaboratively analyze data and extract data synergies while keeping each party’s data input private and secure. Developers can build privacy-preserving dApps on blockchains compatible with ARPA. Some immediate use cases include credit anti-fraud, secure data wallet, precision marketing, joint AI model training, and key management systems.

ARPA Price Analysis

At the time of writing, ARPA is ranked the 290th cryptocurrency globally and the current price is A$0.2086. Let’s take a look at the chart below for price analysis:

Source: TradingView

After looking at the above 1-Day candle chart, we can clearly see that ARPA was trading inside the rising wedge pattern on the ARPA/USDT pair. The first resistance was on the A$0.1366 price level, which ARPA broke with a strong bullish trend buying volume and is now heading towards the recent high price at A$0.2175. Seeing that many Altcoins are holding a strong position this week after the recent bitcoin price recovery, ARPA may continue to increase in the uptrend if traders keep buying with high volume.

“The Rising Wedge is a bearish pattern that begins wide at the bottom and contracts as prices move higher and the trading range narrows. As a reversal pattern, the rising wedge will slope up and with the prevailing trend.”

What Do the Technical Indicators Say?

The ARPA TradingView indicators (on the 1 day) mainly indicate ARPA as a Strong Buy, except the Oscillators which indicate ARPA as a Buy.

So Why Did ARPA Breakout?

General market sentiment seems to suggest cryptos are hopefully turning back bull run season after recent price corrections. Another reason for this sudden pump in price could be whales secretly buying ARPA for the coming Altcoins rally. Recent news was also announced regarding the ARPA Roadmap Update.

Where to Buy or Trade ARPA?

ARPA has the highest liquidity on Binance Exchange so that would help for trading ARPA/BTC or ARPA/USDT pairs. And if you’re looking at buying and HODLing cryptos, then Swyftx Exchange is an easy-to-use popular choice in Australia.

Categories
Crypto News Market Analysis Trading

Top 3 Coins To Watch Today: CAKE, FTM, COTI – October 13 Trading Analysis

Let’s take a closer look at today’s altcoins showing breakout signals. We’ll explain what the coin is, then dive into the trading charts and provide some analysis to help you decide.

1. PancakeSwap (CAKE)

PancakeSwap CAKE is an automated market maker (AMM) – a decentralised finance (DeFi) application that allows users to exchange tokens, providing liquidity via farming and earning fees in return. PancakeSwap uses an automated market maker model where users trade against a liquidity pool. These pools are filled by users who deposit their funds into the pool and receive liquidity provider (LP) tokens in return. PancakeSwap allows users to trade BEP20 tokens, provide liquidity to the exchange and earn fees, stake LP tokens to earn CAKE, stake CAKE to earn more CAKE, and stake CAKE to earn tokens of other projects.

CAKE Price Analysis

At the time of writing, CAKE is ranked the 40th cryptocurrency globally and the current price is A$26.06. Let’s take a look at the chart below for price analysis:

Source: TradingView

CAKE‘s 71% decline during May created relatively equal lows near A$23.56 before bouncing over the local range’s midpoint near A$34.60. A bullish altcoin market could help CAKE bulls regain a stronger bullish trend.

Aggressive bulls could look for entries in the daily gap starting near A$23.77. The monthly open aligns with more probable support near A$22.84. 

A stop run below the monthly open near A$20.62 might provide a more favourable entry. A more substantial bearish move – perhaps from a sharp drop in Bitcoin’s price – could challenge support near A$18.30, just above the equal lows.

Resistance rests just above, with the zone from A$27.59 to A$31.26 likely to provide a short-term ceiling. A break through this level might target resistance just under the cluster of relatively equal highs near A$33.47. 

Beyond these highs, resistance near A$38.15 provides a final challenge before attacking an old daily swing high near A$40.86.

2. Fantom (FTM)

Fantom FTM is a directed acyclic graph (DAG) smart contract platform providing decentralised finance (DeFi) services to developers using its own bespoke consensus algorithm. Together with its in-house token FTM, Fantom aims to solve problems associated with smart-contract platforms, specifically transaction speed, which developers say they have reduced to under two seconds.

FTM Price Analysis

At the time of writing, FTM is ranked the 35th cryptocurrency globally and the current price is A$2.82. Let’s take a look at the chart below for price analysis:

Source: TradingView

FTM continues to set new all-time highs in its chaotic upwards trend.

Support might be found in the daily gap above the October monthly open near A$2.15. A deeper retracement is likely to target the relatively equal lows into support near A$1.88. 

The daily gap near A$2.67 could also provide support. However, another gap inside the down candles, around A$2.54, provides the highest chances of solid support while offering a high risk-reward entry.

There is currently no resistance overhead since the price is in discovery. Extensions hint at the areas around A$2.97 and A$3.24 as reasonable take-profit zones.

3. Coti (COTI)

COTI markets itself as the first enterprise-grade fintech platform that empowers organisations to build their own payment solutions as well as digitise any currency to save time as well as money. COTI is one of the world’s first blockchain protocols that is optimised for decentralised payments and designed for use by merchants, governments, payment DApps, and stablecoin issuers. The ecosystem has a DAG-based blockchain, proof-of-trust consensus algorithm, multiDAG, GTS (Global Trust System), a universal payment solution, and a payment gateway.

COTI Price Analysis

At the time of writing, COTI is ranked the 140th cryptocurrency globally and the current price is A$0.6788. Let’s take a look at the chart below for price analysis:

Source: TradingView

COTI holders endured a wild September as the price rallied over 117% before running the month’s lows. This stop run could set the stage for another rally. However, the recent volatility means bulls should be extra cautious with stop placement. 

Bulls might find support around the current price near $0.6122. The next high probability support rests near A$0.5634, below the last two swing lows. A move this deep could sweep monthly lows into an area near A$0.5276.

The price is currently struggling with resistance near A$0.6933 at the monthly open. A strong move into this resistance is likely to target the swing high near A$0.7326. 

Above this swing high, a monthly high at A$0.8472 is the next likely target, which also marks another wide resistance zone. Volatility inside this resistance could tag a new all-time high at $1.00.

Where to Buy or Trade Altcoins?

These coins have high liquidity on Binance Exchange, so that could help with trading on AUD/USDT/BTC pairs. And if you’re looking at buying and HODLing cryptos, then Swyftx Exchange is an easy-to-use popular choice in Australia.

Categories
Crypto News Market Analysis Trading

Top 3 Coins To Watch Today: IOTX, PUNDIX, WOO – October 12 Trading Analysis

Let’s take a closer look at today’s altcoins showing breakout signals. We’ll explain what the coin is, then dive into the trading charts and provide some analysis to help you decide.

1. IoTeX (IOTX)

IoTeX IOTX has built a decentralised platform whose aim is to empower the open economics for machines – an open ecosystem where people and machines can interact with guaranteed trust, free will, and under properly designed economic incentives. IoTeX is the decentralised backbone for machine economics which serves machines ranging from smart home devices to autonomous vehicles.

To this end, IoTeX has built and launched a fast, high-performance, and EVM-compatible blockchain that provides flexibility and scalability for various applications. Also, middlewares and Dapps are built on top of the blockchain to bring self-sovereign devices and real-world oracles into reality.

IOTX Price Analysis

At the time of writing, IOTX is ranked the 115th cryptocurrency globally and the current price is A$0.09626. Let’s take a look at the chart below for price analysis:

Source: TradingView

Early August’s stunning 600% rally retraced 68%, but IOTX may be setting up for its next bull cycle.

Late September’s consolidation around A$0.07655 broke out to the upside with an explosive move and retrace. This move supports the idea that the consolidation might have marked the bottom. This area could provide support again on a retest – perhaps after traders “sell the news” of Monday’s hardfork while waiting for the next event.

Closer to the current price, zones near A$0.08534 and A$0.09121 might also see interest from bulls during any sharp retracements – perhaps caused by any sudden moves in Bitcoin. These areas also have confluence with the 9, 18 and 40 EMAs, which flipped bullish last week.

If Bitcoin finds its top and performs its classic sudden drop, a relatively broad zone between A$0.06132 and A$0.05382 could support the price or mark a future accumulation zone. This area is near the 78.6% retracement level of the northern summer’s upward move.

The price is currently battling resistance near A$0.1025, where long wicks show that sellers are still unloading their supply. If this level breaks, the next probable resistance begins near A$0.1300, just above the current range high. A reclaim of this level might target potential resistance near A$0.1580, then continue to much higher prices.

2. Pundi X (PUNDIX)

PundiX is a leading developer of blockchain-powered devices with the aim of transforming retail businesses with its blockchain-based point of sale solution. The solution allows retail merchants and consumers to conduct instantaneous in-store transactions on its blockchain. The goal of the Pundi X project is to make cryptocurrency available to everyone. While other similar projects attempt to outperform the banking system, Pundi X looks to simplify transforming retail businesses to make this happen.

PUNDIX Price Analysis

At the time of writing, PUNDIX is ranked the 225th cryptocurrency globally and the current price is A$2.25. Let’s take a look at the chart below for price analysis:

Source: TradingView

From mid-June to today, PUNDIX (formerly NPXS) has been consolidating in a wide range between A$3.05 and A$0.78 after its deep Q2 2021 retracement.

The 9, 18 and 40 EMAs are likely to flip bullish this week, which could grab the attention of bulls who can push it up from this range. These EMAs could provide at least short-term support near A$2.23. 

However, bulls with deep pockets may be waiting for a return further into the current range after the excitement from Wednesday’s chain launch wears off. Two areas where they might bid are near the October open, around A$1.88, and close to the range lows, near A$1.31.

Older pre-redenomination NPXS charts show significant upside potential. Still, bulls will likely be scaling out portions of their positions in logical areas to take profits. A zone between A$3.23 and A$2.98, near old lows, could provide some resistance. The upper half of this area, beginning near A$3.40, could be the most decisive level. 

If the price reclaims this resistance, old consolidations near A$4.49 and A$5.16 may provide some resistance. These zones could cause a top to form, leading to re-accumulation before the next leg up.

3. WOO Network (WOO)

WOO Network is a deep liquidity network connecting traders, exchanges, institutions and DeFi platforms with democratised access to the best-in-class liquidity and trading execution at lower or zero cost. WOO Token is used in the network’s CeFi and DeFi products for staking and fee discounts. Presently, a diverse set of products and services interfacing retail, institutions, CeFi and DeFi have been built: WOO X is a zero-fee trading platform providing professional and institutional traders with the best-in-class liquidity and execution. It features fully customisable modules for workspace customisation.

WOO Price Analysis

At the time of writing, WOO is ranked the 129th cryptocurrency globally and the current price is A$1.31. Let’s take a look at the chart below for price analysis:

Source: TradingView

Mid-May’s drop marked the start of a five-month trading range, with WOO recently climbing into the upper half of this range.

Resistance, beginning near A$1.47, continues to hold the price down. However, the consolidation and the 9 EMA around A$1.29, just above October’s monthly open, could provide some short-term support.

Bulls are more likely to wait and see if the price drops following Friday’s airdrop, then might buy support from A$0.9722 to A$0.8869. This zone has confluence with the 61.8% retracement.

If bulls instead break resistance from A$1.47 to A$1.56, the wicks near the range highs from A$1.70 to A$1.80 could be the next target.

Longer-term, a strong reclaim of these zones and measured moves could point at A$2.09 and A$2.37 as the following levels where bulls might take profits.

Where to Buy or Trade Altcoins?

These coins have high liquidity on Binance Exchange, so that could help with trading on AUD/USDT/BTC pairs. And if you’re looking at buying and HODLing cryptos, then Swyftx Exchange is an easy-to-use popular choice in Australia. You can buy WOO coin from different exchanges listed on coinmarketcap.

Categories
Crypto News EOS Litecoin Market Analysis Ripple Trading

Top 3 Coins To Watch Today: XRP, LTC, EOS – October 11 Trading Analysis

Let’s take a closer look at today’s altcoins showing breakout signals. We’ll explain what the coin is, then dive into the trading charts and provide some analysis to help you decide.

1. Ripple (XRP)

Ripple XRP is the currency that runs on a digital payment platform called RippleNet, which is on top of a distributed ledger database called XRP Ledger. While RippleNet is run by a company called Ripple, the XRP Ledger is open-source and is not based on blockchain, but rather the previously mentioned distributed ledger database.

XRP Price Analysis

At the time of writing, XRP is ranked the 6th cryptocurrency globally and the current price is A$1.59. Let’s take a look at the chart below for price analysis:

Source: TradingView

After retracing nearly 68% from its highs, XRP has wicked into the monthly gap beginning near A$1.32. This wick formed the bottom of the current range.

The price shows no apparent signs of a longer-term reversal, which may mean that the closest resistance near A$1.85 will continue to suppress the price. However, some support could be found near the monthly open, possibly giving bulls footing for a stop run through the swing high at A$1.66. 

This move could continue into resistance near A$1.71 and spike through the relatively equal highs near A$1.77. A break of the next swing high near A$1.83 is likely to find resistance once it reaches A$1.90. If this move occurs, it may suggest a longer-term reversal.

A retest of possible support near A$1.46 could provide an entry for a short-term trade. However, there is a higher probability for more substantial support near A$1.40 after a run on the lows at A$1.37 and A$1.30.

2. Litecoin (LTC)

Litecoin LTC is a cryptocurrency that was designed to provide fast, secure and low-cost payments by leveraging the unique properties of blockchain technology. The cryptocurrency was created based on the Bitcoin protocol, but it differs in terms of the hashing algorithm used, hard cap, block transaction times and a few other factors. Litecoin has a block time of just 2.5 minutes and extremely low transaction fees, making it suitable for micro-transactions and point-of-sale payments.

LTC Price Analysis

At the time of writing, LTC is ranked the 15th cryptocurrency globally and the current price is A$243.57. Let’s take a look at the chart below for price analysis:

Source: TradingView

LTC has dropped nearly 75% from its highs, with the current low’s wick on July 21 taking stops below two major swing lows.

The resulting bounce found resistance near A$310.08, which could continue to cap upward movement. If the price finds support in the current region near A$236.17, it could continue to resistance just above the relatively equal highs near A$257.83. A more substantial move might run stops above the swing high near A$265.10 into resistance near A$270.92.

A break below the monthly open is likely to target buy stops near A$230.46, an area that could provide some support. A move below this level could target below the swing low at A$214.88, possibly reaching the gap beginning near A$203.55.

3. Eos (EOS)

EOS is a platform that’s designed to allow developers to build decentralised apps. The project’s goal is relatively simple: to make it as straightforward as possible for programmers to embrace blockchain technology and ensure that the network is easier to use than rivals. As a result, tools and a range of educational resources are provided to support developers who want to build functional apps quickly. EOS also aims to improve the experience for users and businesses. While the project tries to deliver greater security and less friction for consumers, it also vies to unlock flexibility and compliance for enterprises.

EOS Price Analysis

At the time of writing, EOS is ranked the 40th cryptocurrency globally and the current price is A$6.49. Let’s take a look at the chart below for price analysis:

Source: TradingView

EOS‘s nearly 83% drop from its May highs found a low near A$4.65 in July before closing over a short-term high around A$8.35 last month.

This daily close over the high could signal a shift in market structure that might reach probable resistance near A$7.36. A sustained bullish move may target the swing high at A$7.84. If this stop run occurs, a run beyond the high into probable resistance near A$8.15 and A$8.49 is possible.

Bulls could buy a retracement to possible support near A$5.82, just above the monthly open. A bearish turn in the marketplace may propel the price toward possible support near A$5.48. 

However, relatively equal lows near A$5.30 and A$5.12 provide an attractive target for bears if the market resumes its bearish trend. A run on these lows might find support between A$4.95 and A$4.85.

Where to Buy or Trade Altcoins?

These coins have high liquidity on Binance Exchange, so that could help with trading on AUD/USDT/BTC pairs. And if you’re looking at buying and HODLing cryptos, then Swyftx Exchange is an easy-to-use popular choice in Australia.

Categories
Bitcoin Crypto News Trading

Bitcoin Supply Squeeze Results in 5-Month High, Back to a $1 Trillion Asset

After bitcoin languished behind the alts for what might have felt like an eternity, the winds appear to have shifted favourably towards the king of crypto as it soared past US$55,000, reaching a five-month high and reclaiming its status as a US$1 trillion asset.

Supply Squeeze At All-Time High

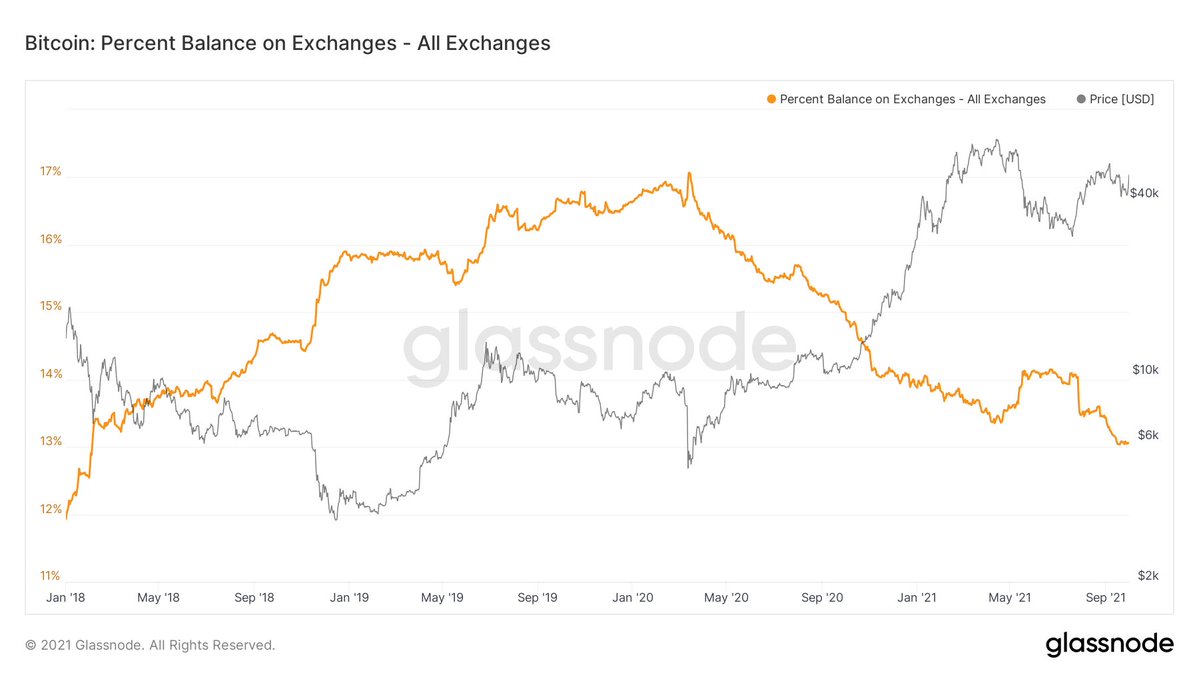
Based on Glassnode data, the current bitcoin balance on exchanges is at its lowest level since January 2018.

Bitcoin percent on exchanges. Source: Glassnode

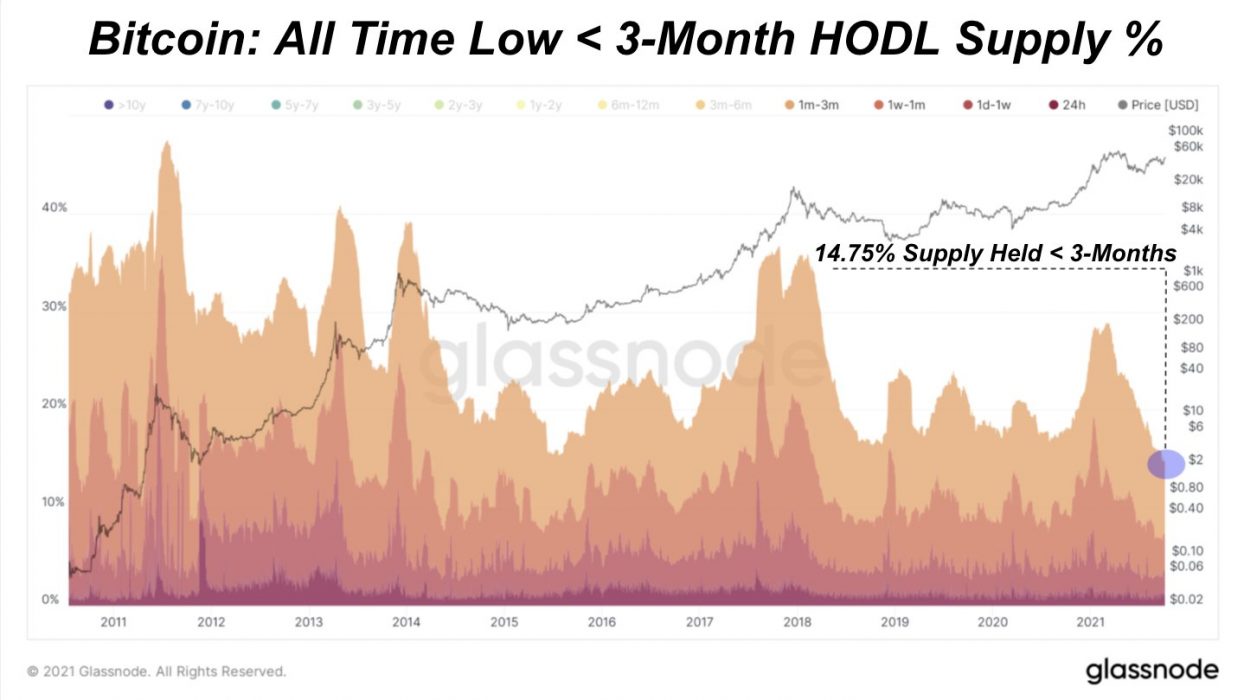
In addition, the three-month HODL supply is at an all-time high. Over 85.25 percent of coins have not moved in three months. This is typically a bullish signal as strong hands continue to accumulate on the expectation of further gains.

Three-month supply. Source: Glassnode

Who is Driving the Supply Squeeze?

According to South Korea-based blockchain data firm CryptoQuant, whales purchased US$1.6 billion worth of bitcoin on the spot market:

Crypto analytics firm Santiment noted that October 6 was the single largest day of bitcoin accumulation by whales in over two years:

The firm highlighted the positive momentum in the market, commenting:

#Bitcoin dominance has been on a major rise the past couple days, and $54.6k has been breached for the first time since May 12. Our NVT Token Circulation model is indicating October is the first month we’re seeing a bullish divergence since February.

Santiment

As the “digital gold thesis” continues to gain momentum, signals are in that Q4 may be bitcoin’s best performing quarter in 2021.

There are a few indicators suggesting that a range of new participants are likely to enter the fray in this last quarter. As Raoul Pal noted on Anthony Pompliano’s The Best Business Show:

So who is the next big buyer of bitcoin? Well, it’s pretty clear to me. It is the ongoing institutions … and secondly it is the coming ETF … I have a very strong feeling it comes over the next October, November, December period. And finally, we’re starting to see some noise from the sovereign wealth funds…

Raoul Pal, The Best Business Show podcast

With the whales goggling up supply, what are the plebs left to do? Bitcoiners would tell you to simply stack sats.

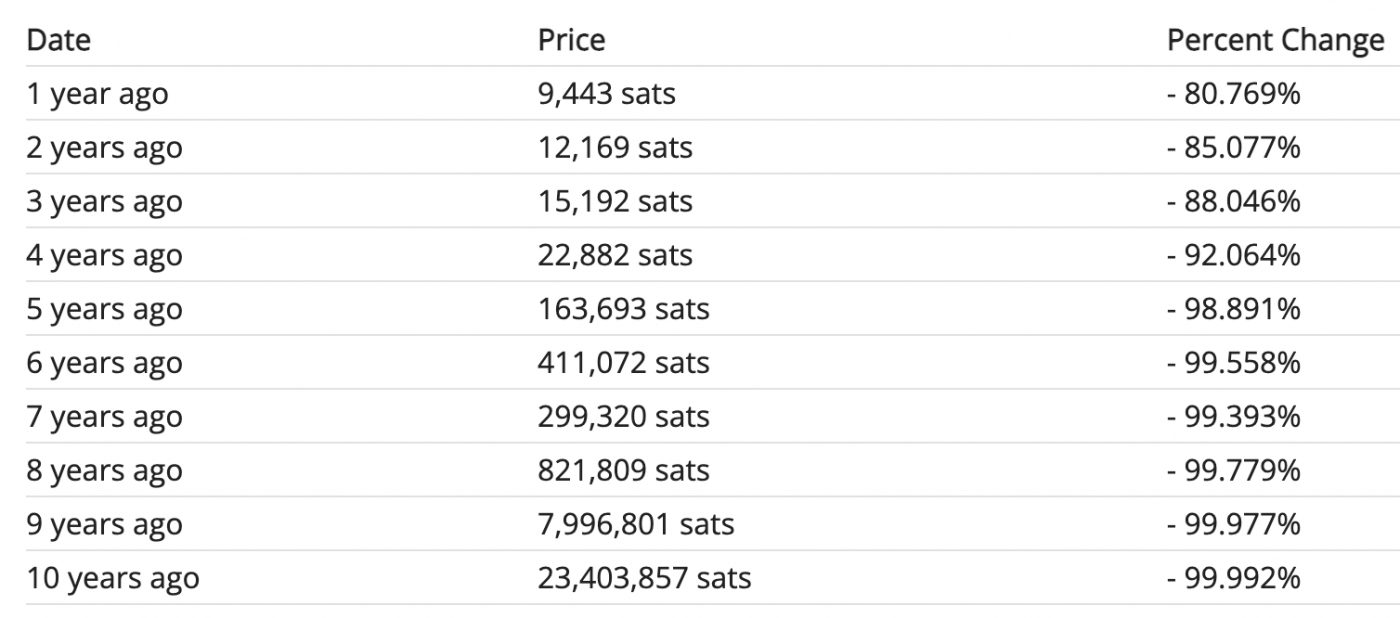
Looking at the value of $US1 in sats, if you’re looking to preserve purchasing power, stacking sats would appear to be the rational thing to do.

$1 valued in sats. Source: Dr Jeff Ross
Categories
Crypto News DigiByte Market Analysis Trading

Top 3 Coins To Watch Today: DGB, FET, SLP – October 8 Trading Analysis

Let’s take a closer look at today’s altcoins showing breakout signals. We’ll explain what the coin is, then dive into the trading charts and provide some analysis to help you decide.

1. DigiByte (DGB)

DigiByte DGB is an open-source blockchain and asset creation platform. A longstanding public blockchain and cryptocurrency, DigiByte uses five different algorithms to improve security, and originally aimed to improve on the Bitcoin blockchain’s security, capacity and transaction speed. DigiByte consists of three layers: a smart contract “App Store”, a public ledger, and the core protocol featuring nodes communicating to relay transactions.

DGB Price Analysis

At the time of writing, DGB is ranked the 112th cryptocurrency globally and the current price is A$0.07139. Let’s take a look at the chart below for price analysis:

Source: TradingView

After climbing nearly 380% since the beginning of the year, a 115% range has trapped DGB between A$0.06249 and A$0.1073 during Q3.

A consolidation near A$0.06892, visible on the weekly chart, provided support on the last touch. This level could provide support again on a stop run under the A$0.06713. 

A deeper run-on stops at A$0.06620 might reach the top of a higher-timeframe gap at the same level. However, a push this low reduces the chance of a new all-time high soon. Below, little significant support exists until A$0.06819.

Higher-timeframe levels overlapping with a daily gap beginning at A$0.07699 are likely to provide resistance, perhaps on a sweep of the equal highs near A$0.07940. Breaking this resistance makes the relatively equal highs near A$0.08255 and the monthly high at A$0.08647 the next probable targets.

2. Fetch.ai (FET)

Fetch.ai FET is a platform that aims to connect Internet of Things (IoT) devices and algorithms to enable their collective learning. Fetch.ai is built on a high-throughput sharded ledger and offers smart contract capabilities to deploy machine learning and artificial intelligence solutions for decentralised problem-solving. These open-source tools are designed to help users create ecosystem infrastructure and deploy commercial models.

FET Price Analysis

At the time of writing, FET is ranked the 130th cryptocurrency globally and the current price is A$0.9501. Let’s take a look at the chart below for price analysis:

Source: TradingView

FET‘s euphoric Q3 pump turned into a mid-September 65% retracement, with little higher-timeframe support for bulls to justify entries.

Currently, the price is distributing at the 52% retracement level. A small consolidation near A$0.9244 is visible on the daily chart, with a clearer consolidation on the 4h chart. This area does have some confluence with the 79% retracement level and could offer some support in the future. 

The daily gap’s midpoint near A$0.9428 has suppressed the price, although a push through this level could fill the daily gap up to A$1.18. A lack of sensitivity at this resistance could suggest a minor retracement before a possible move to new all-time highs.

3. Smooth Love Potion (SLP)

Smooth Love Potion SLP tokens are earned by playing the Axie Infinity game. This digital asset serves as a replacement for experience points. SLP are ERC-20 tokens, and they can be used to breed new digital pets known as Axies. The cost of breeding begins at 100 SLP but increases gradually, rising to 200 SLP for the second breed, 300 for the third, 500 for the fourth, 800 for the fifth, and 1,300 for the sixth. Axies can be bred a maximum of seven times, and the seventh breed costs 2,100 SLP. This limit exists in order to prevent hyperinflation in the marketplace.

SLP Price Analysis

At the time of writing, SLP is ranked the 285th cryptocurrency globally and the current price is A$0.1191. Let’s take a look at the chart below for price analysis:

Source: TradingView

SLP‘s 160% pump during early July ran into 85% retracement near A$0.0895 on September 20. Since then, the price has been consolidating in a 120% range between A$0.08724 and A$0.1055.

Just below the mid-September low, A$0.08627 is the first level likely to provide substantial support. If the price breaks down through this level, overlapping levels near $0.08422 might cap a run on the lows near A$0.08314 and A$0.08195.

The higher-timeframe analysis points to the area near A$0.1295 as the next substantial resistance. Significant selling has been occurring here on the daily chart. If this level breaks, the swing highs near A$0.1367 and A$0.1420 may be the next targets.

Where to Buy or Trade Altcoins?

These coins have high liquidity on Binance Exchange, so that could help with trading on AUD/USDT/BTC pairs. And if you’re looking at buying and HODLing cryptos, then Swyftx Exchange is an easy-to-use popular choice in Australia.

Categories
Bitcoin Market Analysis Markets Trading

Q4 Looks Bullish for Bitcoin, Up 34% in a Week

Over the past week alone, bitcoin is up over 34 percent, surging past the US$55,000 mark. After a lacklustre September (jokingly referred to as “Downtember”), October (or “Uptober”) has kicked off with a bang suggesting we may be in for an exciting Q4.

2021 – A Topsy Turvy Year

Everyone knows Bitcoin is volatile, but 2021 has been noticeably so, particularly in light of the endless attacks on the network. These ranged from China banning crypto (again) and shutting down miners to Elon Musk triggered sell-offs in the wake of his “environmental concerns“.

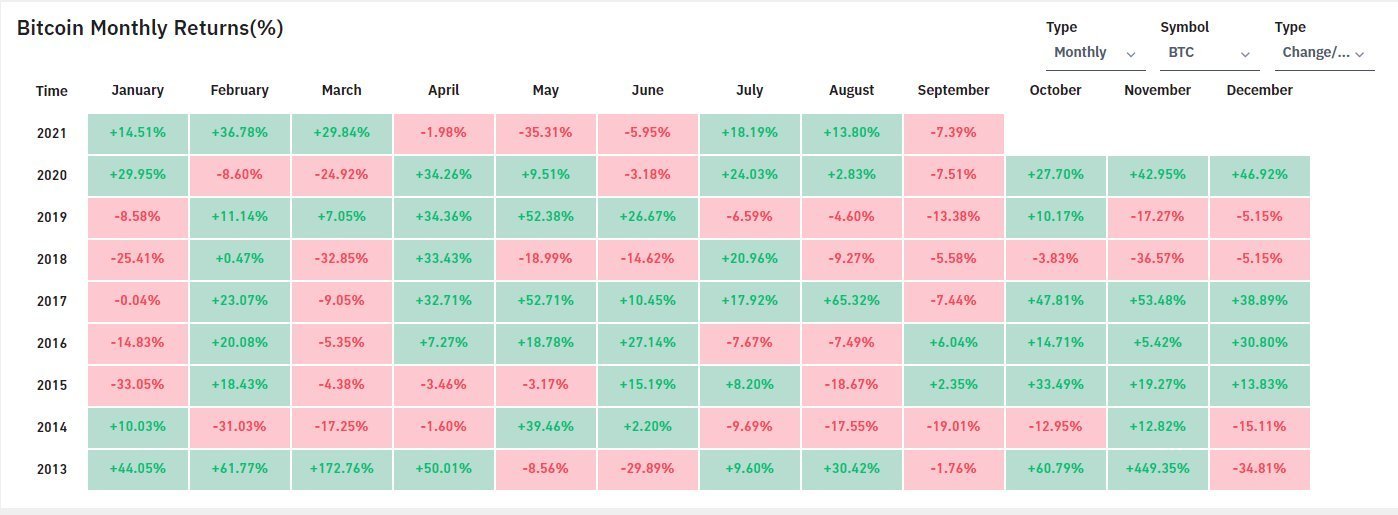
Following a strong Q1 providing a return of 102 percent, Q2 proved to be bitcoin’s worst in over eight years, delivering 40 percent. Q3 brought bitcoin back into positive territory, with the digital asset recording a 24 percent return over the period. After reaching an important technical milestone last month (the “Golden Cross“), there are signs that Q4 may prove to be bitcoin’s best in 2021.

BTC monthly returns. Source: CryptoMichNL (Twitter)

Three Reasons Q4 Is Looking Good

Reason One: HODLers Are Accumulating

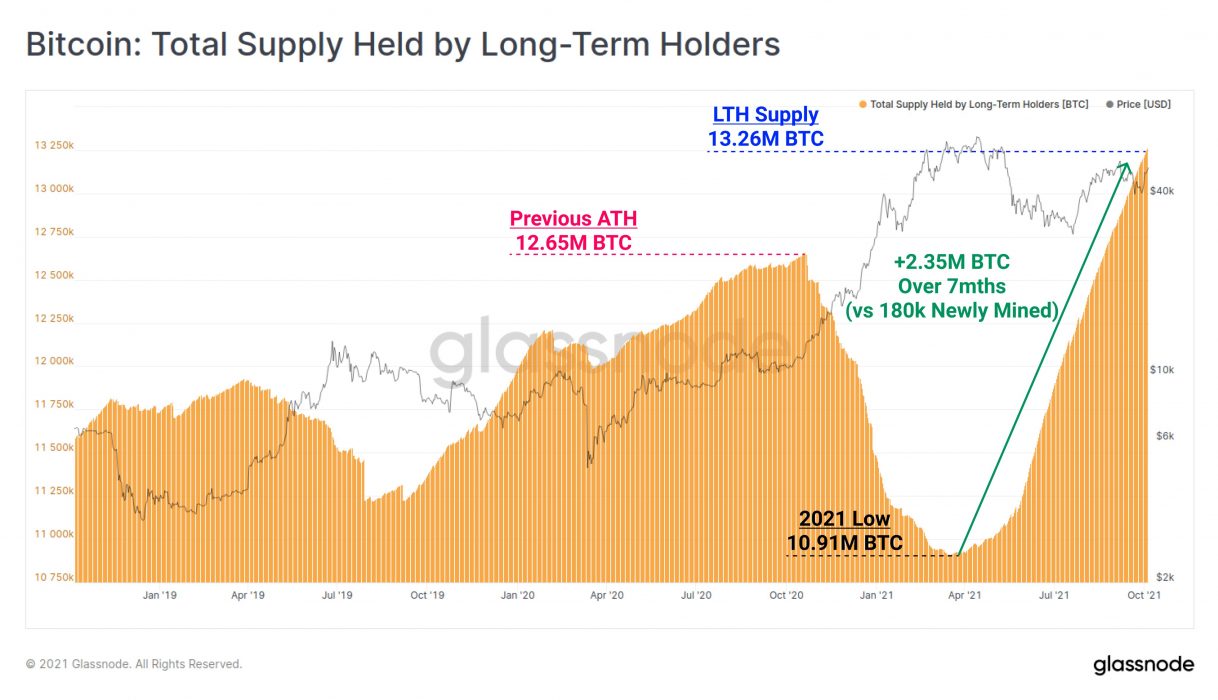
One of the main signals of a bull market is accumulation by long-term holders (HODLers). According to Glassnode, HODLers have added 2.35 million BTC to their stacks since supply bottomed out in March. Since then only 180,000 BTC have been mined, meaning HODLers accumulated 13x more coins than were produced via fresh issuance over the past seven months.

HODLer accumlation. Source: Glassnode.

Reason Two: On-Chain Volume Dominated By Large Transactions

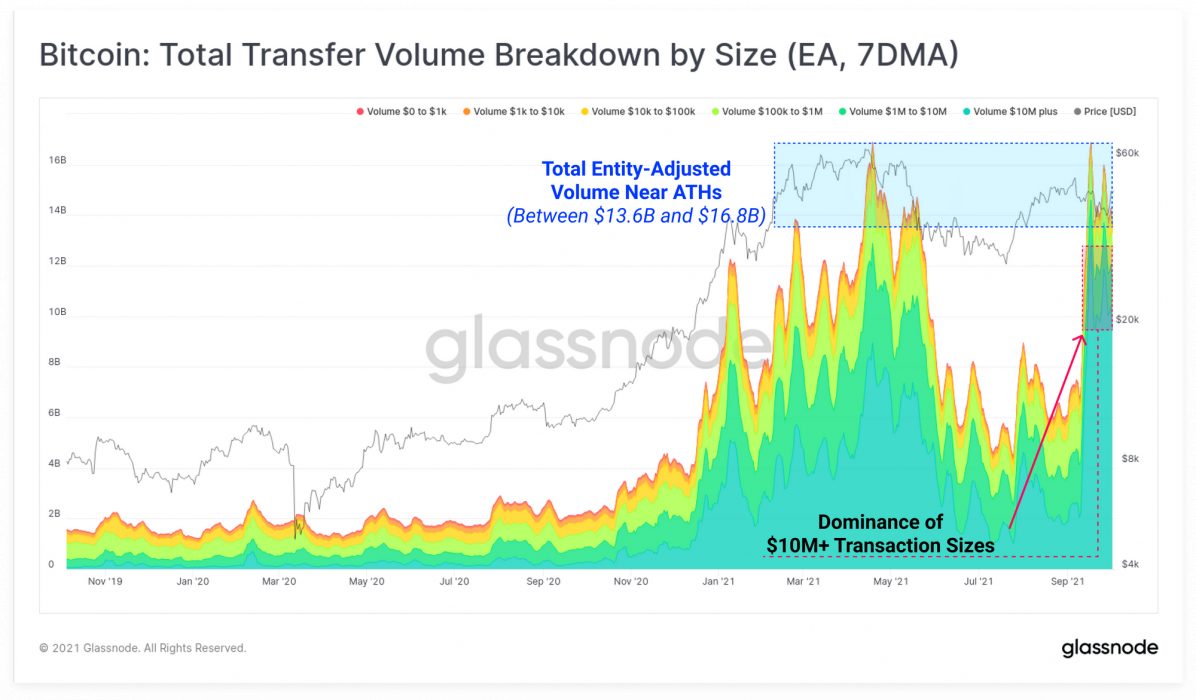
According to Glassnode:

The rising dominance of large transaction sizes hints to the increased maturation of Bitcoin as a macro-scale asset with increasing interest from high-net-worth individuals, trading desks, and institutions.

Glassnode
Volume dominance. Source: Glassnode

Reason Three: SOPR is Flashing End of a Bear/Start of a Bull Market

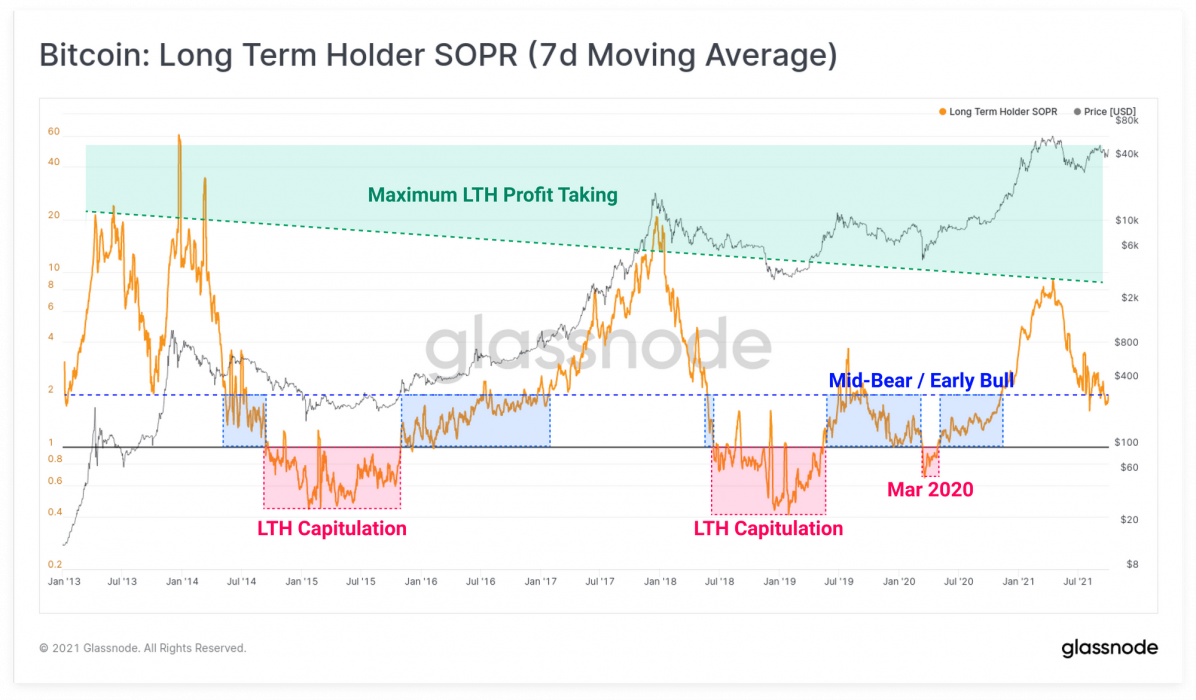
In Glassnode speak, the LTH-SOPR (long-term holder, spent output profit ratio) refers to the degree of profit realised on chain. Glassnode notes that as a longer-term cyclical metric, the “LTH-SOPR usually trades in this range during late stage bear markets, and early stage bull markets. This is a result of lengthy sideways price action which compresses profit multiples, even for longer-term investors.”

7-day moving average SOPR. Source: Glassnode

Outside of on-chain analysis, the futures and options markets are currently showing that traders are no longer in fear mode and have shifted bullish.

Despite having the validity of his model challenged this year, Plan B remains confident of his end-of-year US$135,000 bitcoin prediction made in late June:

Just last week, derivative markets gave bitcoin a 3.2 percent chance of reaching US$100,000 before year end.

Between technical, fundamental, on-chain and stock-to-flow analysis, time alone will tell which is more accurate in determining how bitcoin performs in Q4. Chances are bitcoin will do what bitcoin does – whatever it wants.

Categories
Cardano Crypto News ICON Market Analysis Trading

Top 3 Coins To Watch Today: ADA, CHR, ICX – October 7 Trading Analysis

Let’s take a closer look at today’s altcoins showing breakout signals. We’ll explain what the coin is, then dive into the trading charts and provide some analysis to help you decide.

1. Cardano (ADA)

Cardano ADA is a proof-of-stake blockchain platform that says its goal is to allow “changemakers, innovators and visionaries” to bring about positive global change. The open-source project also aims to “redistribute power from unaccountable structures to the margins to individuals”, helping to create a society that is more secure, transparent, and fair.

Cardano is used by agricultural companies to track fresh produce from field to fork, while other products built on the platform allow educational credentials to be stored in a tamper-proof way, and retailers to clamp down on counterfeit goods.

ADA Price Analysis

At the time of writing, ADA is ranked the 4th cryptocurrency globally and the current price is A$3.08. Let’s take a look at the chart below for price analysis:

Source: TradingView

ADA‘s nearly 47% retracement from its late August high found a low near A$2.93 in late September.

The price is currently approaching resistance at a swing high near A$3.15. If this level breaks, bulls might target the swing highs near A$3.23, A$3.29, and potentially up to A$3.34. Resistance near A$3.39 and A$3.46 could cap this move.

If the market remains bullish for the near term, bulls might buy at A$3.10. However, a stop run into A$2.91 could offer a higher probability entry. A steeper drop could reach below the swing low into possible support near $2.85.

2. Chromia (CHR)

Chromia CHR is an open-source public blockchain conceived of by Swedish company Chromaway AB. The Chroma token (CHR) was launched in May 2019. The technology behind the Chromia blockchain is adapted from an earlier technology called ‘Postchain’, a solution provided by Chromaway AB for enterprise clients. Chromia is a standalone Layer-1 blockchain and EVM compatible Layer-2 enhancement for Binance Smart Chain and Ethereum. It is designed to enhance existing dApps and allow for the creation of next-generation dApps by providing scalability, improved data handling, and customisable fee structures.

CHR Price Analysis

At the time of writing, CHR is ranked the 318th cryptocurrency globally and the current price is A$0.4771. Let’s take a look at the chart below for price analysis:

Source: TradingView

CHR‘s chart paints a different picture than those of many other altcoins, with August’s high leading to a massive range before setting a low near A$0.3544 in September.

The beginning of October makes immediate bids questionable. However, the price may be finding support near A$0.3862 and possibly near A$0.3421. Since the price swept the impulse’s high at A$0.4859, bulls might be waiting to enter near the swing low and gap near A$0.4166, or slightly lower near A$0.3698.

Little resistance lies overhead, although some resistance might exist between A$0.5273 and approximately A$0.5622, just above the current price. A sweep and rejection of the high near A$0.6107 would make most areas of possible support highly suspect and could mark the end of the bullish trend.

3. ICON (ICX)

ICON is a decentralised blockchain network focused on interoperability. With ICON’s “blockchain transmission protocol”, independent blockchains like Bitcoin and Ethereum can connect and transact with each other. This opens up cross-chain use cases that are impossible without an interoperability layer like ICON. The ICON blockchain is powered by loopchain, a blockchain engine designed by ICONLOOP.

ICX Price Analysis

At the time of writing, ICX is ranked the 75th cryptocurrency globally and the current price is A$3.08. Let’s take a look at the chart below for price analysis:

Source: TradingView

Like many other altcoins, ICX set a high in early April before retracing 83% to the low at A$1.27 in June.

Price broke through resistance near A$2.89, which may mark an area of possible support on a retracement. If this support fails, bulls might also step in near A$2.76. However, a drop this far increases the chances of a stop run to A$2.70 and possibly into support near A$2.66. For now, continuing bullish market conditions could help A$2.85 become support.

The swing high around A$3.14 gives bulls a reasonable first target, with A$3.20 also likely to draw the price upward. Higher-timeframe resistance beginning near A$3.27 or A$3.30 could cap the move or trigger consolidations. If bullish market conditions continue, bulls might test probable resistance near A$3.38.

Where to Buy or Trade Altcoins?

These coins have high liquidity on Binance Exchange, so that could help with trading on AUD/USDT/BTC pairs. And if you’re looking at buying and HODLing cryptos, then Swyftx Exchange is an easy-to-use popular choice in Australia.

Categories
Crypto News Market Analysis Trading

HIVE Surges +145% in a Single Day amid HiveFest Annual Gathering for Hive Users and its Ecosystem

HIVE is trading in an uptrend, like many other Altcoins. The cryptocurrency HIVE just went up +145% in a single day by breaking a rising wedge pattern with strong buying volume on multiple exchanges and surges over +180% in a week.

What is Hive?

Hive is a decentralised information-sharing network with an accompanying blockchain-based financial ledger built on the Delegated Proof of Stake (DPoS) protocol. Hive supports many different types of information-sharing applications. Myriad dapps, APIs, and front-ends contribute to general and straightforward accessibility of data, transactions, and records so that this existing diversity and utility ensure that the ecosystem is welcoming to content creators, consumers, investors, and builders.

HIVE Price Analysis

At the time of writing, HIVE is ranked the 130th cryptocurrency globally and the current price is A$1.55. Let’s take a look at the chart below for price analysis:

Source: TradingView

After looking at the above 1-Day candle chart, we can clearly see that HIVE was trading inside the head & shoulder pattern on the HIVE/USDT pair. The first resistance was on the A$1.05 price level, which HIVE broke with a strong bullish trend buying volume and is now heading towards the recent high price at A$1.70. Seeing that many Altcoins are holding a strong position this week after the recent bitcoin price recovery, HIVE may continue to increase in the uptrend if traders keep buying with high volume.

“In technical analysis, a head and shoulders pattern describes a specific chart formation that predicts a bullish-to-bearish trend reversal. It is one of several top patterns that signal, with varying degrees of accuracy, that an upward trend is nearing to start.”

What Do the Technical Indicators Say?

The HIVE TradingView indicators (on the 1 day) mainly indicate HIVE as a Strong Buy, except the Oscillators which indicate HIVE as a Buy.

So Why Did HIVE Breakout?

General market sentiment seems to suggest cryptos are hopefully turning back bull run season after recent price corrections. Another reason for this sudden pump in price could be whales secretly buying HIVE for the coming Altcoins rally. Recent news was also announced regarding HiveFest the annual gathering for Hive users and its ecosystem. It is a reunion x conference x social event.

Where to Buy or Trade HIVE?

HIVE has the highest liquidity on Binance Exchange so that would help for trading HIVE/BTC or HIVE/USDT pairs. And if you’re looking at buying and HODLing cryptos, then Swyftx Exchange is an easy-to-use popular choice in Australia.