Categories
Bitcoin Mining Crypto News JPMorgan

Bitcoin Mining Cost Sinks to $13,000 Amid Crypto Winter: Report

According to a global markets strategy PDF released by leading investment bank JPMorgan, the price of bitcoin (BTC) production has sunk to approximately US$13,000 from early June’s US$20,000.

This is reportedly the result of the bear market brought on by the crypto winter:

Bitcoin Miners: Crypto Winter Strikes Back

JPMorgan has found that the production cost to mine one Bitcoin has dropped from an estimated US$24,000 to a lowly $13,000, a 10-month low according to Bloomberg.

The bank’s strategists, led by Nikolaos Panigirtzoglou, have found that the recent plunge in BTC’s production costs resulted from the following combination of factors:

https://www.linkedin.com/in/nikolaos-panigirtzoglou-5012975/overlay/photo/

The decline in electricity use as proxied by the Cambridge Bitcoin Electricity Consumption Index, while the hash rate has been fluctuating in recent months with no clear downtrend.

Nikolaos Panigirtzoglou, strategist, JPMorgan

Despite improved profitability suggesting that pressure for miners to sell their bitcoin holdings for liquidity purposes could lessen, the decrease in costs is typically seen as a negative for the overall bitcoin price:

Although opinions vary, data from MacroMicro suggests that the production cost remains steady at approximately US$17,700. MacroMicro justifies this by explaining that the lower the mining costs, the more miners will join. However, when mining costs are higher than miners’ revenue, numbers will logically fall.

Funding a Mining Operation

The cost of bitcoin mining depends on several variables, chief among which is electricity costs incurred by miners for their required machinery. Providing bitcoin’s price exceeds maintenance costs, a mining operation will be profitable. However, mining operations must also consider infrastructure, labour and hardware costs for the maintenance of mining farms, all of which can vary. This crypto winter is also taking place while energy prices soar globally.

Bitcoin miners aren’t alone in their struggles, however. Miners of all sorts are facing pressure created by the damaging plunge of bitcoin. Among those experiencing exponential lows this year-to-date: Marathon Digital Holdings is down 73 percent, Riot Blockchain Inc has dropped 73 percent, and Core Scientific Inc is down a whopping 83 percent. Worse yet, there’s scope for these figures to continue falling.

Luckily, there is hope when it comes to infrastructure, with the Bloomberg report suggesting mining costs can be reduced via the deployment of more energy-efficient mining rigs, such as those becoming available thanks to Intel and Bitmain.

Bitcoin Falls on Rough Times

July has been somewhat of a nightmare month for bitcoin as it fell under US$19,000 following the US’s highest inflation print in 40 years. Economists had initially predicted an 8.8 percent June year-on-year inflation rate; however, the reality was 9.1 percent, which meant an immediate dip in BTC’s price.

To add further stress, Bitcoin has also had to address the strain placed on diamond hands, namely those investors who normally refrain from selling an investment despite downturns or losses. Glassnode, an on-chain analytics firm, discovered that while the total unique Bitcoin count had exceeded 1 billion, diamond hands were selling at an average loss of 33 percent.

Categories
Crypto News Crypto Wallets Payments

PayPal Allows US Users to Withdraw BTC and ETH to External Wallets

PayPal has announced it will begin allowing US crypto holders to transfer their digital assets to external wallets. The rollout of the update has just begun and is likely to be available to all US users within the next fortnight.

PayPal for BTC and ETH

PayPal will offer users the option to transfer bitcoin, ether, litecoin, and bitcoin cash to external wallets in coming weeks. The long sought-after addition will bring PayPal in line with other successful cryptocurrency services in the industry. The feature has been a hot topic since the company’s October 2021 launch of its crypto buy, sell and hold service:

According to Jose Fernandez da Ponte, senior vice president of PayPal’s blockchain, crypto and digital currencies sector, the company believes its “role in the ecosystem is about increasing access”. The move to permit transfers to external wallets has made PayPal the largest blockchain-enabled consumer digital wallet.

Earlier Crypto Business Moves

In March 2021, PayPal upgraded its technology to permit US users to make payments with their cryptocurrency with the same ease as using a debit or credit card. This option became available for millions of global merchants, easily converting ethereum, bitcoin and litecoin to fiat money.

And at the beginning of 2022, a developer found stablecoin development code within the PayPal App. The discovery prompted PayPal to come forward with the admission that it was experimenting with a stablecoin of the same name. A logo image was discovered alongside the code.

Categories
Crypto News Market Analysis The Crypto Den Trading

TradeRoom: Our Weekly Crypto Trades Analysis – May 2, 2022

Welcome to this weekly series from the TradeRoom. My name is Dave and I’m the founder of The Crypto Den, an Australian-based crypto trading and education community aiming to give you the knowledge to take your trading game to the next level.

Crypto Market Outlook

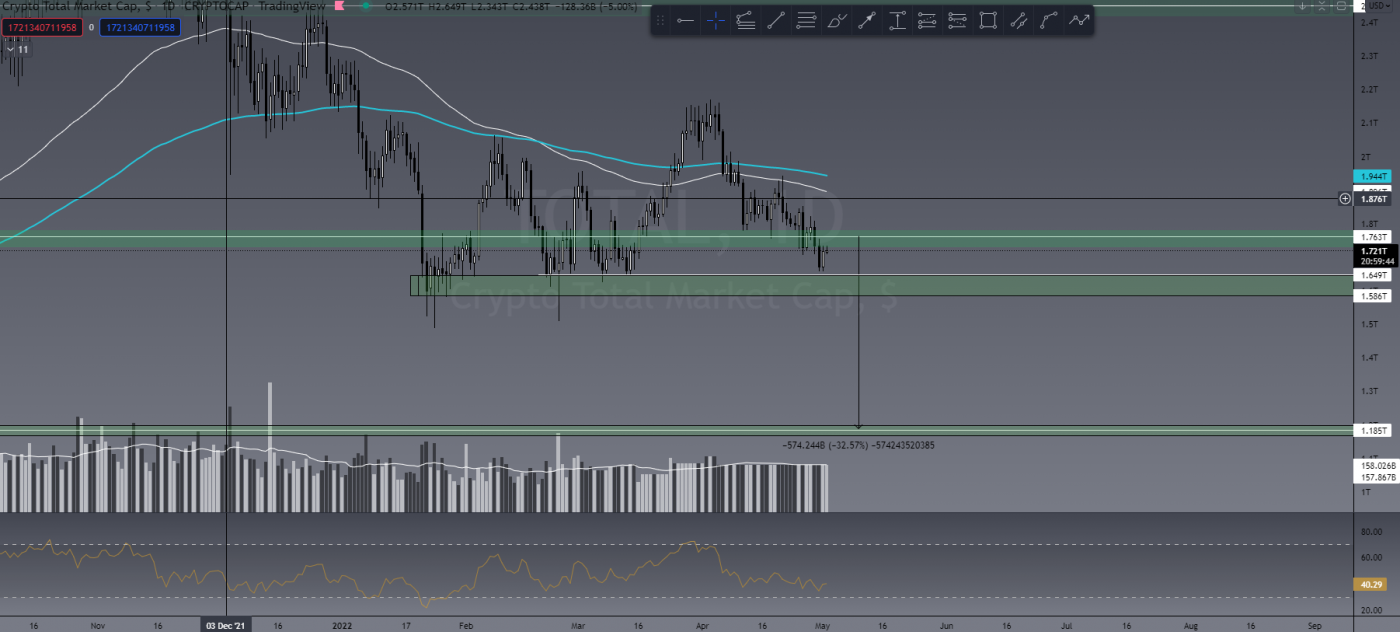
The TOTAL market cap lost US$100 billion over the weekend and is currently having a small retrace of that loss. I suspect this will be pretty short-lived, which would bring us to a very important last line of defence. If the TOTAL drops below US$1.58 trillion, there’s huge potential for a US$400 billion loss. This will undoubtedly hurt a lot of people, so please investigate stop losses and make sure you’re prepared for the worst-case scenario!

TOTAL market cap

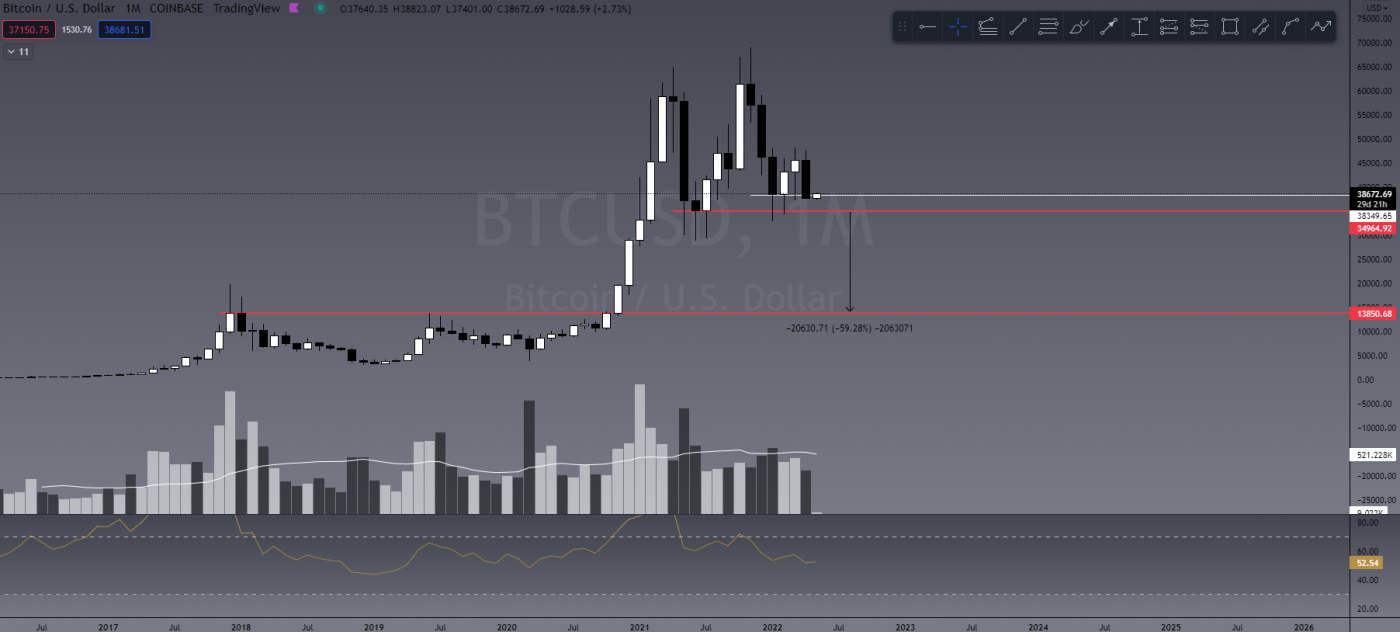
The BTC monthly closed just below that monthly support and has a window of opportunity to keep us in a ranging situation. Failing that, we get another bearish month and it’s anyone’s guess how low we could drop from here. If you zoom right out and take a good look at the monthly chart, you will see there’s really no structure between US$34,000 and US$14,000.

BTC monthly chart

I’m putting forward some very bearish cases here and that does not mean it’s game over. There’s still opportunity for BTC to bounce, but it must happen above US$30,000! If that level breaks, then it will be a long winter in my opinion.

BTC/USDT 1D chart

BTC is currently sitting on a weekly 100 EMA and some daily support. My bias is still that we see a bear flag that I wrote about last week play out over the next month or two. If so, ALTS will bleed hard.


Last Week’s Performance

ADA/USDT

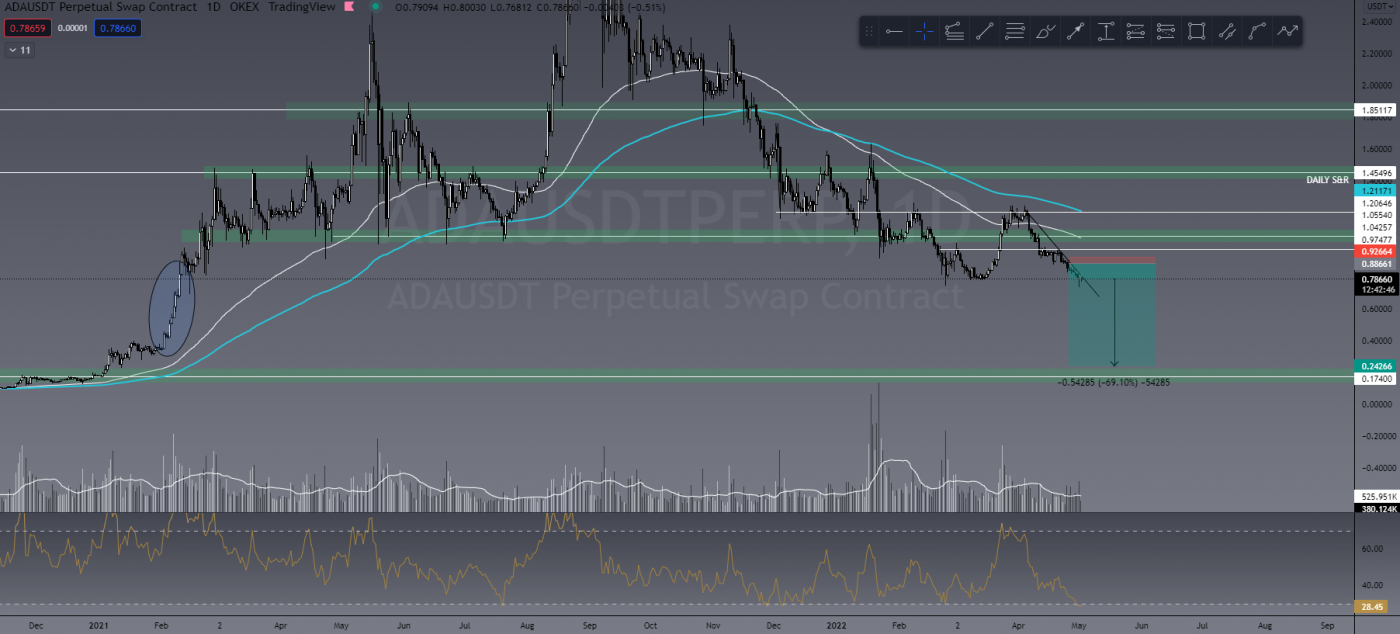
ADA, like many others, is also at its last line of defence. I entered short last week and am now currently sitting at around 120% ROI. I’d like to see this trade reach approximately 800% in 10x.

ADA/USDT

DOGE/USDT

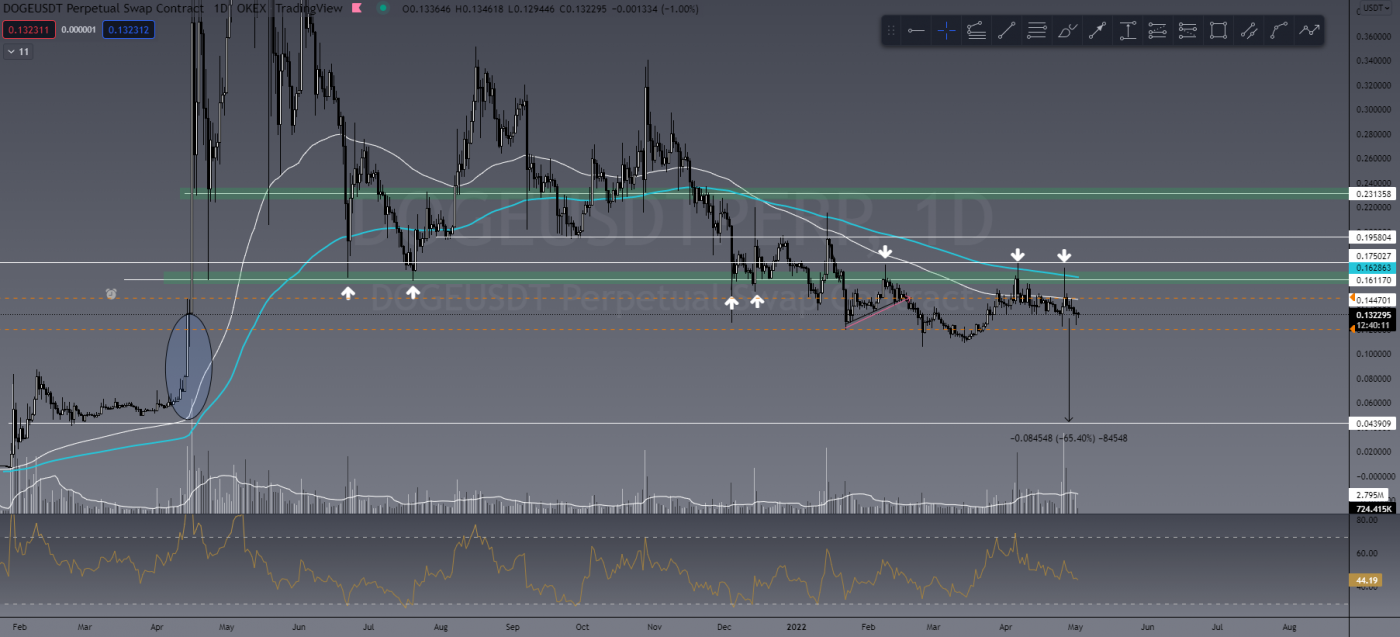
This entry was partially TA and partially luck! Last week I wrote about my thoughts on DOGE dropping 70%, then Elon decided to buy Twitter (as you do) and DOGE pumped. The luck part was that I didn’t enter right away and instead got in a short on the pump. I’m currently sitting at 170% ROI.

DOGE/USDT

This Week’s Trades

TORN/USDT

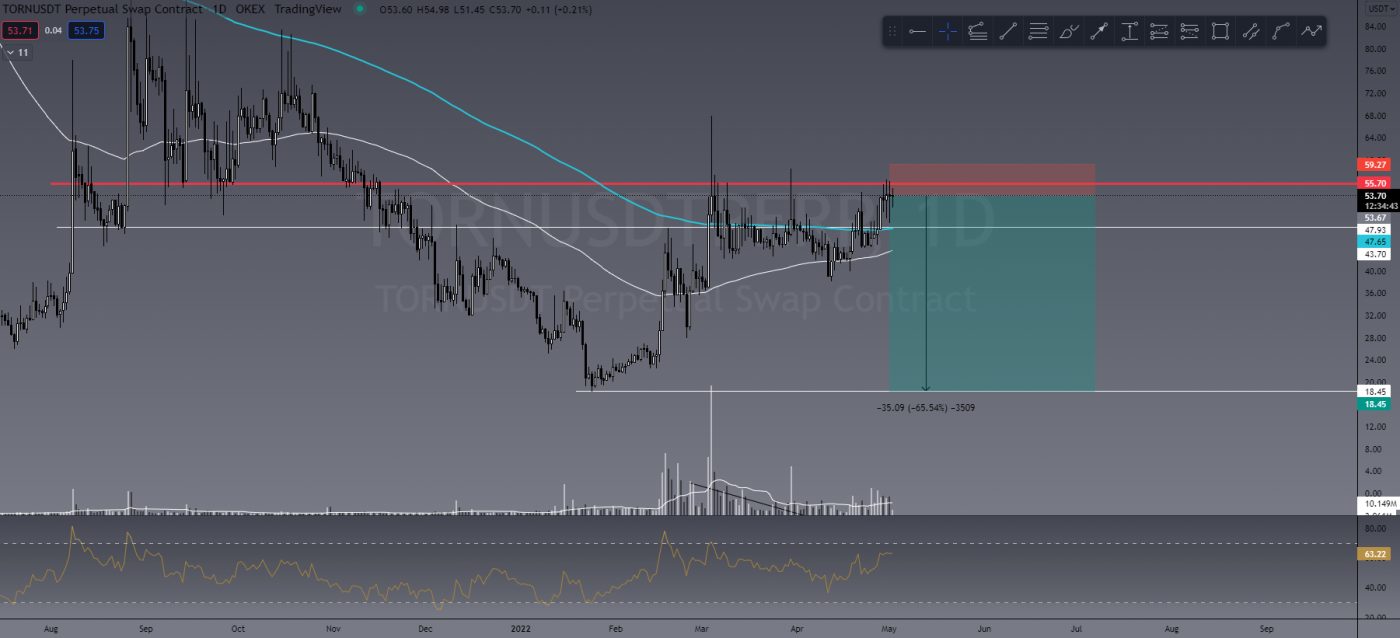
I’ve been watching TORN since last week and have just entered a short trade today. Candlestick analysis is showing a lot of indecision at a crucial level of daily resistance. R:R looks good enough for me to enter.

TORN/USDT

TRX/USDT

A 2017 fan favourite, TRX, looks like it could be setting up for a short trade. It’s currently sitting at both daily 200 EMA and daily resistance. If we see BTC drop, this could present a prime entry for short trades.

TRX/USDT

Introducing TCD’s New Social Platform

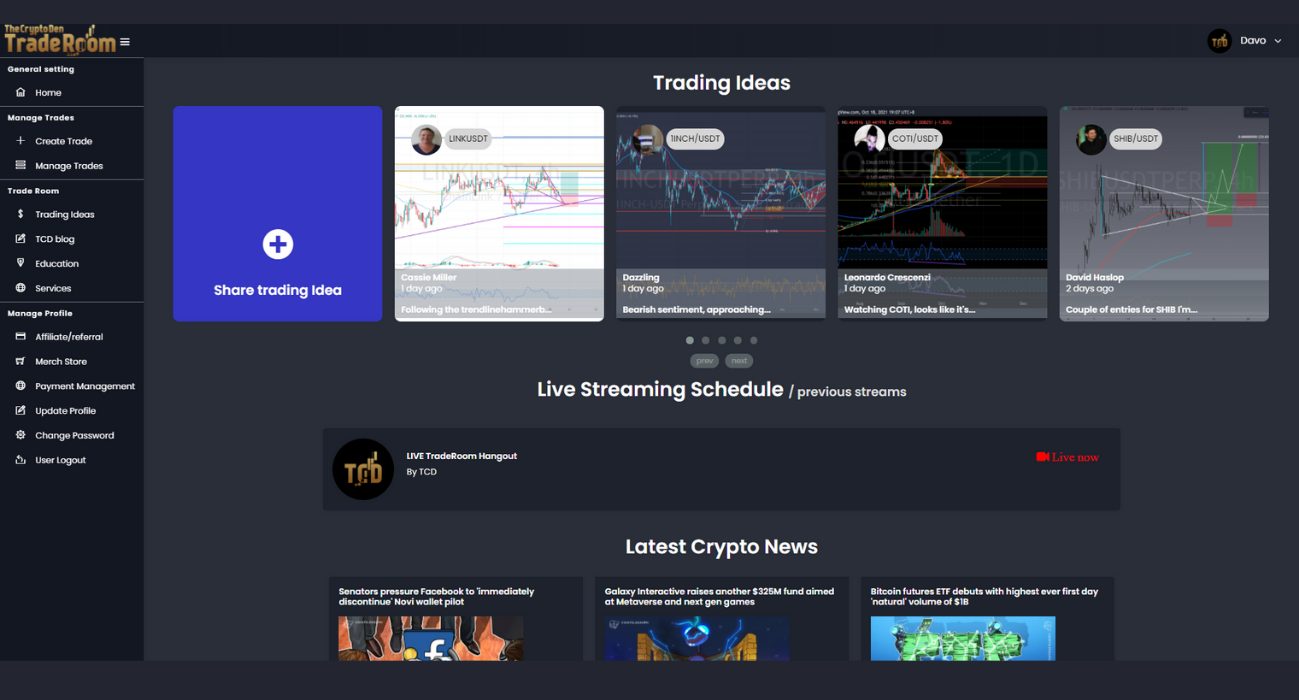
The Crypto Den now has a FREE purpose-built social platform to share investment ideas, trade chat, connect with like-minded people, share info and more, without the censorship of Facebook. The platform is designed for those more focused on the investment/profitable side of the crypto world.


Are You a Trader?

Invite to Join our TradeRoom

If you’d like to become a better trader, you’re invited to join our TradeRoom where we share daily charts and market analysis. In our community we strongly encourage and teach correct risk management strategies to keep our members safe in this new volatile crypto market.
Join our “Apprentice” plan now for your 7-day trial.


The Crypto Den was created in 2017 to help the rapidly growing crypto community learn and understand the fundamentals of digital currencies and how to trade them. 

Since then we have taught thousands of members the basics of technical analysis and trading strategies to further progress and perfect their trading abilities.

In the TradeRoom, you will be included in a supportive environment which encourages personal growth, education and community support.

It’s a place to share your trading ideas and follow other experienced traders’ feeds to help keep your finger on the pulse of such a volatile market!

Categories
Market Analysis The Crypto Den

TradeRoom: Our Weekly Crypto Trades Analysis – Feb 21, 2022

Welcome to this weekly series from the TradeRoom. My name is Dave and I’m the founder of The Crypto Den, an Australian-based crypto trading and education community aiming to give you the knowledge to take your trading game to the next level.

Crypto Market Outlook

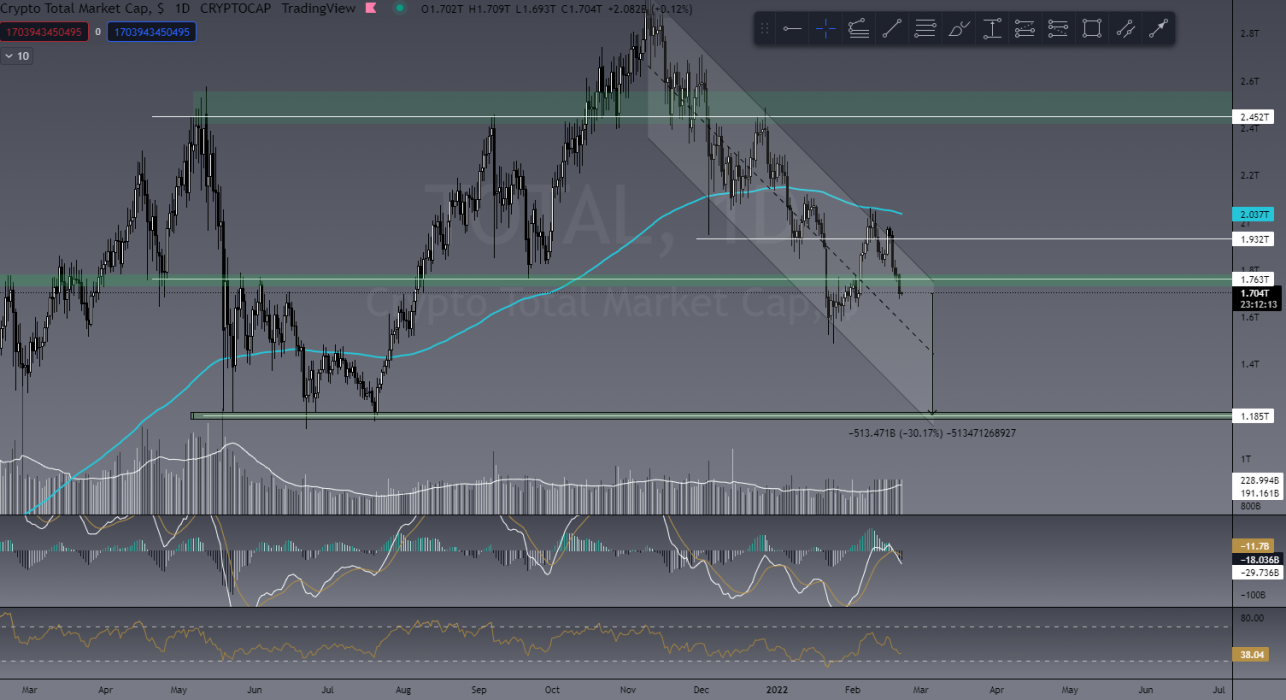
Well, the market lost another US$250 billion this last week and is still not really showing any signs of strength. The TOTAL crypto cap is still trending down in this channel and if we don’t see a recovery soon, I anticipate we could lose another US$500+ billion. I know it’s not what people want to hear/read, but we have tried to give as much warning and caution as possible since November 2021 that the markets could get much worse, and they have with the TOTAL down US$1.3 trillion (43%).

TOTAL market cap

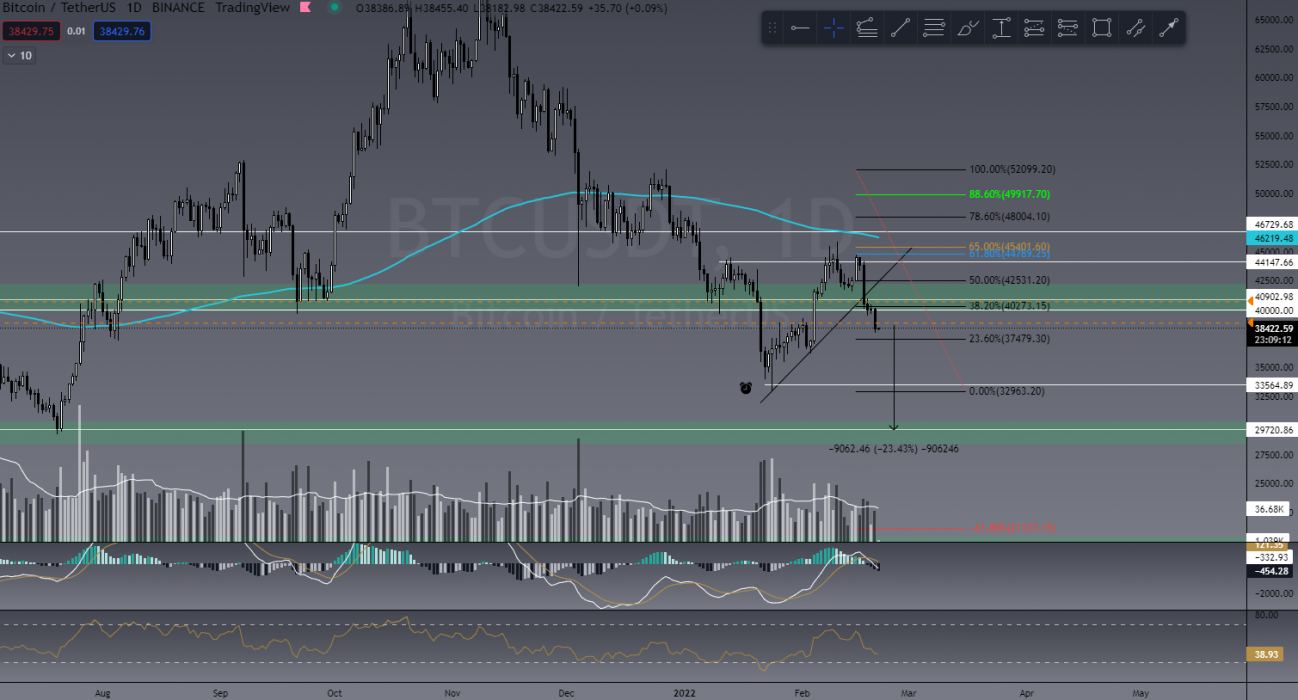
BTC has broken the local uptrend I showed in last week’s article after hitting the retrace golden pocket on the fibs. To me this is the first confirmation that the recent uptick was nothing but a relief rally, as we have been saying for a couple of weeks now. The second confirmation I’m looking for is a new lower low (LL) on the daily timeframe. An anticipated 13%-23% drop is likely at this stage, taking us back to US$29,000.

BTC/USDT

Last Week’s Performance

In last Thursday night’s live market scan in Our TradeRoom we had an absolute banger! We found six amazing entries into short trades as a community effort to help each other WIN! I’ll show three here today:

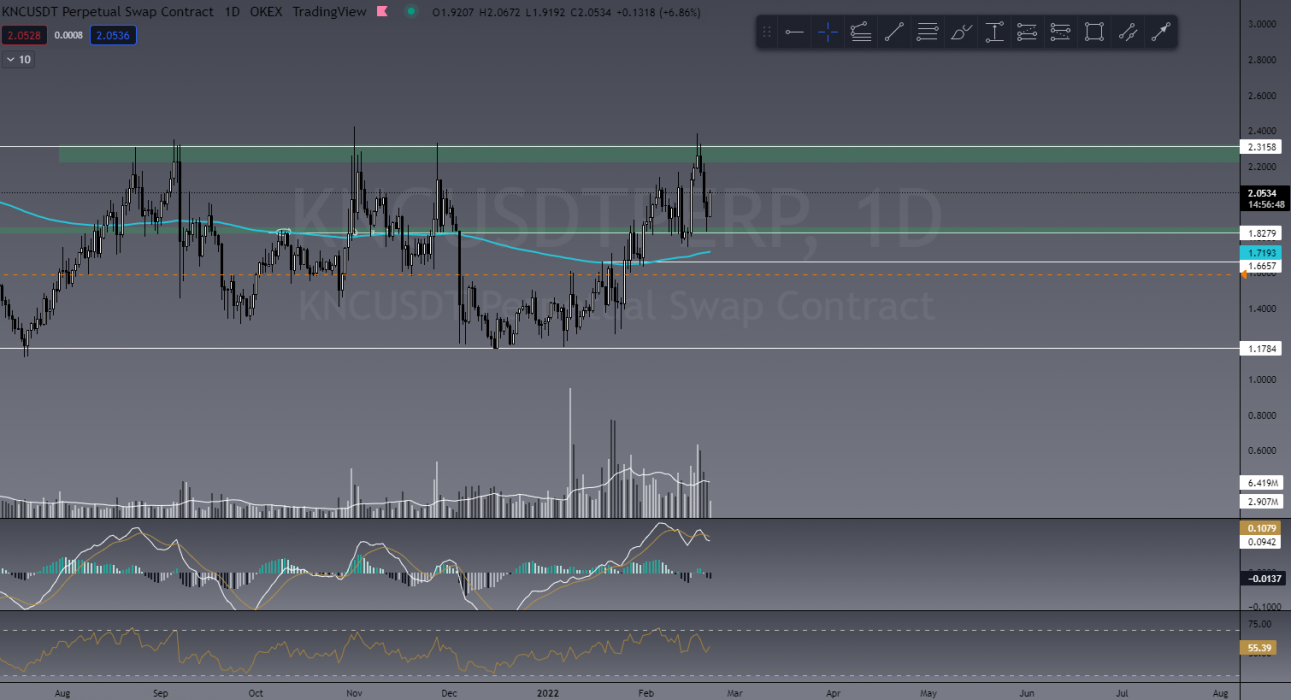
KNC/USDT

We looked at KNC/USDT peaking out at a daily level of resistance which is generally a very strong level to break. With its solid risk-to-reward ratio, we jumped into this one there and then. For me at the time of writing, it’s currently on 160% profit on a 10x trade.

Dids’ chart in Thursday market scan
My chart showing the current price action

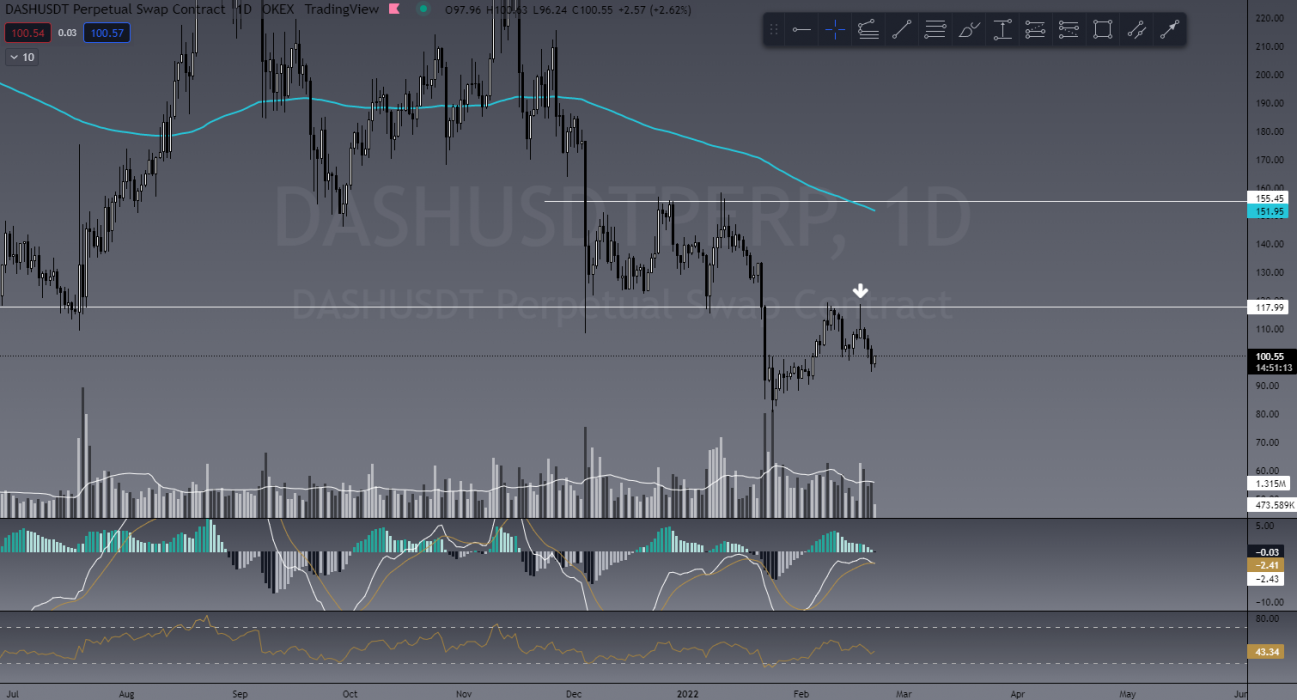
DASH/USDT

DASH showed us a textbook little double top at daily resistance. We entered this short and within minutes were already in profit. Doesn’t really get simpler than this. Currently sitting at 150% on 10x.

Dids’ chart from Thursday market scan
My chart showing current price action

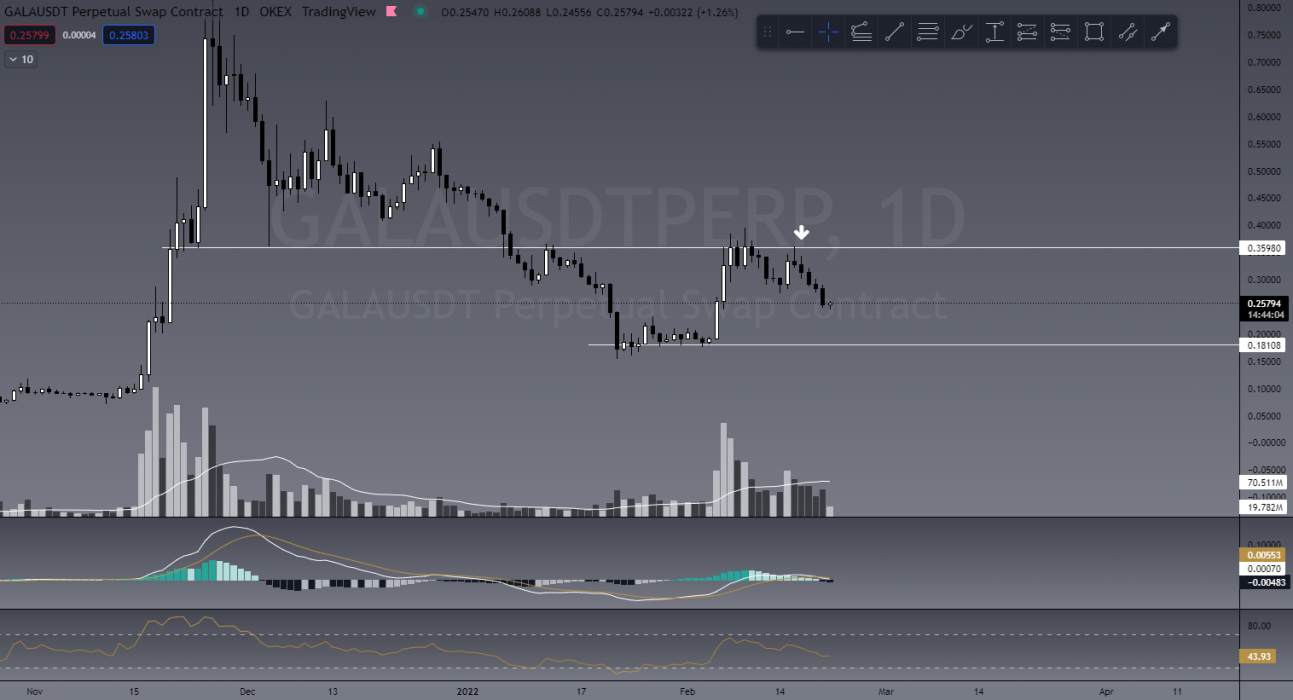
GALA/USDT

Again we see a beauty of a support/resistance flip here with a lower high (LH) capping out at the golden pocket fib level. Credit to “Typeguy” for finding this one! He’s pretty much a trade-finding machine! Currently 220% on 10x.

Dids’ chart from Thursday market scan
My chart showing current price action

This Week’s Trades

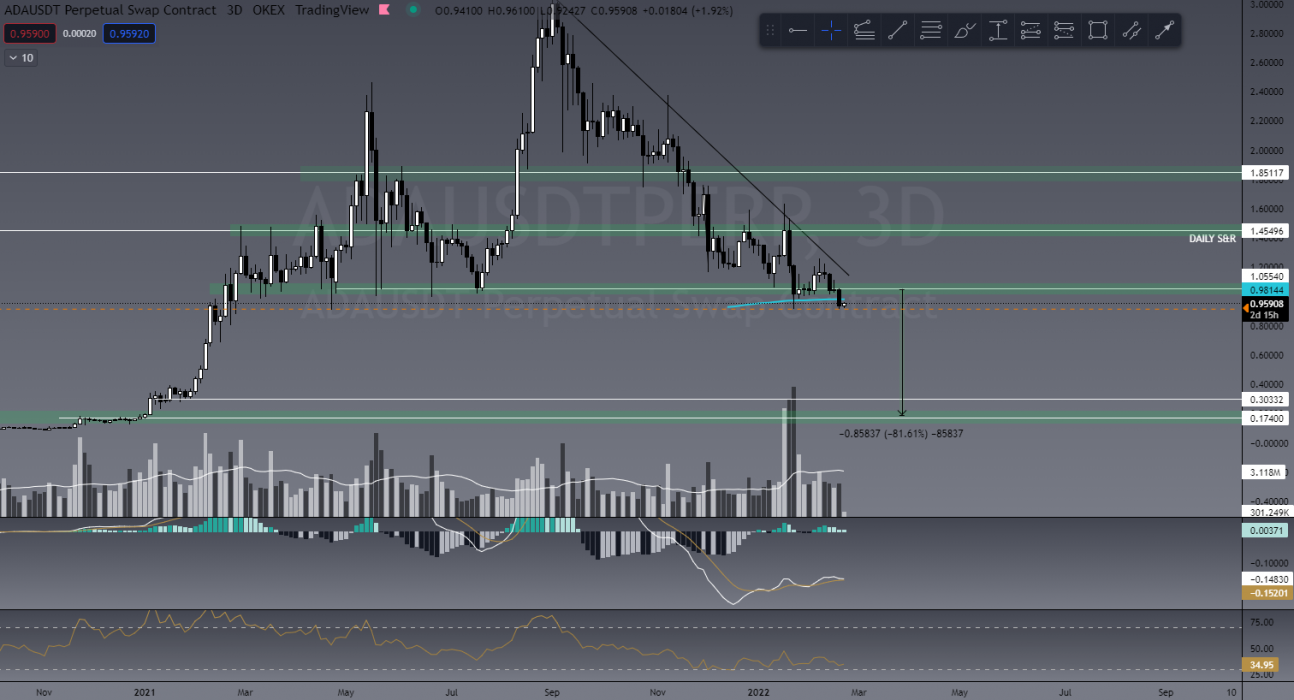
ADA/USDT

I’m finally in! For those of you who have been following along, I have been waiting for this trade since November 2021 and first shared this here in an early December article. At the risk of repeating myself enough to annoy readers, this still looks primed for me! A potential 80% drop can be seen here on ADA, and if BTC continues to drop there’s absolutely no reason for people to think this can’t happen. I know A LOT of holders of this coin get quite upset when you post a bearish chart, but it’s important not to get emotionally attached to a coin when investing your hard-earned money.

ADA/USDT

TORN/USDT

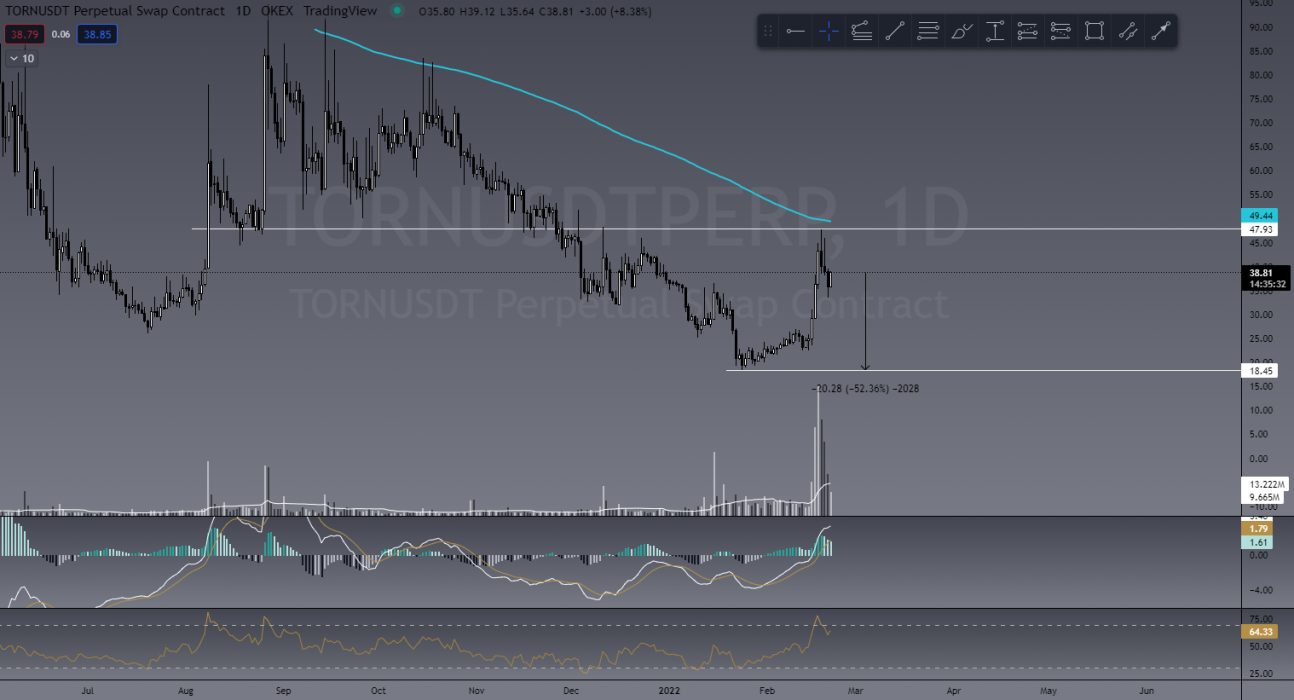
Another one found in Thursday’s market scan is TORN. With a potential 50% drop, it’s one we’re keeping an eye on and some have entered already.

TORN/USDT

NOTE:

I just wanted to mention that in a lot of social media posts I see on Facebook, Twitter and even YouTube, there are A LOT of people sharing bullish charts and have been for months. It’s for this reason we continue to caution people when we’re seeing a bearish outlook despite the amount of negativity we receive. It’s incredibly important to not blindly follow ANYONE (myself included). I’ve seen too many people lose money as a result, so I encourage you to at the very least learn the basics before entering the markets. No matter where you decide to learn, please do it!


Learn to Trade

We are giving away 3 months FREE TradeRoom (valued at $300) to those who join our Trading Fundamentals course starting February 28!

The Crypto Den is holding its first of only two trading courses for 2022 on February 28! That’s right, we will only be running two programs in 2022! What makes us different? Our lessons are LIVE and come with a community where you submit your homework and receive feedback to ensure you understand what we teach!

Duration: 6 week course
Date/Time: Live trading course twice a week – Mon & Wed at 7pm AEST
Frequency: We now run our LIVE course only twice per year
Location: Zoom Webinar
From: February 28 to April 13

The Crypto Den’s Trading Fundamentals trading course is a LIVE interactive course designed to teach you how to trade the crypto markets from absolute beginner level!

Our six-week program teaches you how to set up your trade accounts using reputable exchanges and brokers, how to read the charts using technical analysis, and to protect your capital using effective risk management strategies.

We have taught thousands of students in the past five years how to trade these volatile and highly profitable markets. See our REAL reviews from REAL students.

Using ZOOM twice a week, all of our lessons are LIVE and recorded so you can access them over and over again in our structured course through our website and smartphone app. Lessons come with homework and online quizzes, as well as an amazing online and private community of students.

So what are you waiting for? Join now to start learning!


Already Know How to Trade?

Invite to Join our TradeRoom

If you’d like to become a better trader, you’re invited to join our TradeRoom where we share daily charts and market analysis. In our community we strongly encourage and teach correct risk management strategies to keep our members safe in this new volatile crypto market.
Join our “Apprentice” plan now for your 7-day trial.


The Crypto Den was created in 2017 to help the rapidly growing crypto community learn and understand the fundamentals of digital currencies and how to trade them. 

Since then we have taught thousands of members the basics of technical analysis and trading strategies to further progress and perfect their trading abilities.

In the TradeRoom you will be included in a supportive environment which encourages personal growth, education and community support.

It’s a place to share your trading ideas and follow other experienced traders’ feeds to help keep your finger on the pulse of such a volatile market!

Categories
Market Analysis The Crypto Den

TradeRoom: Our Weekly Crypto Trades Analysis – Feb 15, 2022

Welcome to this weekly series from the TradeRoom. My name is Dave and I’m the founder of The Crypto Den, an Australian-based crypto trading and education community aiming to give you the knowledge to take your trading game to the next level.

Crypto Market Outlook

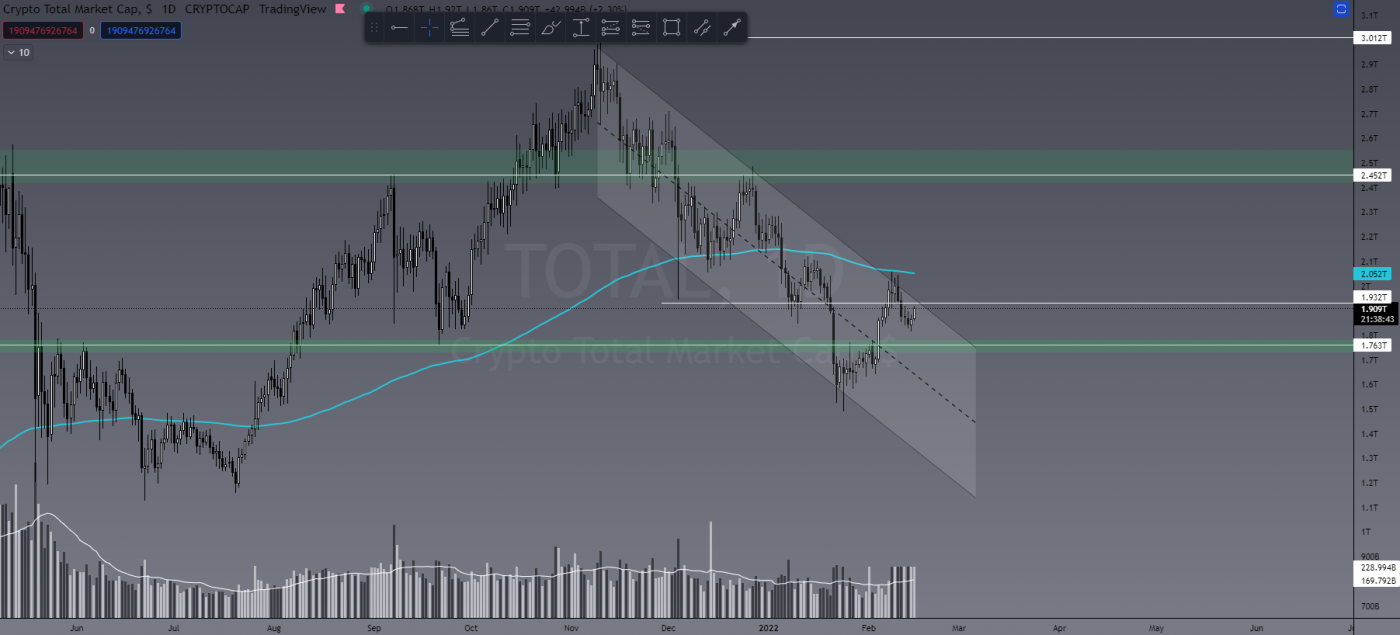
The TOTAL cryptocurrency marketcap is sitting at US$1.9 trillion, which is where it was two weeks ago. It’s also still trending down in this big bearish channel keeping to a bearish market structure. What this tells me is we have seen the relief rally we alluded to in the last article but still not enough influx of capital to see a breakout into a new structure. It’s bearish until it’s not! A breakout of this channel and above the daily 200 EMA will add US$200 billion of capital back into the market. When this happens, we might get excited.

Total crypto market cap – 1 day chart

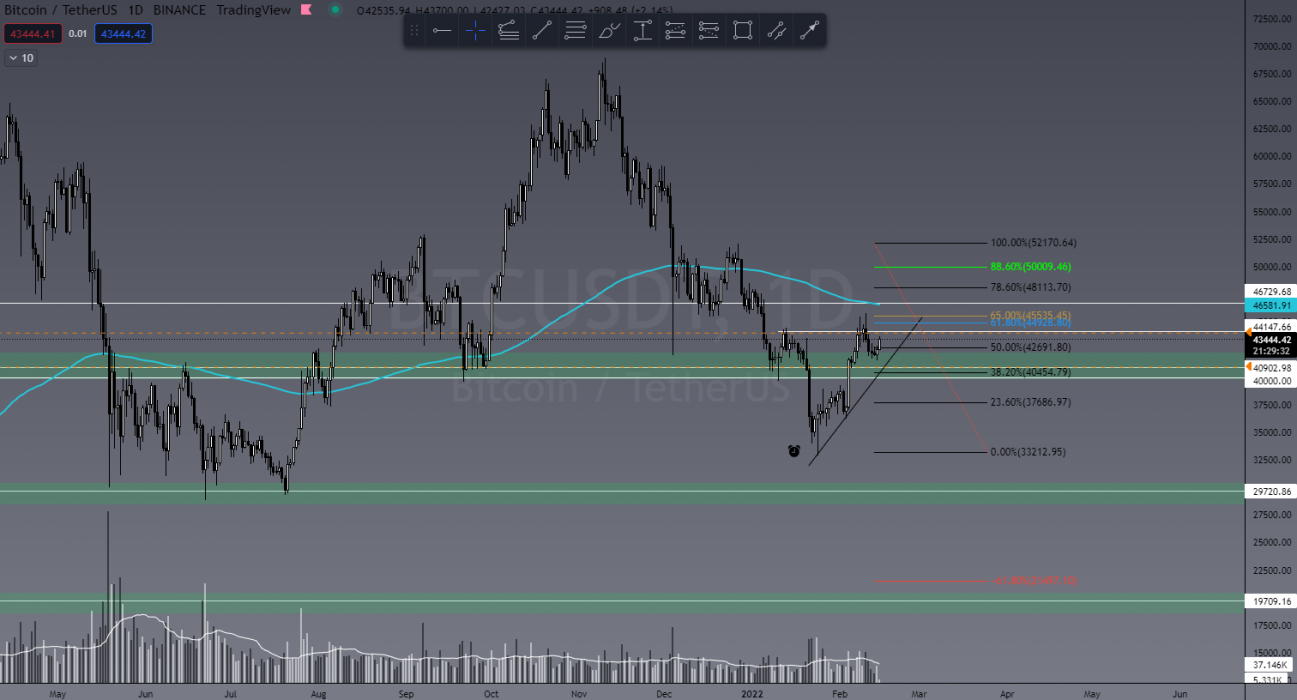
Bitcoin to me is still failing to show any real volume. Typical of a bear flag setup, we see a relief rally/dead cat bounce with lowering volume indicative of continuation to the downside. This relief rally has pulled BTC back to the 618 Fibonacci from the last swing, which as most of our trading room members now know is a common retracement level.

Until BTC breaks out above the daily 200 EMA and above US$53,000, the bear case seems much stronger than the bull.

BTC/USDT – 1 day chart

Something else to note at the moment is the stability of the global economy. We have the stock market selling off while gold and oil surge. Big players are hedging, in my opinion, and with the threat of war in Eastern Europe, we’re seeing oil prices rise. As much as I’m somewhat a BTC maxi, I’m not sure it’s matured enough yet to become a hedge in times of uncertainty, like precious metals can be.


Last Week’s Performance

I’m currently still in quite a few short positions, which I’ve shared in our Facebook Group if you’d like to check them out. I’ll share a couple of wins and losses with you from the past week below.

XTZ/USDT

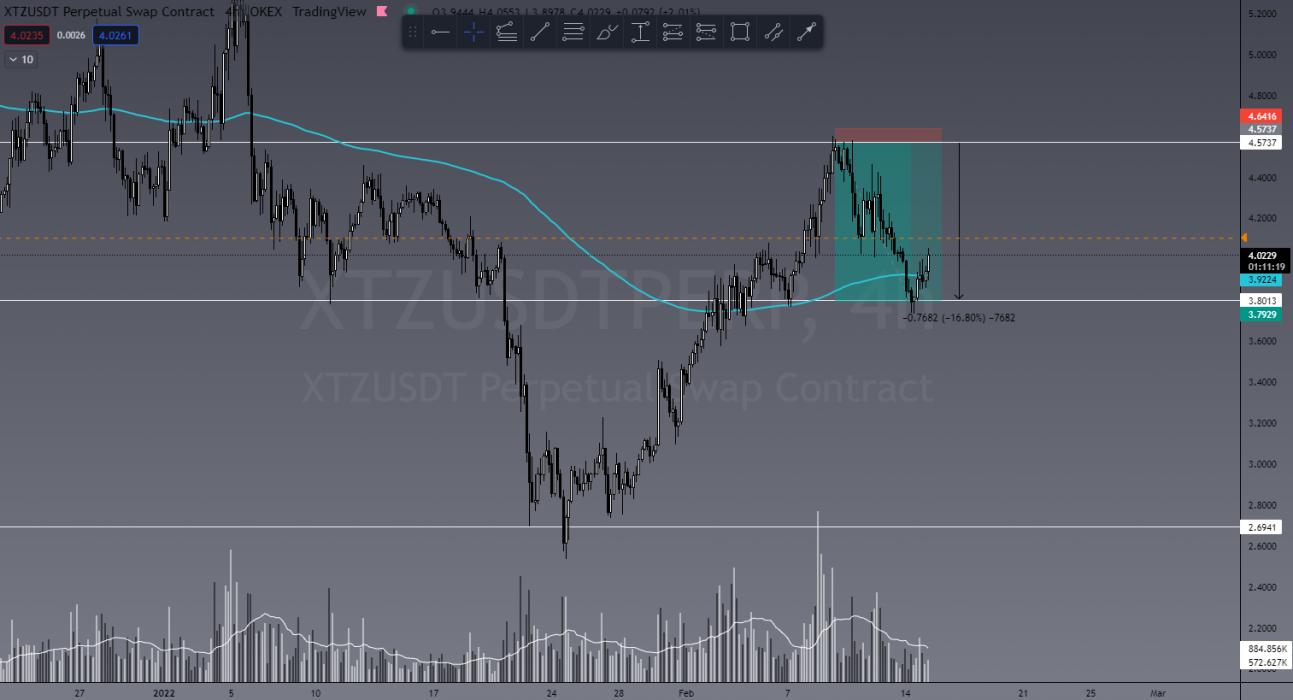
Textbook trade here. Entered short at resistance, took profit at support. Doesn’t get simpler than that! I took 70% of that position off the table and moved the stop loss into a positive position.

XTZ/USDT

UNI/USDT

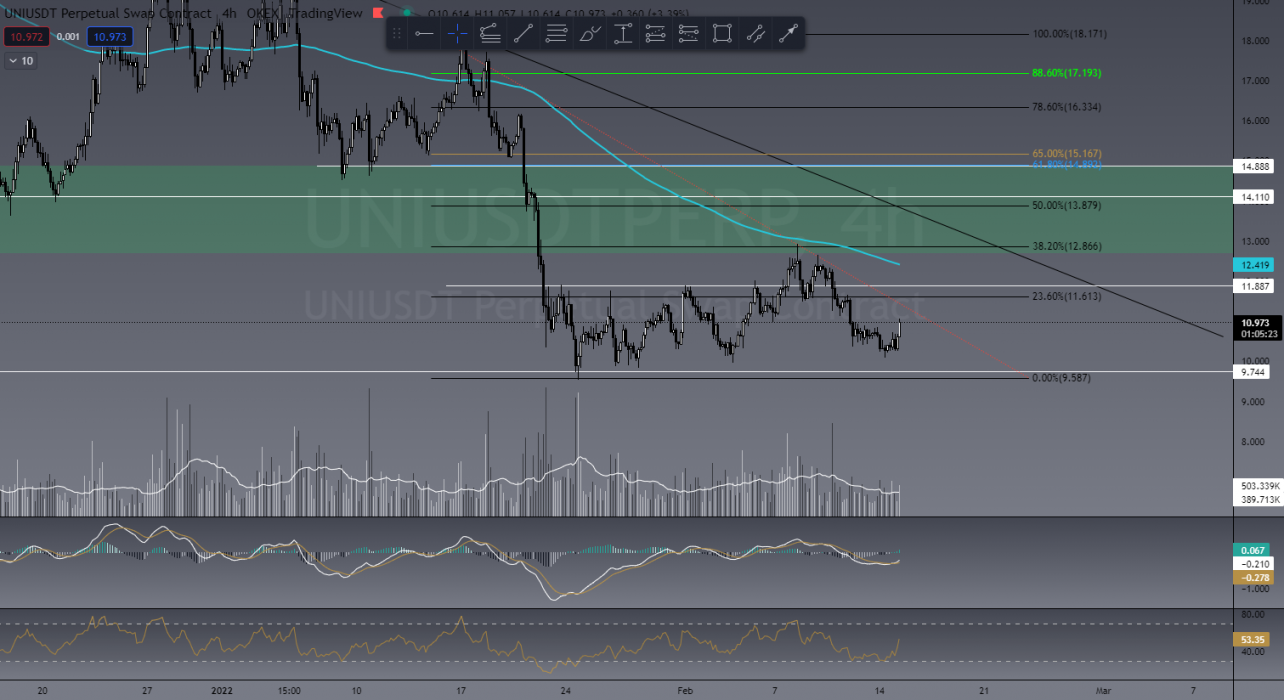
This isn’t necessarily a losing trade because it never reached our entry, but I thought I’d add this in here to show you can’t win them all. This UNI chart was in last week’s article showing a potential short trade, however we never reached that point and in hindsight we could have entered short from the 200 EMA line. Win some, lose some.

UNI/USDT

ENJ/USDT

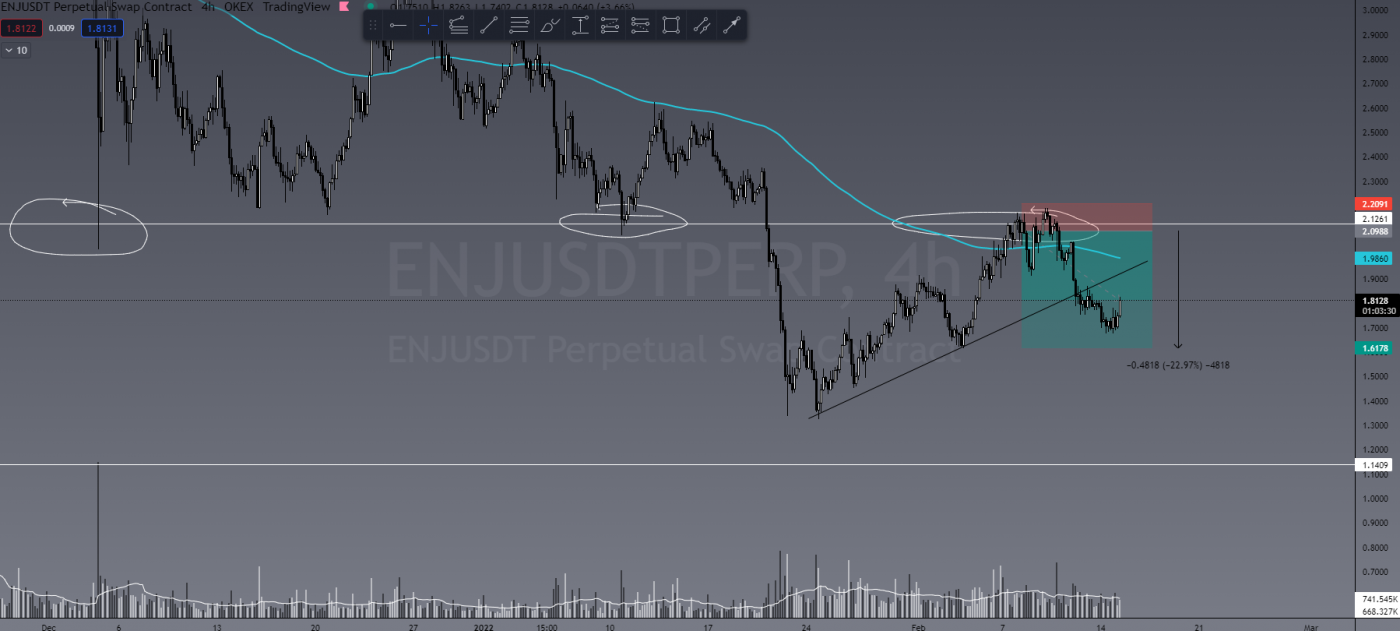
Another basic yet effective trade was a short in ENJ. The rising price with lowering volume (just like BTC at the moment), sprinkled with some bearish divergence at resistance, revealed a nice, short entry point!

ENJ/USDT

This Week’s Trades

There are two short trades in particular I’m eager for this week! I’ve been sharing information about them both for quite a while in our trading group.

DOGE/USDT

Again with DOGE!

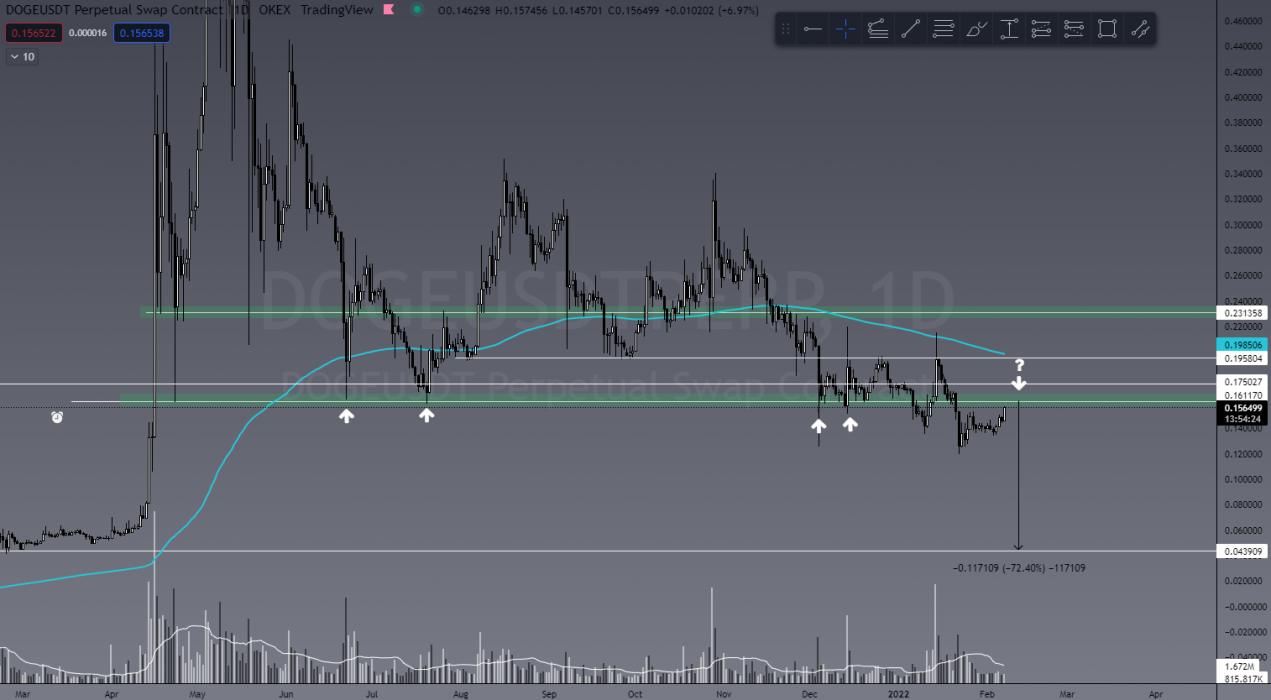
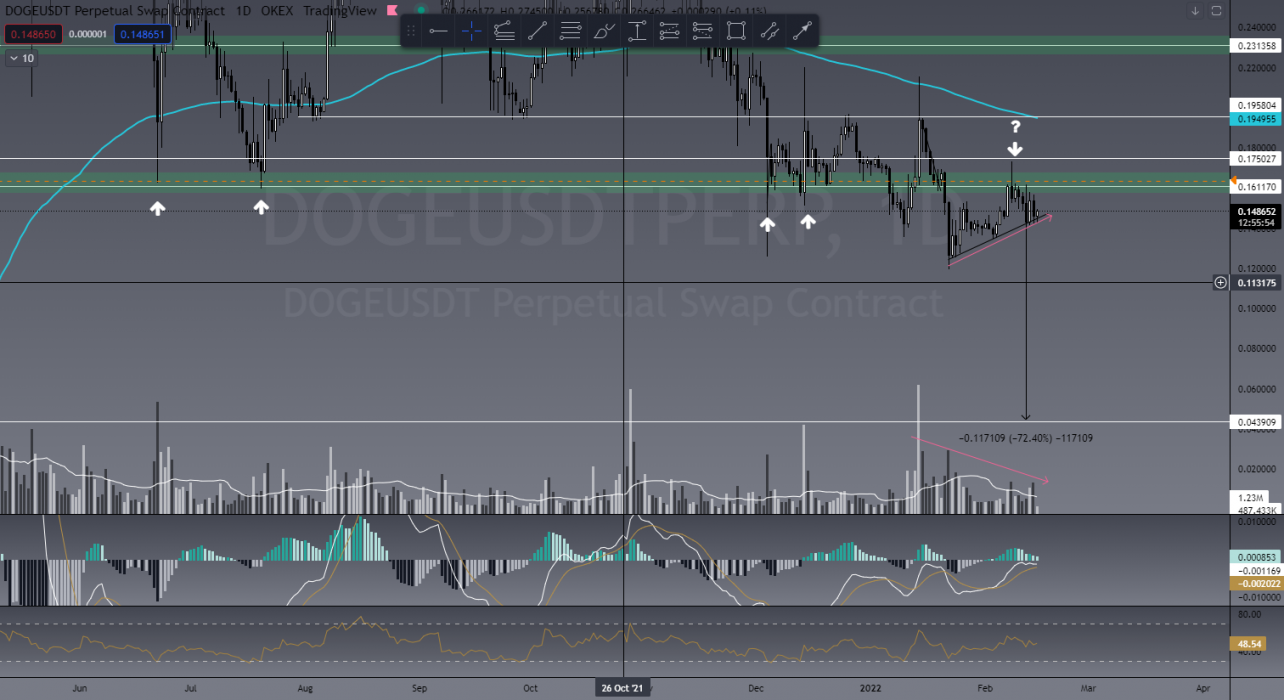
I STILL see a potential 70% drop on DOGE, currently rising in price on lowering volume as well. I’m currently in a short on DOGE from US$0.16 and, as I’ve been saying, there’s NOTHING stopping a US$0.04 price target!

DOGE chart from my last article
Currrtent DOGE chart zoomed in

ADA/USDT

I’ve been writing about this trade since December 6, 2021, and still waiting! When this daily support level around the US$1.00 mark finally breaks, ADA could likely see an enormous drop up to 80%! In my opinion, this is highly likely if the BTC bearflag (mentioned at the start of this article) plays out.

ADA/USDT

Learn to Trade

We are giving away 3 months FREE TradeRoom (valued at $300) to those who join our Trading Fundamentals course starting February 28!

The Crypto Den is holding its first of only two trading courses for 2022 on February 28! That’s right, we will only be running two programs in 2022! What makes us different? Our lessons are LIVE and come with a community where you submit your homework and receive feedback to ensure you understand what we teach!

Duration: 6 week course
Date/Time: Live trading course twice a week – Mon & Wed at 7pm AEST
Frequency: We now run our LIVE course only twice per year
Location: Zoom Webinar
From: February 28 to April 13

The Crypto Den’s Trading Fundamentals trading course is a LIVE interactive course designed to teach you how to trade the crypto markets from absolute beginner level!

Our six-week program teaches you how to set up your trade accounts using reputable exchanges and brokers, how to read the charts using technical analysis, and to protect your capital using effective risk management strategies.

We have taught thousands of students in the past five years how to trade these volatile and highly profitable markets. See our REAL reviews from REAL students.

Using ZOOM twice a week, all of our lessons are LIVE and recorded so you can access them over and over again in our structured course through our website and smartphone app. Lessons come with homework and online quizzes, as well as an amazing online and private community of students.

So what are you waiting for? Join now to start learning!


Already Know How to Trade?

Invite to Join our TradeRoom

If you’d like to become a better trader, you’re invited to join our TradeRoom where we share daily charts and market analysis. In our community we strongly encourage and teach correct risk management strategies to keep our members safe in this new volatile crypto market.
Join our “Apprentice” plan now for your 7-day trial.


The Crypto Den was created in 2017 to help the rapidly growing crypto community learn and understand the fundamentals of digital currencies and how to trade them. 

Since then we have taught thousands of members the basics of technical analysis and trading strategies to further progress and perfect their trading abilities.

In the TradeRoom you will be included in a supportive environment which encourages personal growth, education and community support.

It’s a place to share your trading ideas and follow other experienced traders’ feeds to help keep your finger on the pulse of such a volatile market!

Categories
Market Analysis The Crypto Den

TradeRoom: Our Weekly Crypto Trades Analysis – Dec 27, 2021

Welcome to this weekly series from the TradeRoom. My name is Dave and I’m the founder of The Crypto Den, an Australian-based crypto trading and education community aiming to give you the knowledge to take your trading game to the next level.

Crypto Market Outlook

Merry Christmas everyone! I hope you all took some time away from the charts and crypto to spend it with loved ones!

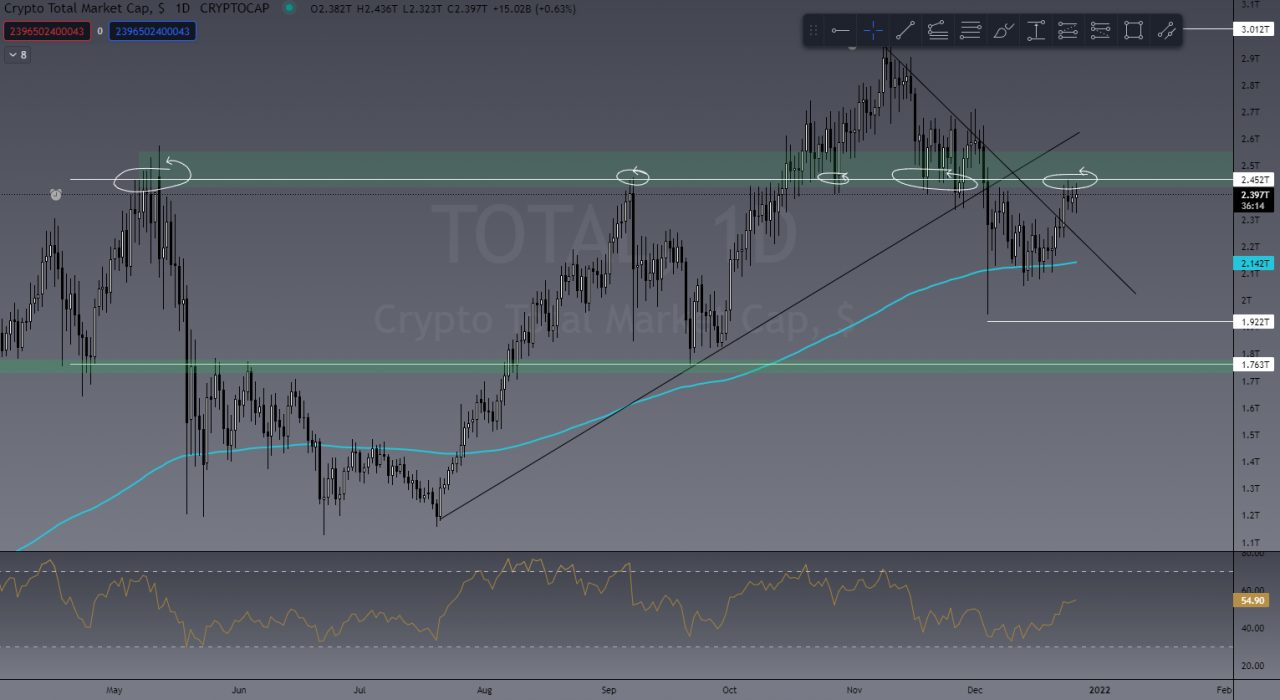
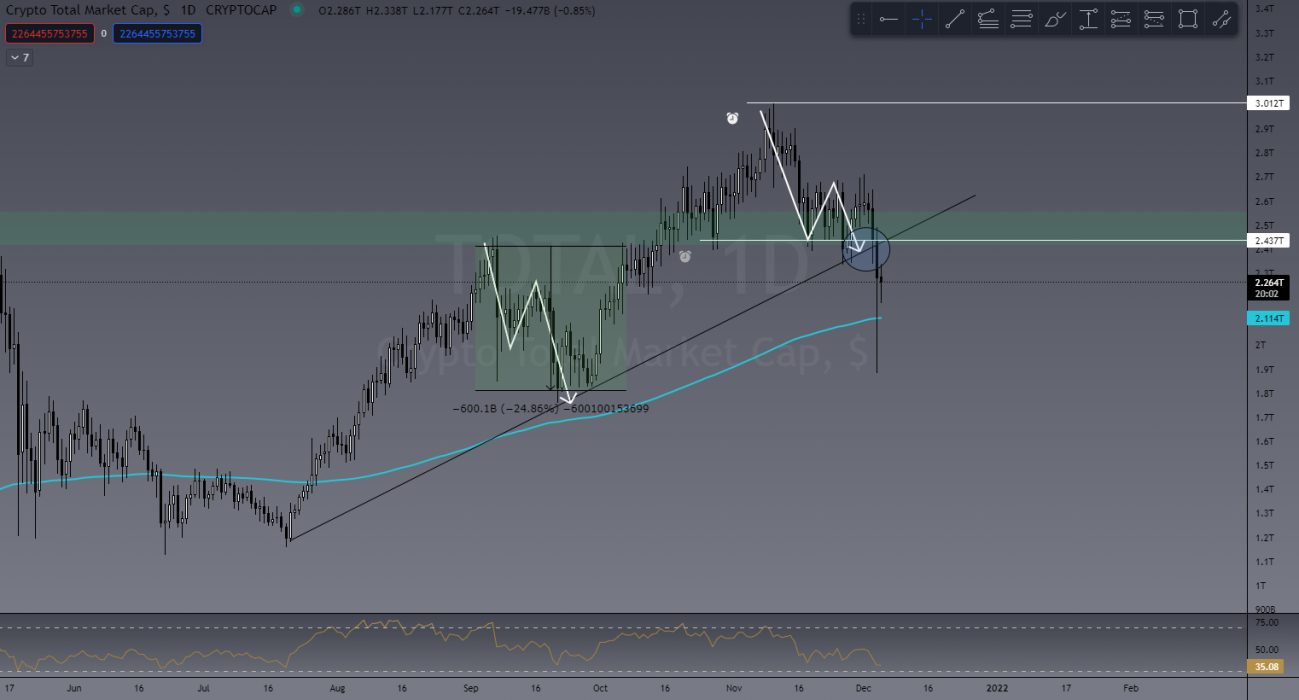
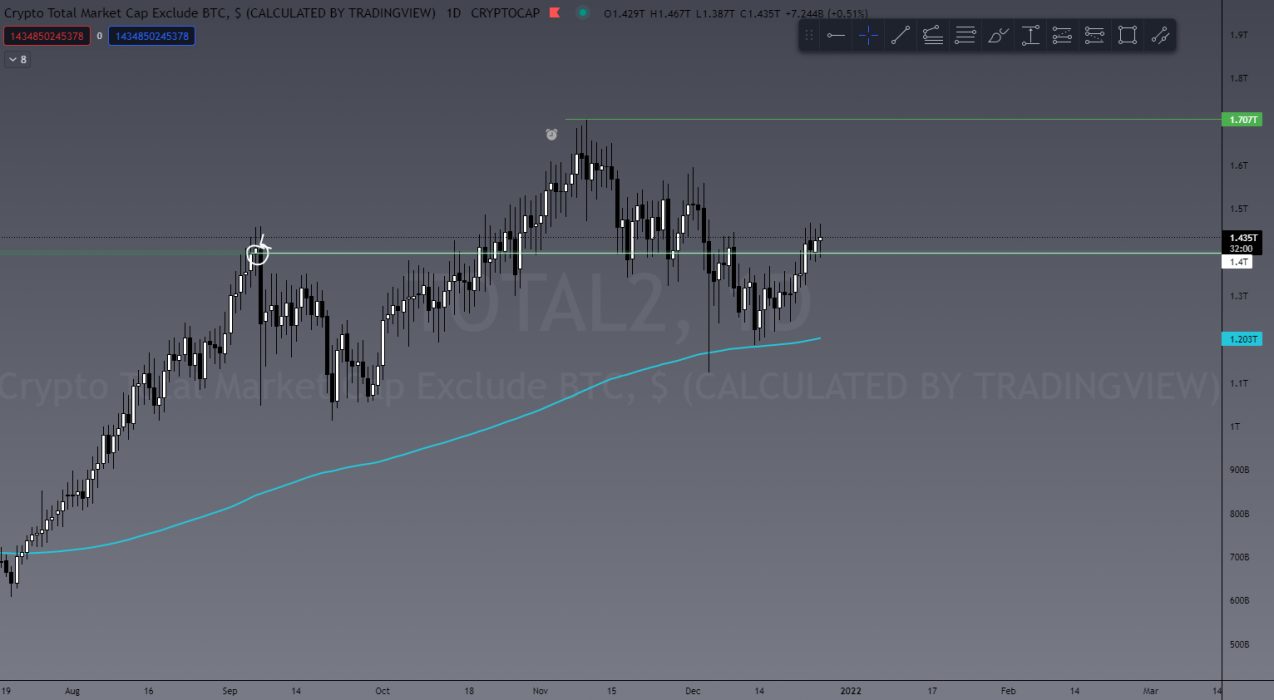
In last week’s article I mentioned that the TOTAL crypto cap needed to hold on that daily 200 EMA, which it did and then continued to break out from its new downtrend. It’s currently finding resistance at US$2.4 trillion.

TOTAL Crypto Market cap

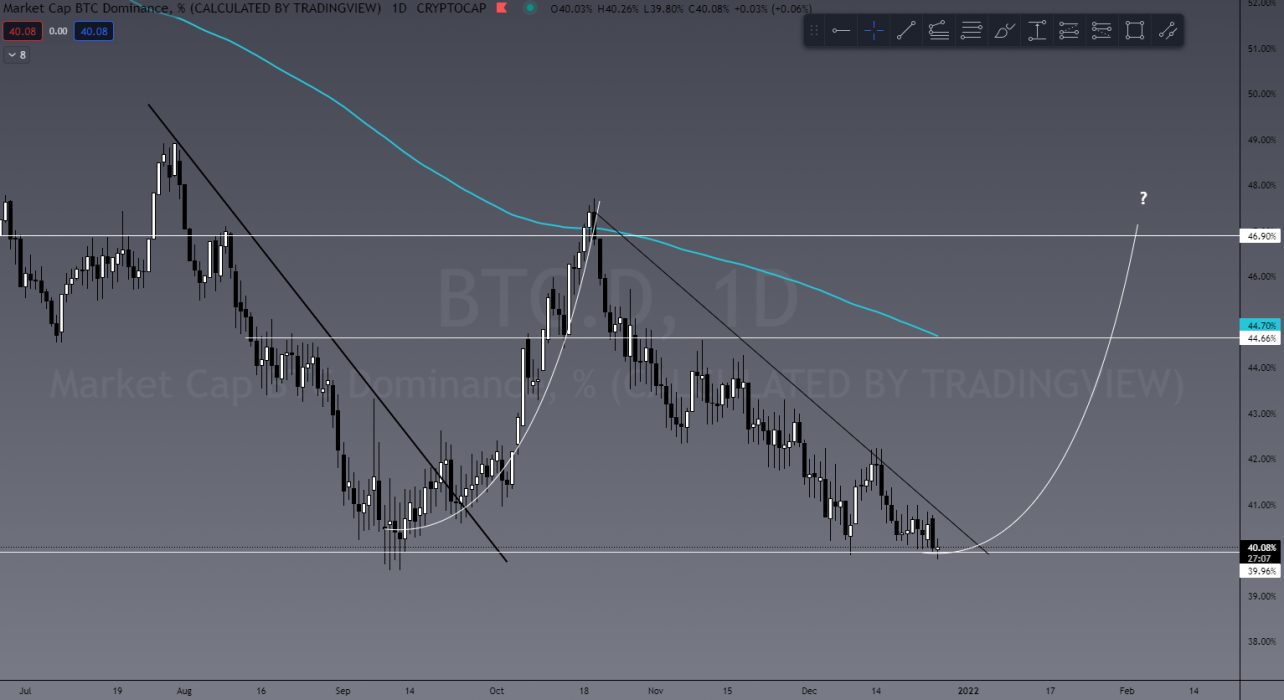
The TOTAL2 (ALTcoin market) has broken its US$1.4 trillion resistance, while the BTC.D (% of BTC dominance over the market) has dropped again significantly, underlining the fact that the capital flow has been in ALTS.

Something to note at this point is that BTC.D is now at a support level and could see a reversal, meaning capital flow will leave ALTS and go back into BTC.

TOTAL2 (ALTcoin market cap)
BTC.D Chart

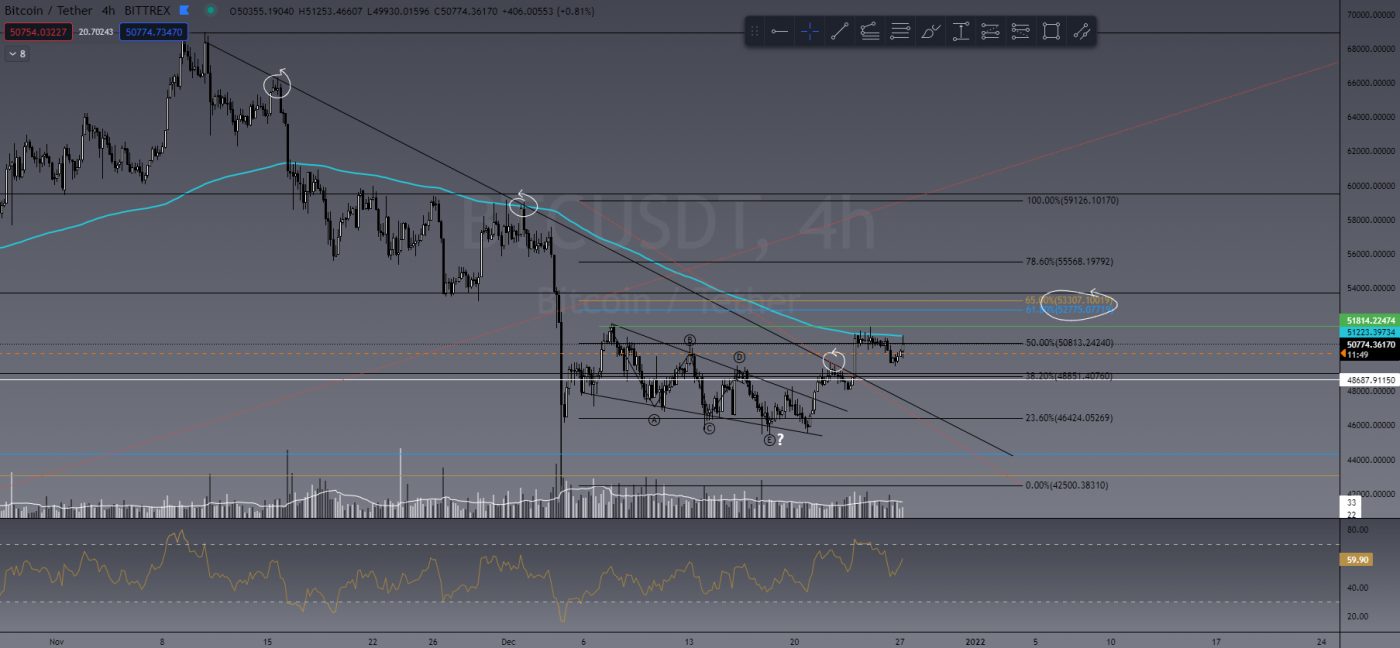
What plays well with this possibility is that BTC seems to have broken out of the current local downtrend and performed a support/resistance flip on the 4H chart, and is currently being snagged on that daily 200EMA. Breaking through this level around US$51,800 will help confirm a bullish bias for me. The last thing we’d need to see is a clear and strong breach of the 618 retrace (Fibonacci level) of the US$52,000 – US$53,000 zone WITH VOLUME. Failing that, I see another test of US$45,000.

BTC/USDT

Last Week’s Performance

BTC/USDT

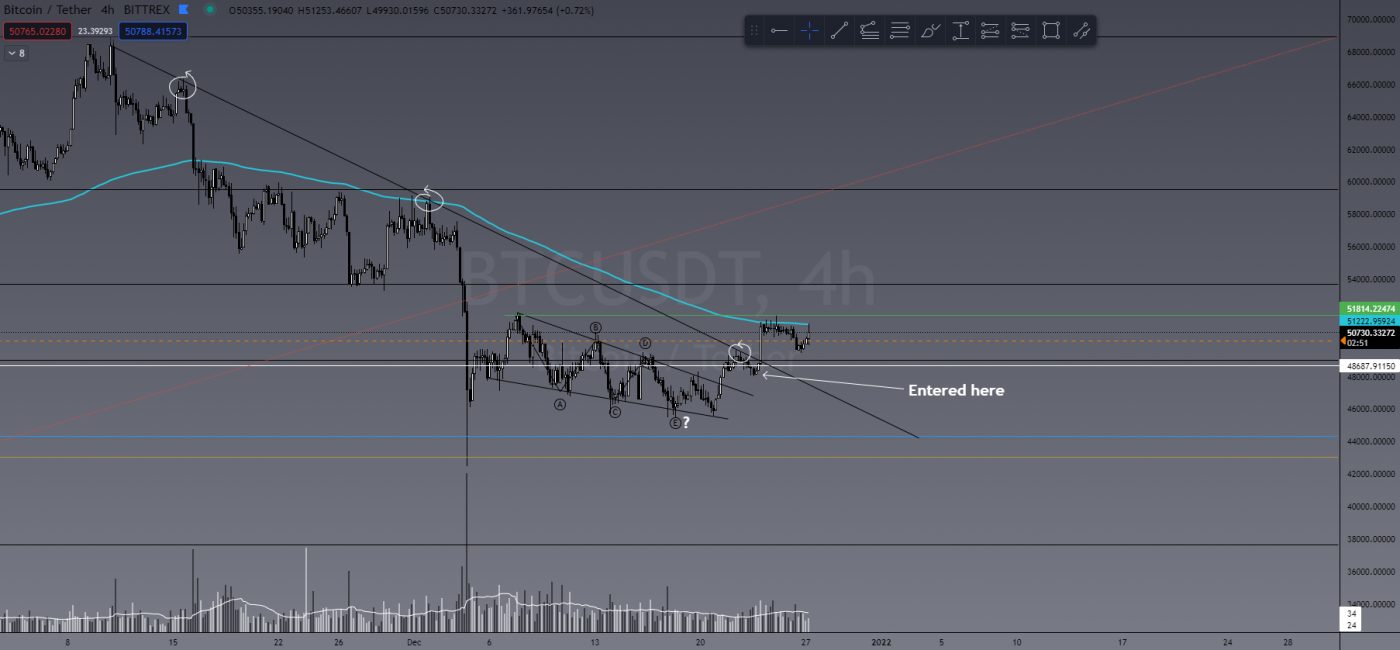
Following my short trade on BTC I wrote about last week, I’m now in a BTC long trade and currently sitting at around 100%. I waited for the breakout of the falling wedge and a retest of support before entering. Not a massive trade just yet, but waiting for confirmation is always the safest trade to take.

BTC/USDT

SHIB/USDT

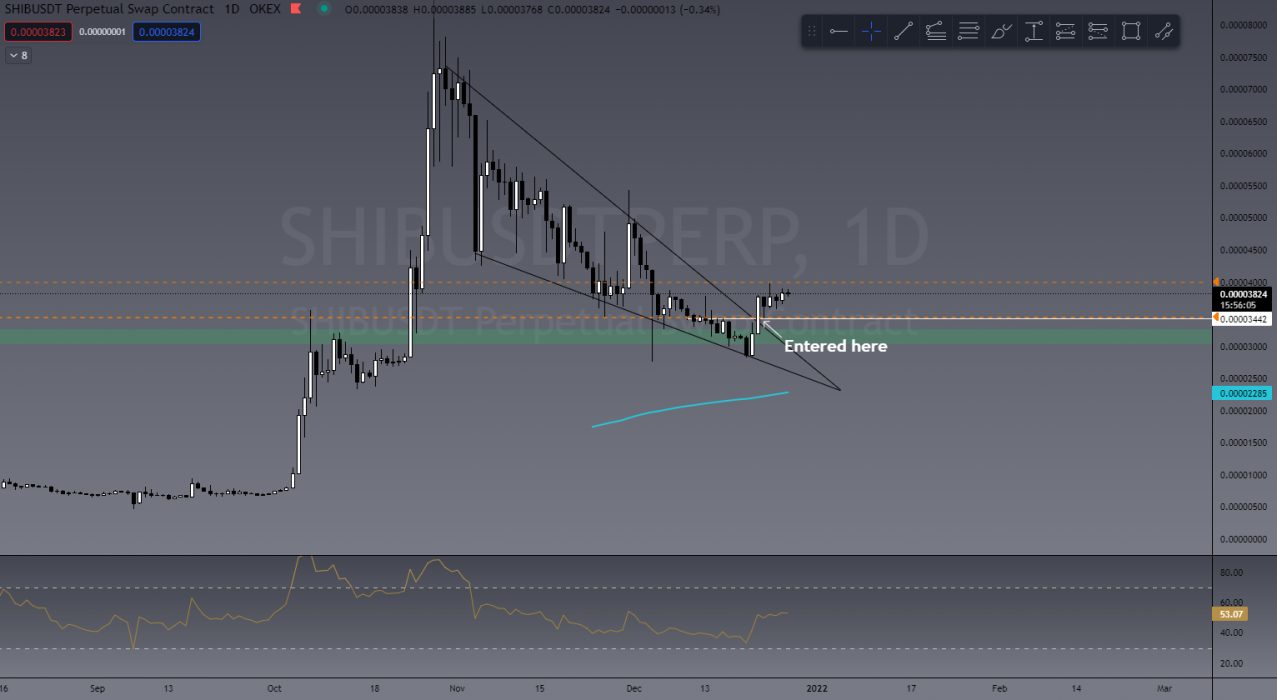
It almost hurts me to even write this but traders see opportunity in anything – even overhyped, high supply coins. SHIB, for example, broke out of a falling wedge that started at the beginning of November. With the hype around this coin lining up with the technicals, it was a no-brainer entry. Although I didn’t enter on the initial pump, I waited for the safest entry. Price action broke out and then tested new support, which is where I entered my longs. This thing has crazy volatility, so it’s likely a riskier trade than most.

SHIB/USDT

NEO/USDT

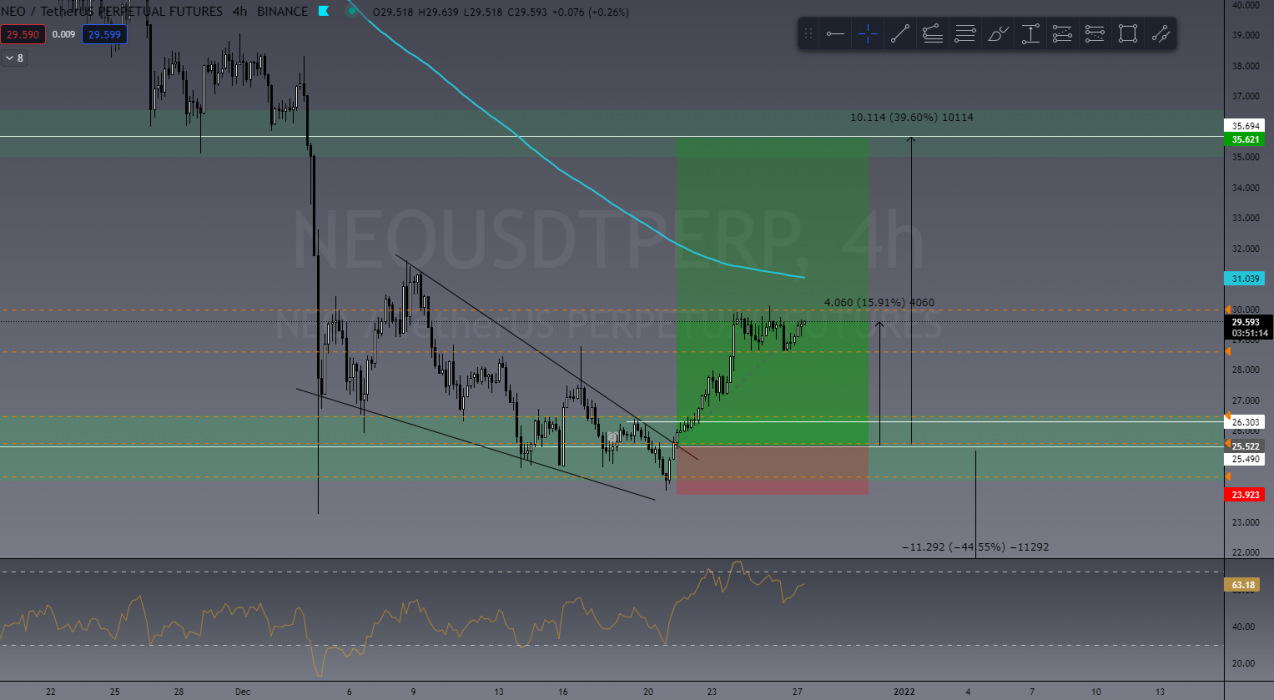
I took the NEO long that I also mentioned in last week’s article. I got the hammer and bullish engulfing I was hoping to see and entered on the breakout. It’s currently up 120% and I’m looking for that to double if BTC sees some bullish PA (price action).

NEO/USDT

SOL/USDT

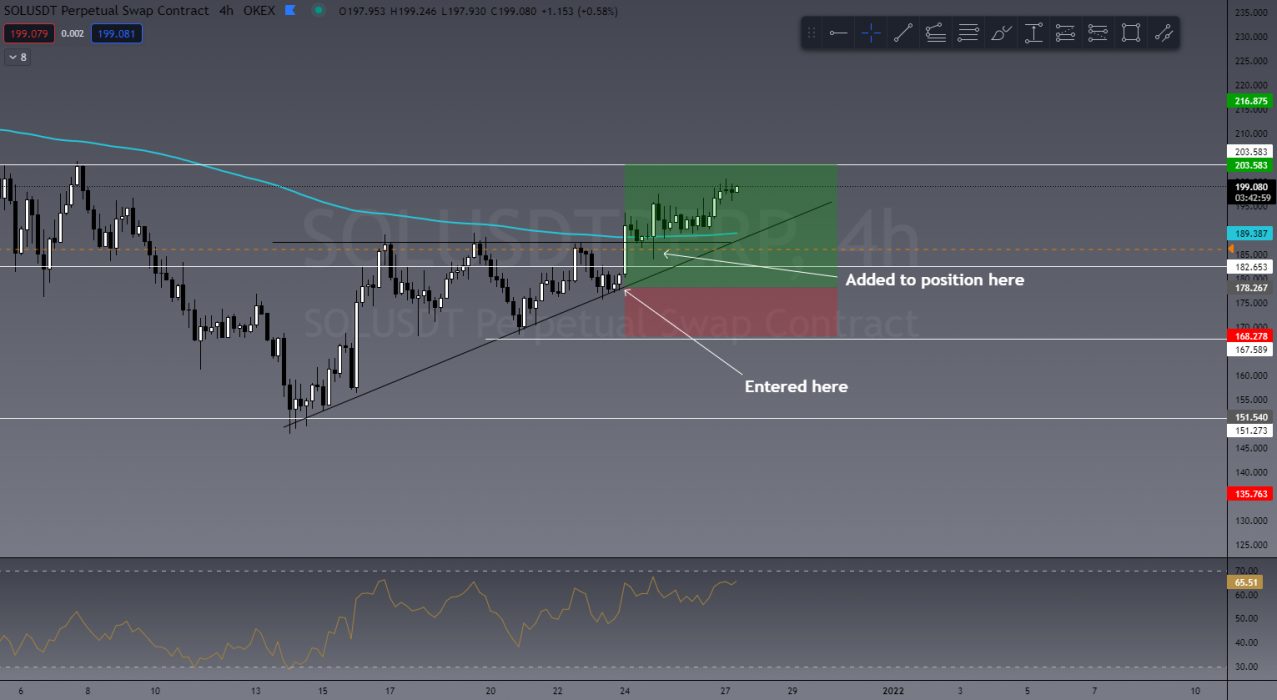
One of my favourites to trade is SOL. Finding a bounce off trend forming ascending triangle (3 touch rule), I decided to enter. I added to my position after the triangle break and retest (we teach how to trade these patterns in our Trading Fundamentals course). Trade is still active, currently up 179%.

SOL/USDT

This Week’s Trades

FIL/USDT

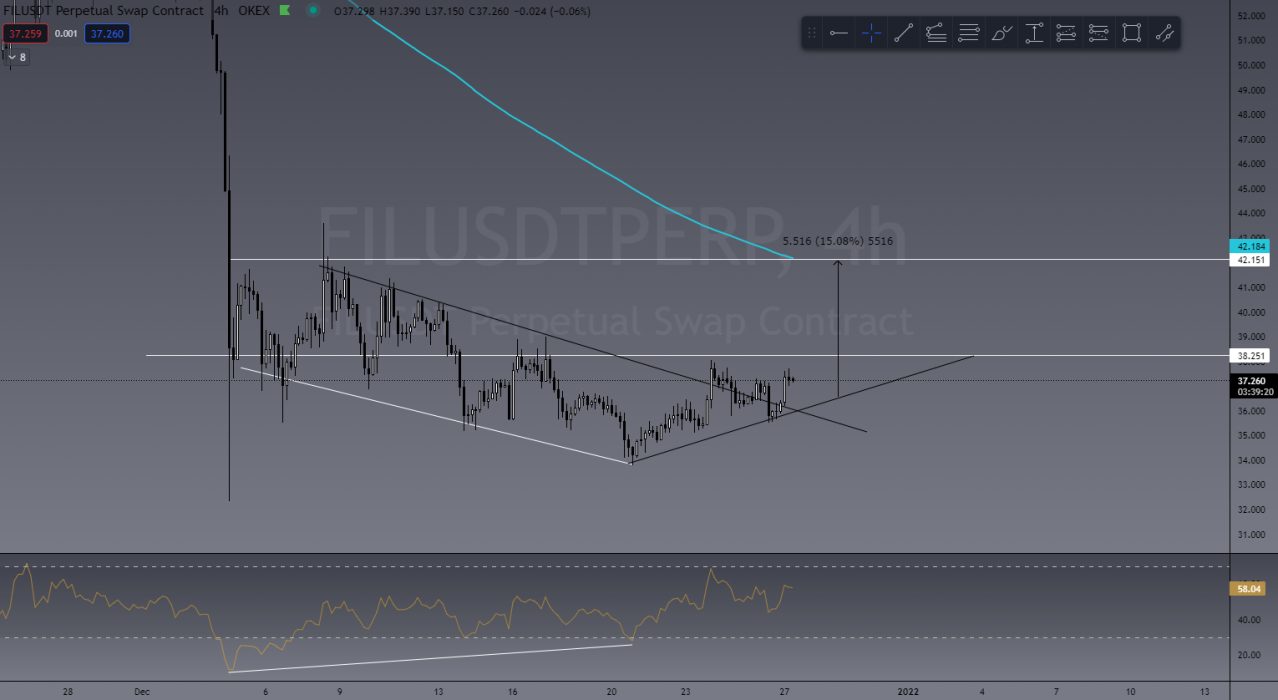
I’m currently watching FIL because it hasn’t yet reacted to the market the way many other ALTs have. I’m seeing a really large bullish divergence and a downtrend break. What I’m waiting to see is a break and test of US$38.00, or a retest on trend for an entry.

FIL/USDT

MANA/USDT

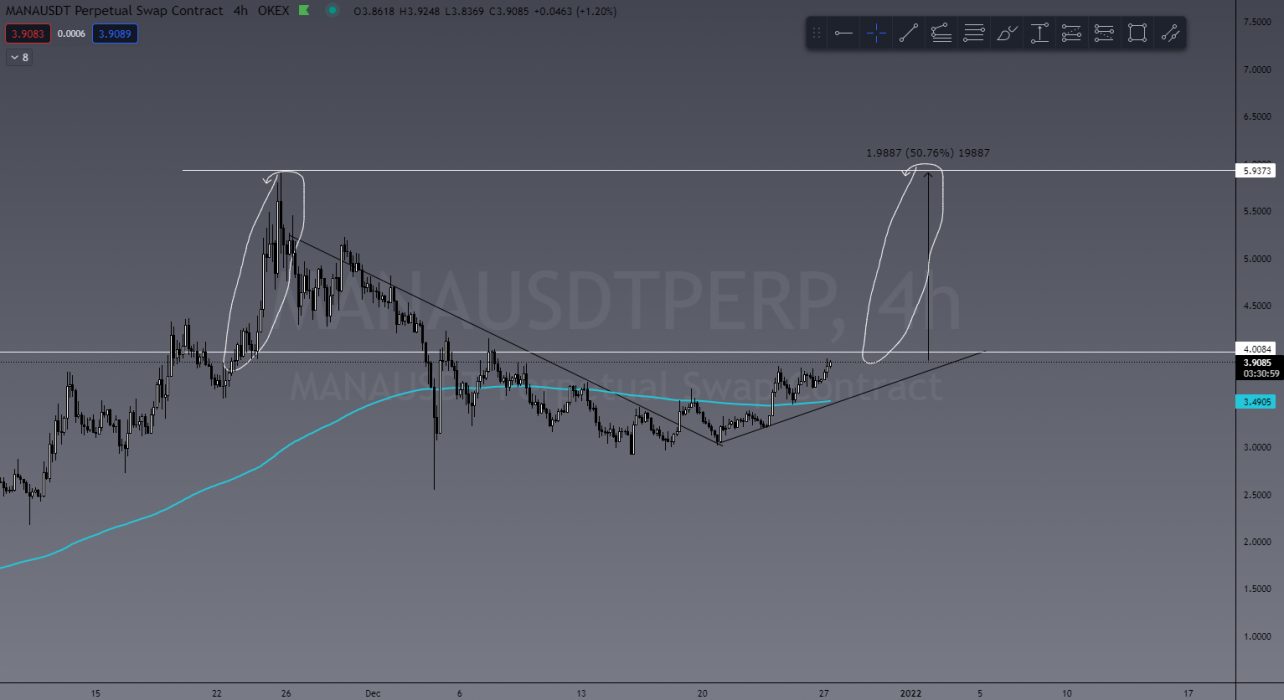
I’m actually already in a MANA trade and wanted to add this to the list due to its crazy potential. If this US$4.00 resistance breaks, I see potential here for MANA to do 50% or more.

MANA/USDT

Invite to Join our TradeRoom

If you’d like to become a better trader, you’re invited to join our TradeRoom where we share daily charts and market analysis. In our community we strongly encourage and teach correct risk management strategies to keep our members safe in this new volatile crypto market.
Join our “Apprentice” plan now for your 7-day trial.


The Crypto Den was created in 2017 to help the rapidly growing crypto community learn and understand the fundamentals of digital currencies and how to trade them. 

Since then we have taught thousands of members the basics of technical analysis and trading strategies to further progress and perfect their trading abilities.

In the TradeRoom you will be included in a supportive environment which encourages personal growth, education and community support.

It’s a place to share your trading ideas and follow other experienced traders’ feeds to help keep your finger on the pulse of such a volatile market!

Categories
Market Analysis The Crypto Den

TradeRoom: Our Weekly Crypto Trades Analysis – Dec 6, 2021

Welcome to this weekly series from the TradeRoom. My name is Dave and I’m the founder of The Crypto Den, an Australian-based crypto trading and education community aiming to give you the knowledge to take your trading game to the next level.

Crypto Market Outlook

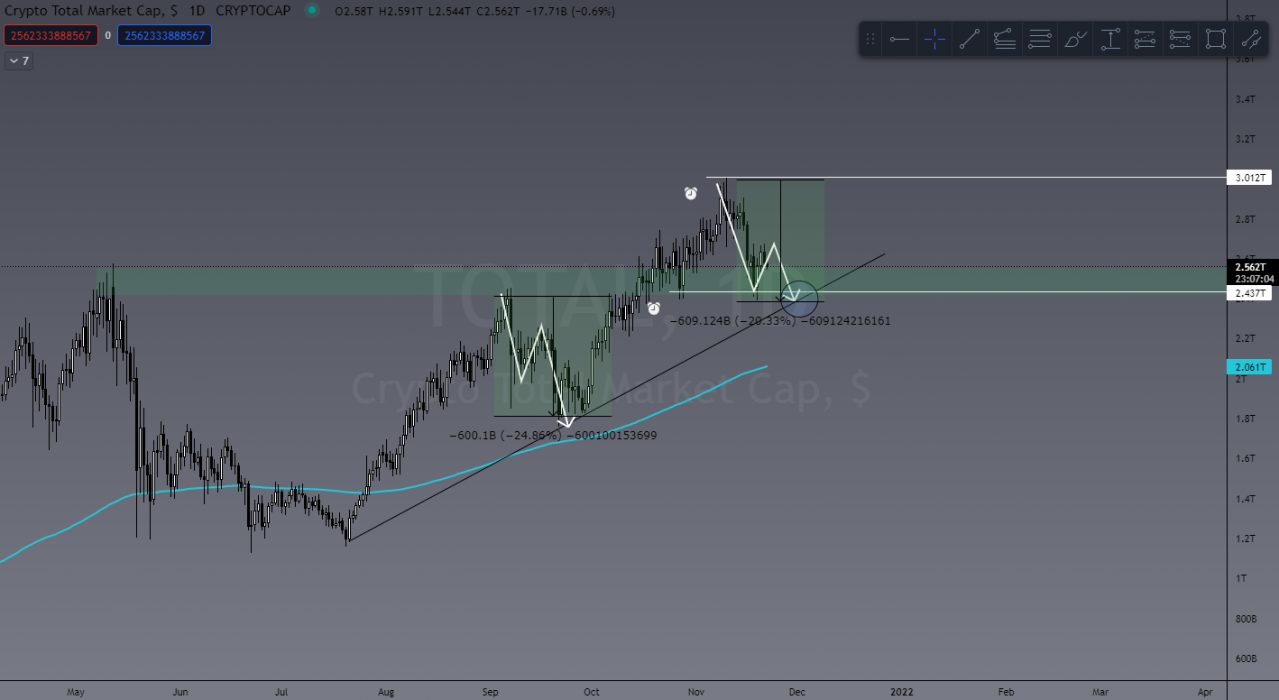
Wow! What a week! Well, we alluded to a decent drop in TOTAL crypto cap over the past couple of weeks, but even this Trader wasn’t expecting an ADDITIONAL US$440 billion to get wiped out of the market. We’ve since clawed back US$365 billion of that, showing some strong bullish buyback, bringing the current TOTAL market cap back to US$2.26 trillion.

Remember it was only a couple of months ago we were all excited that the TOTAL hit its ATH again of just under US$2.5 trillion, so it’s not all bad!

TOTAL Crypto Market Cap

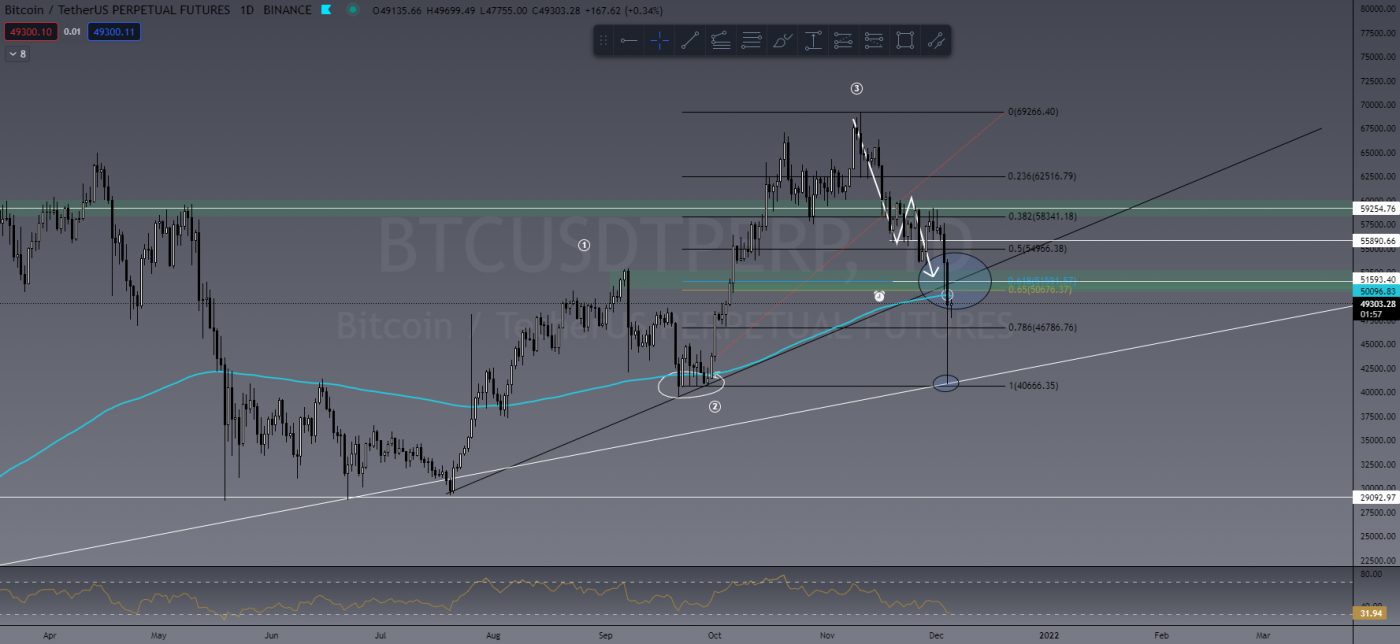
I had a target last week of US$51,500 for BTC. I was in an open short trade and BTC decided to blow right through that target and hit US$40,000. A US$13,000 daily candle! Now for me personally this was a good thing due to my open short trade, and I closed 50% of that trade at approximately US$45,000 and will let it play out from here.

Not so good for holders at the moment. If BTC fails to rally back above that daily 200 EMA (exponential moving average – blue line), then there could be a decent chance we see further downside. That said, I’m not feeling overly concerned just yet. I’m expecting a bullish push soon, although hedging my bets a little by keeping the remainder of my short trade open until the dust settles. ALWAYS wait for the dust to settle and a clear confirmation before entering a NEW position.
Current BTC daily chart

Ultimately I think we could see some more bearish action before a big bull run appears.


Last Week’s Performance

Well, last week we saw a lot of long positions get stopped out, some in profit, some not. This is why we teach you to use stop losses to mitigate risk! When BTC decides to nuke, the rest of the market follows.

For those of you in our TradeRoom it makes little difference if the market is going up or down because we can trade it both ways. So while some longs were getting stopped, we were scaling into shorts! Here are a couple of short trades from the week past.

LRC/USDT

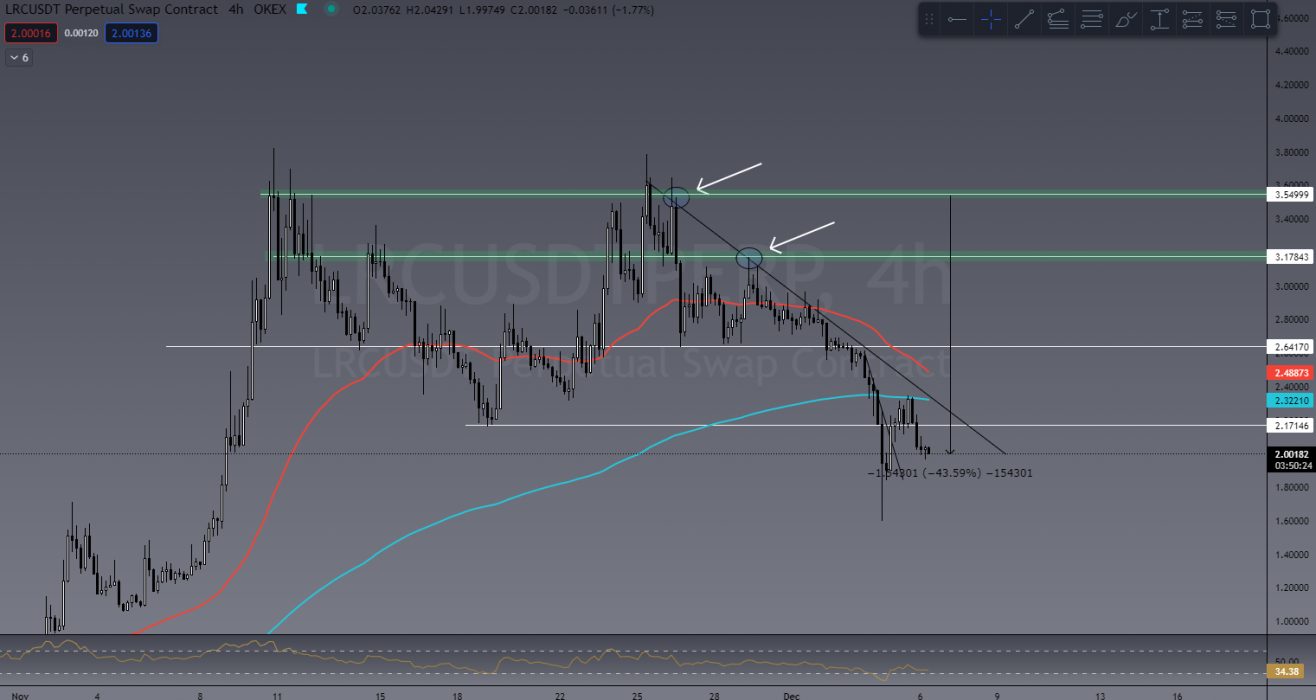
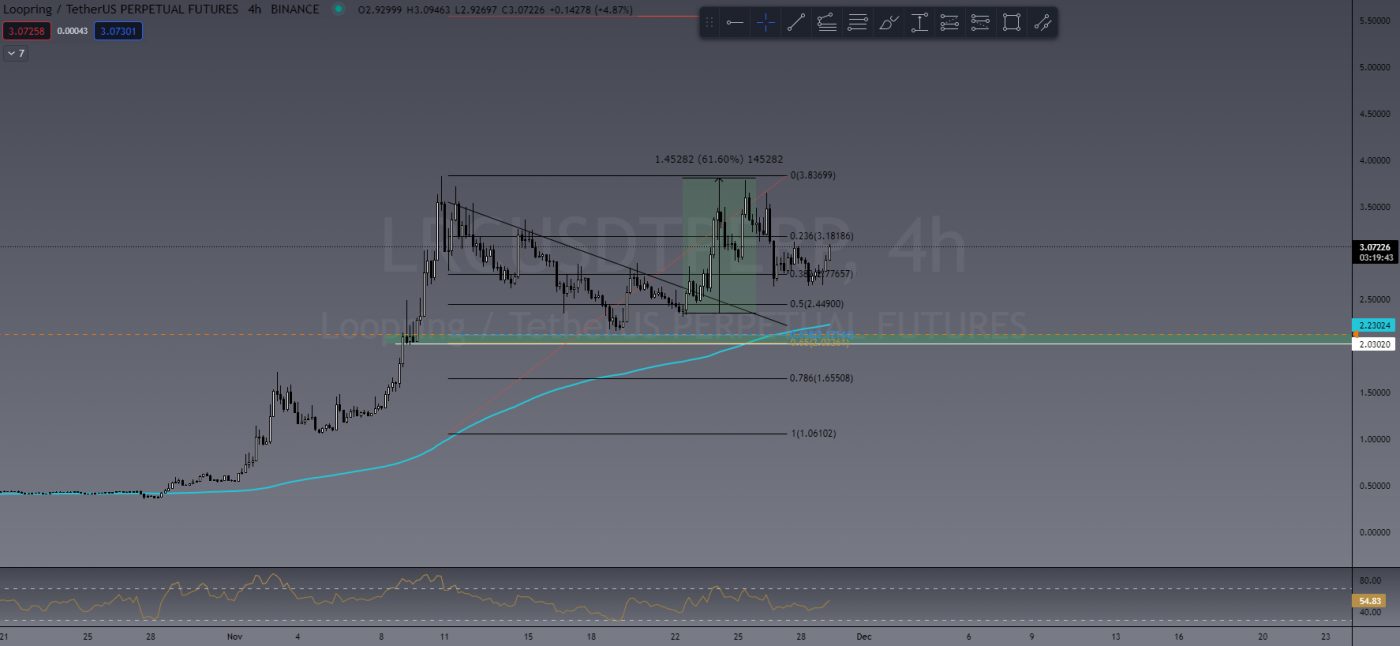
You can see in the chart below where I’ve entered short twice on LRC and the reasons why are as basic as it gets. Support and Resistance. LRC was approaching ATH again while the rest of the market started to bleed. I waited for that first Lower High (LH) and entered short. Then I waited for the second LH and added to that position after confirming downtrending market structure. I closed 50% of the trade at US$2.17 and let the rest ride – currently at a 430% win on a 10x trade.

LRC/USDT short trade

BTC/USD

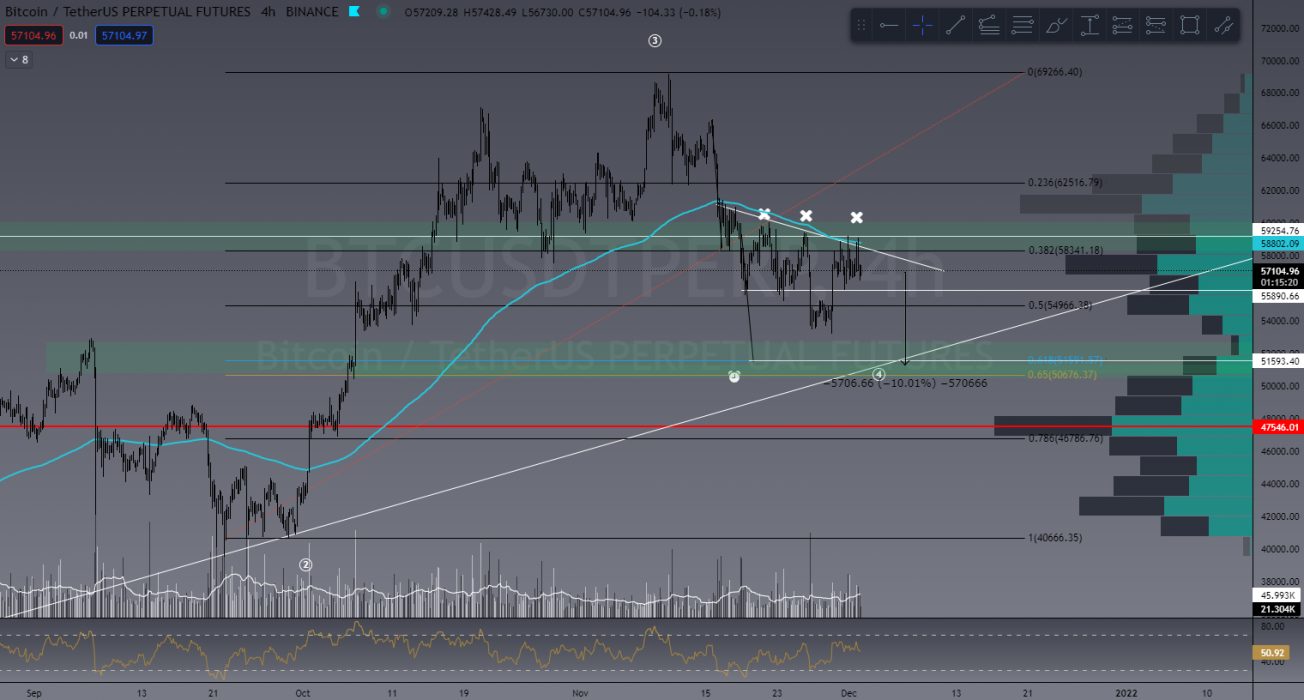
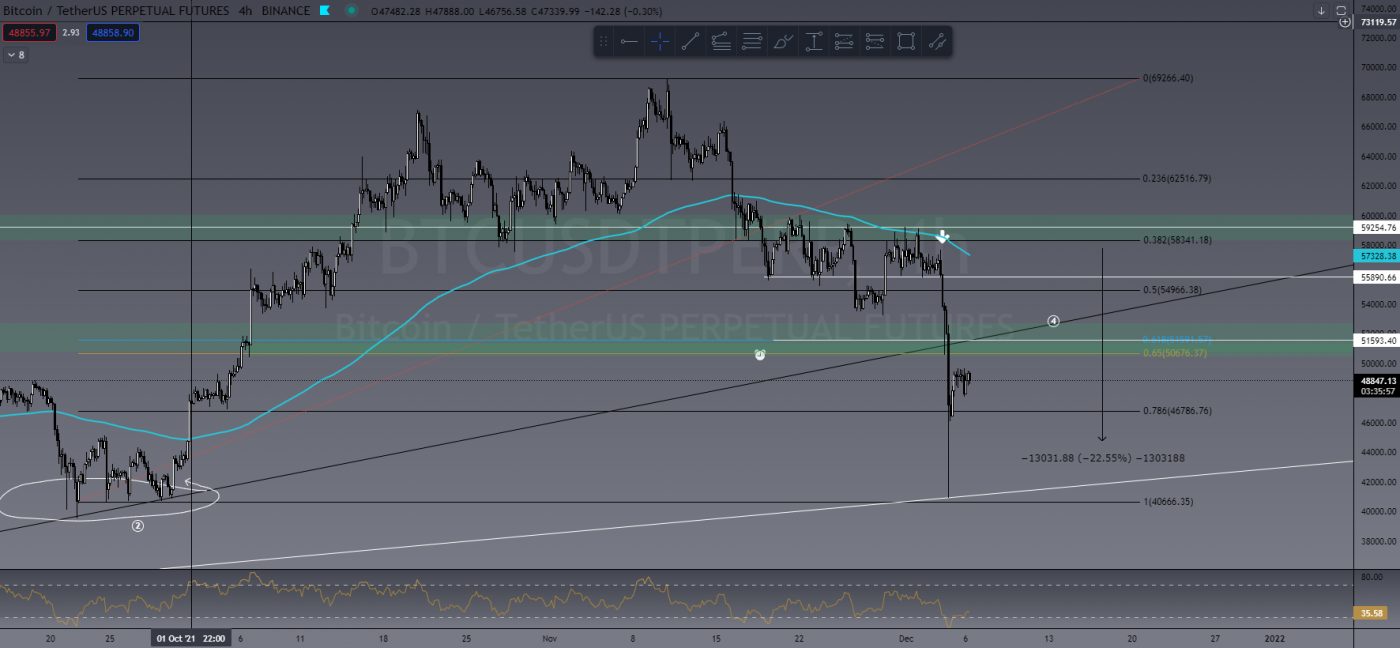
In a chart I shared in the TradeRoom last week, I outlined that BTC had three attempts at breaking through resistance and failed. Once again waiting for a LH to confirm, I entered short. I closed 50% of that position at approx. US$45,000 and will hedge my bets by letting the rest ride.

Our current position is 316% profit on a 20x trade.

BTC chart shared in TradeRoom
Current BTC chart showing my trade entry


STORJ/USDT

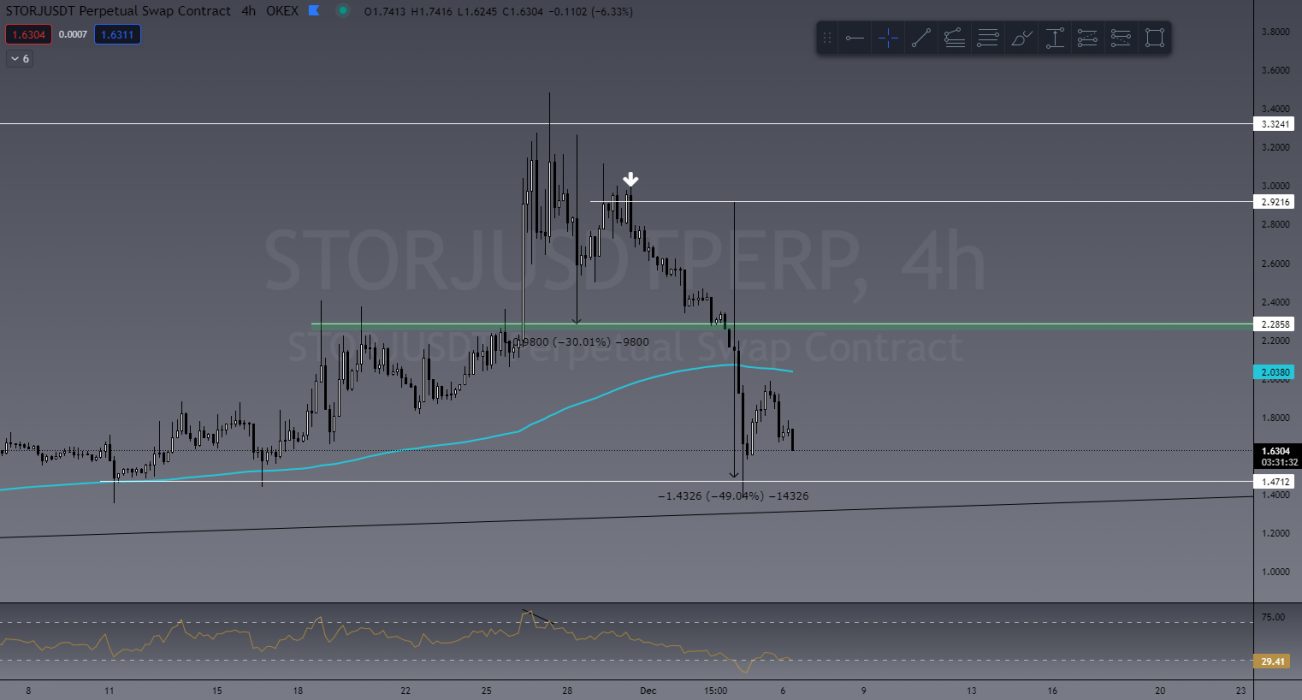
STORJ was approaching a resistance level at its previous ATH price point. After it rejected, I again waited for that LH to form and entered short at US$2.92 and closed 100% of the trade at US$1.47 for a 490% ROI on 10x trade. You can see how this trade played out below:
STORJ/USDT short trade

IMPORTANT NOTES ON SHORTING:

These trades taken this week have been short trades using leverage. The reason for this is simply because the market had been trending DOWN and this is how we profit from a bearish market. This cannot be done in a SPOT trading market, where your only option would be to sell and wait for a new buy level.
Shorting a market should only be done by experienced traders and should NOT be taken by beginners. While the profits I’ve mentioned above seem very attractive, it takes time to learn and practise this craft before being profitable.

If you would like to learn how to do this, TODAY IS THE LAST DAY you can register for our current trading course. Our next LIVE course will be in February 2022.


This Week’s Trades

ADA/USDT

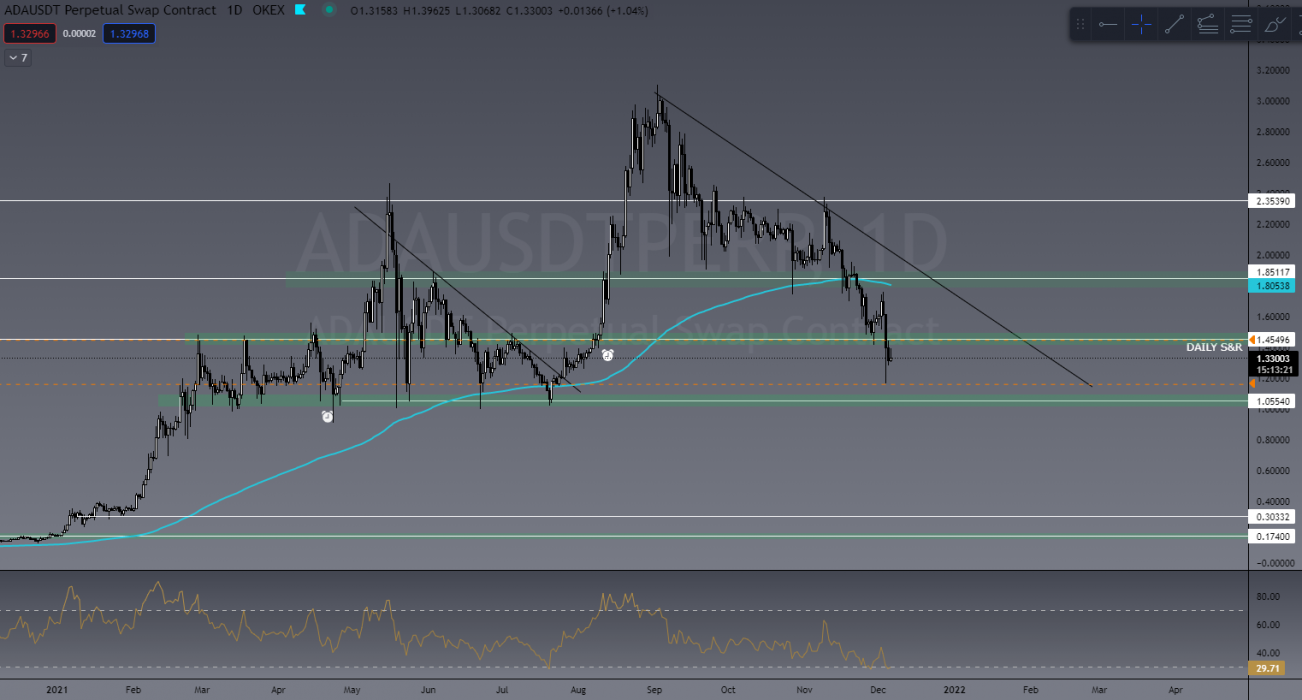
As I mentioned in last week’s article, I’m watching ADA pretty closely to come down and hit that US$1 level. Not only will I likely take longs here but will also buy in spot. This will ultimately depend highly on candlestick analysis in that area AND on what BTC is doing at the time. However, I still think this could present a good opportunity at this psychological level. If ADA breaks this level of support, then US$0.30 is on the table so it will be really important for US$1 to hold.

ADA/USDT

BTM/USDT

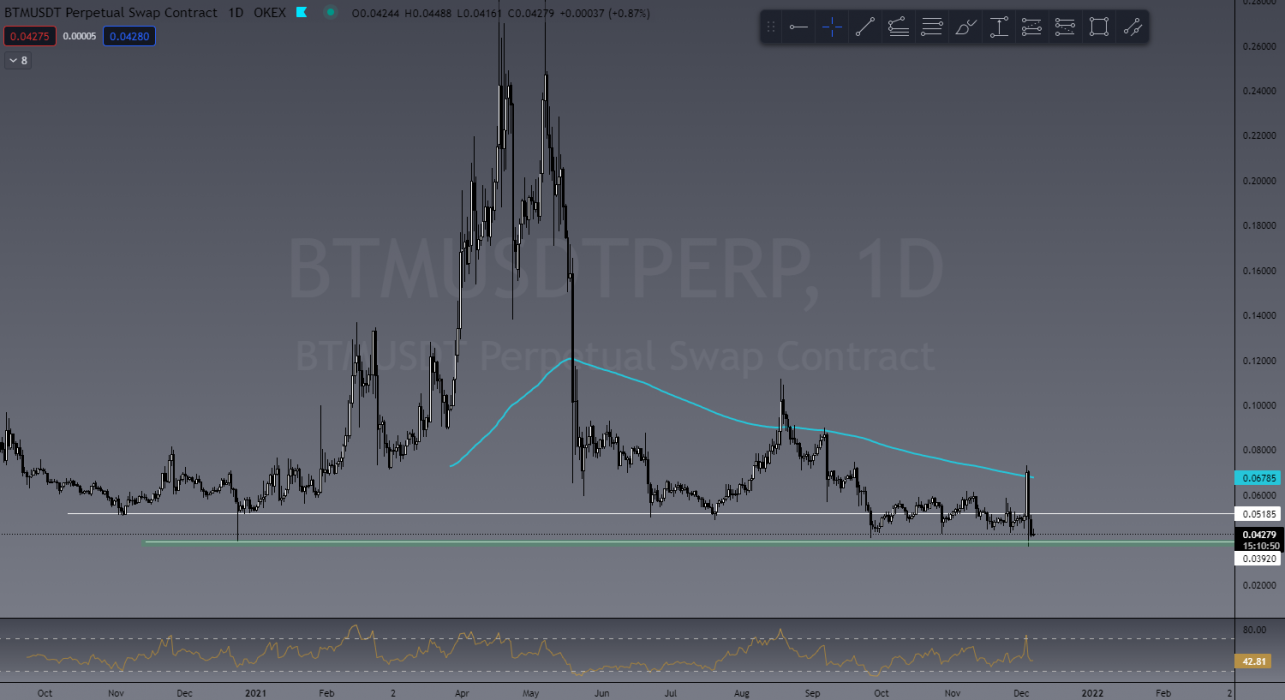
Another I’m watching pretty closely is BTM. Not a lot of price history for this one, but there could be opportunity here. This will depend heavily on BTC behaving as there are no more levels of support below the current price zone, meaning another drop will be forming all-time lows (ATL). From here there’s no data to base anything on so we use tools like market oscillators and Fibonacci to find key levels.

BTM/USDT

Invite to Join our TradeRoom

If you’d like to become a better trader, you’re invited to join our TradeRoom where we share daily charts and market analysis. In our community we strongly encourage and teach correct risk management strategies to keep our members safe in this new volatile crypto market.
Join our “Apprentice” plan now for your 7-day trial.


The Crypto Den was created in 2017 to help the rapidly growing crypto community learn and understand the fundamentals of digital currencies and how to trade them. 

Since then we have taught thousands of members the basics of technical analysis and trading strategies to further progress and perfect their trading abilities.

In the TradeRoom you will be included in a supportive environment which encourages personal growth, education and community support.

It’s a place to share your trading ideas and follow other experienced traders’ feeds to help keep your finger on the pulse of such a volatile market!

Categories
Market Analysis The Crypto Den

TradeRoom: Our Weekly Crypto Trades Analysis – Nov 29, 2021

Welcome to this weekly series from the TradeRoom. My name is Dave and I’m the founder of The Crypto Den, an Australian-based crypto trading and education community aiming to give you the knowledge to take your trading game to the next level.

Crypto Market Outlook

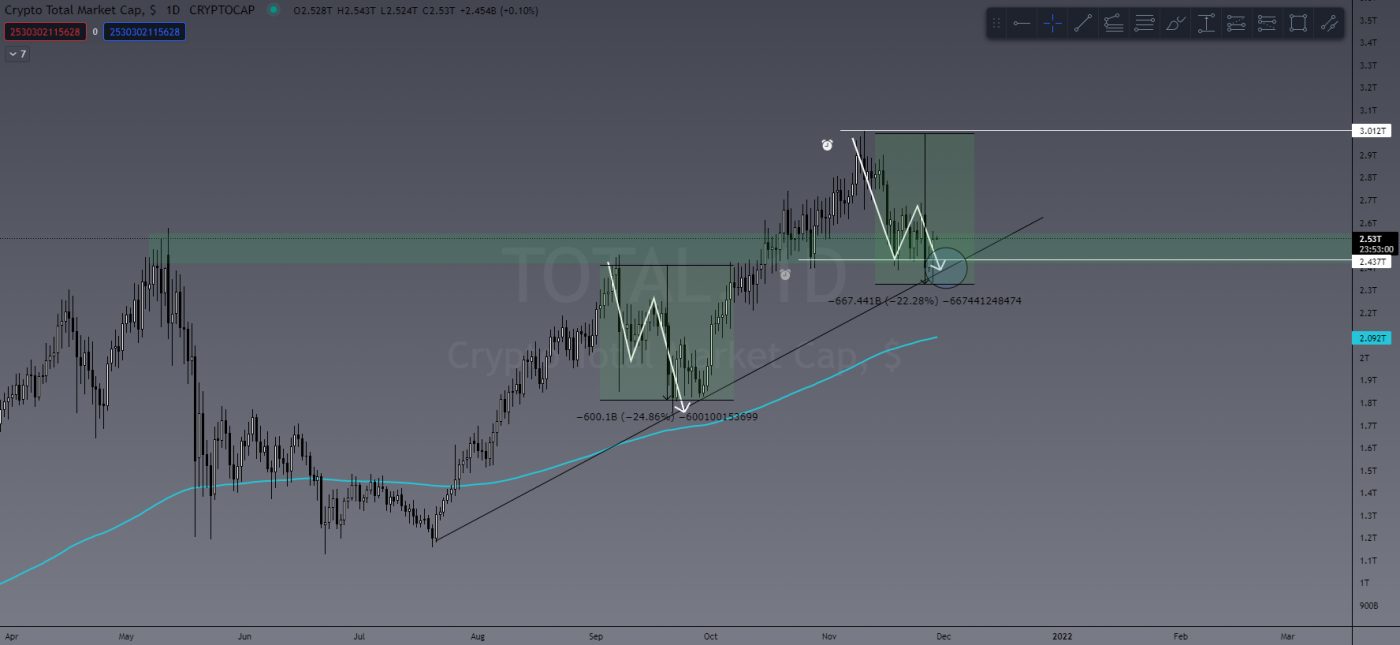
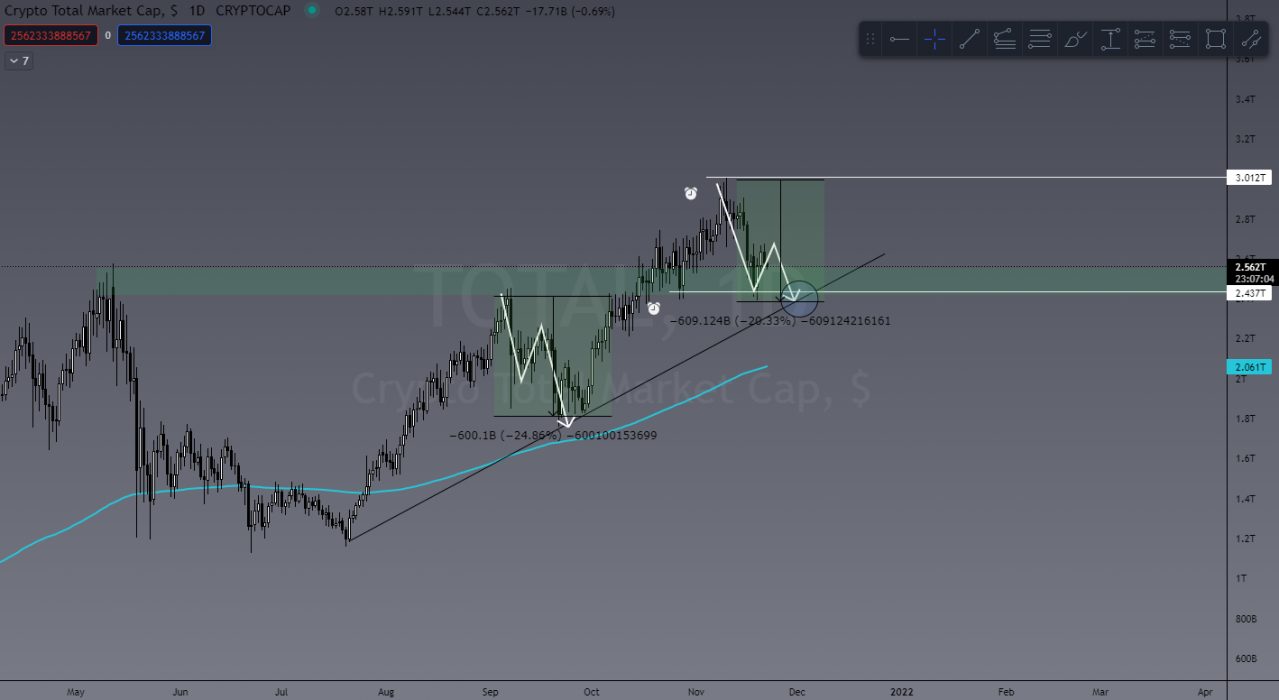
Last week I touched on the US$600 billion drop in TOTAL crypto market cap. I warned that we could see some more selling pressure but there was no reason to stress or start panic selling. You can see below that the TOTAL crypto cap has indeed pulled back further to retest its current uptrend. So far it’s showing a bullish test with a long wick to the downside and a strong bullish engulfing candle on the daily timeframe.

Image from last week’s update
TOTAL crypto market cap current value

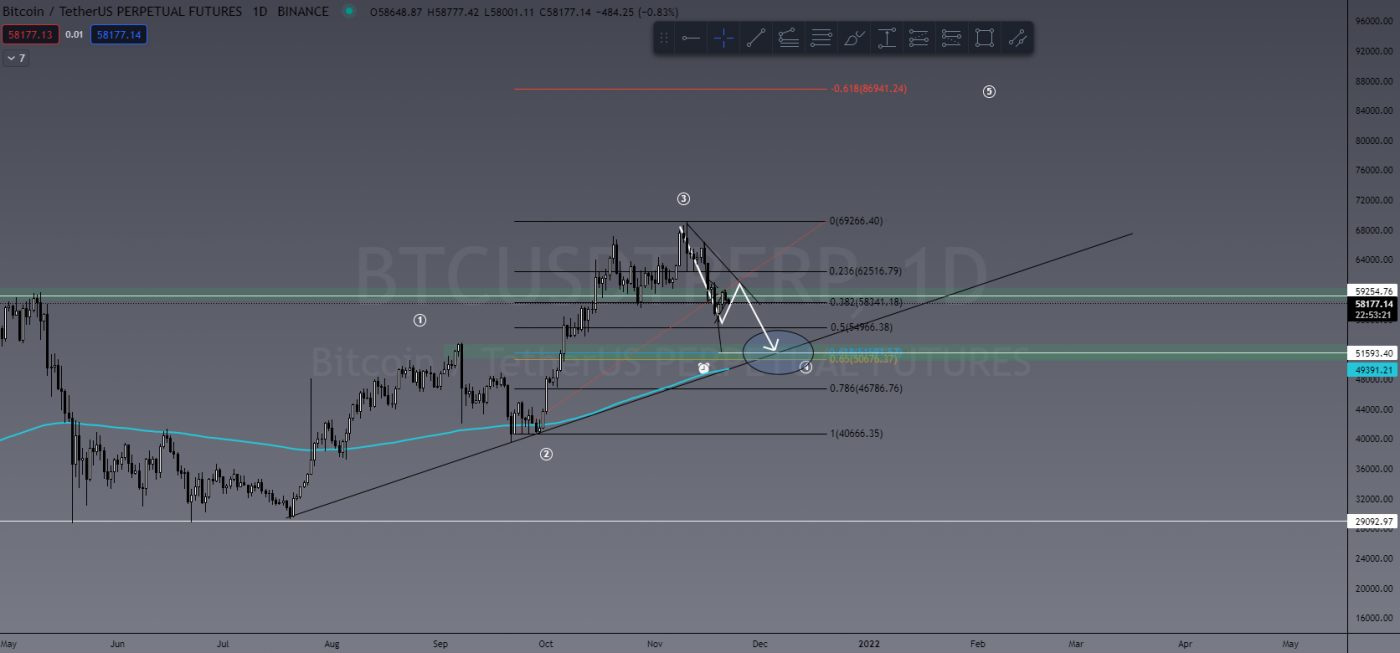
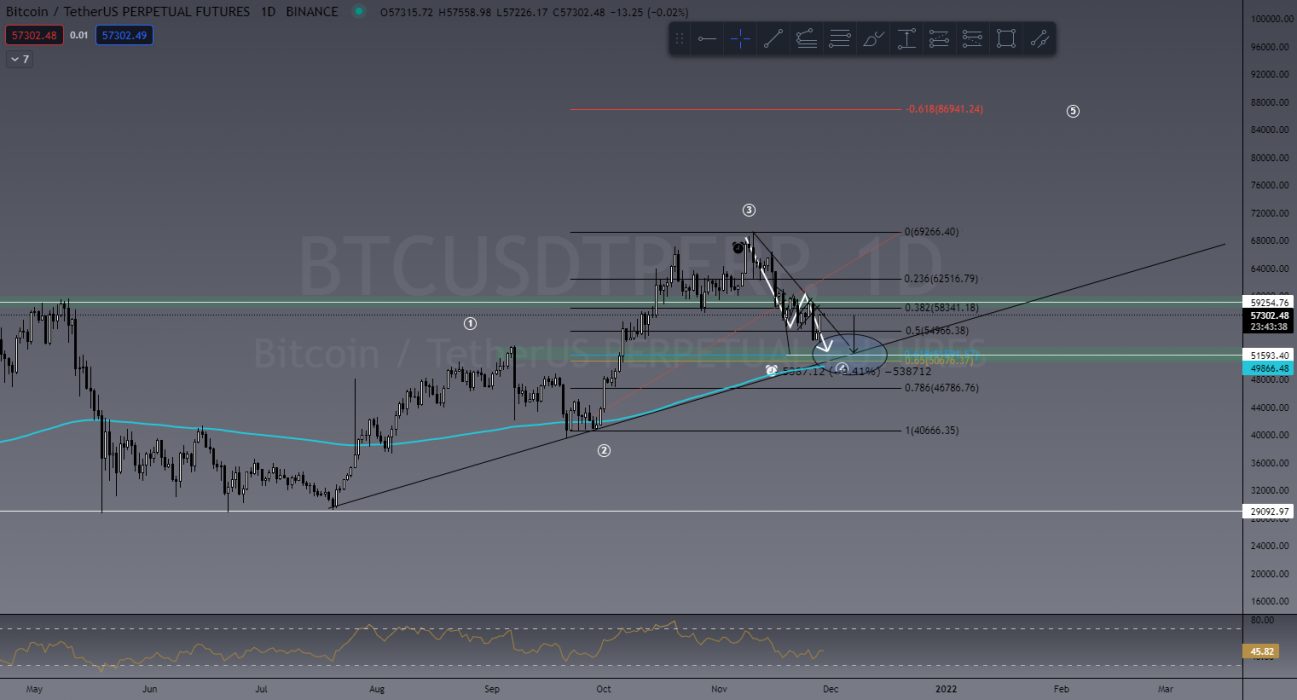
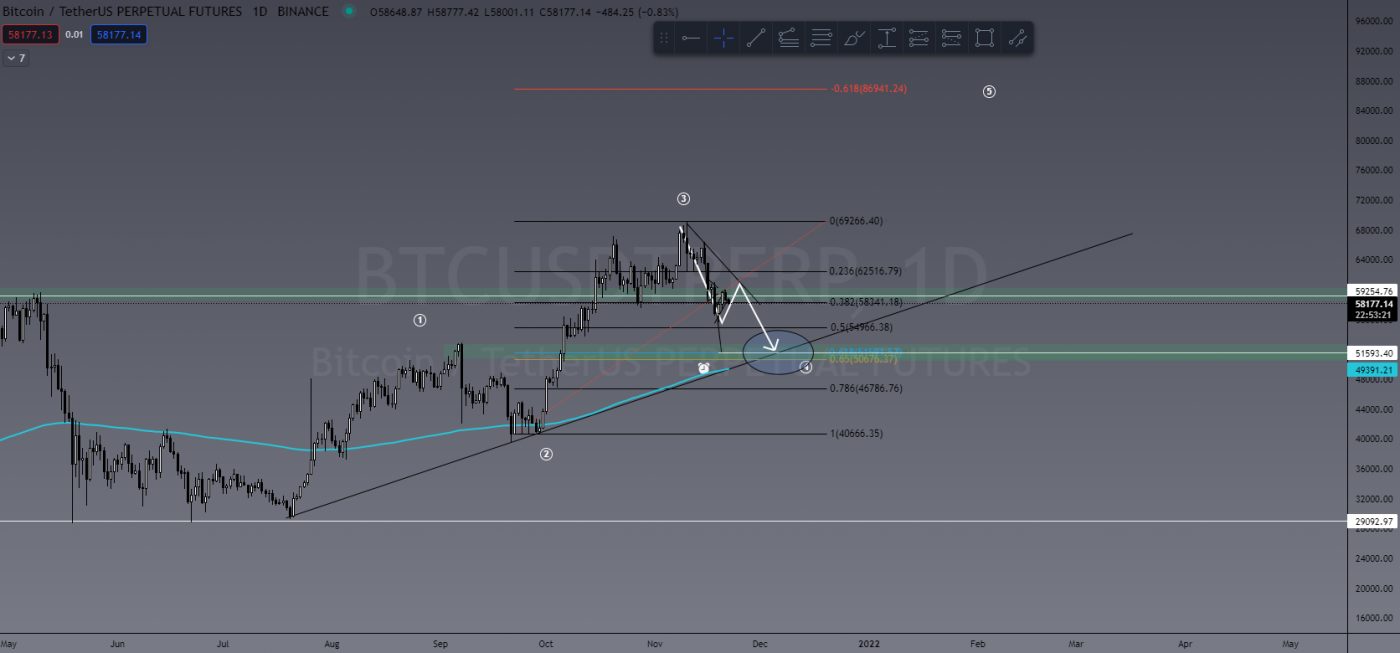
With the projection of the TOTAL heading down in value, I suggested BTC would follow this formation and see further bearish price action. My target being US$51,000, we haven’t hit that price YET. So far BTC is showing some signs of strength and the bottom of this local downtrend MIGHT be in, so it would serve you well to expect a bounce here and plan your trades accordingly.

That said, we’re not out of the woods yet. While BTC is trending below that local downtrend line and forming lower lows/lower highs (bearish market structure), we could see it hit that suggested area of support at US$51,500.

Projection from last week’s article
Current BTC price action

What’s interesting about the US$51,500 level is the perfect storm forming. There are so many key identifiers converging in that one area. We have:

  • the 61.8% Fibonacci retrace level;
  • daily 200 Exponential Moving Average(EMA);
  • daily level of support;
  • daily uptrend;
  • daily Higher Low (excellent market structure);
  • all of which plays well into the Elliott Wave Theory of market cycles.

It’s almost the perfect trade setup and something we discussed in last Thursday’s market scan in the TradeRoom. You can catch a sneak peek on our YouTube channel.


Last Week’s Performance

SAND/USDT

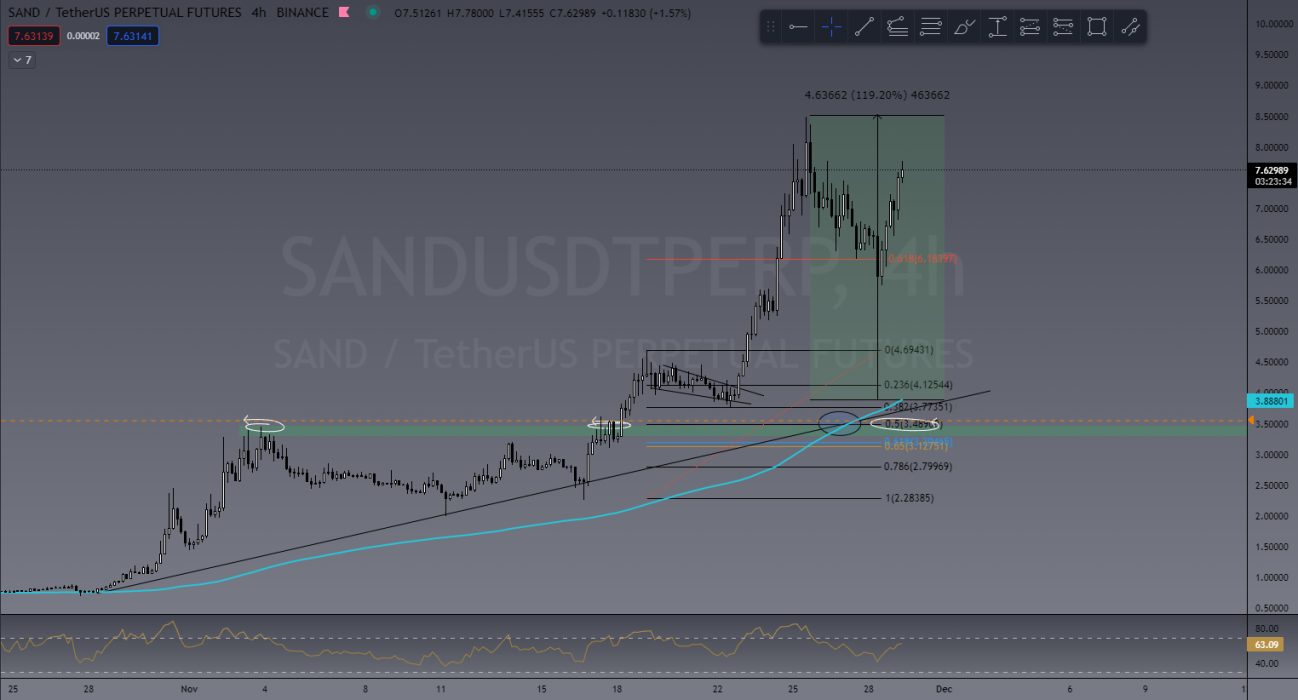
Last week in the TradeRoom, we were watching a lot of these Metaverse coins and SAND did not disappoint. I showed a bullflag forming on the 4H chart and was personally hoping to see a test of previous support and uptrend, but SAND didn’t want to wait. Breakout from the bullflag boasted a 120% push to the upside!

Bullflag breakout for SAND/USDT

LRC/USDT

Like SAND, LRC didn’t want to wait for another test on support. Breaking out of a falling wedge identified by one of our team leaders, Pete, last week LRC sported a 60% bullish push and currently seems to be forming a new bullish market structure.

GALA/USDT

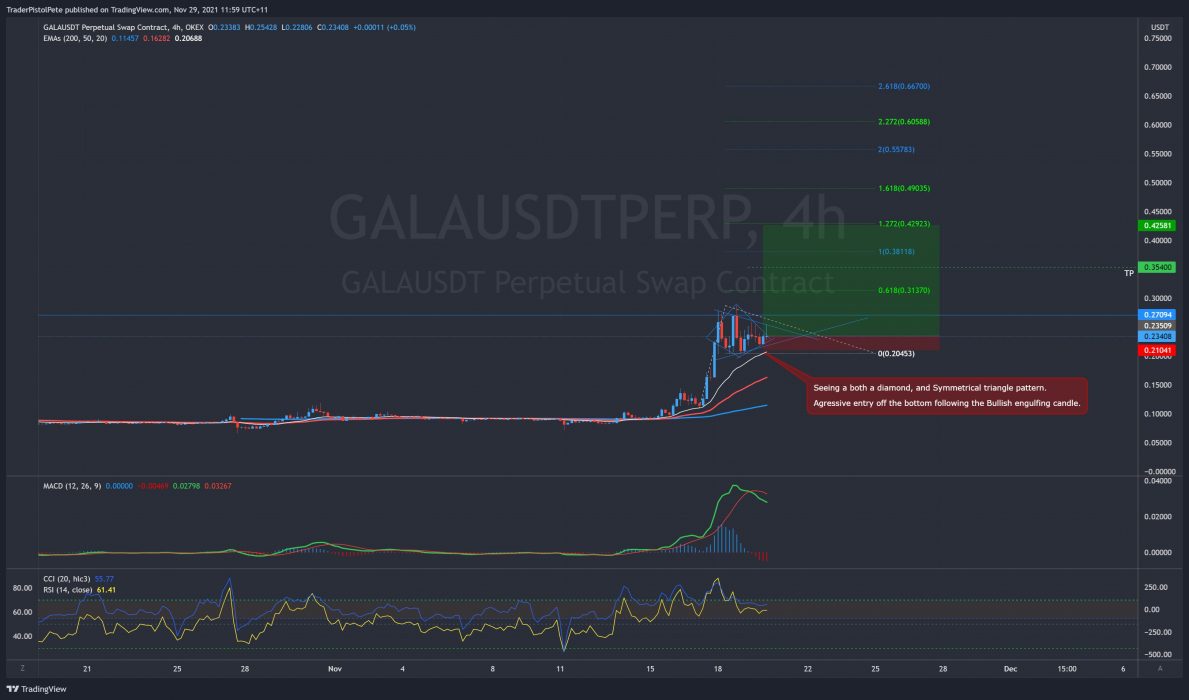
Trade of the week has to go to TCD team leader Pete for his massive GALA trade! With 10x leverage (considered a safe leverage for experienced traders), Pete’s profit is currently over 2000% while a spot trade would give a massive 262% from entry. Pete is a pattern trader and often enters trades based off certain chart patterns. In this case, he has seen a symmetrical triangle bullish continuation pattern.

GALA/USDT Before
GALA/USDT After

This Week’s Trades

ADA/USDT

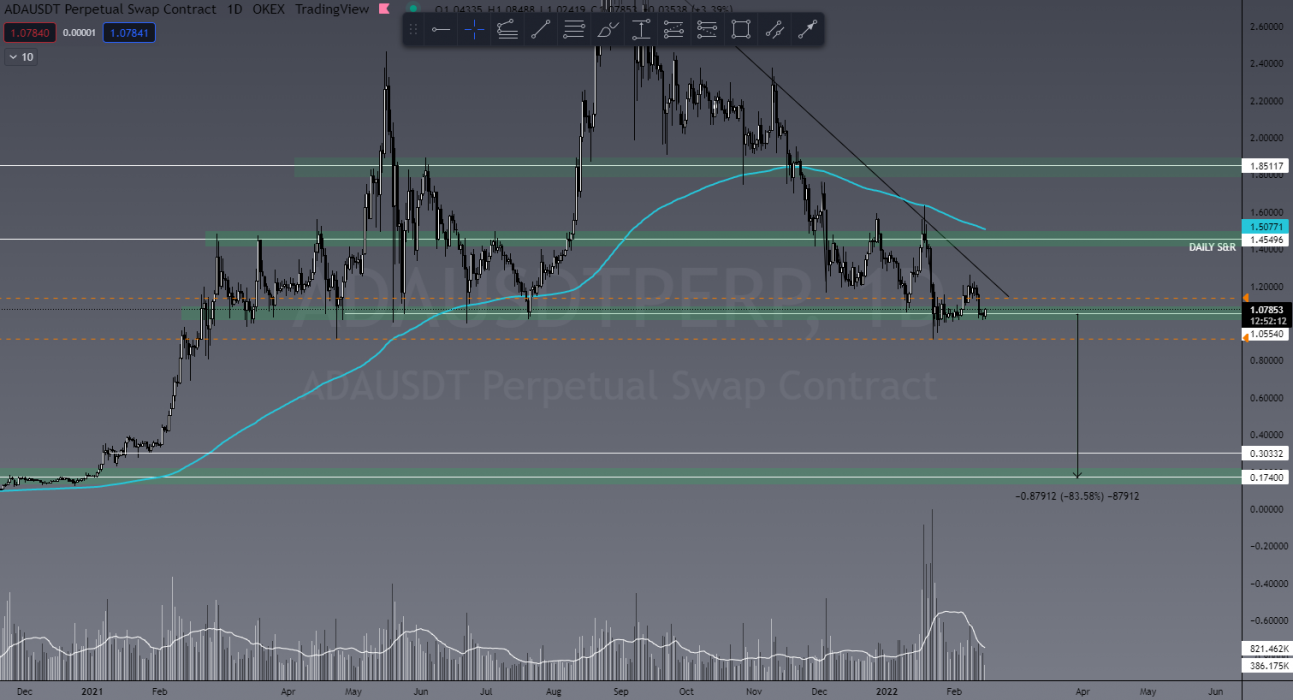
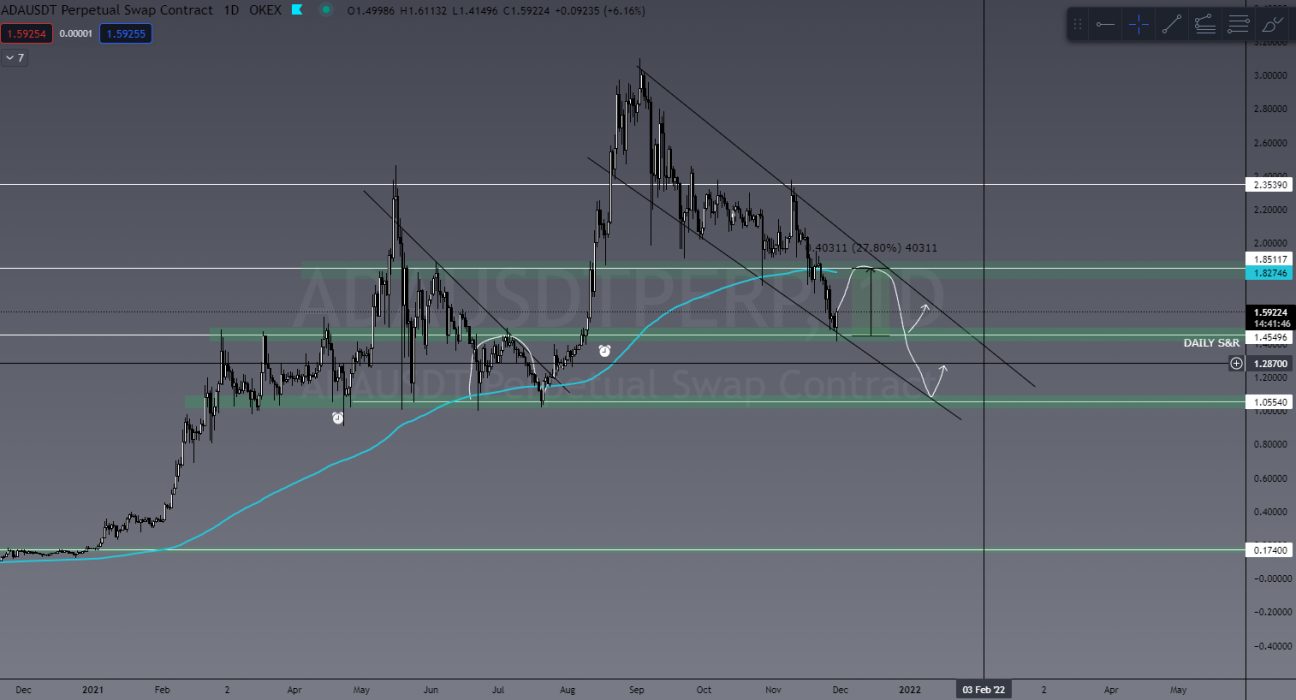
ADA has been trending down since the start of September and is really starting to come into some key levels here. This trade might play out this week or even over the next two weeks, but it’s certainly worth mentioning.

You can see in the chart below that ADA has currently found some bullish price action at the US$1.45 level of support. We could see a decent 30% push here, which would be great, and MAYBE even a breakout of the downtrend. However, I’m looking a little further ahead. If ADA rejected off the downtrend and pushed further below, the next, and likely last, level of support before revisiting US$0.30 is at the US$1 level.

This is a major level of both tested and psychological zone of support, and I’d expect to see some big money flow happen around here because failing to rally at US$1 would absolutely nuke ADA’s price action.

ADA/USDT

THETA/USDT

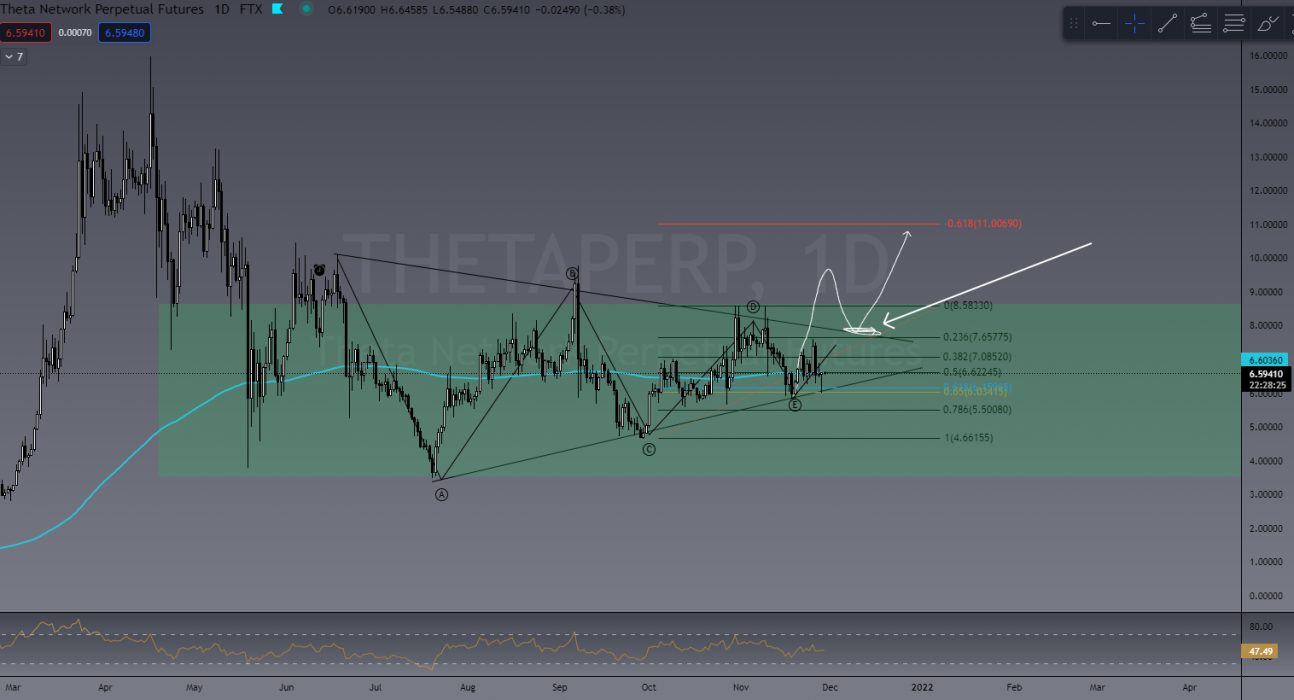
Another coin to keep an eye on is THETA. This is such a good coin to trade and will require a bit of patience to find the right entry.

After a period of consolidation, I’m looking to enter LONG/BUY at the RETEST of a breakout. This will of course highly depend on what BTC does this week, and it may stay in a consolidation zone a little longer. Nevertheless, it’s one to add to your watchlist.

THETA/USDT

OMG/USDT

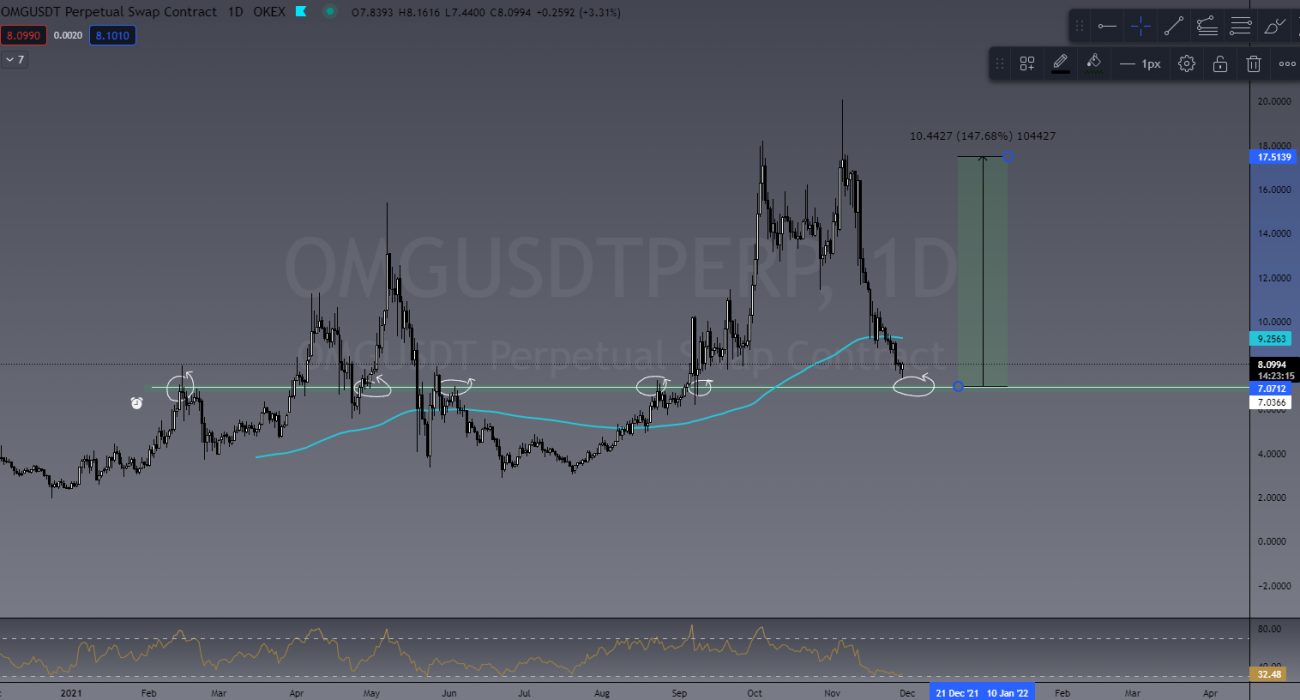
OMG could be coming into a key area of daily support, and is likely a rally point if BTC can behave a little. If OMG can push from US$7 and reclaim its previous high of US$17, we’ll see 150% growth. Another one to add to the watchlist.

OMG/USDT

Invite to Join our TradeRoom

If you’d like to become a better trader, you’re invited to join our TradeRoom where we share daily charts and market analysis. In our community we strongly encourage and teach correct risk management strategies to keep our members safe in this new volatile crypto market.
Join our “Apprentice” plan now for your 7-day trial.

TCD’s TradeRoom

The Crypto Den was created in 2017 to help the rapidly growing crypto community learn and understand the fundamentals of digital currencies and how to trade them. 

Since then we have taught thousands of members the basics of technical analysis and trading strategies to further progress and perfect their trading abilities.

In the TradeRoom you will be included in a supportive environment which encourages personal growth, education and community support.

It’s a place to share your trading ideas and follow other experienced traders’ feeds to help keep your finger on the pulse of such a volatile market!

Categories
Market Analysis The Crypto Den

TradeRoom: Our Weekly Crypto Trades Analysis – Nov 22, 2021

Welcome to this weekly series from the TradeRoom. My name is Dave and I’m the founder of The Crypto Den, an Australian-based crypto trading and education community aiming to give you the knowledge to take your trading game to the next level.

Crypto Market Outlook

The crypto markets took a pretty decent hit after a US$500 billion sell-off in the past week. If you’re one of those people I’m seeing across all socials freaking out about this, DON’T STRESS!
You can see in the TOTAL chart below that the entire crypto cap took a US$600 billion hit back in September and recovered quite well. At this point I’m expecting the same to happen again.

TOTAL Crypto market cap

Looking at Bitcoin, we are seeing a bit of Elliott Wave Theory in play here. For those who don’t know what that is, it’s essentially investor psychology and sentiment presented as recurring patterns in the market – a 5 wave pattern, 3 waves up (impulse waves) and 2 waves down (corrective waves).

BTC is currently in the middle of wave 4 having a small bounce on the 50% Fibonacci level. We are expecting to to see further downside to a level of confluence between the current uptrend, 61.8% Fibonacci level and daily support level at US$51,500. All of which supports the Elliott Wave Theory.

BTC/USDT

Keep in mind wave 4 is a corrective wave. So this doesn’t mean doom and gloom. It would indicate BTC is simply having a healthy correction before the next leg up. I stand by our initial targets of US$78,000 as target 1 and US$87,000 as target 2.


Last Week’s Performance

MANA/USDT

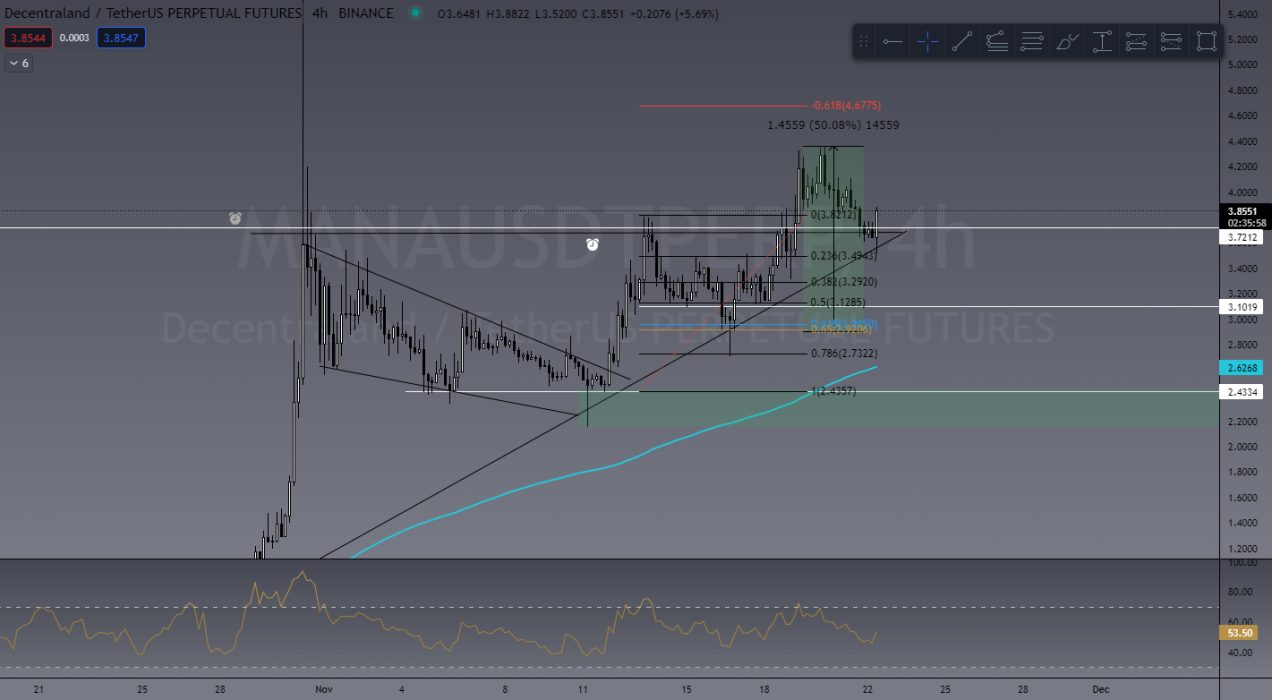
MANA has again made the list this week for top performers. In the TradeRoom, these metaverse tokens have been going crazy despite BTC itself seeing bearish action. In last week’s article I mentioned MANA would likely see a pullback into that 61.8% Fib level, which it did before a continuation up. It performed perfectly with a price increase of 50%.

MANA/USDT chart from last week’s article
Current MANA/USDT Chart


ENJ/USDT

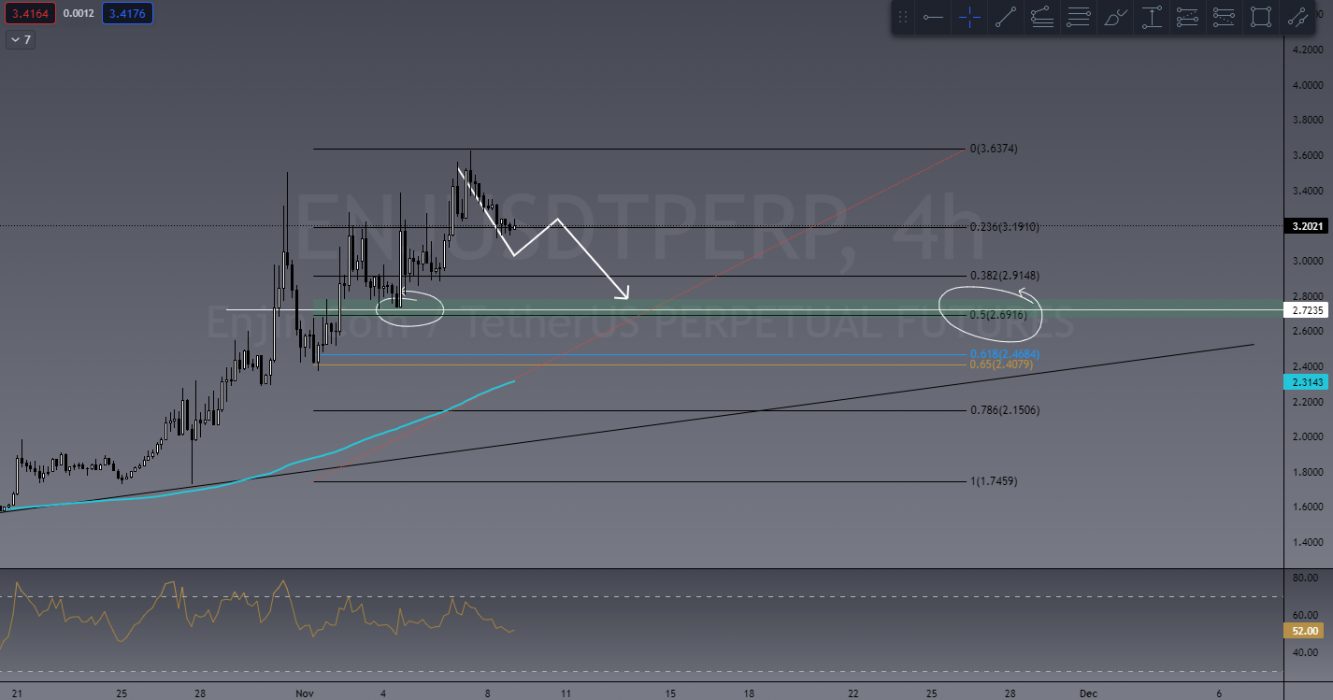
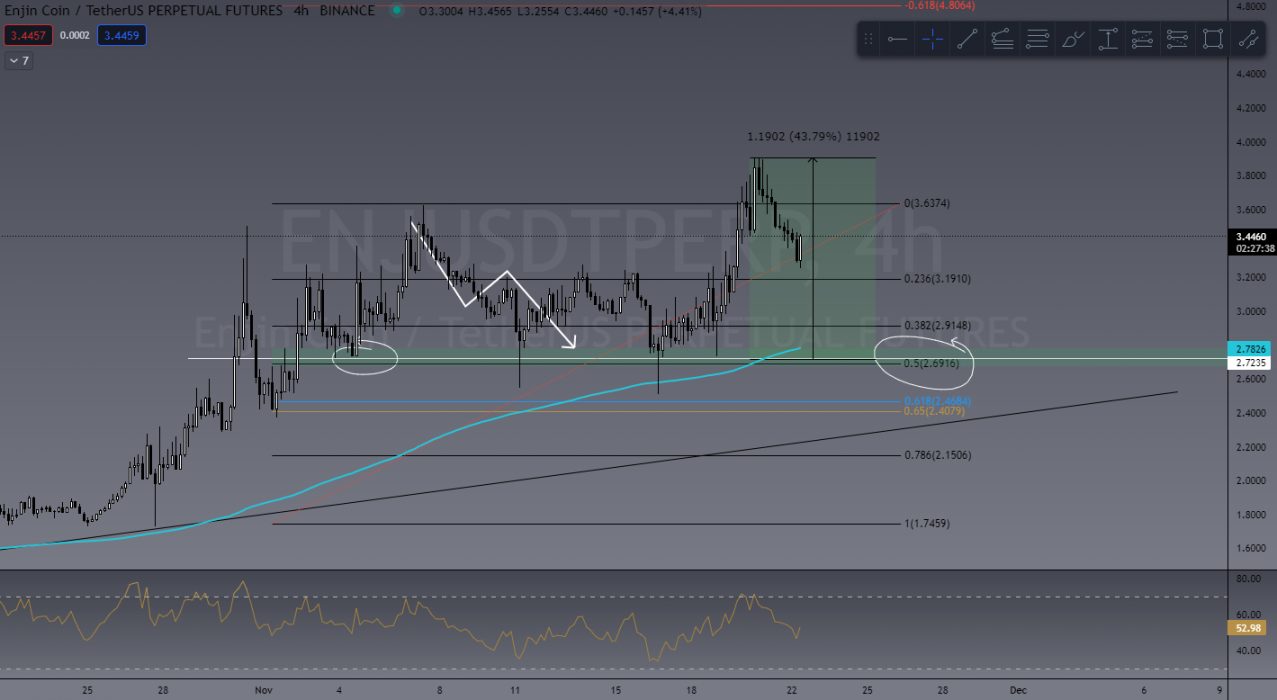
Another metaverse coin that performed well last week was Enjin: a nice clean pullback to a solid support level and the 50 Fib, and away she went with a nice 43% rise.

ENJ/USDT chart shared in our TradeRoom
ENJ/USDT Chart currently

This Week’s Trades

AXS/USDT

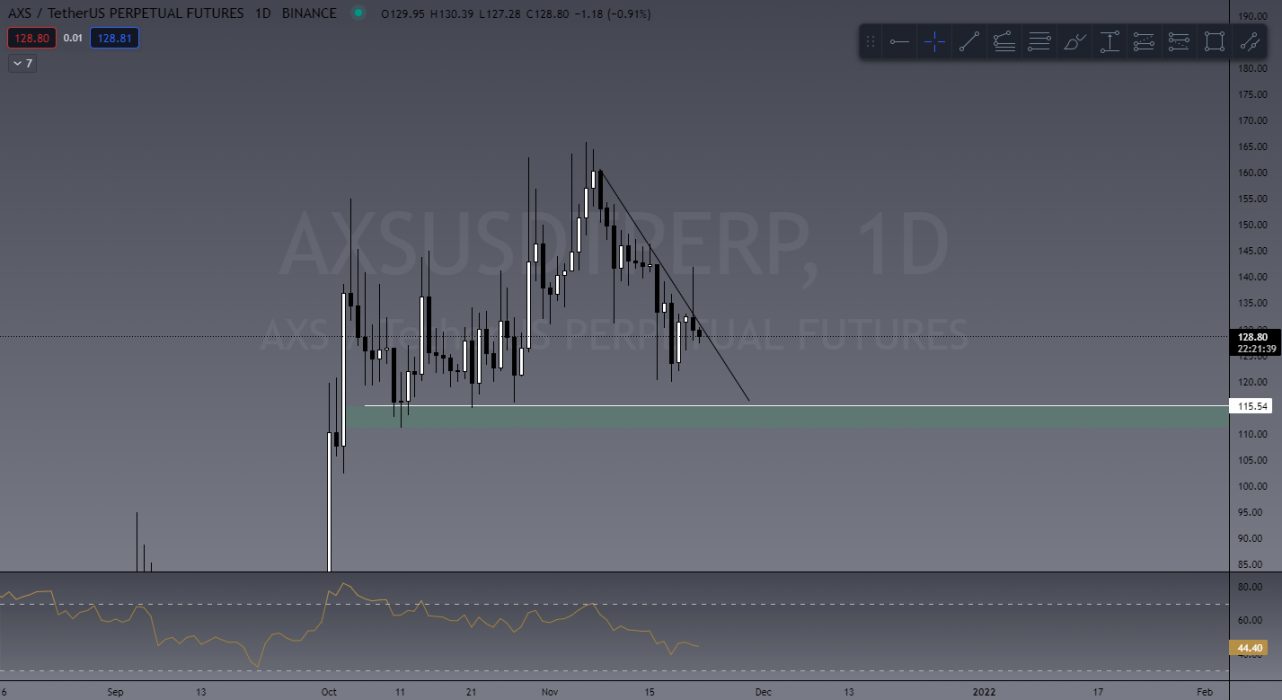
Sticking with the metaverse theme this week, we can’t go past AXS. Hoping to see a pullback to a good buy zone at the US$115 mark, where I’ll be looking for entries. If AXS continues to perform well with the BTC drops, who knows how high this beast can go?

AXS/USDT

SAND/USDT

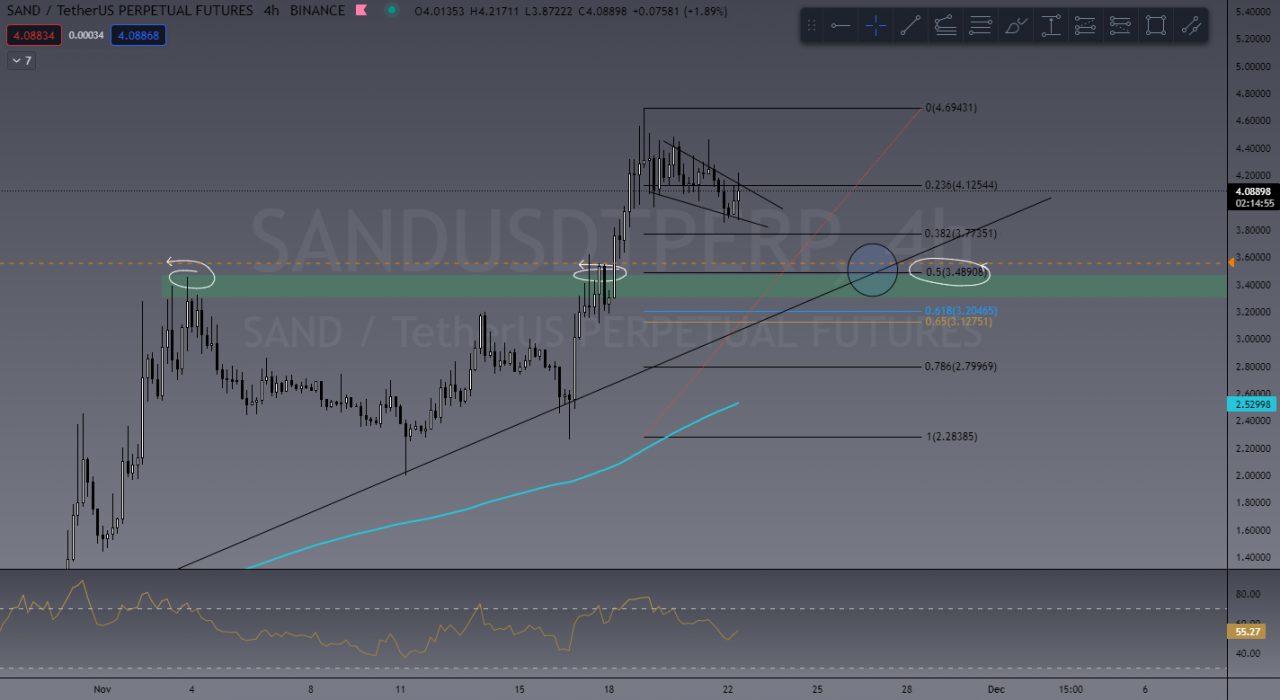
Again with the MV coins I know but hey, profit is profit. SAND is currently looking to be forming a bit of a bull pennant, however I’m personally hoping to see a bigger pullback into a healthier buy zone at around the US$3.48 area. Why? Well, it’s a good test on what will be a new level of support, test on current uptrend and the 50% Fib retrace.

LRC/USDT

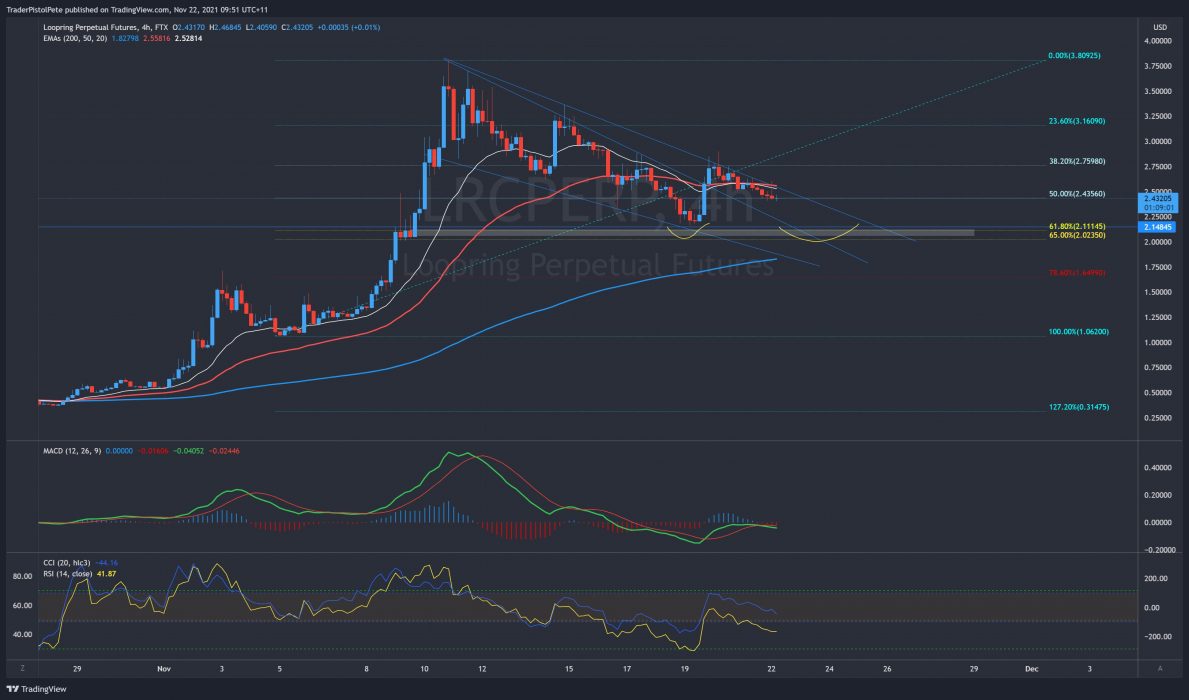
LRC is showing a really good pullback into a buy zone. In a chart posted in the TradeRoom by one of our team leaders, Pete, this morning you could see the buy zone clearly displayed in the 61.8% Fib level, which again is a common retracement level and Pete has also drawn a bullflag, which is a strong bullish continuation pattern. Target is US$2.10.

Pete’s LRC/USDT chart

Invite to Join our TradeRoom

If you’d like to become a better trader, you’re invited to join our TradeRoom where we share daily charts and market analysis. In our community we strongly encourage and teach correct risk management strategies to keep our members safe in this new volatile crypto market.

TCD’s TradeRoom

The Crypto Den was created in 2017 to help the rapidly growing crypto community learn and understand the fundamentals of digital currencies and how to trade them. 

Since then we have taught thousands of members the basics of technical analysis and trading strategies to further progress and perfect their trading abilities.

In the TradeRoom you will be included in a supportive environment which encourages personal growth, education and community support.

It’s a place to share your trading ideas and follow other experienced traders’ feeds to help keep your finger on the pulse of such a volatile market!

Categories
Events Market Analysis The Crypto Den

TradeRoom: Our Weekly Crypto Trades Analysis – Nov 15, 2021

Welcome to this weekly series from the TradeRoom. My name is Dave and I’m the founder of The Crypto Den, an Australian-based crypto trading and education community aiming to give you the knowledge to take your trading game to the next level.

Learn from the experts! Live Trading Course by The Crypto Den starts tonight at 7pm AEST! Register for the Live Trading Sessions

Crypto Market Outlook

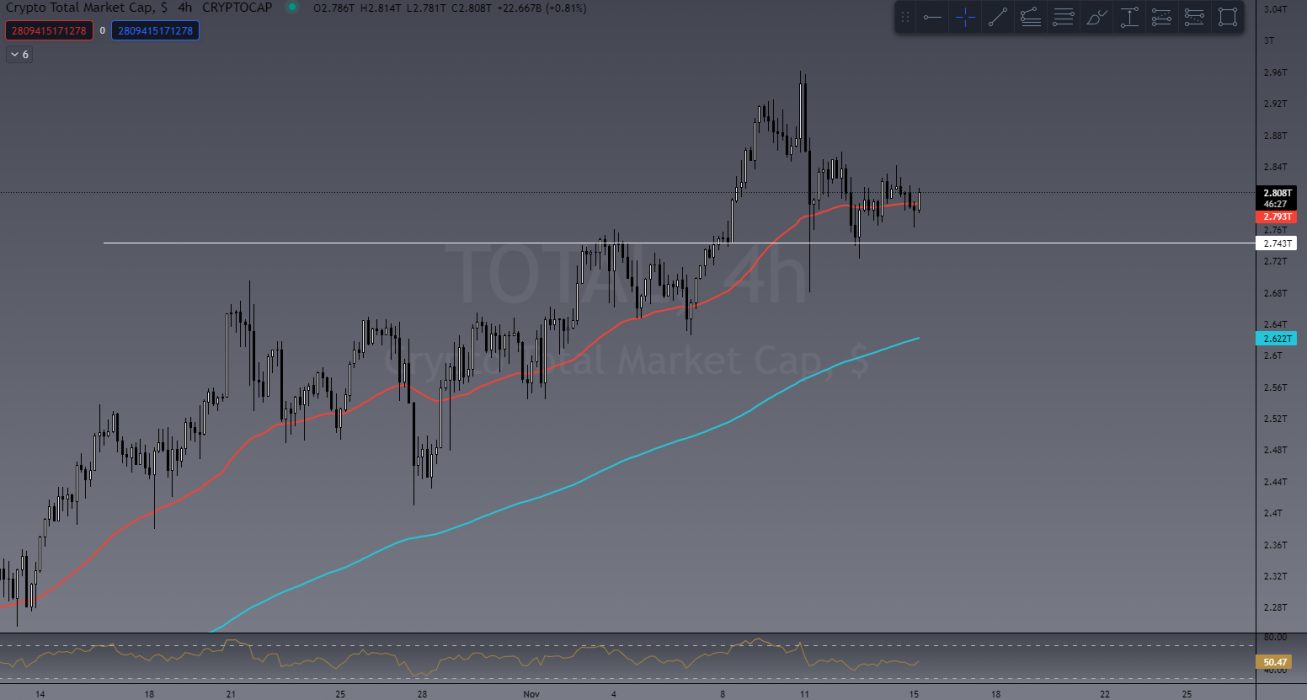
We’ve seen a bit of a pullback in price action in the market over the past four days, which isn’t a bad thing. Last week the total crypto market cap reached US$3 trillion for the first time in history and has since pulled back to the US$2.7 trillion mark, which could be seen as a new level of “Support”. It’s currently sitting at US$2.8 trillion.

Total market cap sitting at US$2.8 trillion

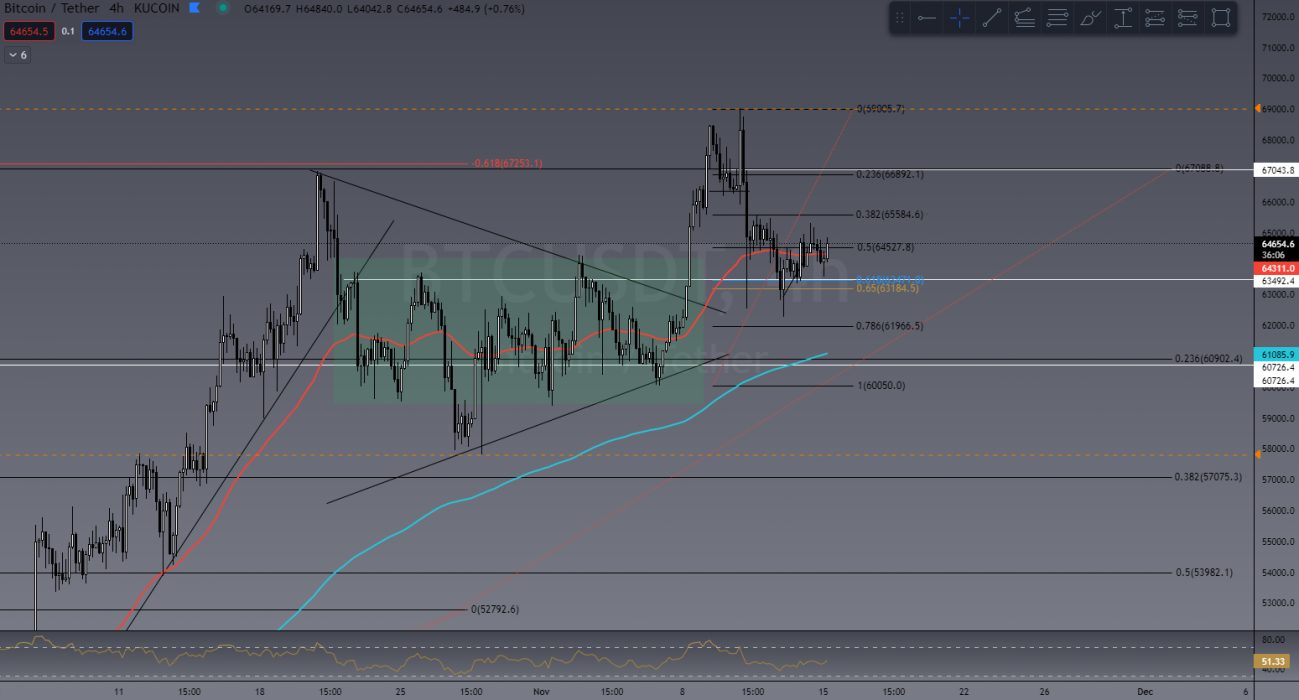
In last week’s article I mentioned BTC forming a symmetrical triangle which, as a general rule, has a 70% chance of breaking out to the upside. As you’ll see below, BTC did have a bullish break into a new all-time high (ATH) and has since reversed with some bearish price action to what we call a retest zone. What goes up, must come down … and that’s the same for financial markets. Nothing continues to go up without having some downs along the way.

BTC is retesting a new level of support after retracing in the 61.8% golden pocket. This is actually a bullish signal and could simply indicate a new market structure to launch from! We still expect BTC to reach US$78,000 soon.

BTC breaking out and now retesting support

Last Week’s Performance

MANA/USDT

Last week I mentioned the coin to watch was MANA (Decentraland) as the bullish momentum was just too good to ignore. It’s seen price action increase 57% and currently retracing. It seems to be bouncing from the 50% fib level at the time of writing and could see the 61.8% fib before a continuation up again. In the TradeRoom there’s been a lot of chatter around these Metaverse coins/tokens, and the sentiment is very bullish!

MANA breaking out and retracing

CHR/USDT

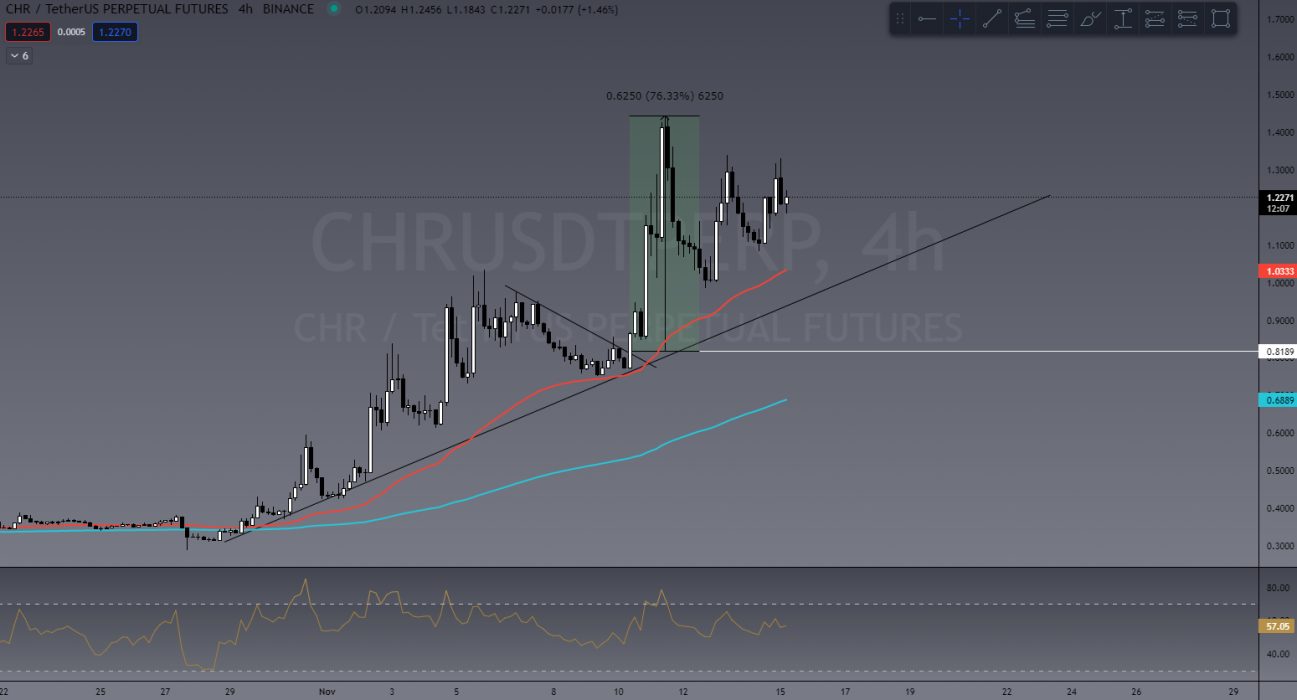
An amazing trade taken last week by one of our TradeRoom legends – “TypeGuy” – was on CHR (another Metaverse token). I’ve recreated his chart below. You can see see price action retraced to the trend line, then painted a bullish engulfing candle leading to a breakout. TypeGuy trades this on 10x leverage yielding him over 300% ROI. CHR did 76% on spot in only two days! That’s what I call a killer trade! TypeGuy has become an extremely consistent trader in TradeRoom after completing our trading course and shares a massive amount of his charts every week!

Massive 76% on CHR in only 2 days!

This Week’s Trades

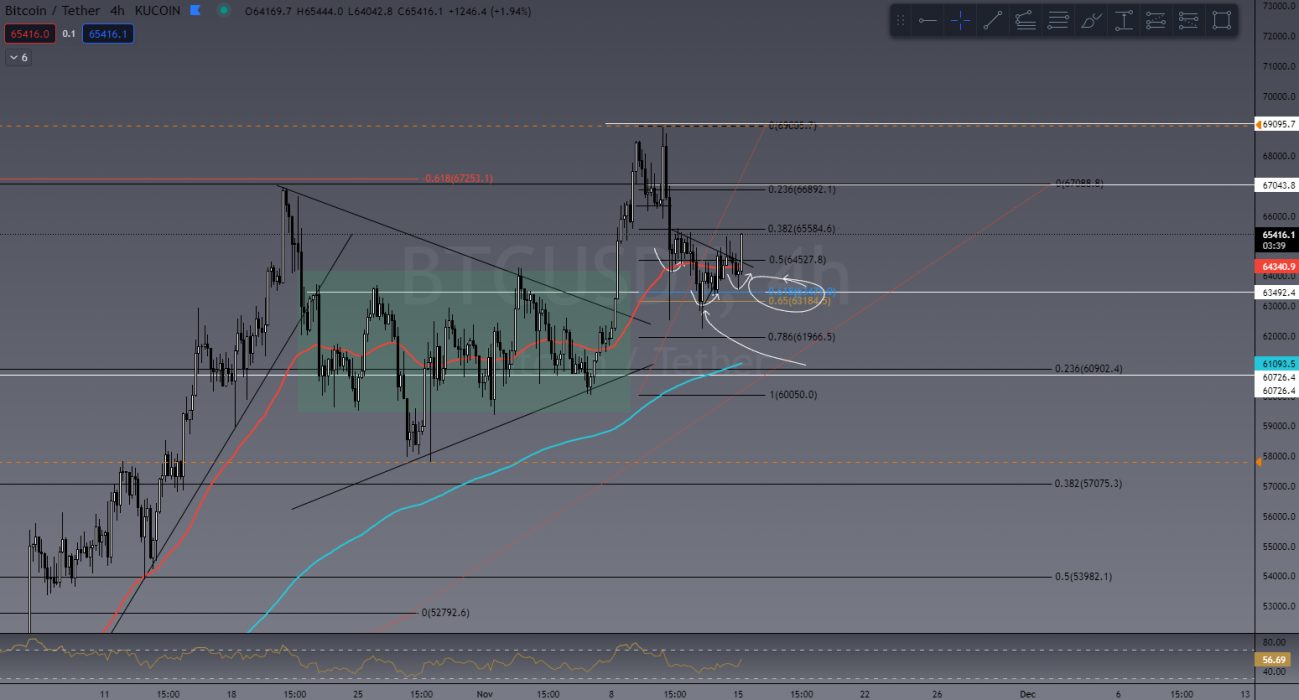
BTC/USD

As mentioned above, BTC has seen a healthy pullback in price action and retraced back to that golden pocket. Forming a higher low (HL) on the 4H chart and breaking out the new market structure is VERY bullish so far. A big bullish engulfing candle was forming at the time of writing this and if this momentum can continue, we will surely see a break well above US$70,000 this week!

BTC breakout and retest

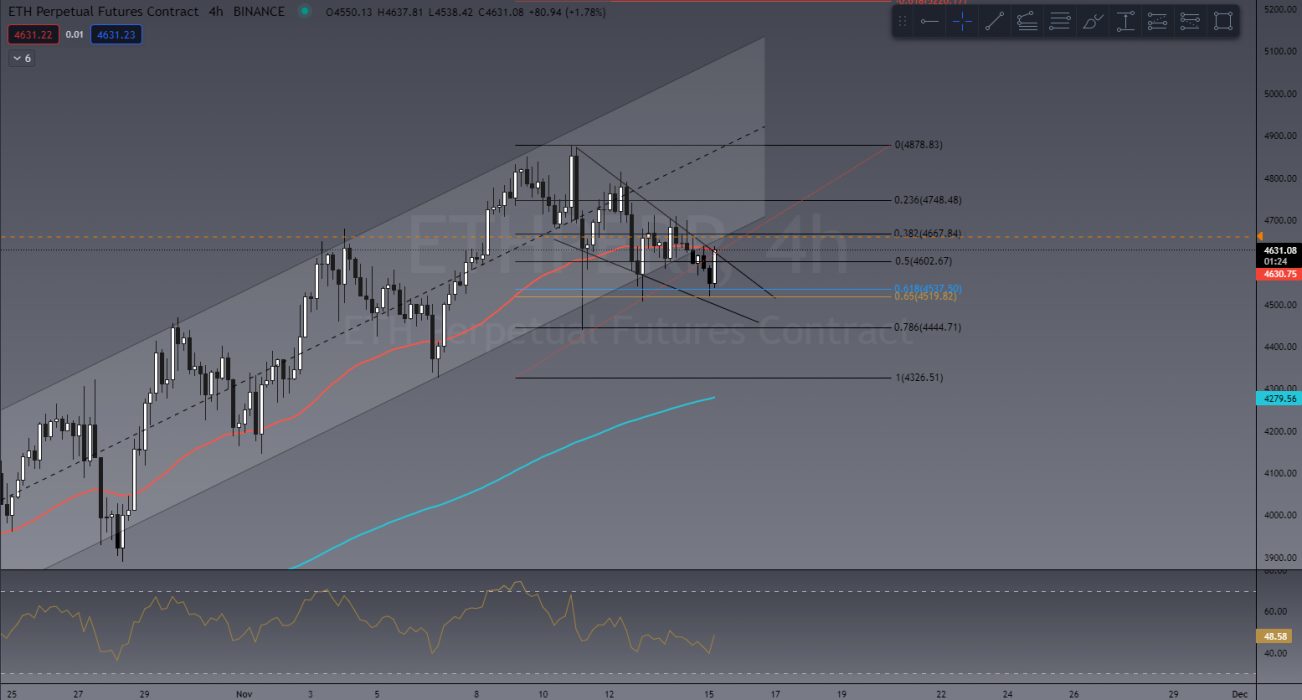
ETH/USD

If BTC follows the bullish path, ETH won’t be far behind. Currently in a falling wedge (bullish continuation pattern) and having had a “triple bottom” in that golden pocket, ETH looks really bullish! We would expect to see US$5,000 ETH this week if this plays out well!

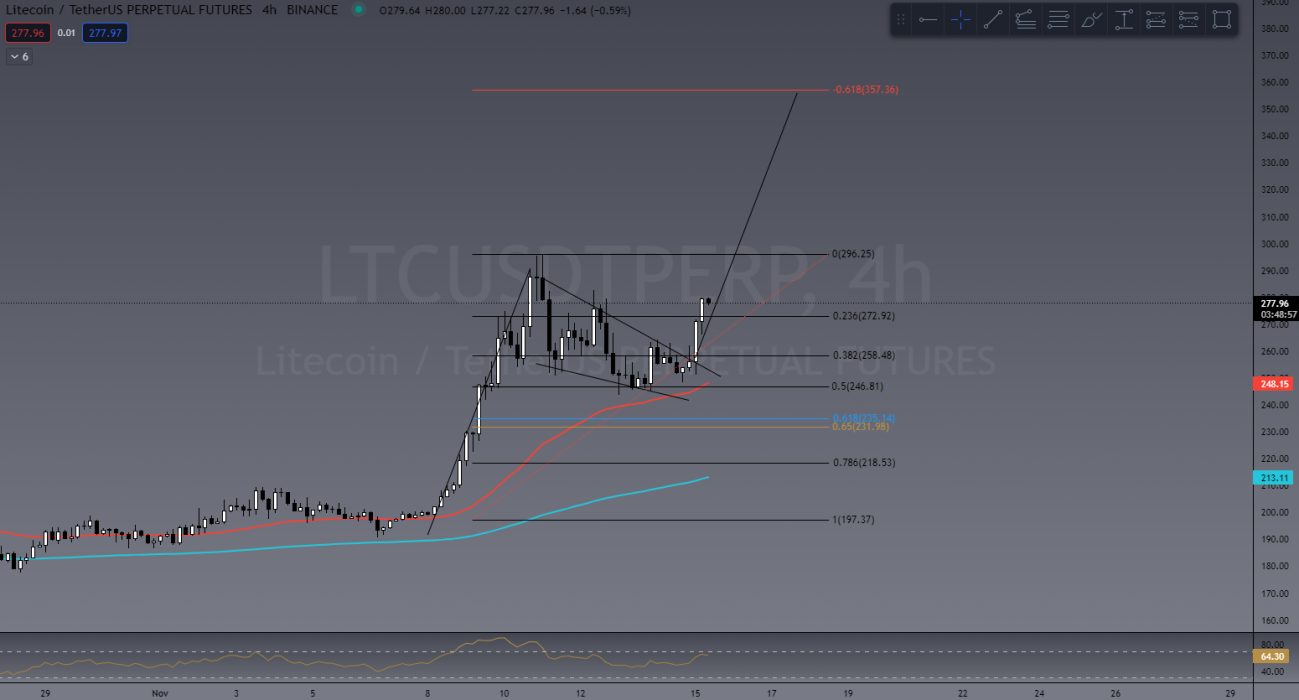
LTC/USD

Another big top 10 to watch is LTC. Litecoin is usually either late to the party or early, but it’s rarely on time! What I mean by this is that sometimes it leads the way in price action, beating other top 10 coins to the punch, or it gets totally left behind to do its own thing and show up late again.

This time LTC has shown up early. Pushing out of the falling wedge we expect to see a slight and short-lived pullback before continuing up. I’m getting a Fibonacci target of US$350.

LTC breakout and target based on “flag pole” and Fibonacci

It’s important to remember that when trading ALT coins, their price action is heavily dependent on BTC. If BTC takes a bullish path, ALTs will likely follow. If BTC turns bearish, then ALTs will likely dump in price even harder!

If you’d like to become a better trader, you’re invited to join our TradeRoom where we share daily charts and market analysis. In our community we strongly encourage and teach correct risk management strategies to keep our members safe in this new volatile crypto market.

Live Trading Lessons – 6-Week Course

If you’d like to improve your trading, we teach you how to understand and implement all of the trading strategies we use in our 6-week Trading Fundamentals Course.

>> Register for the Live Trading Sessions – starts TONIGHT 7pm AEST!

Other ways to learn:

>> Take our Free Beginners’ Trading Course

>> Join our Trading Community for your 7-day free trial


The Crypto Den was created in 2017 to help the rapidly growing crypto community learn and understand the fundamentals of digital currencies and how to trade them. 

Since then we have taught thousands of members the basics of technical analysis and trading strategies to further progress and perfect their trading abilities.

In the TradeRoom you will be included in a supportive environment which encourages personal growth, education and community support.

It’s a place to share your trading ideas and follow other experienced traders’ feeds to help keep your finger on the pulse of such a volatile market!