Categories
Crypto News DigiByte Market Analysis Trading

Top 3 Coins to Watch Today: AVAX, FET, DGB – December 21 Trading Analysis

Let’s take a closer look at today’s altcoins showing breakout signals. We’ll explain what the coin is, then dive into the trading charts and provide some analysis to help you decide.

1. Avalanche (AVAX)

Avalanche AVAX is the fastest smart contracts platform in the blockchain industry, as measured by time-to-finality, and has the most validators securing its activity of any proof-of-stake protocol. Avalanche is blazingly fast, low-cost, and green. Any smart contract-enabled application can outperform its competition on Avalanche. AVAX is the native token of Avalanche. It is a hard-capped, scarce asset that is used to pay for fees, secure the platform through staking, and provide a basic unit of account between the multiple subnets created on Avalanche.

AVAX Price Analysis

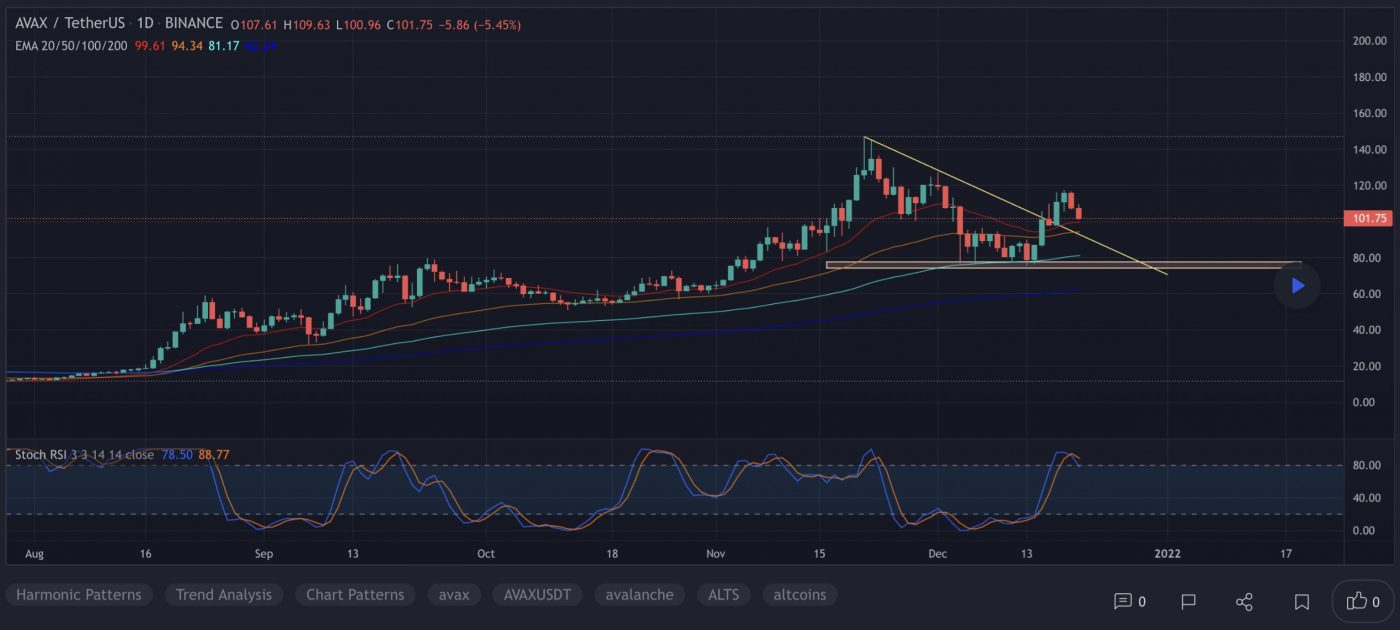
At the time of writing, AVAX is ranked the 10th cryptocurrency globally and the current price is US$104.86. Let’s take a look at the chart below for price analysis:
Source: TradingView

AVAX‘s 188% bullish trend in Q4 ended in a 49% retracement as the rest of the altcoin market dropped. Bulls stepped in near the 61.8% retracement of Q4’s move, creating a consolidation that ended with last week’s bullish impulse to resistance near $112.35.

With the 9, 18 and 40 EMAs stacked bullish and a bullish higher-timeframe trend, it’s reasonable to anticipate retracement to possible support before further bullish expansion. 

Near the 40 EMA, a broad zone from $98.00 to $86.35 could see interest from bulls before further expansion. If this level fails, bears might capitalise on any sharp moves down in Bitcoin, aiming for possible support near the 78.6% retracement, at $75.50, and potentially lower to a higher-timeframe support zone between $69.82 and $57.75.

If the higher-timeframe bullish trend resumes and the current resistance near $112.35 breaks, the wicks near $134.84 and the all-time high might see profit-taking. 

A more significant expansion could reach near the 80 level, at $180, and potentially the 150% extension of Q4’s move, near $200.

2. Fetch.ai (FET)

Fetch.ai FET is a platform that aims to connect Internet of Things (IoT) devices and algorithms to enable their collective learning. Fetch.ai is built on a high-throughput sharded ledger and offers smart contract capabilities to deploy machine learning and artificial intelligence solutions for decentralised problem-solving. These open-source tools are designed to help users create ecosystem infrastructure and deploy commercial models.

FET Price Analysis

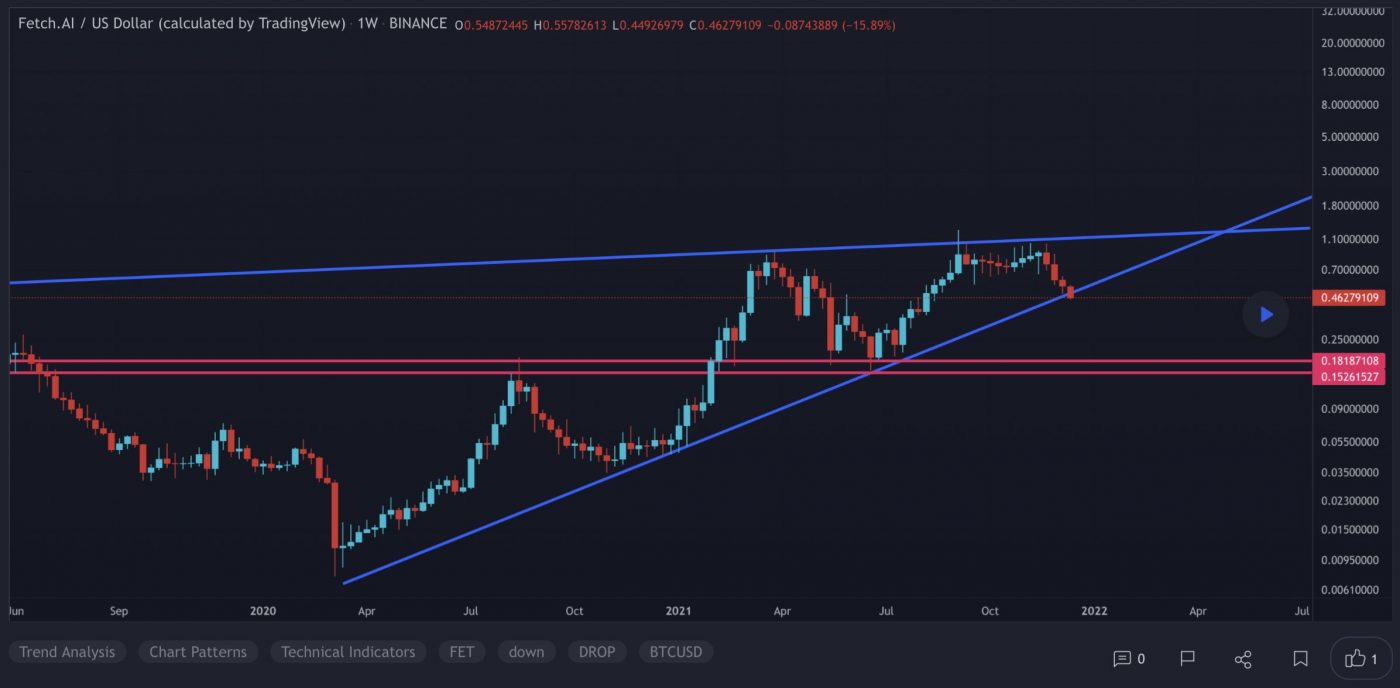
At the time of writing, FET is ranked the 160th cryptocurrency globally and the current price is US$0.4376. Let’s take a look at the chart below for price analysis:
Source: TradingView

After a lengthy distribution from September to October, FET‘s price finally fell toward 2021’s range low.

The 78.6% retracement of the range, near $0.4389, could support at least a short-term bounce or trigger a consolidation. 

Until the daily chart shows signs of reversal, possible support near clustered swing highs and swing lows near $0.3529 could be a bearish target.

If this level fails to provide support, an inefficiently traded area on higher-timeframe charts, from $0.1587 to $0.1197, could be the next draw for price.

Any retracement upward may be capped near $0.5506, around the 61.8% retracement of the higher-timeframe range. However, the two-month consolidation lows near $0.6920 are still a reasonable target for a bounce.

Just above this level, the H1 2021 swing high and midpoint of the consolidation range, near $0.7807, may also provide resistance. If the price clears this resistance, it could signal a new bullish trend.

3. DigiByte (DGB)

DigiByte DGB is an open-source blockchain and asset creation platform. A longstanding public blockchain and cryptocurrency, DigiByte uses five different algorithms to improve security, and originally aimed to improve on the Bitcoin blockchain’s security, capacity, and transaction speed. DigiByte consists of three layers: a smart contract “App Store”, a public ledger, and the core protocol featuring nodes communicating to relay transactions.

DGB Price Analysis

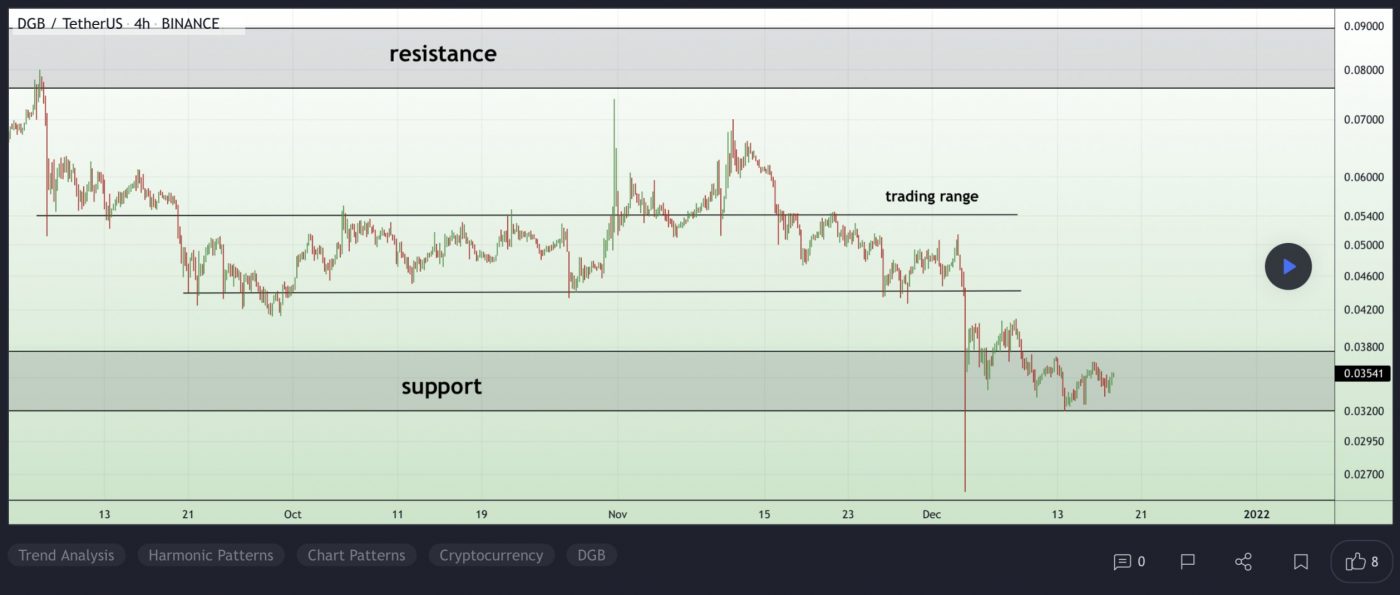
At the time of writing, DGB is ranked the 134th cryptocurrency globally and the current price is US$0.03202. Let’s take a look at the chart below for price analysis:
Source: TradingView

After climbing nearly 150% since the beginning of Q3, a 115% range has trapped DGB between $0.04749 and $0.03122 during Q4.

A consolidation near $0.03492, visible on the weekly chart, provided support on the last touch. This level could provide support again on a stop run under the $0.03015. 

A deeper run-on stop at $0.02920 might reach the top of a higher-timeframe gap at the same level. However, a push this low reduces the chance of a new monthly high soon. Below, little significant support exists until $0.02713.

Higher-timeframe levels overlapping with a daily gap beginning at $0.03495 are likely to provide resistance, perhaps on a sweep of the equal highs near $0.03640. Breaking this resistance makes the relatively equal highs near $0.03855 and the monthly high at $0.04047 the next probable targets.

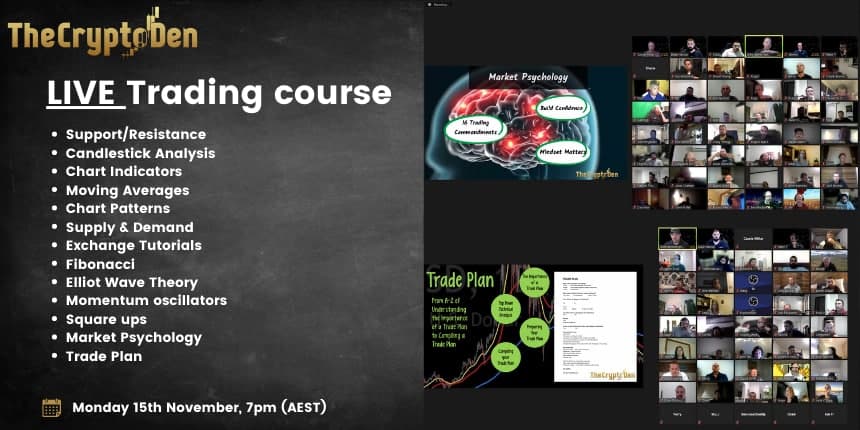
Learn How to Trade Live!

Join Dave and The Crypto Den Crew and they’ll show you live on a webinar how to take your crypto trading to the next level.
Where to Buy or Trade Altcoins?

These coins have high liquidity on Binance Exchange, so that could help with trading on AUD/USDT/BTC pairs. And if you’re looking at buying and HODLing cryptos, then Swyftx Exchange is an easy-to-use popular choice in Australia.

Categories
Crypto News Market Analysis Trading

Top 3 Coins to Watch Today: YFI, ALICE, TLM – December 20 Trading Analysis

Let’s take a closer look at today’s altcoins showing breakout signals. We’ll explain what the coin is, then dive into the trading charts and provide some analysis to help you decide.

1. Yearn Finance (YFI)

Yearn Finance YFI is an aggregator service for decentralised finance (DeFi) investors, using automation to allow them to maximise profits from yield farming. Its goal is to simplify the ever-expanding DeFi space for investors who are not technically minded or who wish to interact in a less committed manner than serious traders. The platform makes use of various bespoke tools to act as an aggregator for DeFi protocols such as Curve, Compound and Aave, bringing those who stake cryptocurrency the highest possible yield.

YFI Price Analysis

At the time of writing, YFI is ranked the 83rd cryptocurrency globally and the current price is US$31,967. Let’s take a look at the chart below for price analysis:

Source: TradingView

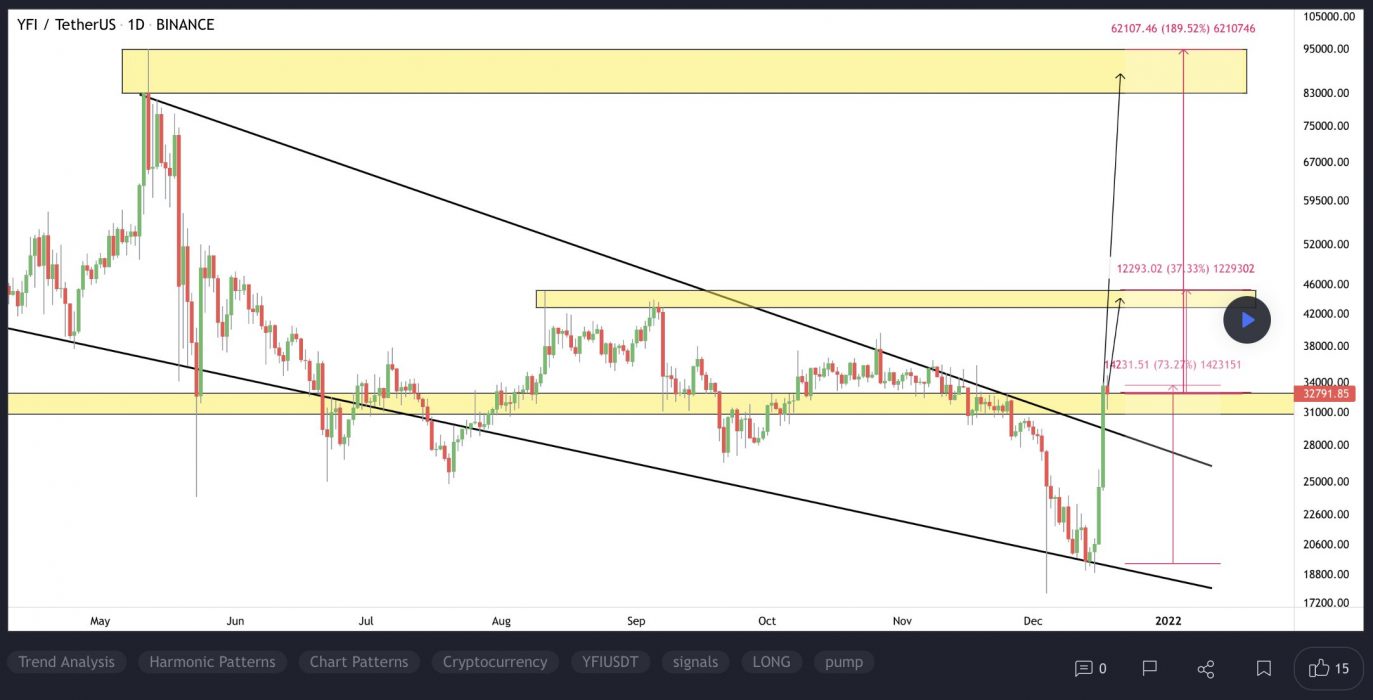
YFI‘s 58% rally during mid-December saw a second leg after last week’s market-wide drop ran the previous consolidation’s stops.

The level near $34,576 is providing some resistance. However, continuation through the monthly high at $33,156 is not out of the question. Aggressive bulls might bid in the current region near $32,132. 

If the price runs the recent swing low, bulls might bid in the gap near $29,360. A deeper retracement could reach near the mid-September level and a gap near $28,190. The region near $27,753 and $26,935 may also provide some support during a deeper retracement.

2. MyNeighborAlice (ALICE)

ALICE is a multiplayer builder game where anyone can buy and own virtual islands, collect and build exciting items, and meet new friends. Inspired by successful games such as Animal Crossing, the game combines the best of the two worlds – a fun narrative for regular players who want to enjoy the gameplay experience, as well as an ecosystem for players who want to collect and trade non-fungible tokens (NFTs).

ALICE Price Analysis

At the time of writing, ALICE  is ranked the 154th cryptocurrency globally and the current price is US$12.18. Let’s take a look at the chart below for price analysis:

Source: TradingView

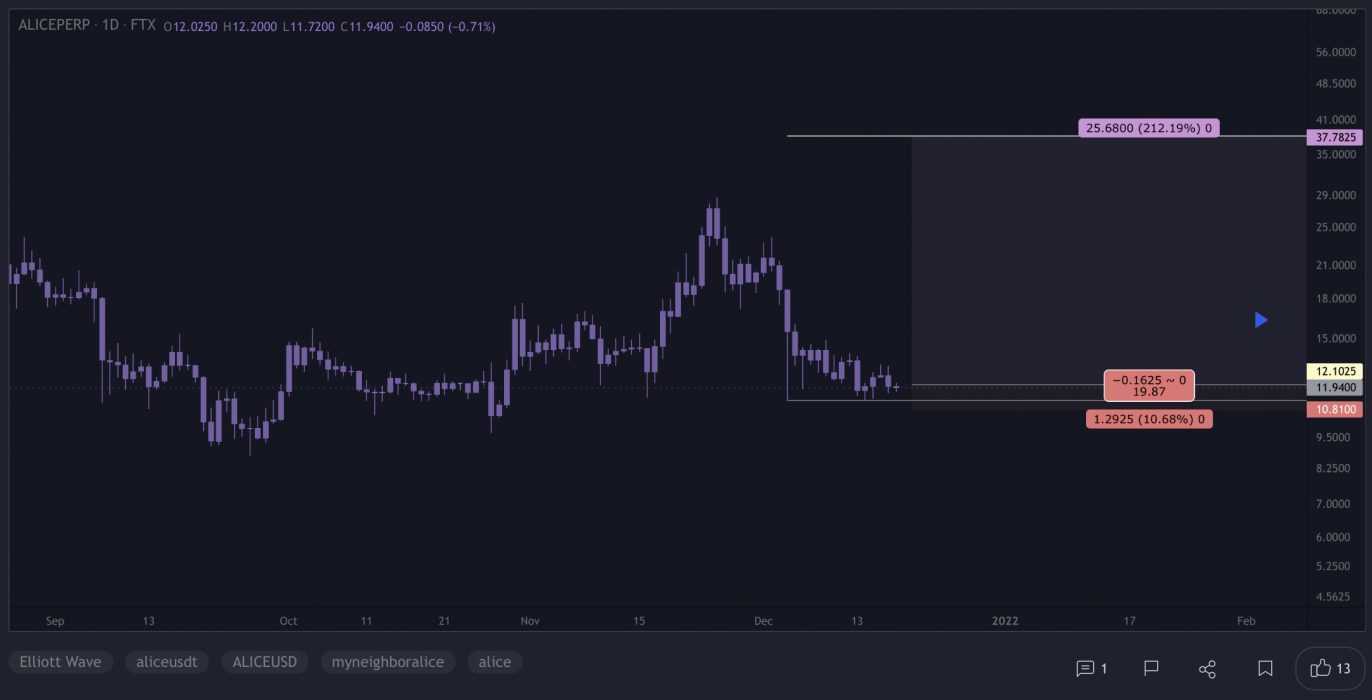
After accumulating under the November monthly open, ALICE rallied 105% in a week before retracing to support near $18.55. Buyers continue to snatch up dips under the weekly open, suggesting that accumulation is still taking place. 

Bulls could look for entries in this region while being conscious of a potential stop run below the cluster of lows at $13.17. Two areas of support, beginning near $11.57 and $9.29, provide probable buys if the price dips this low.

The equal highs near $15.63 provide a first reasonable bullish target. If the price takes this target and penetrates the surrounding resistance, the next probable resistance begins near $18.66. Possible targets include the old highs just above this resistance near $20.83, $21.46, and $22.39.

3. Alien Worlds (TLM)

Alien Worlds TLM is a decentralised, non-fungible token (NFT) metaverse where players compete for scarce resources of Trilium (TLM) in a simulated economy based around planetary worlds. Due to this, Alien Worlds also has a decentralised finance (DeFi) element to the game, as players advance by staking TLM and using TLM to vote in Planet Decentralised Autonomous Organisations (DAOs). 

TLM Price Analysis

At the time of writing, TLM is ranked the 298th cryptocurrency globally and the current price is US$0.2113. Let’s take a look at the chart below for price analysis:

Source: TradingView

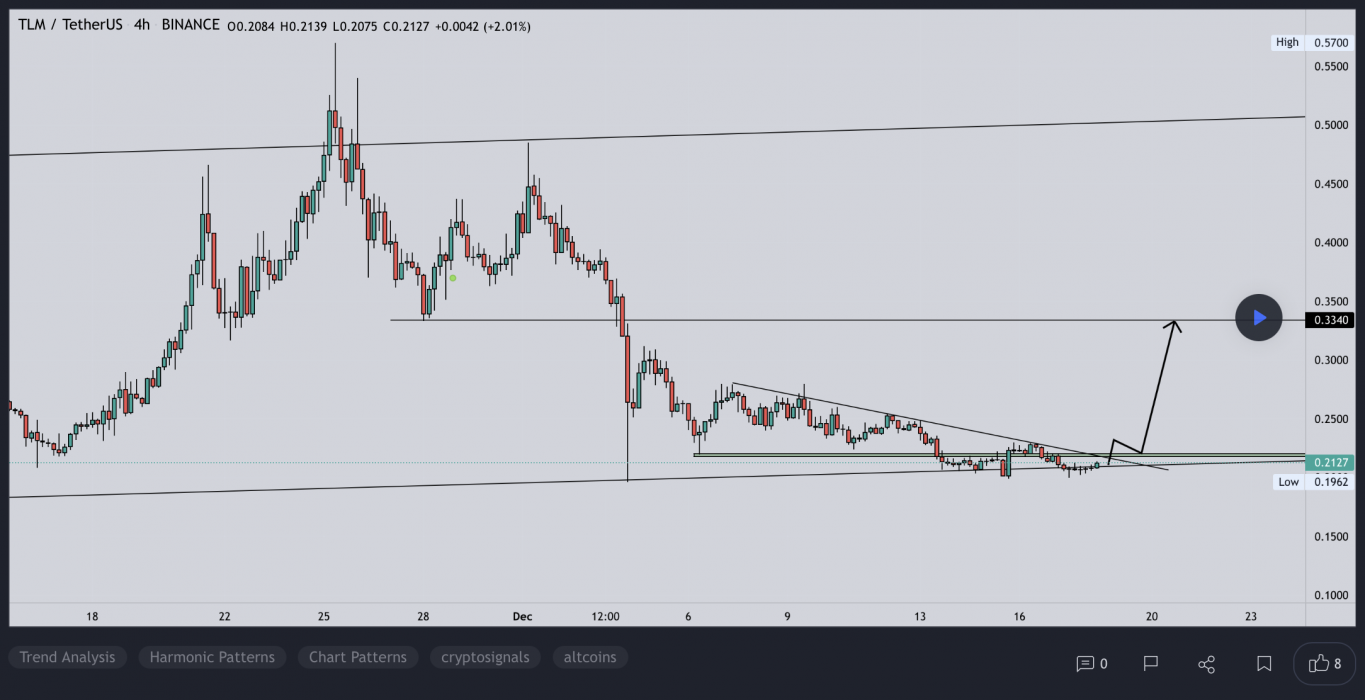
TLM formed relatively equal lows near $0.1924 after dropping over 45% during November. These lows could provide the target for another leg down, possibly finding support in the monthly gap of around $0.1785. 

If this sweep of the $0.1753 swing lows occurs, more aggressive bulls might begin bidding the weekly level near the swing low around $0.1644. Should the market take a more bullish turn, the level just below near $0.1563 could provide some short-term support.

The steep drop left large areas of inefficient price action, making the daily gap up to $0.2436 likely to be touched or filled. A sustained move through this resistance could visit a significant area on the monthly and weekly chart near $0.2605.

Learn How to Trade Live!

Join Dave and The Crypto Den Crew and they’ll show you live on a webinar how to take your crypto trading to the next level.

Where to Buy or Trade Altcoins?

These coins have high liquidity on Binance Exchange, so that could help with trading on AUD/USDT/BTC pairs. And if you’re looking at buying and HODLing cryptos, then Swyftx Exchange is an easy-to-use popular choice in Australia.

Categories
Binance Coin Crypto News Market Analysis Solana Trading

Top 3 Coins to Watch Today: BNB, SOL, MATIC – December 17 Trading Analysis

Let’s take a closer look at today’s altcoins showing breakout signals. We’ll explain what the coin is, then dive into the trading charts and provide some analysis to help you decide.

1. Binance Coin (BNB)

Binance BNB is the biggest cryptocurrency exchange globally, based on daily trading volume. Binance aims to bring cryptocurrency exchanges to the forefront of world financial activity. Aside from being the largest cryptocurrency exchange, Binance has launched a whole ecosystem of functionalities for its users. The Binance network includes the Binance Chain, Binance Smart Chain, Binance Academy, Trust Wallet, and Research projects, which all employ the powers of blockchain technology to bring new-age finance to the world. Binance Coin is an integral part of the successful functioning of many of the Binance sub-projects.

BNB Price Analysis

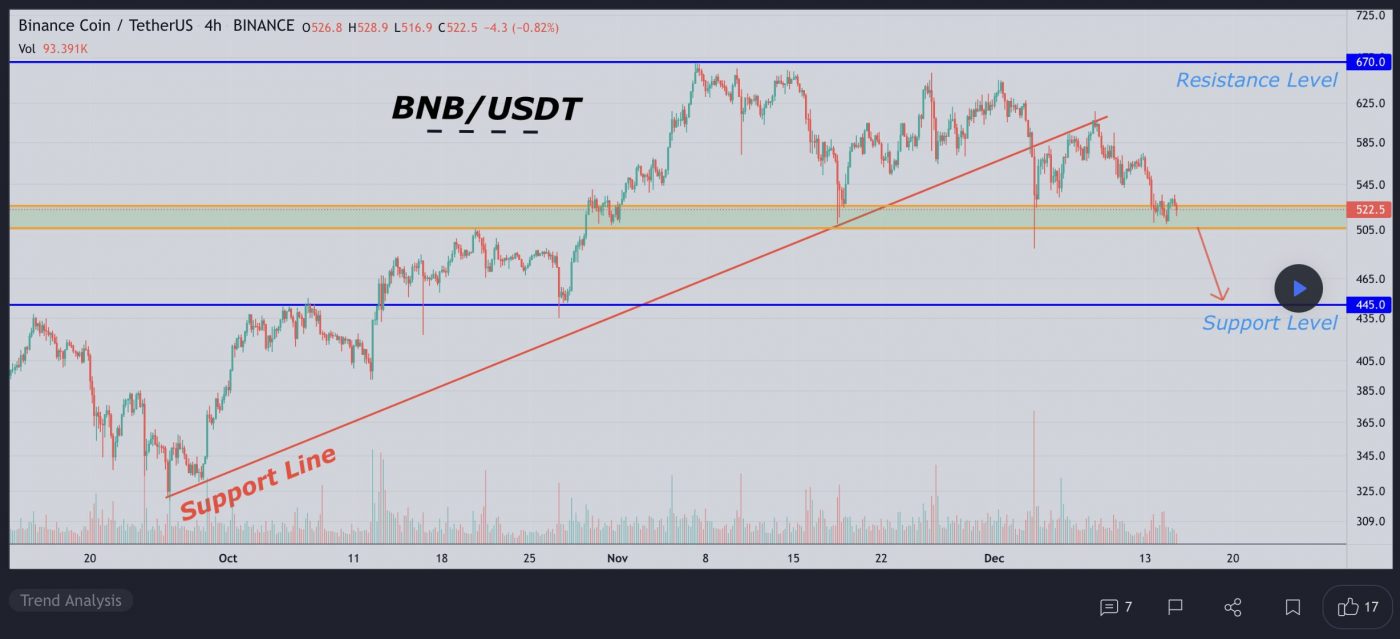
At the time of writing, BNB is ranked the 3rd cryptocurrency globally and the current price is US$548.67. Let’s take a look at the chart below for price analysis:

Source: TradingView

After a 60% decline from August to September, BNB has ranged between $650.23 and $516.55.

The recent rally was approaching probable resistance near $610.33 but could be aiming for stops above the relatively equal highs near $560.21. Continuation of the bullish move could target the daily gap near $578.12.

Aggressive bulls might add to positions near $557.67 and $550.32. Price action near $528.66 may be more likely to provide support – if it gets there – during any retracements.

Relatively equal lows clustered around $487.47 seem likely to be swept if the bearish trend resumes. If this move occurs, the price might find support at the significant higher-timeframe level near $445.90.

2. Solana (SOL)

Solana SOL is a highly functional open-source project that banks on blockchain technology’s permissionless nature to provide decentralised finance (DeFi) solutions. The Solana protocol is designed to facilitate decentralised app (DApp) creation. It aims to improve scalability by introducing a proof-of-history (PoH) consensus combined with the underlying proof-of-stake (PoS) consensus of the blockchain.

SOL Price Analysis

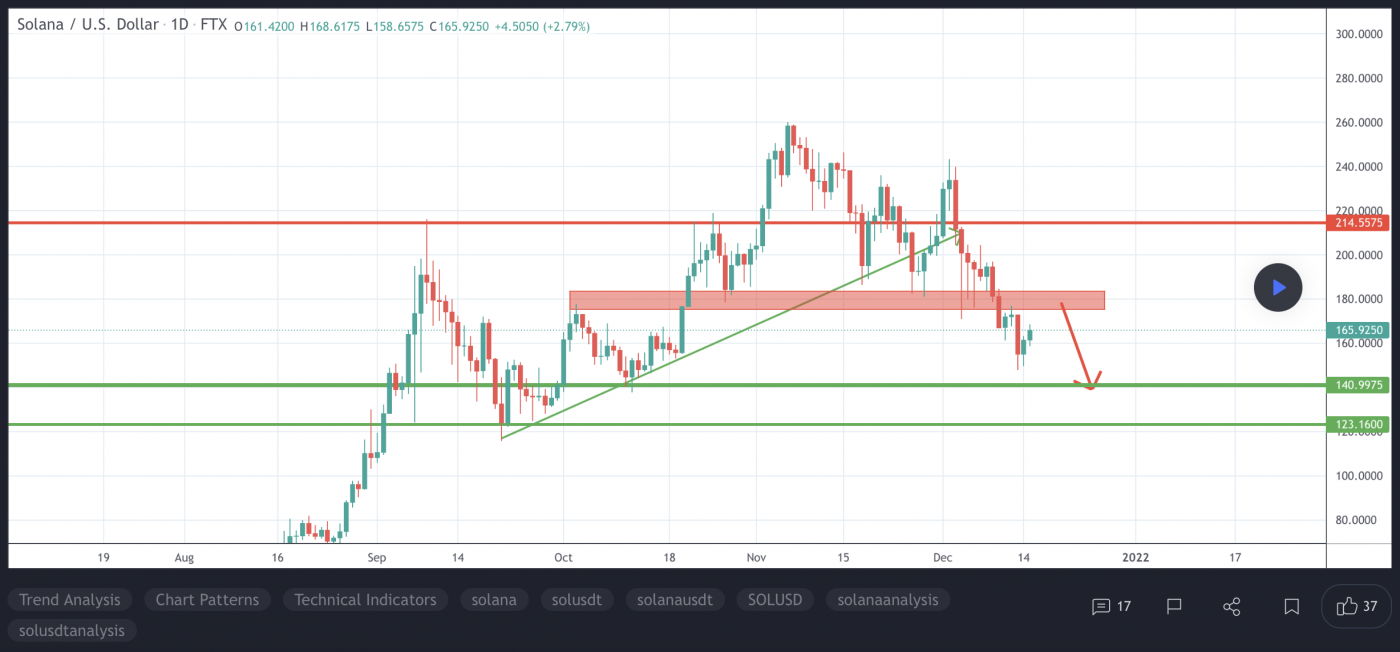
At the time of writing, SOL is ranked the 5th cryptocurrency globally and the current price is US$186.04. Let’s take a look at the chart below for price analysis:

Source: TradingView

SOL retraced nearly 65% from its high before finding a low during last week. Since then, the price has been sweeping stops on both sides of its local range as the current consolidation sets up the next move.

Aggressive bulls might bid near $172.34, although a sweep of the stops near $165.61 could reach below the next swing low into possible support near $150.12. A continued downtrend might run into the weekly gap near $144.26.

Some bears might add more shorts near $195.87, although a push to $210.66 is reasonable. A daily candle close over the swing high near $230.04 could suggest that a longer-term trend reversal is in play, with bulls possibly entering on a retracement near $245.32 for monthly high prices.

3. Polygon (MATIC)

Polygon MATIC is the first well-structured, easy-to-use platform for Ethereum scaling and infrastructure development. Its core component is Polygon SDK, a modular, flexible framework that supports building multiple types of applications. The MATIC token will continue to exist and will play an increasingly important role, securing the system and enabling governance.

MATIC Price Analysis

At the time of writing, MATIC is ranked the 14th cryptocurrency globally and the current price is US$2.18. Let’s take a look at the chart below for price analysis:

Source: TradingView

Q4 2021 marked a turning point for MATIC, with the price rocketing up almost 125% from its lows to probable resistance beginning near $2.45.

The price is currently struggling with the area between $1.88 and $2.23. This region could provide support after a close above, or resistance after a close below. 

A retracement could reach into the daily gap and possible support around $2.08. A more bearish shift in the marketplace will likely aim for the relatively equal lows near $1.92, and the potential support just below that begins around $1.85.

Continuation to the upside will likely target the recent monthly highs near $2.30. However, probable resistance beginning at $2.36 and $2.42 could cap or slow down this move.

Learn How to Trade Live!

Join Dave and The Crypto Den Crew and they’ll show you live on a webinar how to take your crypto trading to the next level.

Where to Buy or Trade Altcoins?

These coins have high liquidity on Binance Exchange, so that could help with trading on AUD/USDT/BTC pairs. And if you’re looking at buying and HODLing cryptos, then Swyftx Exchange is an easy-to-use popular choice in Australia.
Categories
Crypto News Market Analysis Trading

Top 3 Coins to Watch Today: GALA, LUNA, CAKE – December 16 Trading Analysis

Let’s take a closer look at today’s altcoins showing breakout signals. We’ll explain what the coin is, then dive into the trading charts and provide some analysis to help you decide.

1. Gala (GALA)

GALA aims to take the gaming industry in a different direction by giving players back control over their games. Gala Games’ mission is to make “blockchain games you’ll actually want to play”. The project wants to change the fact that players can spend hundreds of dollars on in-game assets, and countless hours playing the game, all of which could be taken away from them with the click of a button. It plans to reintroduce creative thinking into games by giving players control of the games and in-game assets with the help of blockchain technology.

GALA Price Analysis

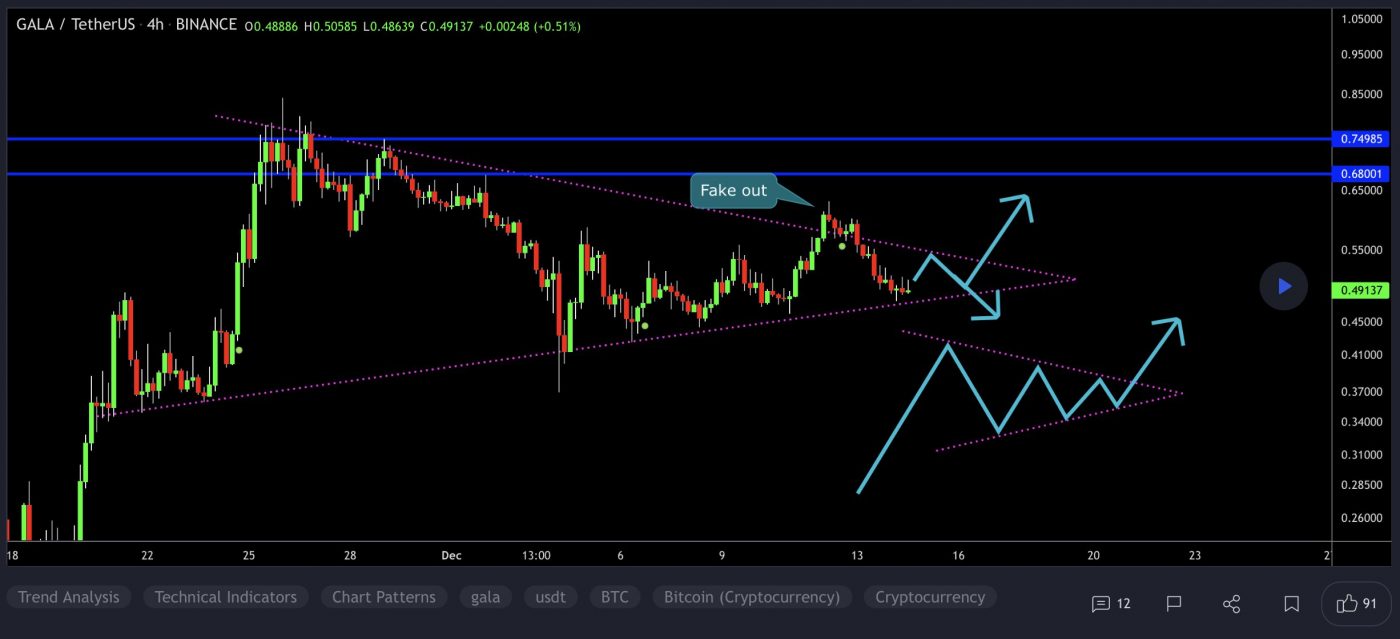
At the time of writing, GALA is ranked the 40th cryptocurrency globally and the current price is US$0.4888. Let’s take a look at the chart below for price analysis:

Source: TradingView

After setting a low in late October, GALA kicked off a bullish trend that rallied nearly 585% by November to break the new all-time highs.

The following 55% plummet found support near $0.4566, sweeping under the 40 EMA into the 61.8% retracement level before bouncing to resistance beginning at $0.4830.

This area could continue to provide resistance, possibly causing a retracement to the 9 EMA and 18 EMA near $0.5012, where aggressive bulls might begin bidding. The level near $0.5340, which has confluence with the 40 EMA, may see more interest from bulls loading up for an attempt on probable resistance beginning near $0.5780. 

However, if Bitcoin continues its sideways trend, much lower prices could be seen. The old support near $0.4231 could provide at least a short-term bounce. If this level fails, the old highs near $0.3950 might also give support and see the start of a new bullish cycle after retesting these support levels.

2. Terra (LUNA)

Terra LUNA is a blockchain protocol that uses fiat-pegged stablecoins to power price-stable global payments systems. According to its white paper, Terra combines the price stability and wide adoption of fiat currencies with the censorship-resistance of Bitcoin, and offers fast and affordable settlements. Terra’s native token, LUNA, is used to stabilise the price of the protocol’s stablecoins. LUNA holders are also able to submit and vote on governance proposals, giving it the functionality of a governance token.

LUNA Price Analysis

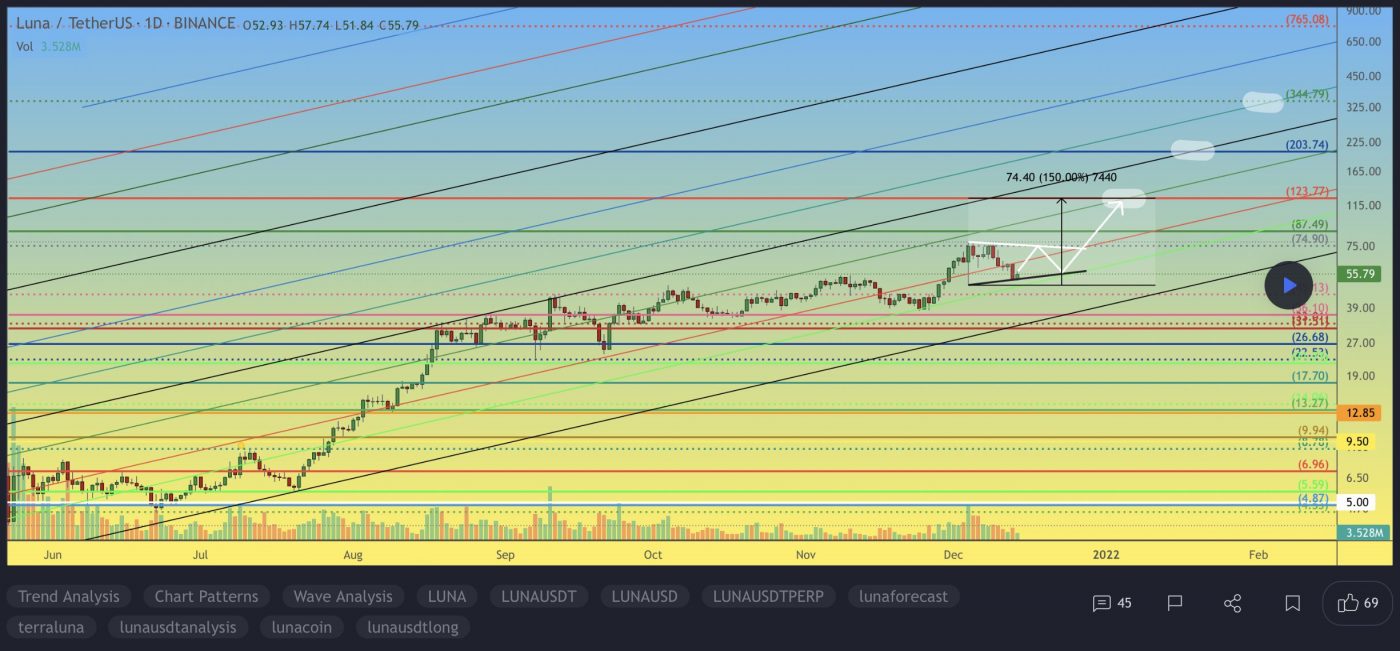
At the time of writing, LUNA is ranked the 12th cryptocurrency globally and the current price is US$56.16. Let’s take a look at the chart below for price analysis:

Source: TradingView

After breaking its all-time highs last week,  LUNA began a range that has been whiplashing both bulls and bears.

Resistance beginning near $75.23 held the price down for the monthly opening, although bulls have shown some strength near the 9 and 18 EMAs. 

A quick drop to $52.37, or into the zone beginning near $48.87, could give bulls the fuel to push through the nearby resistance. If this resistance breaks, the high near $60.47 provides a reasonable target. 

A break of this level could move further into uncharted territory with the nearest probable resistances projected around $65.28 and $70.57.

More patient bulls might be waiting far below the 40 EMA with bids close to the higher-timeframe range’s 61.8% retracement, near $45.59.

3. PancakeSwap (CAKE)

PancakeSwap CAKE is an automated market maker (AMM) – a decentralised finance (DeFi) application that allows users to exchange tokens, providing liquidity via farming and earning fees in return. PancakeSwap uses an automated market maker model where users trade against a liquidity pool. These pools are filled by users who deposit their funds into the pool and receive liquidity provider (LP) tokens in return. PancakeSwap allows users to trade BEP20 tokens, provide liquidity to the exchange and earn fees, stake LP tokens to earn CAKE, stake CAKE to earn more CAKE, and stake CAKE to earn tokens of other projects.

CAKE Price Analysis

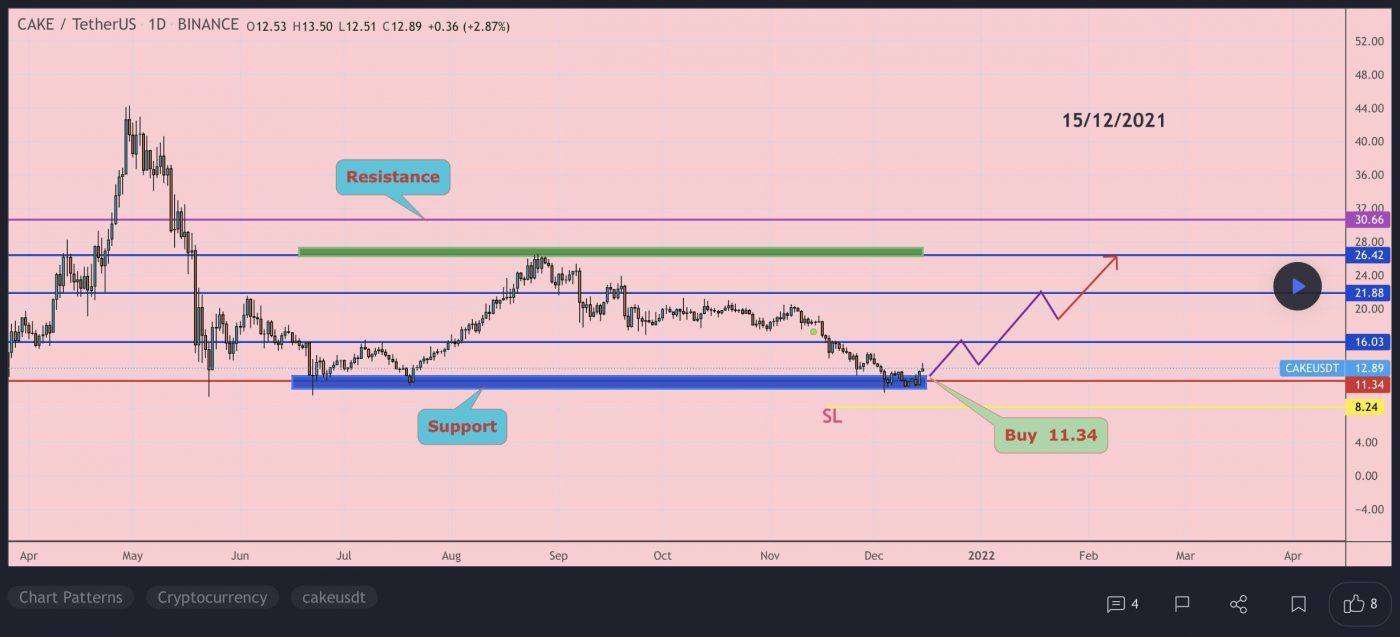
At the time of writing, CAKE is ranked the 48th cryptocurrency globally and the current price is US$12.22. Let’s take a look at the chart below for price analysis:

Source: TradingView

CAKE‘s 70% decline after August created relatively equal lows near $10.56 before bouncing over the local range’s midpoint near $13.60. A bullish altcoin market could help CAKE bulls regain a stronger bullish trend.

Aggressive bulls could look for entries in the daily gap starting near $11.27. The monthly open aligns with more probable support near $10.74. 

A stop run below the monthly open near $9.62 might provide a more favourable entry. A more substantial bearish move – perhaps from a sharp drop in Bitcoin’s price – could challenge support near $8.90, just above the equal lows.

Resistance rests just above, with the zone from $14.59 to $18.26 likely to provide a short-term ceiling. A break through this level might target resistance just under the cluster of relatively equal highs near $21.47. 

Beyond these highs, resistance near $23.15 provides a final challenge before attacking an old daily swing high near $25.86.

Learn How to Trade Live!

Join Dave and The Crypto Den Crew and they’ll show you live on a webinar how to take your crypto trading to the next level.

Where to Buy or Trade Altcoins?

These coins have high liquidity on Binance Exchange, so that could help with trading on AUD/USDT/BTC pairs. And if you’re looking at buying and HODLing cryptos, then Swyftx Exchange is an easy-to-use popular choice in Australia. You can also buy these coins from different exchanges listed on Coinmarketcap.
Categories
Crypto News Market Analysis Trading

VOXEL Pumps +1650% in a Single Day After Listing on Binance Launchpad

VOXEL is trading in an uptrend and pumped up to +1650% in a single day after listing on Binance Launchpad, surging +1875% in a week.

What is Voxies?

Voxies VOXEL is a free-to-play, 3D turn-based tactical RPG game on blockchain. The main gameplay of Voxies is similar to a traditional RPG and tactical game, but it is powered by blockchain technology and ownership is central to the core concepts of the game. As a team-based tactical game, players can control multiple characters in the game and each character can be represented by Voxies that are directly owned as NFTs, or provided by the game for free-to-play players.

VOXEL Price Analysis

At the time of writing, VOXEL is ranked the 2530th cryptocurrency globally and the current price is US$3.68. Let’s take a look at the chart below for price analysis:

TradingView Chart
Source: TradingView

After the launch of VOXEL on Binance Launchpad, it pumped up to $4.15 having +1650% gains in just a few minutes, and the initial opening price of VOXEL was $0.2530 at Binance Exchange with many different trading pairs such as VOXEL/BTC, VOXEL/USDT, and VOXEL/BUSD.

Currently, VOXEL is trading at $3.65 price levels after breaking out the squeeze resistance in its sideways trend and is now heading towards its all-time high price.

What Do the Technical Indicators Say?

The VOXEL TradingView indicators (on the 1-day) mainly indicate VOXEL as a Strong Buy, except the Oscillators which indicate VOXEL as a Neutral.

So Why Did VOXEL Break Out?

Recent news was announced regarding the VOXEL token sale on Binance launchpad.

Learn How to Trade Live!

Join Dave and The Crypto Den Crew and they’ll show you live on a webinar how to take your crypto trading to the next level.

Where to Buy or Trade VOXEL?

VOXEL has the highest liquidity on Binance Exchange, so that would help for trading VOXEL/BTC or VOXEL/USDT pairs. You can also buy VOXEL from different exchanges listed on CoinMarketCap.

Categories
Crypto News Market Analysis Stellar Trading

Top 3 Coins to Watch Today: XLM, DOT, ATOM – December 15 Trading Analysis

Let’s take a closer look at today’s altcoins showing breakout signals. We’ll explain what the coin is, then dive into the trading charts and provide some analysis to help you decide.

1. Stellar (XLM)

Stellar XLM is an open network that allows money to be moved and stored. When it was released, the goal was boosting financial inclusion by reaching the world’s unbanked – but soon after, its priorities shifted to helping financial firms connect with one another through blockchain technology. The network’s native token, lumens, serves as a bridge that makes it less expensive to trade assets across borders. All of this aims to challenge existing payment providers who often charge high fees for a similar service.

XLM Price Analysis

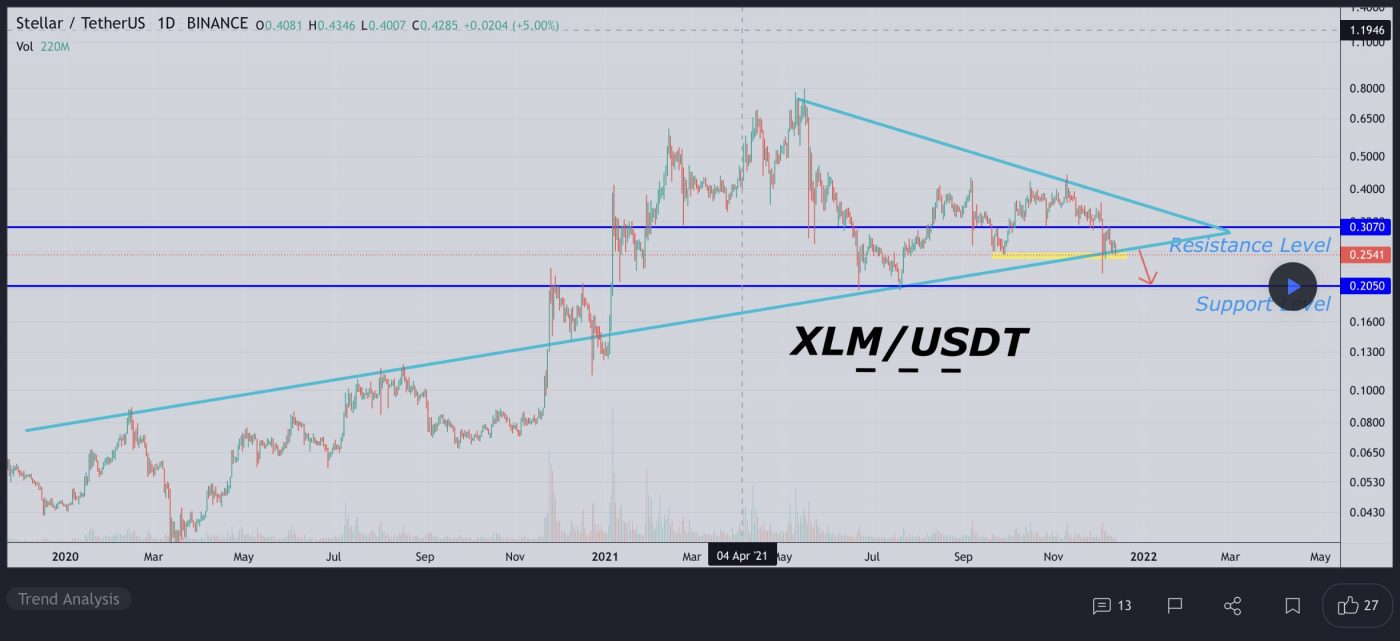
At the time of writing, XLM is ranked the 25th cryptocurrency globally and the current price is US$0.2607. Let’s take a look at the chart below for price analysis:

Source: TradingView

XLM set a high near $0.7257 in May before retracing nearly 80% to find a low near $0.2480. The price consolidated around this level before the strong bullish impulse during the past several weeks.

Probable resistance near $0.3678 is slowing the bullish advance down. However, another leg might target the last swing high at $0.4122 and relatively equal highs at $0.4436. Resistance near $0.4759 could cap the move before the second swing high. Beyond these levels, little stands in the bulls’ way before reaching the swing high near $0.5049.

A retracement before a move higher might find support in the daily gap near $0.2723, just above the monthly open. Relatively equal lows near $0.2575 could also provide support. A run-on stops at $0.2416 and $0.2331 might find support in the gap beginning near $0.2146 or a high-timeframe level near $0.1973.

2. Polkadot (DOT)

Polkadot DOT is an open-source sharding multichain protocol that facilitates the cross-chain transfer of any data or asset types, not just tokens, thereby making a wide range of blockchains interoperable with each other. Polkadot’s native DOT token serves three clear purposes: providing network governance and operations, and creating parachains by bonding. The Polkadot protocol connects public and private chains, permissionless networks, oracles and future technologies, allowing these independent blockchains to trustlessly share information and transactions through the Polkadot relay chain.

DOT Price Analysis

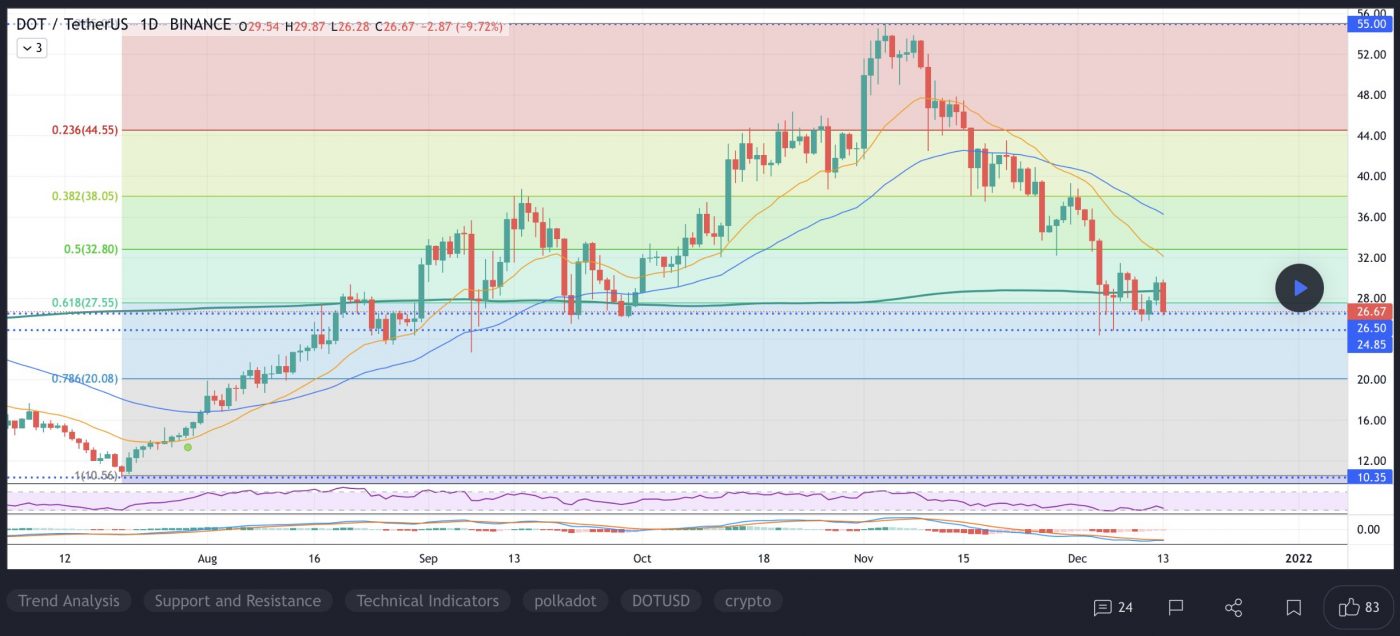
At the time of writing, DOT is ranked the 10th cryptocurrency globally and the current price is US$25.95. Let’s take a look at the chart below for price analysis:

Source: TradingView

DOT consolidates between $25.44 and $35.70 at the 100% extension of September’s consolidation after a sharp move up through all-time during November.

The current consolidation could provide support if the price breaks the zone’s high near $35.51. A better risk-to-reward entry could present itself near the daily candle bodies of the last swing high near $29.37, which also has confluence with the 18 EMA and the 61.8% retracement. This potential drop could reach to possibly support the August open and 78.6% retracement, near $23.68.

A sharper downturn in the market could send the price as low as $22.89, near the last significant swing high in this leg, although a move this low could signal the start of a bearish trend.

Extensions from September’s consolidation indicate that the 150% extension, near $41.70, and the 200% extension, near $49.62, could be the next significant targets.

3. Cosmos (ATOM)

Cosmos ATOM bills itself as a project that solves some of the “hardest problems” facing the blockchain industry. It aims to offer an antidote to “slow, expensive, unscalable and environmentally harmful” proof-of-work protocols, like those used by Bitcoin, by offering an ecosystem of connected blockchains. ATOM tokens are earned through a hybrid proof-of-stake algorithm, and they help to keep the Cosmos Hub, the project’s flagship blockchain, secure. This cryptocurrency also has a role in the network’s governance.

ATOM Price Analysis

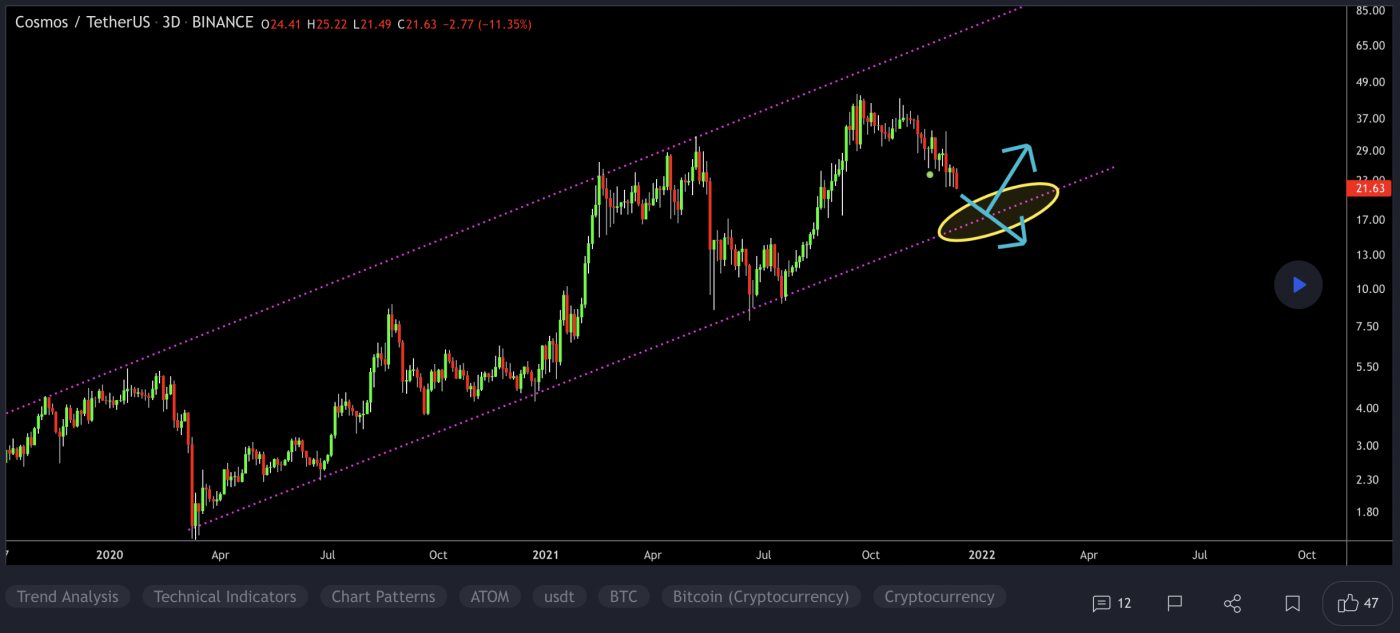
At the time of writing, ATOM is ranked the 35th cryptocurrency globally and the current price is US$21.61. Let’s take a look at the chart below for price analysis:

Source: TradingView

Q3 provided respectable 198% gains for bulls who bought ATOM at the monthly open, with the price finding resistance near $30.12.

If bulls take back control this month, the top of the former gap beginning at $20.44 may provide support for at least a short-term bounce. The top of the consolidation range starting near $18.58 is more likely to provide substantial support.

The most robust support is likely to be found in the overlapping consolidation ranges between $17.74 and $16.06, with a sharp slice through these levels possibly suggesting the end of the bull run.

The region from approximately $27.70 to the most recent swing high is likely to provide some resistance. The swing high provides a reasonable first target for a possible next leg up. 

If this high breaks, the 1.0 extension near $32.21 and the 2.0 extension near $38.90 may provide the next primary targets.

Learn How to Trade Live!

Join Dave and The Crypto Den Crew and they’ll show you live on a webinar how to take your crypto trading to the next level.

Duration: 6-week course
From: November 15 to December 22
Date/Time: Twice a week, Mon and Wed at 7pm AEST
Location: Zoom webinar

Where to Buy or Trade Altcoins?

These coins have high liquidity on Binance Exchange, so that could help with trading on AUD/USDT/BTC pairs. And if you’re looking at buying and HODLing cryptos, then Swyftx Exchange is an easy-to-use popular choice in Australia.
Categories
Crypto News Dogecoin Market Analysis Trading

Dogecoin Surges +45% in a Single Day Amid Tesla to Make Merchandise Buyable with Doge

Dogecoin is trading in an active uptrend and strong trading volume today. The cryptocurrency gained over +45% in a single day by breaking a falling wedge pattern with strong buying volume on multiple exchanges and surged over +70% in a week.

Let’s take a quick look at the Dogecoin price analysis and possible reasons for the recent breakout.

What is Dogecoin?

Dogecoin DOGE is based on the popular “Doge” internet meme and features a Shiba Inu as its logo. The open-source digital currency was created by Billy Markus from Portland, Oregon, and Jackson Palmer from Sydney, Australia, and was forked from Litecoin in December 2013. Dogecoin’s creators envisaged it as a fun, lighthearted cryptocurrency that would have greater appeal beyond the core Bitcoin audience since it was based on a dog meme.

DOGE Price Analysis

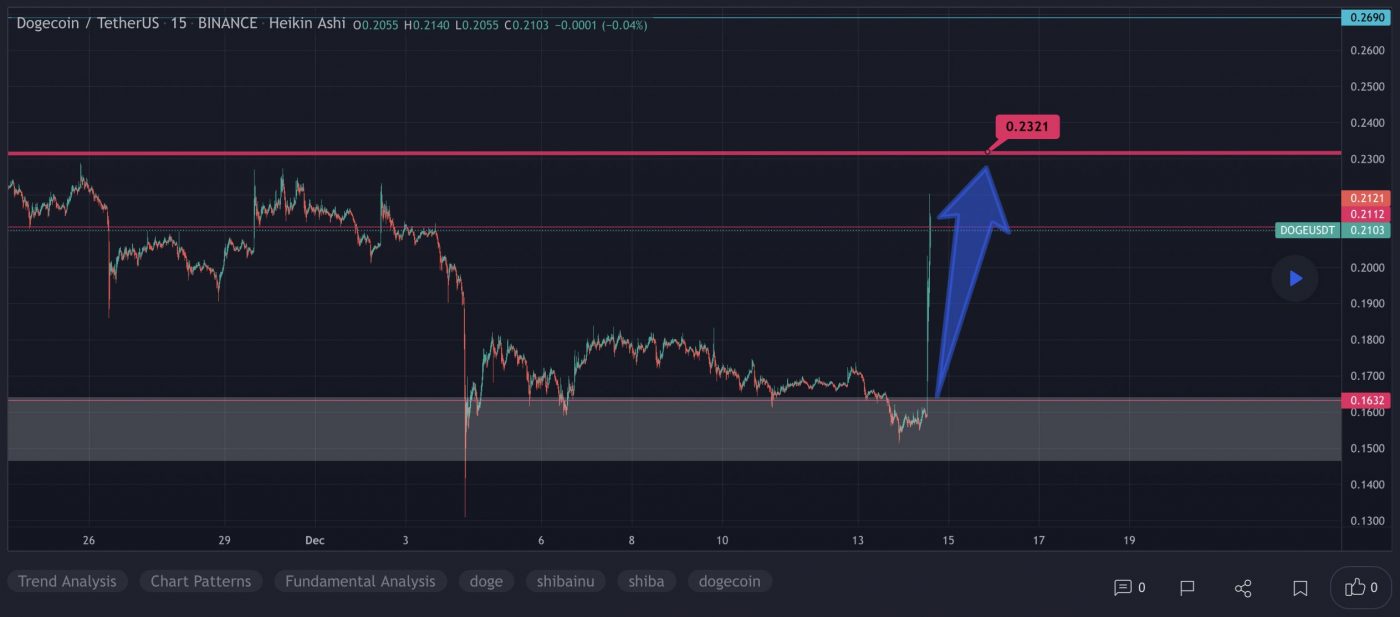
At the time of writing, DOGE is ranked the 9th cryptocurrency globally and the current price is US$0.2154. Let’s take a look at the chart below for price analysis:

Source: TradingView

After looking at the above 15-M candle chart, we can clearly see that Dogecoin was trading inside the falling wedge pattern on the DOGE/USDT pair. The first resistance was on the $0.1733 price level, which DOGE broke with a strong bullish trend buying volume and is now heading towards the recent high price at $0.2560. Seeing that many Altcoins are holding a strong position this week after the recent bitcoin price crash, DOGE may continue to increase in the uptrend if traders keep buying with high volume.

“The falling wedge pattern is characterised by a chart pattern which forms when the market makes lower lows and lower highs with a contracting range. When this pattern is found in a downward trend, it is considered a reversal pattern, as the contraction of the range indicates the downtrend is losing steam.”

What Do the Technical Indicators Say?

The DOGE TradingView indicators (on the 1-day) mainly indicate DOGE as a Buy.

So Why Did DOGE Break Out?

General market sentiment seems to suggest cryptos are hopefully turning back bull run season after recent price corrections. Another reason for this sudden pump in price could be whales secretly buying DOGE for the coming Altcoins rally. A recent tweet was also posted by Elon Musk regarding Tesla to make some merch buyable with Dogecoin:

Learn How to Trade Live!

Join Dave and The Crypto Den Crew and they’ll show you live on a webinar how to take your crypto trading to the next level.

Duration: 6-week course
From: November 15 to December 22
Date/Time: Twice a week, Mon and Wed at 7pm AEST
Location: Zoom webinar

Where to Buy or Trade DOGE?

Dogecoin has the highest liquidity on Binance Exchange, so that would help for trading DOGE/BTC or DOGE/USDT pairs. And if you’re looking at buying and HODLing cryptos, then Swyftx Exchange is an easy-to-use popular choice in Australia.
Categories
Crypto News Market Analysis Trading

Top 3 Coins to Watch Today: ALU, LIT, SCRT – December 14 Trading Analysis

Let’s take a closer look at today’s altcoins showing breakout signals. We’ll explain what the coin is, then dive into the trading charts and provide some analysis to help you decide.

1. Altura (ALU)

Altura ALU is a smart contract platform that allows game developers to mint, distribute and transact Smart NFTs representing in-game items. Smart NFTs are NFTs with dynamic properties that can change based on certain conditions. They are the next step to making decentralised in-game items mainstream and offer a massive range of potential opportunities that are not possible with traditional NFTs. We want to create an easy-to-use interface and API for creating Smart NFTs, an open marketplace for transacting NFTs using the Altura token, and we want to introduce truly random smart loot boxes to the blockchain.

ALU Price Analysis

At the time of writing, ALU is ranked the 297th cryptocurrency globally and the current price is US$0.1299. Let’s take a look at the chart below for price analysis:

Source: TradingView

ALU‘s parabolic 1,240% rally ended three weeks after it began, then retraced over 76% from its highs.

The price had a slight bounce at the lower end of the daily consolidation, near $0.1118 and the 78.6% retracement of Q4’s rally. It remains to be seen if this price can continue to provide support in the face of the current bearish market conditions.

The 9 EMA near $0.1708 may offer some resistance. If the price breaks through this level, it could reach a zone near the 18 EMA and swing low, from $0.2078 to $0.2279. Any reclaim of this level will likely encounter strong resistance near $0.2712.

A broad zone from $0.0892 to $0.0467 could offer support and mark a bottom. Inside this zone, a more narrow range from $0.0748 to $0.0594 might provide more sensitivity. Today’s token utility update may increase buying pressure, which also increases the odds of longer-term bullish reversal as the price approaches this zone.

Should the price break through this level, the consolidation lows near $0.0339 may be the bearish target. However, a lack of apparent higher-timeframe support reduces the odds of picking the correct level for any longer-term bottom.

2. Litentry (LIT)

Litentry LIT is a decentralised identity authentication and user activity data management Infrastructure. Build on Substrate, Ready for Polkadot. Litentry is helping support change that is in favour of a user-centric network with the blockchain. Litentry includes an identity-based network and related tools, and features an identity matching and identity staking mechanism; as a whole it consists of decentralised identity and user activity data management infrastructure.

Litentry Price Analysis

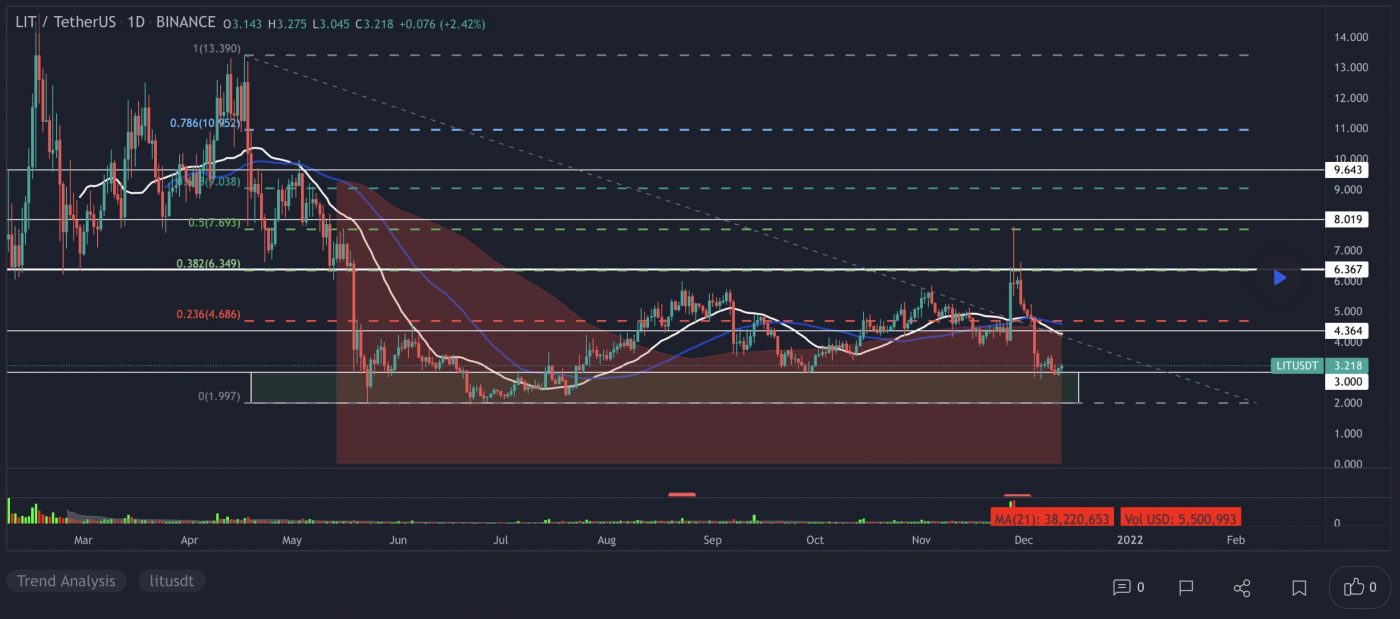
At the time of writing, LIT is ranked the 466th cryptocurrency globally and the current price is US$2.78. Let’s take a look at the chart below for price analysis:

Source: TradingView

LIT has spent the second half of 2021 in a range. It spiked through this range’s high in late November before an aggressive move toward the range lows.

The price found support near $2.979, near the origin of a rally in early July, and created a week-long consolidation. However, the swing low that began October’s rally is just above, at $3.008, and is likely to provide resistance. It may cause further consolidation at the current area before a decisive break – perhaps lower as traders sell after the parachain crowdloan ends.

A break under the support near $2.979 might target the swing lows and possible support near $2.220. Below this level, there is little apparent higher-timeframe support.

If bulls appear, a break through the current resistance near the 9 EMA, around $3.008, might find resistance from $3.857 to $4.478.

A sustained bullish shift in the market could propel the price through December’s monthly open into probable resistance near the high at $5.909 and lows of early 2021’s consolidation near $6.832.

3. Secret (SCRT)

Secret SCRT is the native coin of the Secret Network, a decentralised network for private/secure computation. Nodes on the network (known as secret nodes) can perform generalisable computations over encrypted data, which allows smart contracts (known as secret contracts) to use private and sensitive data as inputs. Our focus is on computational privacy, not just transactional privacy. Developers can build decentralised, privacy-preserving “Secret Apps” on the network. The privacy functionality of the Secret Network is critical for many fields, including decentralised finance, Web3, machine learning, access control, and many more.

SCRT Price Analysis

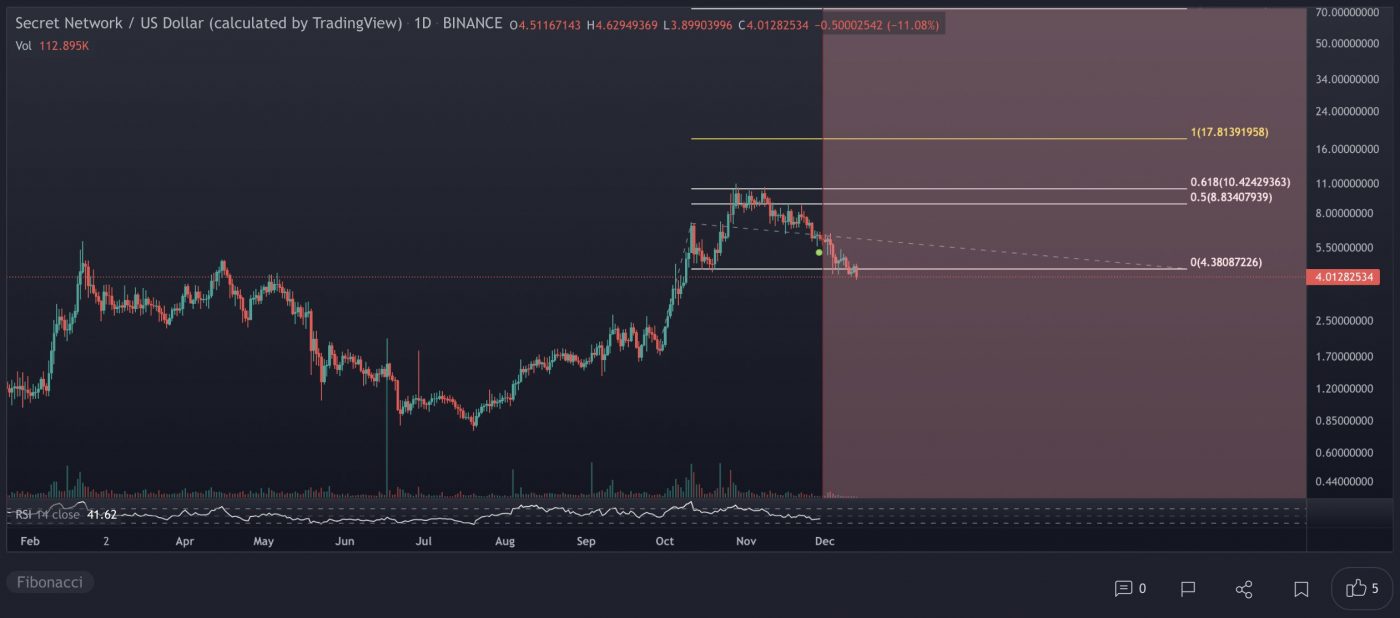
At the time of writing, SCRT is ranked the 120th cryptocurrency globally and the current price is US$4.07. Let’s take a look at the chart below for price analysis:

Source: TradingView

SCRT‘s 1,344% rally from its July lows has retraced 63% and is entering higher-timeframe support.

An area from $4.3459 to $4.1072, near the low of Q4’s bullish leg and highs of early 2021’s consolidation, could provide some support.

However, relentless selling suggests that the price may continue dropping into a thinly traded area between $3.5274 and $2.674, which has confluence with the 78.6% retracement of the Q3-Q4 rally.

Any retracement upward might meet resistance near $5.4267, which has confluence with the 18 EMA and old resistance. Short-term excitement over the NFT marketplace launch could spark this bounce, then reverse as excitement fades after the event.

A stronger push through the probable resistance near $5.4267 could reach $7.3252, where the price consolidated over an old high. However, this may not happen until the next bullish cycle. 

Close above, a zone beginning near $8.508 may provide some resistance, with more sensitivity near $9.1943.

Learn How to Trade Live!

Join Dave and The Crypto Den Crew and they’ll show you live on a webinar how to take your crypto trading to the next level.

Duration: 6-week course
From: November 15 to December 22
Date/Time: Twice a week, Mon and Wed at 7pm AEST
Location: Zoom webinar

Where to Buy or Trade Altcoins?

These coins have high liquidity on Binance Exchange, so that could help with trading on AUD/USDT/BTC pairs. And if you’re looking at buying and HODLing cryptos, then Swyftx Exchange is an easy-to-use popular choice in Australia. You can also buy these coins from different exchanges listed on Coinmarketcap.
Categories
Crypto News Market Analysis Trading

Top 3 Coins to Watch Today: FLUX, HBAR, DYDX – December 13 Trading Analysis

Let’s take a closer look at today’s altcoins showing breakout signals. We’ll explain what the coin is, then dive into the trading charts and provide some analysis to help you decide.

1. Flux (FLUX)

FLUX is the new generation of scalable decentralised cloud infrastructure. Simply develop, manage and spawn your applications on multiple servers at once. Ready for Web 3.0, DApps, and more, the Flux Ecosystem is a fully operational suite of decentralised computing services and blockchain-as-a-service solutions which offer an interoperable, decentralised, AWS-like development environment. Flux is a native GPU mineable POW (proof-of-work) coin providing incentive for hardware hosters, XDAO governance on-chain, and bad actor mitigation via staking requirements for running hardware.

FLUX Price Analysis

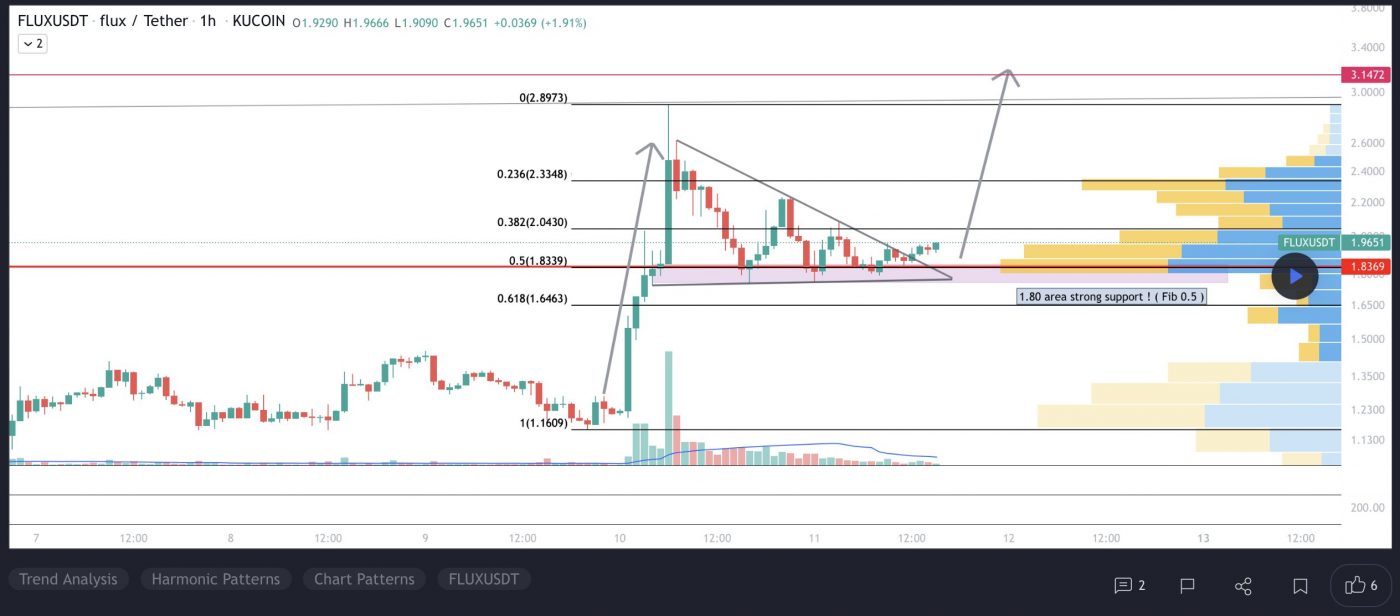
At the time of writing, FLUX is ranked the 157th cryptocurrency globally and the current price is US$1.82. Let’s take a look at the chart below for price analysis:

Source: TradingView

FLUX retraced nearly 45% from its recent all-time highs before finding a low yesterday. Since then, the price has been sweeping stops on both sides of its local range as the current consolidation sets up the next move.

Aggressive bulls might bid near $1.85, although a sweep of the stops near $1.80 could reach below the next swing low into possible support near $1.77. A continued downtrend might run into the weekly gap near $1.65.

Some bears might add more shorts near $2.25, although a push to $2.48 is reasonable. A daily candle close over the swing high near $2.70 could suggest that a longer-term trend reversal is in play, with bulls possibly entering on a retracement near $2.95 for new weekly high prices.

2. Hedera (HBAR)

Hedera Hashgraph HBAR is a public network that allows individuals and businesses to create powerful decentralised applications (DApps). It is designed to be a fairer, more efficient system that eliminates some of the limitations that older blockchain-based platforms face, such as slow performance and instability. The HBAR token has a dual role within the Hedera public network.

HBAR Price Analysis

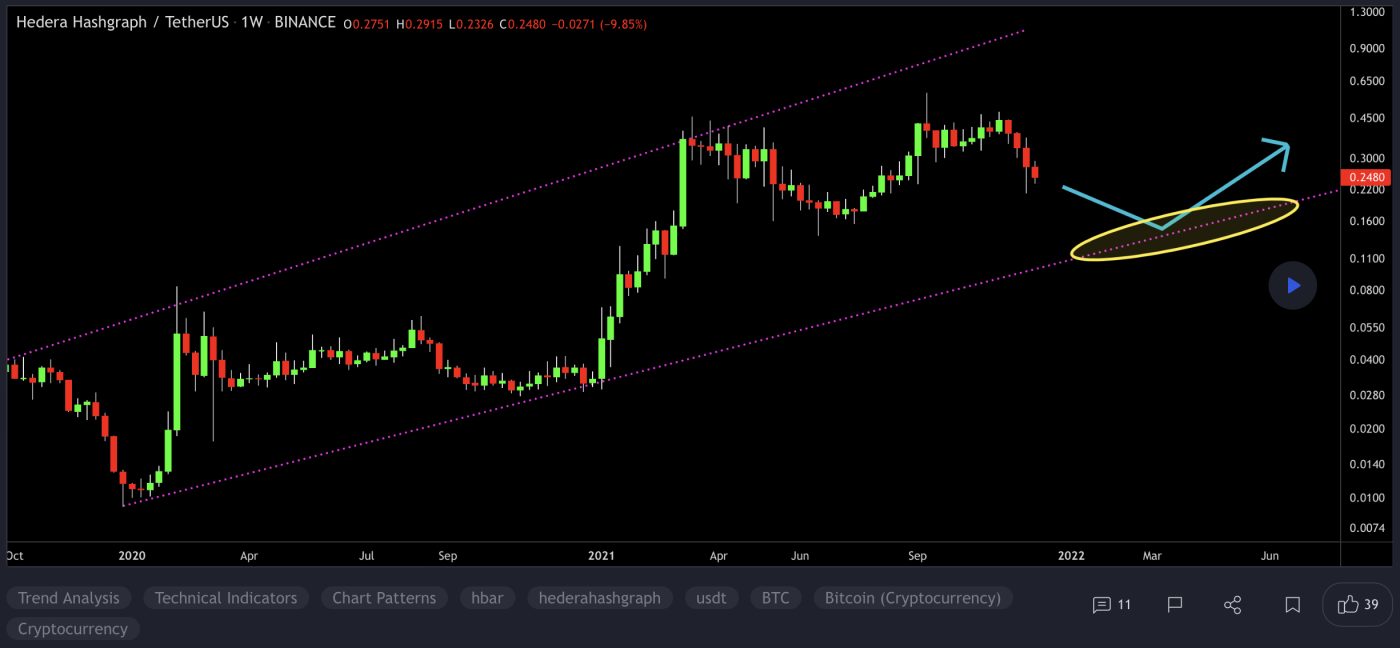
At the time of writing, HBAR is ranked the 39th cryptocurrency globally and the current price is US$0.2504. Let’s take a look at the chart below for price analysis:

Source: TradingView

HBAR‘s 109% September run retraced almost to its origin, narrowly missing probable support near $0.2395 before bears swatted down the bounce near resistance around $0.2589.

With the daily gap between $0.2312 and $0.2264 almost filled in a single wick, the price may not need to revisit areas below this level. However, the safer entry is still in probable support between $0.2145 and $0.1926, which would also sweep the lows of last week’s bounce.

The relatively equal highs near $0.2822 provide a likely first target on lower timeframes. However, the resistance beginning at $0.3135 may initially suppress a further move up.

A clean break through this resistance will need to contend with the next resistance near $0.3392, under the last swing high. This swing high at $0.3570 gives a reasonable take-profit area before a possible move to the 1.0 extension near $0.4065.

3. Dydx (DYDX)

DYDX is a governance token that allows the dYdX community to truly govern the dYdX Layer 2 Protocol. By enabling shared control of the protocol, DYDX allows traders, liquidity providers and partners of dYdX to work collectively towards an enhanced Protocol. DYDX enables a robust ecosystem around governance, rewards and staking, each designed to drive future growth and decentralisation of dYdX, resulting in a better experience for users.

DYDX Price Analysis

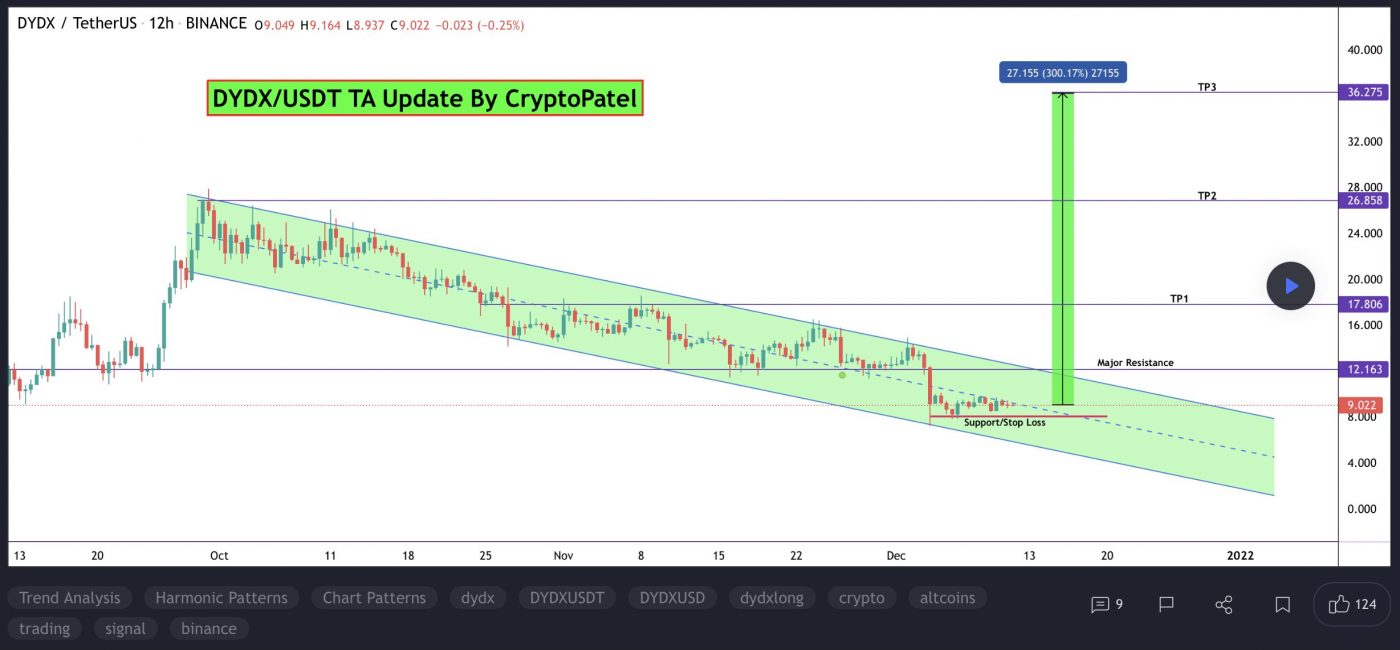
At the time of writing, DYDX is ranked the 128th cryptocurrency globally and the current price is US$8.93. Let’s take a look at the chart below for price analysis:

Source: TradingView

DYDX consolidates between $11.42 and $8.35 with the bulk of the volume concentrated in the lower half of the range. The price does not indicate a clear longer-term direction yet as stop orders build on both sides of the range.

Range traders will likely take profits or sell near $9.73. A stop run and swift rejection above $10.54 could provide a more favourable risk-to-reward entry for bears. An old 4h gap around $11.94 might cap this stop run.

Bulls will likely accumulate more long positions on a run below the relatively equal lows near $8.65. Little exists below the current range to identify precise support levels. However, the area between $8.12 and $7.69 could also give support during a deeper stop run.

If the price does break out decisively to the upside, the swing high at $12.70 provides a reasonable target. The highs and daily resistance levels between $13.47 and $15.32 may provide a second target.

Learn How to Trade Live!

Join Dave and The Crypto Den Crew and they’ll show you live on a webinar how to take your crypto trading to the next level.

Duration: 6-week course
From: November 15 to December 22
Date/Time: Twice a week, Mon and Wed at 7pm AEST
Location: Zoom webinar

Where to Buy or Trade Altcoins?

These coins have high liquidity on Binance Exchange, so that could help with trading on AUD/USDT/BTC pairs. And if you’re looking at buying and HODLing cryptos, then Swyftx Exchange is an easy-to-use popular choice in Australia. 

Categories
Crypto News Market Analysis Trading

CLV Surges +65% in a Single Day Amid Partnership with Realy Metaverse

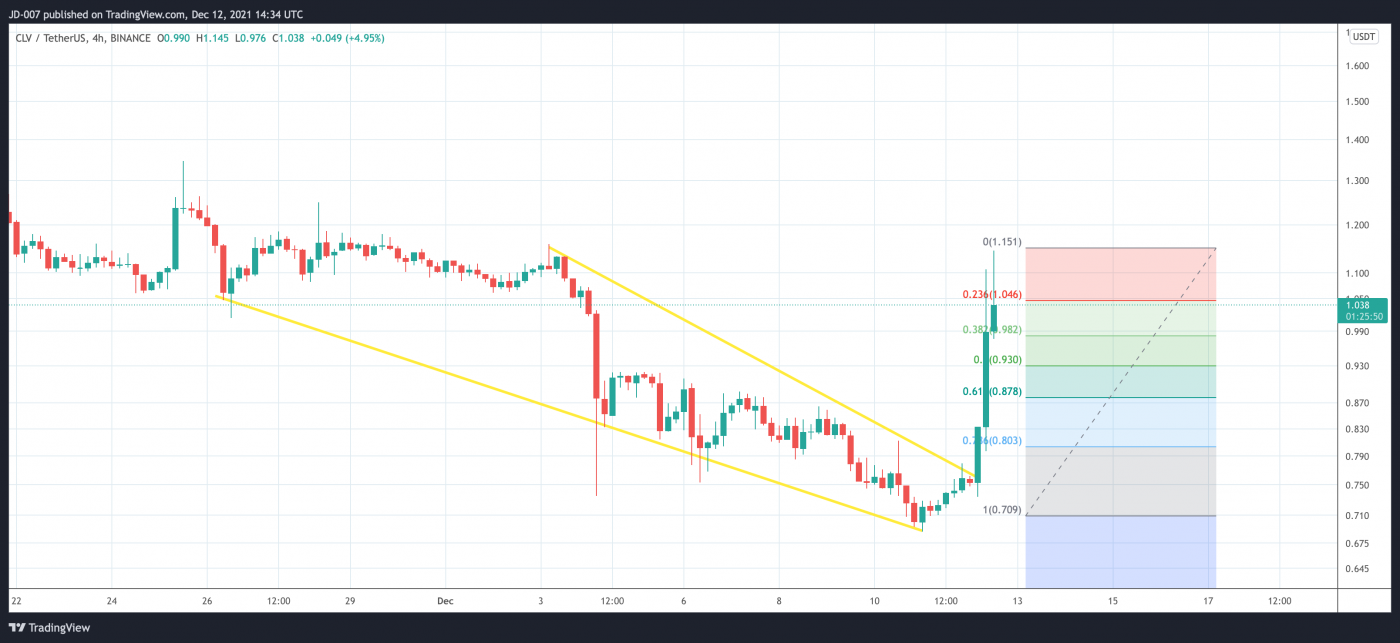
CLV is trading in an uptrend, like many other Altcoins. The cryptocurrency CLV gained over +65% in a single day by breaking a falling wedge pattern with strong buying volume on multiple exchanges and surged over +85% in a week.

What is Clover Finance?

Clover CLV is a Polkadot parachain, committed to providing easy-to-use blockchain infrastructure and creating a one-stop EVM-compatible framework for substrate-based applications. The CLV token is used to pay for Clover transactions and to vote for network upgrades. Clover also aims to enable interoperability between Bitcoin and other blockchains.

CLV Price Analysis

At the time of writing, CLV is ranked the 290th cryptocurrency globally and the current price is US$1.03. Let’s take a look at the chart below for price analysis:

Source: TradingView

After looking at the above 4-Hour candle chart, we can clearly see that CLV was trading inside the falling wedge pattern on the CLV/USDT pair. The first resistance was on the $0.87 price level, which CLV broke with a strong bullish trend buying volume and is now heading towards the recent high price at $1.35. Seeing that many Altcoins are holding a strong position this week after the recent bitcoin price crash, CLV may continue to increase in the uptrend if traders keep buying with high volume.

“The falling wedge pattern is characterised by a chart pattern which forms when the market makes lower lows and lower highs with a contracting range. When this pattern is found in a downward trend, it is considered a reversal pattern, as the contraction of the range indicates the downtrend is losing steam.”

What Do the Technical Indicators Say?

The CLV TradingView indicators (on the 1-day) mainly indicate CLV as a Buy, except the Oscillators which indicate CLV as a Neutral.

So Why Did CLV Break Out?

General market sentiment seems to suggest cryptos are hopefully turning back bull run season after recent price corrections. Another reason for this sudden pump in price could be whales secretly buying CLV for the coming Altcoins rally. Recent news was also announced regarding Clover’s partnership with Realy Metaverse.

Learn How to Trade Live!

Join Dave and The Crypto Den Crew and they’ll show you live on a webinar how to take your crypto trading to the next level.

Duration: 6-week course
From: November 15 to December 22
Date/Time: Twice a week, Mon and Wed at 7pm AEST
Location: Zoom webinar

Where to Buy or Trade CLV?

CLV has the highest liquidity on Binance Exchange, so that would help for trading CLV/BTC or CLV/USDT pairs. And if you’re looking at buying and HODLing cryptos, then Swyftx Exchange is an easy-to-use popular choice in Australia.