Categories
Crypto News Market Analysis NEO Trading

Top 3 Coins To Watch Today: NEO, FIL, AVAX – September 27 Trading Analysis

Let’s take a closer look at today’s altcoins showing breakout signals. We’ll explain what the coin is, then dive into the trading charts and provide some analysis to help you decide.

1. Neo (NEO)

NEO bills itself as a “rapidly growing and developing” ecosystem that has the goal of becoming the foundation for the next generation of the internet – a new economy where digitised payments, identities and assets come together. As well as creating a worldwide community of developers who create new infrastructure for the network and lower barriers to entry, the team behind this project operates an EcoBoost initiative that’s designed to encourage people to build decentralised apps and smart contracts on its blockchain.

NEO Price Analysis

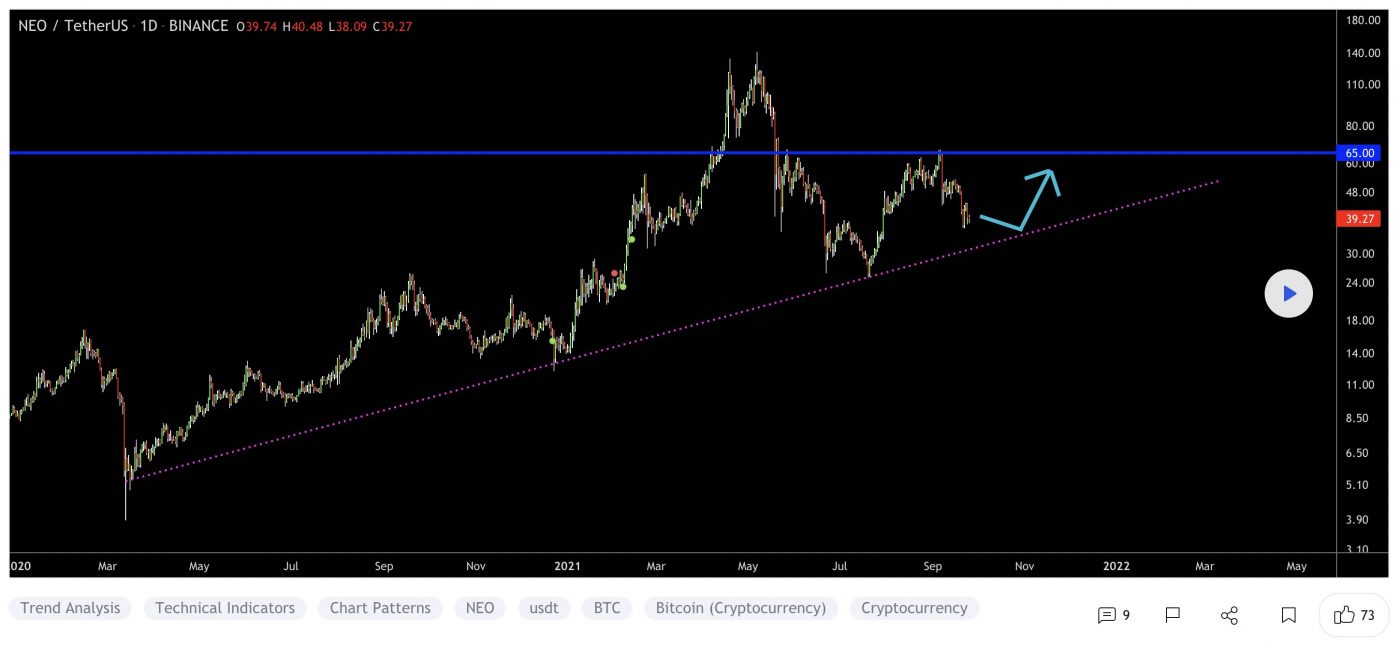
At the time of writing, NEO is ranked the 49th cryptocurrency globally and the current price is A$53.40. Let’s take a look at the chart below for price analysis:
Source: TradingView

After creating a second equal low in mid-July, NEO has rallied nearly 115% into resistance that starts near A$90.25.

Aggressive bulls looking for a continuation to the nearest cluster of relatively equal highs around A$57.33 might look for bids near A$50.86. More significant resistance rests above near A$66.15. A group of significant swing highs at A$70.19, A$74.55 and A$79.46 give possible targets if this resistance breaks.

A stop run on the recent low at A$48.00 into possible support beginning near A$45.13 might see stronger bidding. This area also has a confluence with the August monthly open.

A bearish market shift could reach the swing low at A$40.68 into possible support beginning near A$37.24.

2. Filecoin (FIL)

Filecoin FIL is a decentralised storage system that aims to “store humanity’s most important information”. The project was first described back in 2014 as an incentive layer for the Interplanetary File System (IPFS), a peer-to-peer storage network. Filecoin is an open protocol and backed by a blockchain that records commitments made by the network’s participants, with transactions made using FIL, the blockchain’s native currency. The blockchain is based on both proof-of-replication and proof-of-spacetime.

FIL Price Analysis

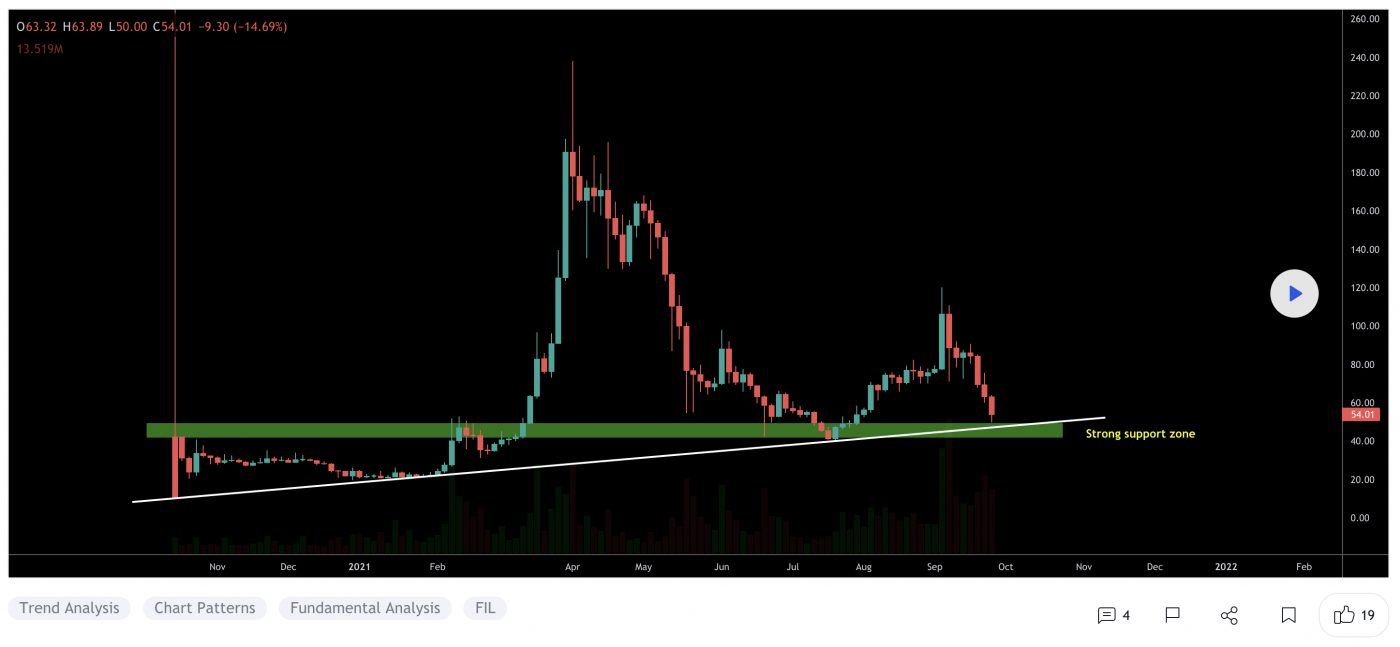
At the time of writing, FIL is ranked the 27th cryptocurrency globally and the current price is A$78.34. Let’s take a look at the chart below for price analysis:
Source: TradingView

After rallying over 150% from its July low, FIL is encountering resistance near A$152.88.

This resistance and the September monthly mid at A$118.35 currently have the price trapped. The swing high and resistance near A$107.22 provide a likely target before any major bearish market shift, with continuation through this resistance possibly reaching for short stops and resistance near A$134.67.

The daily gap at A$72.38 could provide support, while the area beginning near A$69.86 could see more substantial interest from the bulls. A longer-term bearish shift in the marketplace will likely reach the relatively equal lows near A$65.29, possibly finding a floor at support beginning near A$60.93.

3. Avalanche (AVAX)

Avalanche AVAX is the fastest smart contracts platform in the blockchain industry, as measured by time-to-finality, and has the most validators securing its activity of any proof-of-stake protocol. Avalanche is blazingly fast, low-cost, and green. Any smart contract-enabled application can outperform its competition on Avalanche. AVAX is the native token of Avalanche. It is a hard-capped, scarce asset that is used to pay for fees, secure the platform through staking, and provide a basic unit of account between the multiple subnets created on Avalanche.

AVAX Price Analysis

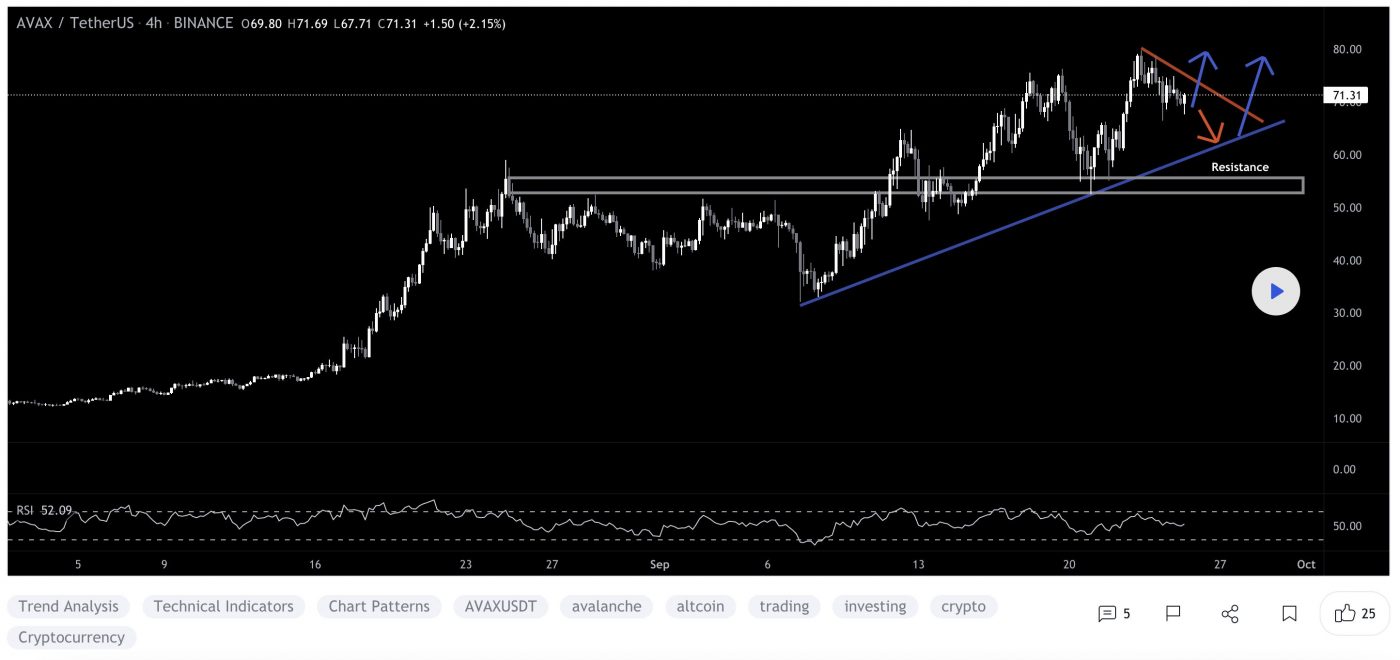
At the time of writing, AVAX is ranked the 11th cryptocurrency globally and the current price is A$96.98. Let’s take a look at the chart below for price analysis:
Source: TradingView

AVAX continued its rally through the daily gap between A$99.45 and A$97.25, turning this region into an area of possible support. 

However, a stop run under the relatively equal lows at A$94.34 could form a wick below this level, potentially reaching an untapped daily gap beginning near A$87.14.

Resistance starting at $104.50 has seen significant profit-taking, shown by the long upper wicks on the daily candles. A break of this resistance may reach the next significant swing high at A$110.89, continue into probable resistance just above, and possibly set new all-time highs at A$122.56.

Where to Buy or Trade Altcoins?

These coins have high liquidity on Binance Exchange, so that could help with trading on AUD/USDT/BTC pairs. And if you’re looking at buying and HODLing cryptos, then Swyftx Exchange is an easy-to-use popular choice in Australia.

Categories
Crypto News Market Analysis Trading

Top 3 Coins To Watch Today: KAVA, 1INCH, LUNA – September 24 Trading Analysis

Let’s take a closer look at today’s altcoins showing breakout signals. We’ll explain what the coin is, then dive into the trading charts and provide some analysis to help you decide.

1. Kava.io (KAVA)

Kava.io KAVA is a cross-chain DeFi lending platform that allows users to borrow USDX stablecoins and deposit a variety of cryptocurrencies to begin earning a yield. The Kava DeFi hub operates as a decentralised bank for digital assets, allowing users to access a range of decentralised financial services, including its native USD-pegged stablecoin USDX, as well as synthetics and derivatives. Through Kava, users are able to borrow USDX tokens by depositing collateral, effectively leveraging their exposure to crypto assets.

KAVA Price Analysis

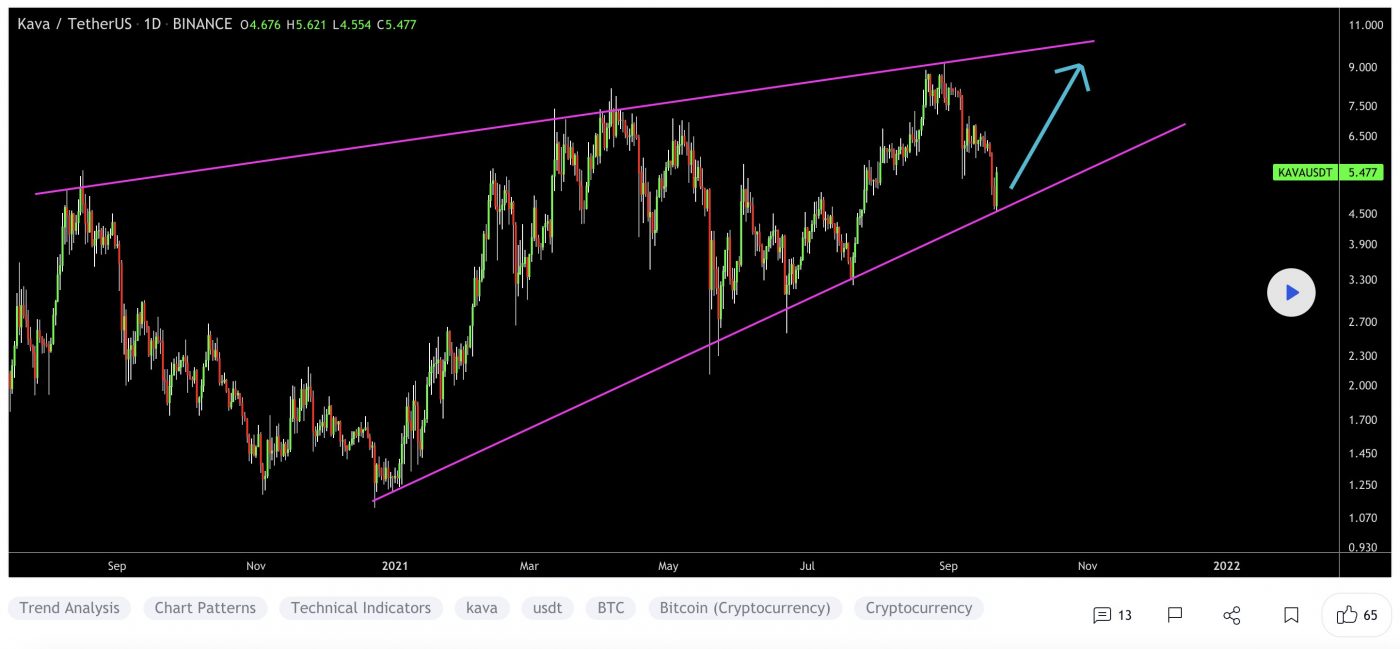
At the time of writing, KAVA is ranked the 124th cryptocurrency globally and the current price is A$7.64. Let’s take a look at the chart below for price analysis:

Source: TradingView

During August, KAVA broke several swing highs that could be the signal for a new bullish trend.

Last week’s break of the most recent swing low could suggest some downside in the short term. It formed probable resistance near A$7.33 and may target the swing low and possible support near A$7.05.

The swing low and possible support near A$6.89 could be the second bearish target if the move down continues. The relatively equal lows near A$6.22 and possible support underneath near A$6.45 could provide more substantial support.

The last swing high near A$7.93 gives a near-term target if bullish continuation continues. However, resistance beginning around A$8.26 could cap this move. A break of this resistance might continue to probable resistance near A$8.65 and reach above the cluster of relatively equal highs near A$9.34.

2. 1inch (1INCH)

1INCH is a decentralised exchange (DEX) aggregator, connecting several DEXes into one platform to allow its users to find the most efficient swapping routes across all platforms. In order for users to find the best price for a swap, they need to look at every exchange – DEX aggregators eliminate the need for manually checking, bringing efficiency to swapping on DEXes. 1inch has launched its 1INCH governance token, and the 1inch Network began to be governed by a decentralised autonomous organisation (DAO).

1INCH Price Analysis

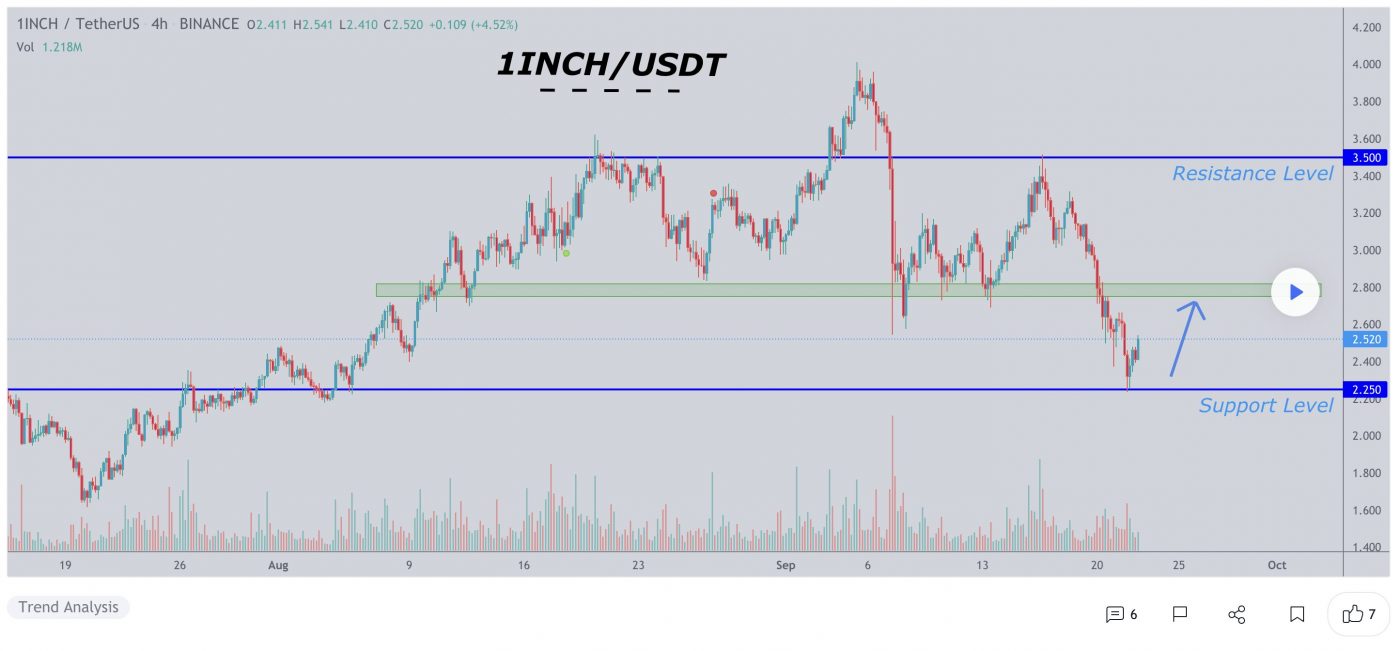
At the time of writing, 1INCH is ranked the 124th cryptocurrency globally and the current price is A$3.72. Let’s take a look at the chart below for price analysis:

Source: TradingView

May marked a turning point for 1INCH, with the price rocketing up almost 175% from its lows to probable resistance beginning near A$5.13.

The price is currently struggling with the area between A$4.25 and A$3.47. This region could provide support after a close above – or resistance after a close below. 

A retracement could reach into the daily gap and possible support around A$3.41. A more bearish shift in the marketplace will likely aim for the relatively equal lows near A$3.25, and the potential support just below that begins around A$3.08.

Continuation to the upside will likely target the monthly high near A$3.90. However, probable resistance beginning at A$4.32 and A$4.77 could cap or slow down this move.

3. Terra (LUNA)

Terra LUNA is a blockchain protocol that uses fiat-pegged stablecoins to power price-stable global payments systems. According to its white paper, Terra combines the price stability and wide adoption of fiat currencies with the censorship-resistance of Bitcoin and offers fast and affordable settlements. Terra’s native token, LUNA, is used to stabilise the price of the protocol’s stablecoins. LUNA holders are also able to submit and vote on governance proposals, giving it the functionality of a governance token.

LUNA Price Analysis

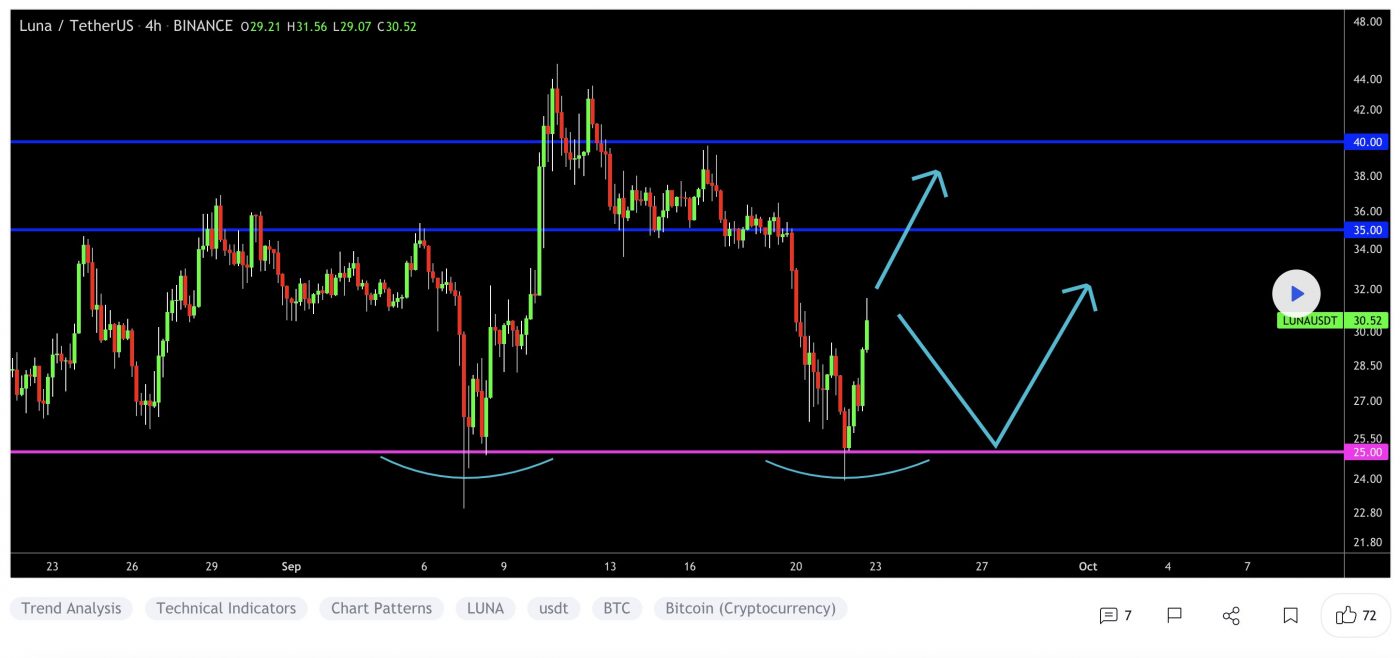
At the time of writing, LUNA is ranked the 12th cryptocurrency globally and the current price is A$48.56. Let’s take a look at the chart below for price analysis:

Source: TradingView

In July, LUNA also turned the corner, breaking a key swing high in mid-August. This move could suggest a longer-term bullish trend.

The swing high near A$53.02 stands out as a bullish target and marks an area of probable resistance. Further continuation could reach into possible resistance starting near A$59.68.

Even if the bullish trend continues, a stop run at the recent swing low near A$46.12 into possible support beginning near A$42.32 is reasonable. If the price reaches further down, the swing low and possible support near A$39.60 might provide another downside target. 

The area near A$38.24 could also provide support. However, a drop this far could suggest a stop run below the higher-timeframe relatively equal lows near A$36.48 into possible support beginning around A$34.57.

Where to Buy or Trade Altcoins?

These coins have high liquidity on Binance Exchange, so that could help with trading on AUD/USDT/BTC pairs. And if you’re looking at buying and HODLing cryptos, then Swyftx Exchange is an easy-to-use popular choice in Australia.

Categories
Crypto News Market Analysis Trading

Top 3 Coins To Watch Today: TLM, EGLD, HBAR – September 23 Trading Analysis

Let’s take a closer look at today’s altcoins showing breakout signals. We’ll explain what the coin is, then dive into the trading charts and provide some analysis to help you decide.

1. Alien Worlds (TLM)

Alien Worlds TLM is a decentralised, non-fungible token (NFT) metaverse where players compete for scarce resources, Trilium (TLM), in a simulated economy based around planetary worlds. Due to this, Alien Worlds also has a decentralised finance (DeFi) element to the game, as players advance by staking TLM and using TLM to vote in Planet Decentralised Autonomous Organisations (DAOs).

TLM Price Analysis

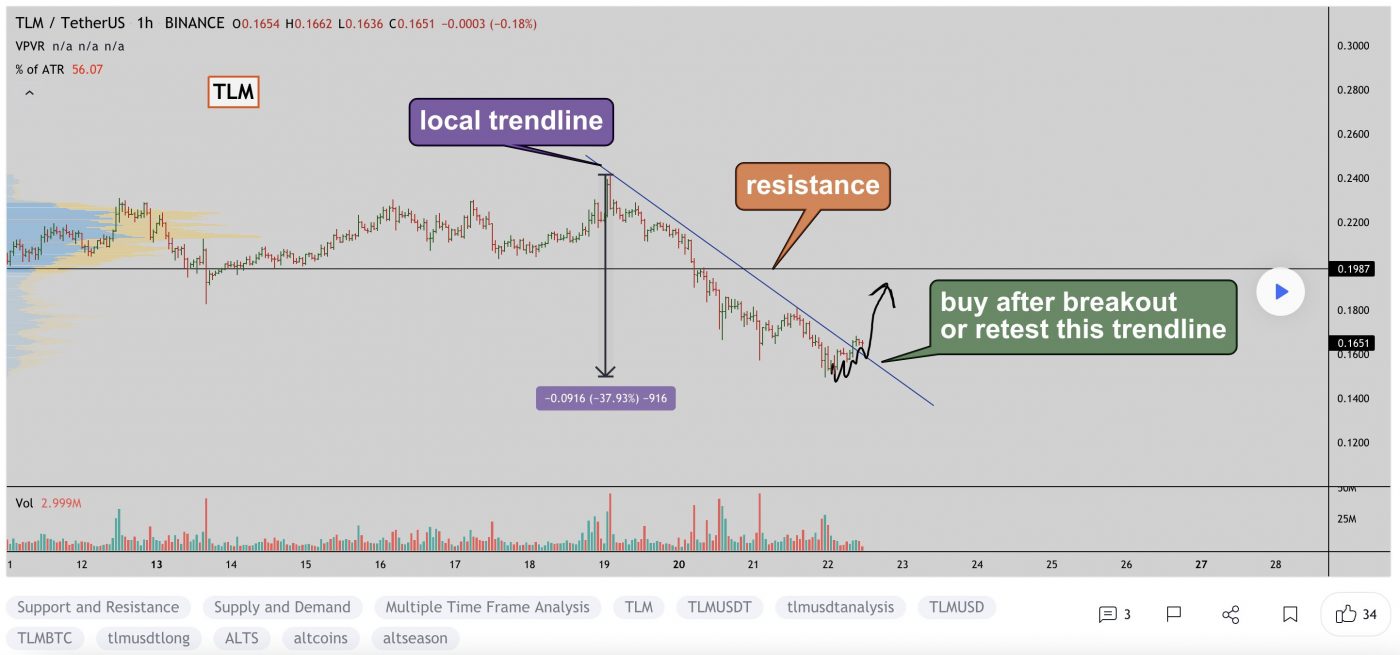
At the time of writing, TLM is ranked the 289th cryptocurrency globally and the current price is A$0.2462. Let’s take a look at the chart below for price analysis:

Source: TradingView

TLM formed relatively equal lows near A$0.1574 after dropping over 71% during July. These lows could provide the target for another leg down, possibly finding support in the monthly gap of around A$0.1285. 

If this sweep of the A$0.2277 swing lows occurs, more aggressive bulls might begin bidding the weekly level near the swing low around A$0.2144. Should the market take a more bullish turn, the level just below near A$0.2033 could provide some short-term support.

The steep drop left large areas of inefficient price action, making the daily gap up to A$0.2736 likely to be touched or filled. A sustained move through this resistance could visit a significant area on the monthly and weekly chart near A$0.2905.

2. Elrond (EGLD)

Elrond EGLD is a blockchain protocol that seeks to offer extremely fast transaction speeds by using sharding. The project describes itself as a technology ecosystem for the new internet, which includes fintech, decentralised finance, and the Internet of Things. Its smart contracts execution platform is reportedly capable of 15,000 transactions per second, six-second latency, and a $0.001 transaction cost. The blockchain has a native token known as eGold, or EGLD, that is used for paying network fees, staking, and rewarding validators.

EGLD Price Analysis

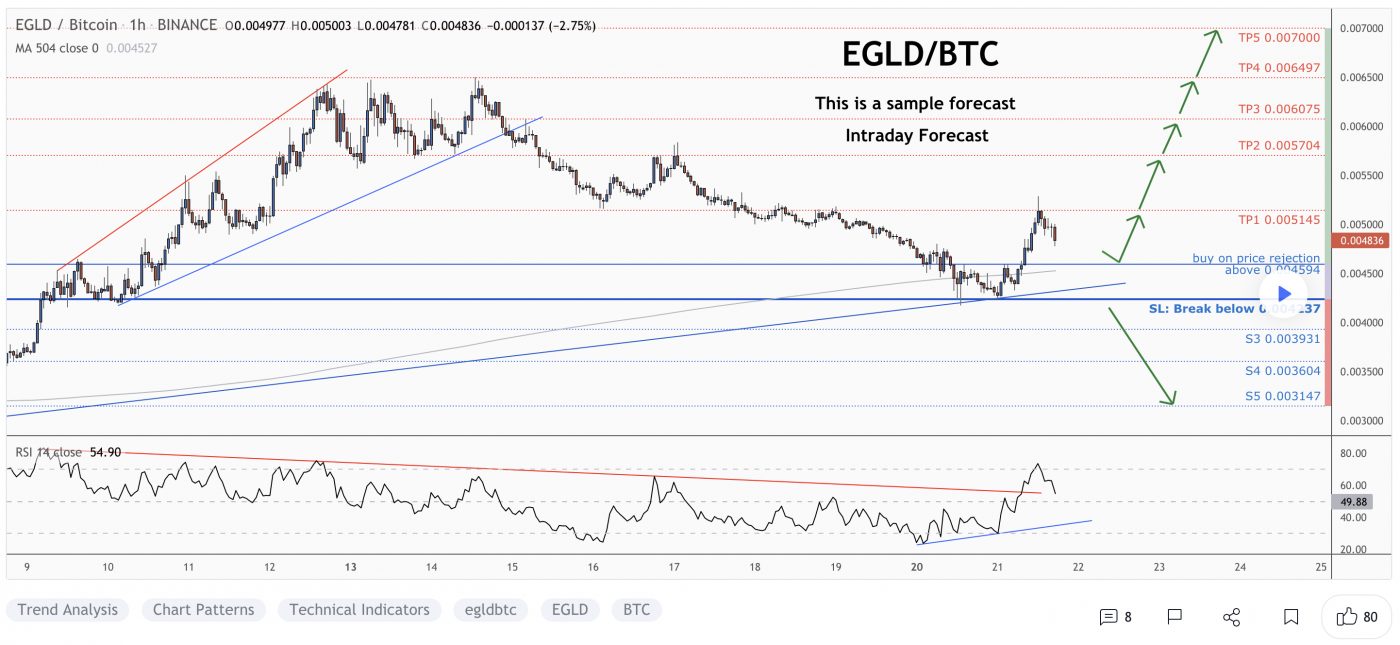
At the time of writing, EGLD is ranked the 34th cryptocurrency globally and the current price is A$300.10. Let’s take a look at the chart below for price analysis:

Source: TradingView

EGLD‘s stunning rally to A$381.45 has plummeted over 35% during September to sweep consolidation lows at A$289.76. This sweep of the lows could set the stage for a new bullish cycle to begin. 

The price is currently balancing around the monthly open. A quick stop run into support beginning near A$285.34 could set the stage for a move into the daily gap beginning near A$273.66 – potentially reaching resistance near A$310.46.

A sweep of the highs near A$317.55, followed by a sharp sell-off, could hint that the Bulls are preparing to run the swing high near A$326.18. This push could find resistance around A$334.89 in the candle wick that created the last week’s high. If the market remains bullish, the price will likely reach resistance near A$345.54.

3. Hedera Hashgraph (HBAR)

Hedera Hashgraph HBAR is a public network that allows individuals and businesses to create powerful decentralised applications (DApps). It is designed to be a fairer, more efficient system that eliminates some of the limitations that older blockchain-based platforms face, such as slow performance and instability. The HBAR token has a dual role within the Hedera public network.

HBAR Price Analysis

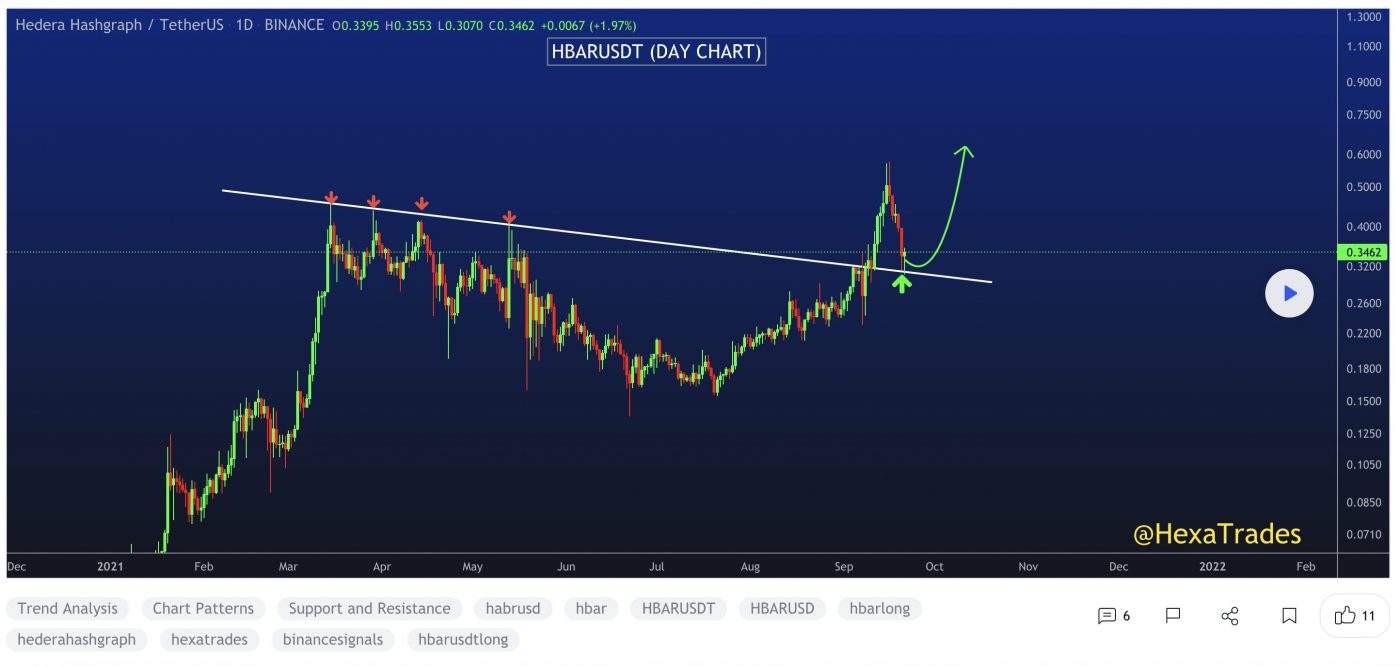
At the time of writing, HBAR is ranked the 41st cryptocurrency globally and the current price is A$0.4857. Let’s take a look at the chart below for price analysis:

Source: TradingView

July started a gradual 67% decline in HBAR‘s price. The move into August’s swing high saw a sharp jump in price, showing that some support exists near A$0.3655.

A sweep of the most recent swing lows into possible support beginning near A$0.4126 could lead to a rally over the monthly open. This rally would likely sweep the swing high into the resistance near A$0.5277. 

This potential bullish move could continue through the relatively equal swing highs near A$0.5621 – but is likely to find some resistance in the weekly level around A$0.5788.

Continued bearishness in the crypto markets might push the price to fill the weekly gap down to A$0.3400. This drop would sweep the stops under August’s low and potentially mark a new accumulation zone for the next bullish cycle.

Where to Buy or Trade Altcoins?

These coins have high liquidity on Binance Exchange, so that could help with trading on AUD/USDT/BTC pairs. And if you’re looking at buying and HODLing cryptos, then Swyftx Exchange is an easy-to-use popular choice in Australia.
Categories
Crypto News Market Analysis Solana Stellar Trading

Top 3 Coins To Watch Today: XLM, SOL, MINA – September 22 Trading Analysis

Let’s take a closer look at today’s altcoins showing breakout signals. We’ll explain what the coin is, then dive into the trading charts and provide some analysis to help you decide.

1. Stellar (XLM)

Stellar XLM is an open network that allows money to be moved and stored. When it was released, one of its goals was boosting financial inclusion by reaching the world’s unbanked but soon afterward, its priorities shifted to helping financial firms connect with one another through blockchain technology. The network’s native token, lumens, serves as a bridge that makes it less expensive to trade assets across borders. All of this aims to challenge existing payment providers, who often charge high fees for a similar service.

XLM Price Analysis

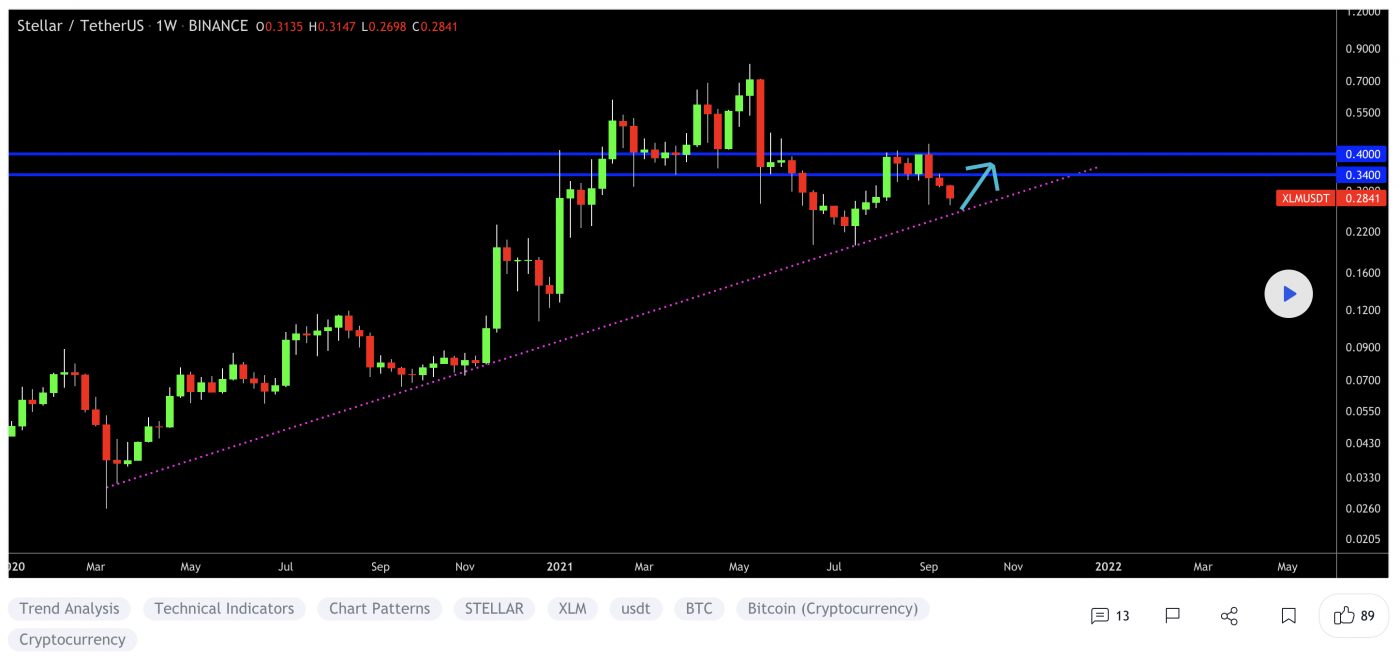
At the time of writing, XLM is ranked the 25th cryptocurrency globally and the current price is A$0.3904. Let’s take a look at the chart below for price analysis:

Source: TradingView

After climbing nearly 280% since the beginning of the year, a 115% range has trapped XLM between A$0.4268 and A$0.3544 during Q3.

A consolidation near A$0.3876, visible on the weekly chart, provided support on the last touch. This level could provide support again on a stop run under the A$0.3688. 

A deeper run-on stop at A$0.3479 might reach the top of a higher-timeframe gap at the same level. However, a push this low reduces the chance of a new monthly high soon. Below, little significant support exists until A$0.3218.

Higher-timeframe levels overlapping with a daily gap beginning at A$0.4169 are likely to provide resistance, perhaps on a sweep of the equal highs near A$0.4485. Breaking this resistance makes the relatively equal highs near A$0.4821 and the recent monthly high at A$0.5318 the next probable targets.

2. Solana (SOL)

Solana SOL is a highly functional open source project that banks on blockchain technology’s permissionless nature to provide decentralised finance (DeFi) solutions. The Solana protocol is designed to facilitate decentralised app (DApp) creation. It aims to improve scalability by introducing a proof-of-history (PoH) consensus combined with the underlying proof-of-stake (PoS) consensus of the blockchain.

SOL Price Analysis

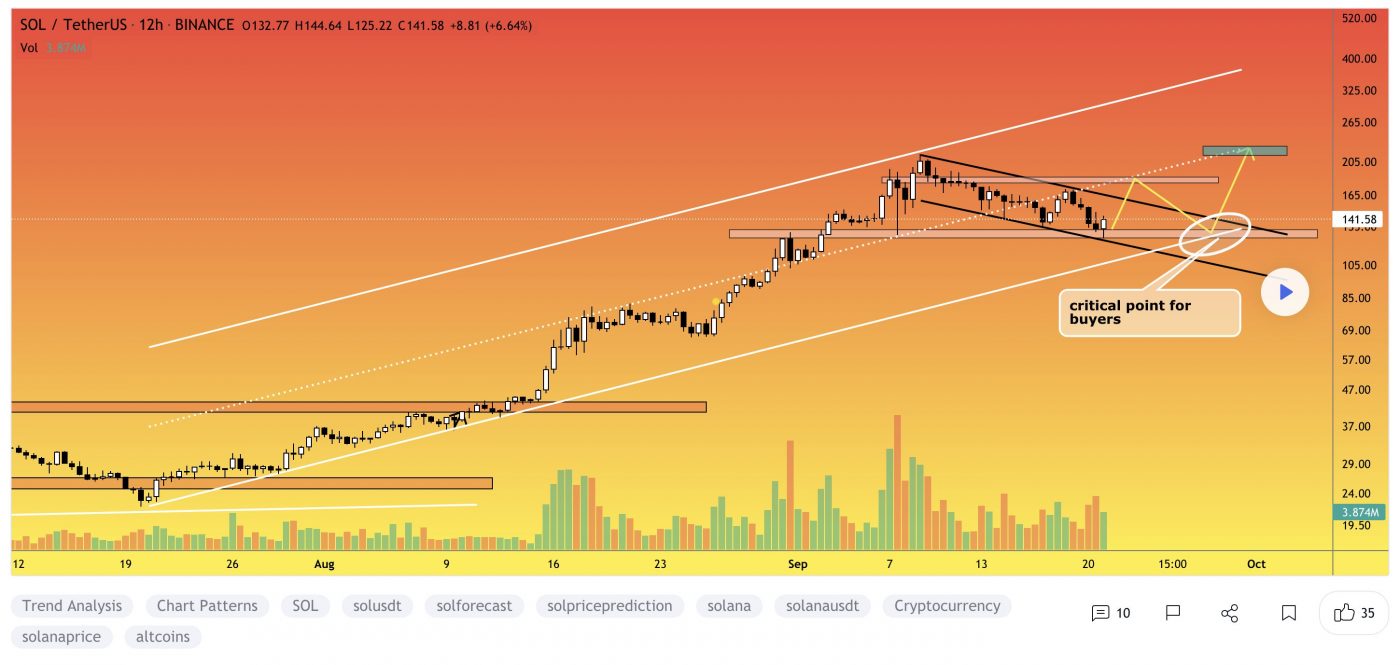
At the time of writing, SOL is ranked the 7th cryptocurrency globally and the current price is A$187.33. Let’s take a look at the chart below for price analysis:

Source: TradingView

SOL‘s euphoric mid-August pump turned into a September dump, with little higher-timeframe support for bulls to justify entries.

Currently, the price is distributing at the 52% retracement level. A small consolidation near A$185.66 is visible on the 12-Hour chart, with a clearer consolidation at a higher timeframe. This area does have some confluence with the 69% retracement level and could offer some support in the future. 

The daily gap’s midpoint near A$198.34 has suppressed the price, although a push through this level could fill the daily gap up to A$215.39. A lack of sensitivity at this resistance could suggest a minor retracement before a possible move to new all-time highs.

3. Mina (MINA)

MINA Protocol is a minimal “succinct blockchain” built to curtail computational requirements in order to run DApps more efficiently. Mina has been described as the world’s lightest blockchain since its size is designed to remain constant despite growth in usage. Furthermore, it remains balanced in terms of security and decentralisation. The Mina network has a size of only 22 KB, which is minuscule when compared to Bitcoin’s 300 GB blockchain.

MINA Price Analysis

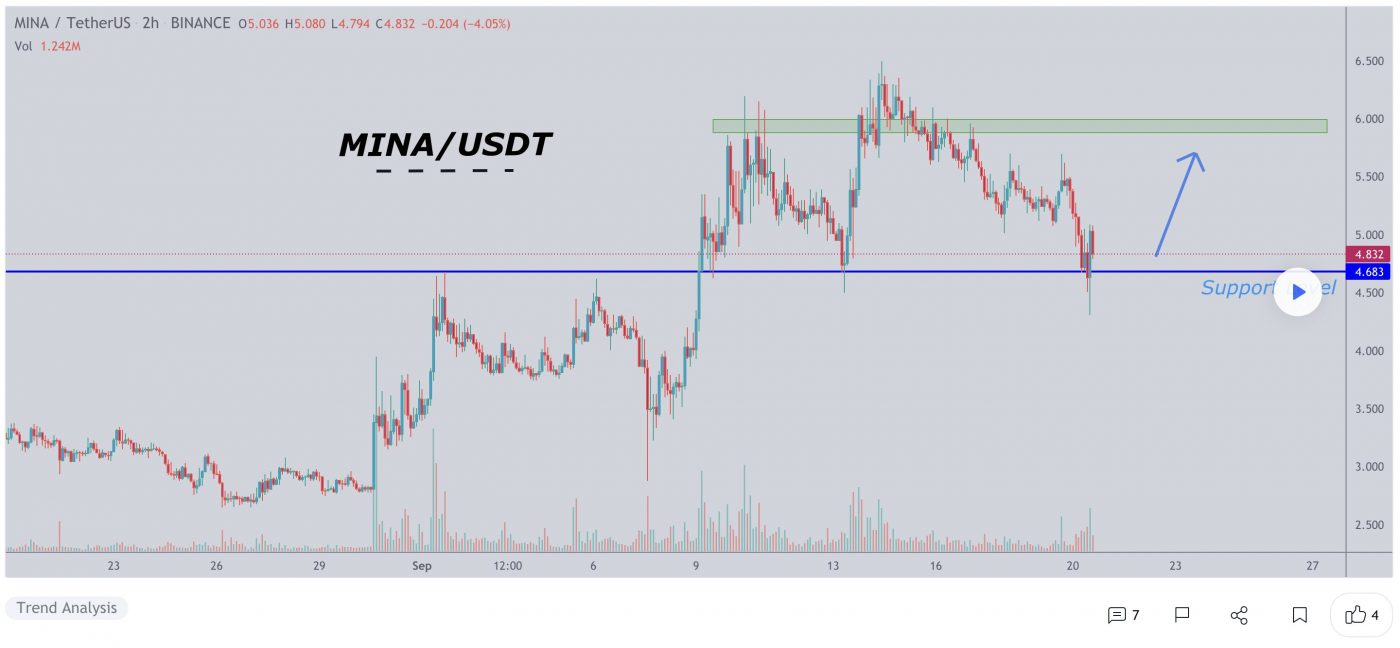
At the time of writing, MINA is ranked the 81st cryptocurrency globally and the current price is A$6.43. Let’s take a look at the chart below for price analysis:

Source: TradingView

MINA‘s 285% pump during Q3 ran into resistance near A$8.26 on September 15. Since then, the price has been consolidating between A$6.38 and A$7.12.

Just below the Monthly open, A$5.89 is the first level likely to provide substantial support. If the price breaks down through this level, overlapping levels near A$5.72 might cap a run on the lows near A$5.46 and A$5.08.

The higher-timeframe analysis points to the area near A$6.89 as the next substantial resistance. Significant selling has been occurring here on the daily chart. If this level breaks, the swing highs near A$7.28 and A$7.54 may be the next targets.

Where to Buy or Trade Altcoins?

These coins have high liquidity on Binance Exchange, so that could help with trading on AUD/USDT/BTC pairs. And if you’re looking at buying and HODLing cryptos, then Swyftx Exchange is an easy-to-use popular choice in Australia.
Categories
Crypto News Market Analysis Trading

Top 3 Coins To Watch Today: CAKE, FET, XAVA – September 21 Trading Analysis

Let’s take a closer look at today’s altcoins showing breakout signals. We’ll explain what the coin is, then dive into the trading charts and provide some analysis to help you decide.

1. PancakeSwap (CAKE)

PancakeSwap CAKE is an automated market maker (AMM), a decentralised finance (DeFi) application that allows users to exchange tokens, providing liquidity via farming and earning fees in return. PancakeSwap uses an automated market maker model where users trade against a liquidity pool. These pools are filled by users who deposit their funds and receive liquidity provider (LP) tokens in return.

CAKE Price Analysis

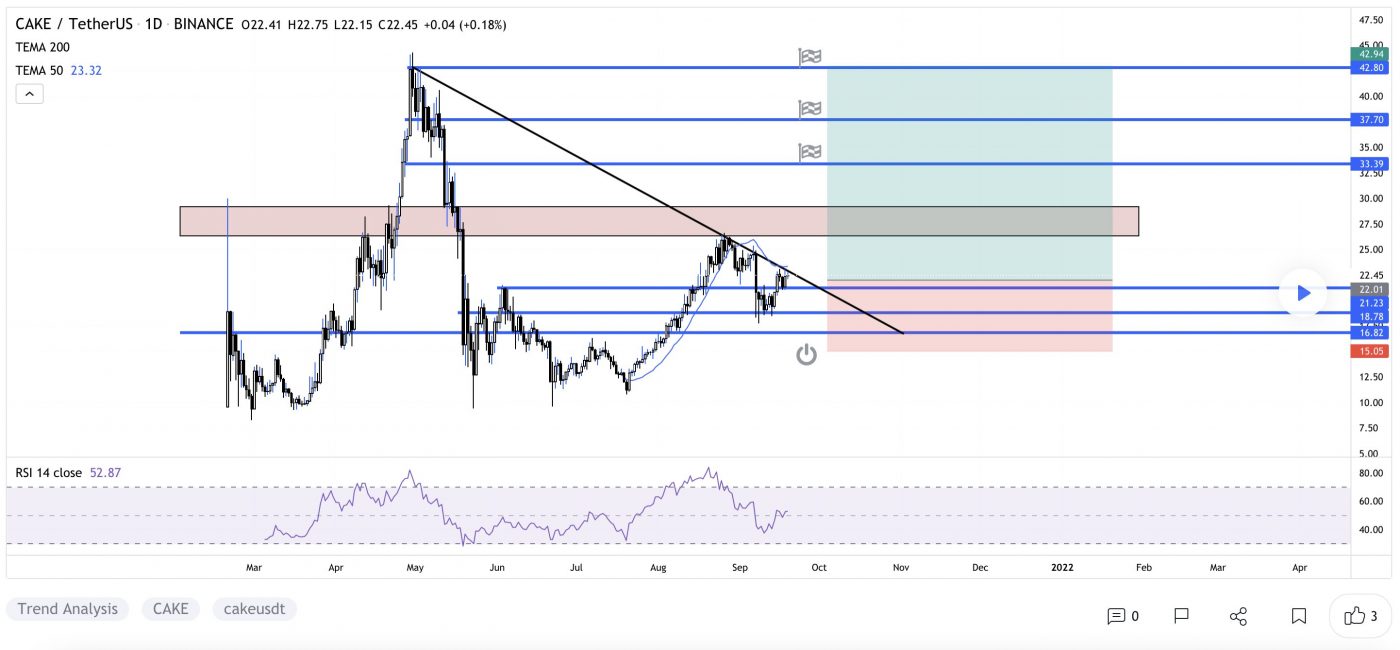
At the time of writing, CAKE is ranked the 30th cryptocurrency globally and the current price is A$27.65. Let’s take a look at the chart below for price analysis:

Source: TradingView

In mid-August, CAKE suggested the possible start of a new longer-term uptrend as the 9, 18, and 40 EMAs spread. At the same time, the price climbed from its May through July consolidation lows. 

Early September’s drop found some support around A$24.54, near the 78.6% retracement level, before creating a swing low and rallying over the 40 EMA. The nearby consolidation around the 61.8% retracement level could provide support if bulls add to their positions while the EMAs compress.

The price is currently testing old support that turned to resistance near A$32.34. If this resistance breaks, the price is likely to continue to, and possibly through, the last significant swing high and resistance beginning near A$36.08. 

A larger zone between A$41.41 and A$47.00, which surrounds the Q3 bear trend’s 61.8% retracement, could mark the end of the bullish move. On the other hand, if bulls show strength in this region – perhaps fuelled by increased interest from Wednesday’s NFT marketplace launch – the old high at A$61.12 gives a logical target for continuation.

However, the weakening of the last bull trend could also lead to a steeper drop in the short term. These deeper retracements often occur around this time of the month and after a major news event such as Wednesday’s launch. If this drop occurs, the price could reach down to broken resistances that may give support near A$24.54 or as low as A$22.22.

2. Fetch.ai (FET)

Fetch.ai FET is a platform that aims to connect Internet of Things (IoT) devices and algorithms to enable collective learning. Fetch.ai is built on a high-throughput sharded ledger and offers smart contract capabilities to deploy machine learning and artificial intelligence solutions for decentralised problem-solving. These open-source tools are designed to help users create ecosystem infrastructure and deploy commercial models.

FET Price Analysis

At the time of writing, FET is ranked the 121st cryptocurrency globally and the current price is A$0.9653. Let’s take a look at the chart below for price analysis:

Source: TradingView

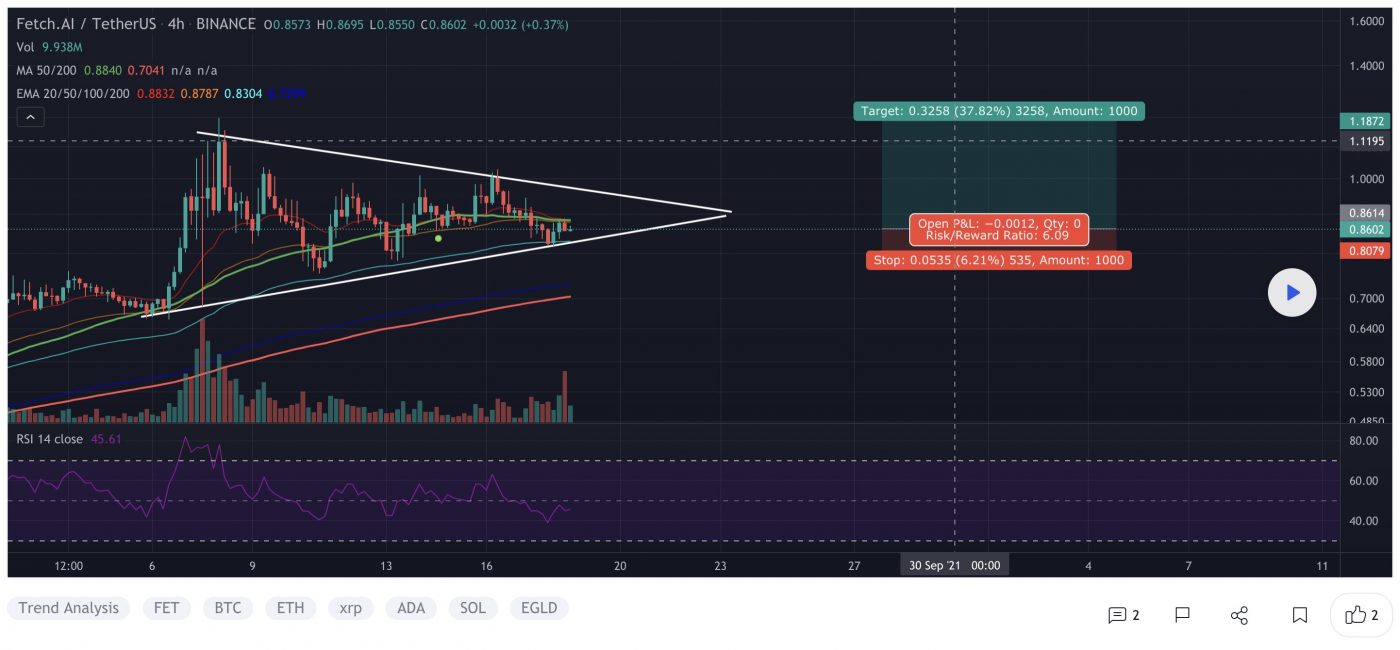
FET recently saw significant profit-taking after breaking its Q1 highs before dropping from its distribution range into the 40 EMA.

Aggressive bulls might add to their positions near possible support around A$0.9768, which has confluence with the 40 EMA, old highs, and is near the 78.6% retracement level. If this level holds, the price might find some resistance near A$1.09 – an area of broken support. 

However, today’s airdrop could be a catalyst for a short-term selloff as holders release their tokens on the market. A decisive break of this potential support zone near A$0.9725 will likely reach or exceed A$0.8145 and A$0.6134. 

These levels are old resistances that could turn to support. If so, they could cause a short-term bounce or start a new bullish trend targeting probable resistances beginning near A$1.92 and A$2.21.

3. Avalaunch (XAVA)

Avalaunch XAVA is a launchpad powered by the Avalanche platform, allowing new and innovative projects to seamlessly prepare for launch with an emphasis on fair and broad distribution. With its values deeply rooted in the early Avalanche community, they are able to offer projects confidently to informed users who are aligned with the long-term goals of the rapidly expanding application ecosystem.

XAVA Price Analysis

At the time of writing, XAVA is ranked the 2761st cryptocurrency globally and the current price is A$5.61. Let’s take a look at the chart below for price analysis:

Source: TradingView

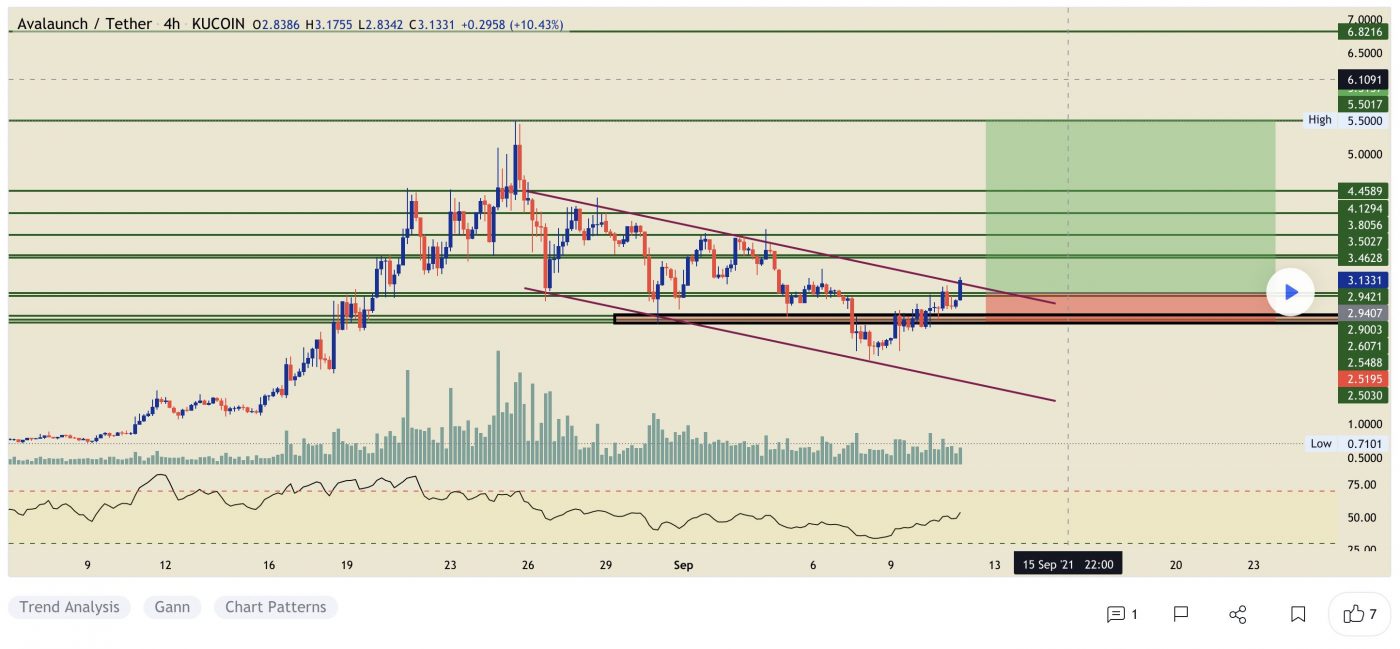
XAVA‘s retracement of the bullish trend turned the corner in early September. Currently, it’s consolidating just under the A$7.59 high.

The last swing high near A$5.80 marks an area of possible support for aggressive bulls and has confluence with the previous leg’s 61.8% retracement level and the 9 EMA. 

The 78.6% retracement level of the last leg up overlaps with another possible support near A$4.88 and could spark more interest from bulls looking for support just below the range EQ. 

A deeper retracement – more probable during the last 10 days of the month – could reach A$4.24, which is approximately where the price re-entered the old range. This level is also just below the 40 EMA, which can sometimes mark accumulation before a significant move higher.

Investor excitement about Wednesday’s IDO could help propel price through the A$7.59 high and lay the foundation for further continuation to near A$9.39. Longer-term, a sustained bullish trend fuelled by more real-world use cases built on XAVA could continue climbing to projected resistances near A$11.66, A$17.32 and A$20.70.

Where to Buy or Trade Altcoins?

These coins have high liquidity on Binance Exchange, so that could help with trading on AUD/USDT/BTC pairs. And if you’re looking at buying and HODLing cryptos, then Swyftx Exchange is an easy-to-use popular choice in Australia. You can buy XAVA coin from multiple exchanges listed on coinmarketcap.
Categories
Crypto News Market Analysis Trading

Top 3 Coins To Watch Today: ATOM, FTM, CKB – September 20 Trading Analysis

Let’s take a closer look at today’s altcoins showing breakout signals. We’ll explain what the coin is, then dive into the trading charts and provide some analysis to help you decide.

1. Cosmos (ATOM)

Cosmos ATOM bills itself as a project that solves some of the “hardest problems” facing the blockchain industry. It aims to offer an antidote to “slow, expensive, unscalable and environmentally harmful” proof-of-work protocols, like those used by Bitcoin, by offering an ecosystem of connected blockchains. ATOM tokens are earned through a hybrid proof-of-stake algorithm, and they help to keep the Cosmos Hub, the project’s flagship blockchain, secure. This cryptocurrency also has a role in the network’s governance.

ATOM Price Analysis

At the time of writing, ATOM is ranked the 20th cryptocurrency globally and the current price is A$60.26. Let’s take a look at the chart below for price analysis:

Source: TradingView

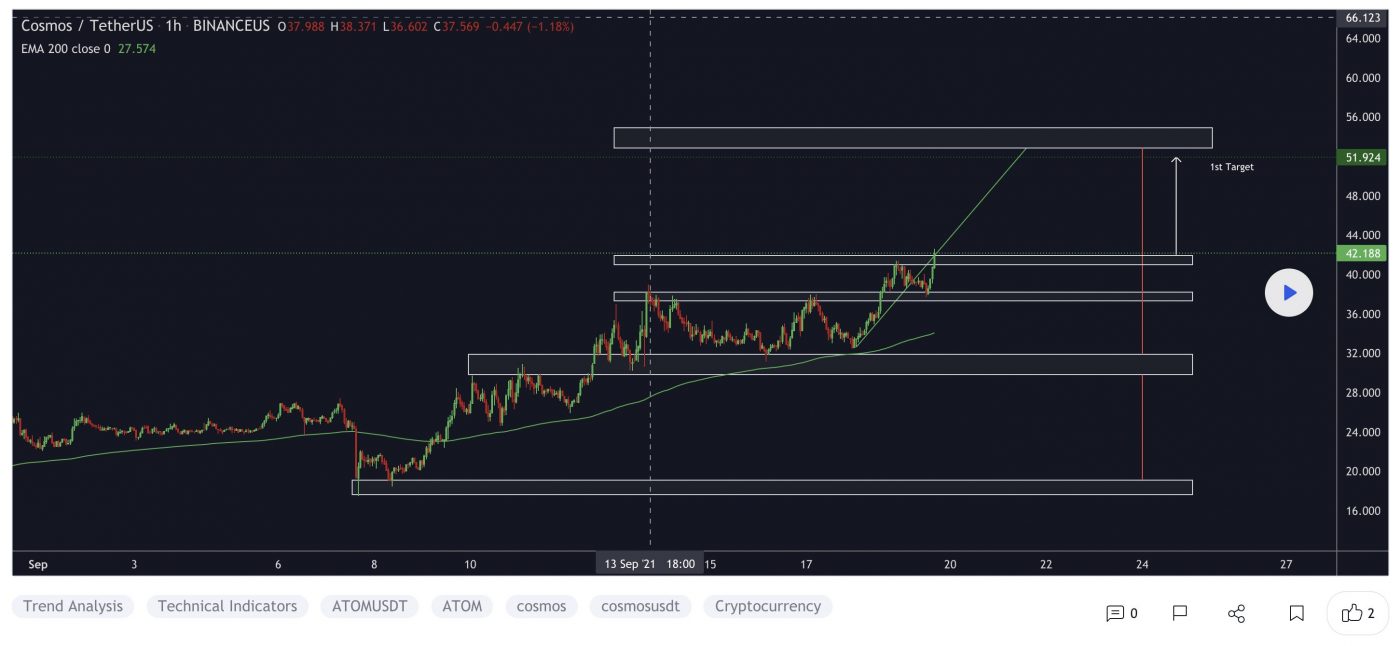
During August, ATOM broke several swing highs that could be the signal for a new bullish trend.

Last week’s break of the most recent swing low could suggest some downside in the short term. It formed probable resistance near A$55.78 and may target the swing low and possible support near A$52.39.

The swing low and possible support near A$50.00 could be the second bearish target if the move down continues. The relatively equal lows near A$48.95 and possible support underneath near A$47.55 could provide more substantial support.

The last swing high near A$65.46 gives a near-term target if bullish continuation continues. However, resistance beginning around A$63.88 could cap this move. A break of this resistance might continue to probable resistance near A$66.71 and reach above the cluster of relatively equal highs near A$68.02.

2. Fantom (FTM)

Fantom FTM is a directed acyclic graph (DAG) smart contract platform providing decentralised finance (DeFi) services to developers using its own bespoke consensus algorithm. Together with its in-house token FTM, Fantom aims to solve problems associated with smart-contract platforms, specifically transaction speed, which developers say they have reduced to under two seconds.

FTM Price Analysis

At the time of writing, FTM is ranked the 43rd cryptocurrency globally and the current price is A$1.98. Let’s take a look at the chart below for price analysis:

Source: TradingView

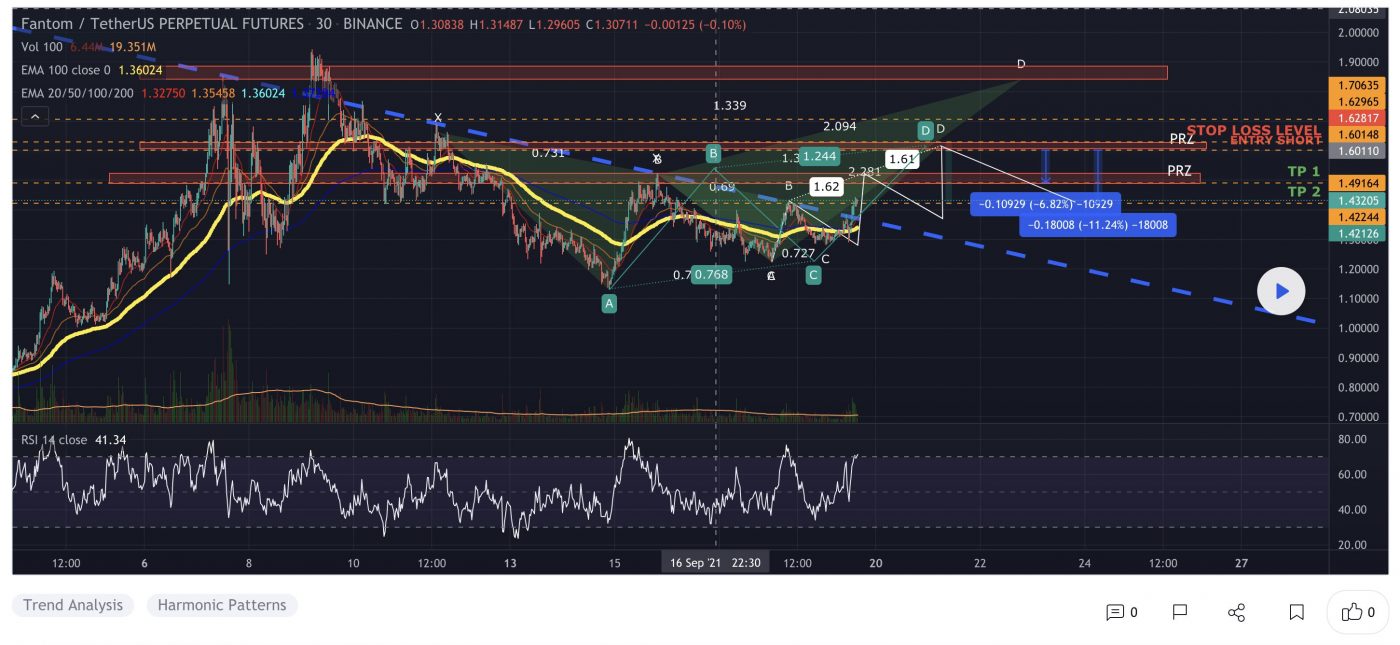
Mid-August marked a turning point for FTM, with the price rocketing up almost 325% from its lows to probable resistance beginning near A$0.5266.

The price is currently struggling with the area between A$1.82 and A$1.97. This region could provide support after a close above – or resistance after a close below. 

A retracement could reach into the daily gap and possible support around A$1.90. A more bearish shift in the marketplace will likely aim for the relatively equal lows near A$1.83, and the potential support just below that begins around A$1.75.

Continuation to the upside will likely target the all-time high near A$2.12. However, probable resistance beginning at A$2.05 and A$2.09 could cap or slow down this move.

3. Nervos Network (CKB)

The Nervos Network CKB describes itself as an open-source public blockchain ecosystem and collection of protocols. The Nervos CKB (Common Knowledge Base) is the layer 1, proof of work public blockchain protocol of the Nervos Network. It reportedly allows any crypto asset to be stored with the security, immutability, and permissionless nature of Bitcoin while enabling smart contracts and layer 2 scaling. It aims to capture the total network value through its “store of value” crypto-economic design and native token, the CKByte.

CKB Price Analysis

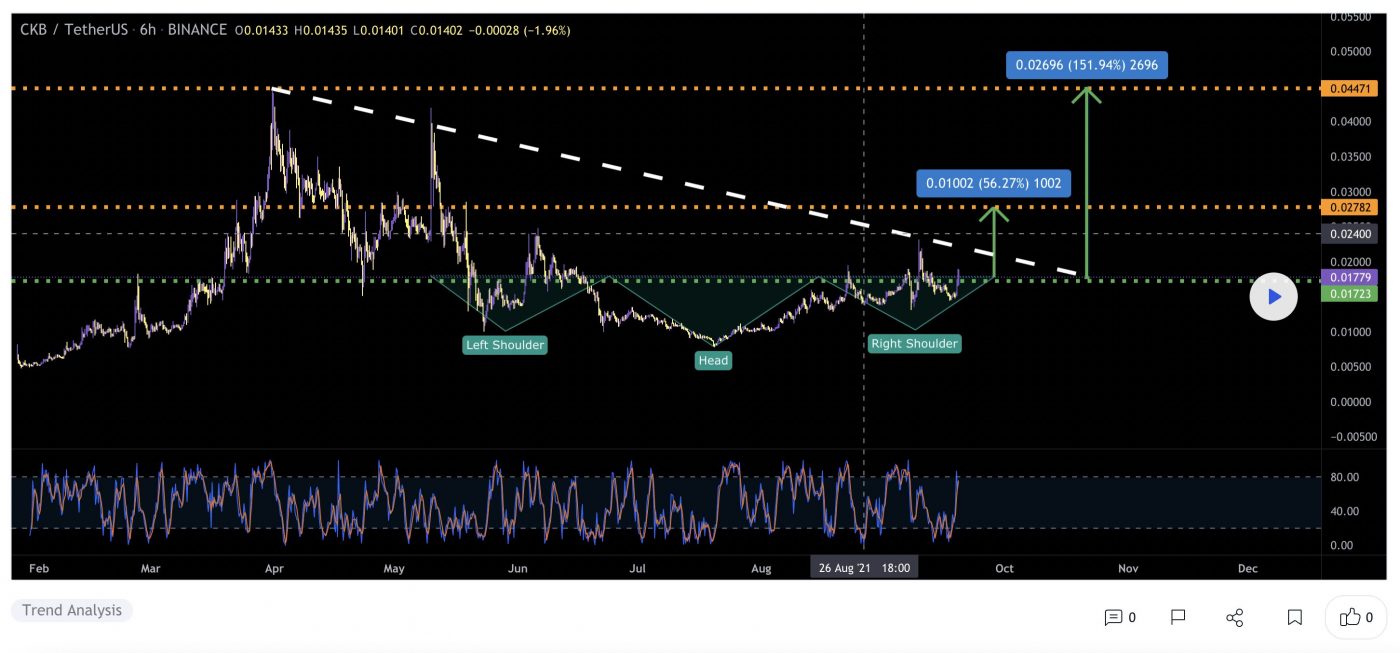
At the time of writing, CKB is ranked the 131st cryptocurrency globally and the current price is A$0.02418. Let’s take a look at the chart below for price analysis:

Source: TradingView

In mid-July, CKB also turned the corner, breaking a key swing high in early August. This move could suggest a longer-term bullish trend.

The swing high near A$0.02534 stands out as a bullish target and marks an area of probable resistance. Further continuation could reach into possible resistance starting near $0.02756.

Even if the bullish trend continues, a stop run at the recent swing low near A$0.02134 into possible support beginning near A$0.01988 is reasonable. If the price reaches further down, the swing low and possible support near A$0.01847 might provide another downside target. 

The area near A$0.01805 could also provide support. However, a drop this far could suggest a stop run below the higher-timeframe relatively equal lows near A$0.01688 into possible support beginning around A$0.01590.

Where to Buy or Trade Altcoins?

These coins have high liquidity on Binance Exchange, so that could help with trading on AUD/USDT/BTC pairs. And if you’re looking at buying and HODLing cryptos, then Swyftx Exchange is an easy-to-use popular choice in Australia.

Categories
Cardano Crypto News Market Analysis Trading

Top 3 Coins To Watch Today: DOT, ADA, MANA – September 17 Trading Analysis

Let’s take a closer look at today’s altcoins showing breakout signals. We’ll explain what the coin is, then dive into the trading charts and provide some analysis to help you decide.

1. Polkadot (DOT)

Polkadot DOT is an open-source sharding multichain protocol that facilitates the cross-chain transfer of any data or asset types, not just tokens, thereby making a wide range of blockchains interoperable with each other. Polkadot’s native DOT token serves three clear purposes: providing network governance and operations, and creating parachains (parallel chains) by bonding. This interoperability seeks to establish a fully decentralised and private web, controlled by its users, and simplify the creation of new applications, institutions and services.

DOT Price Analysis

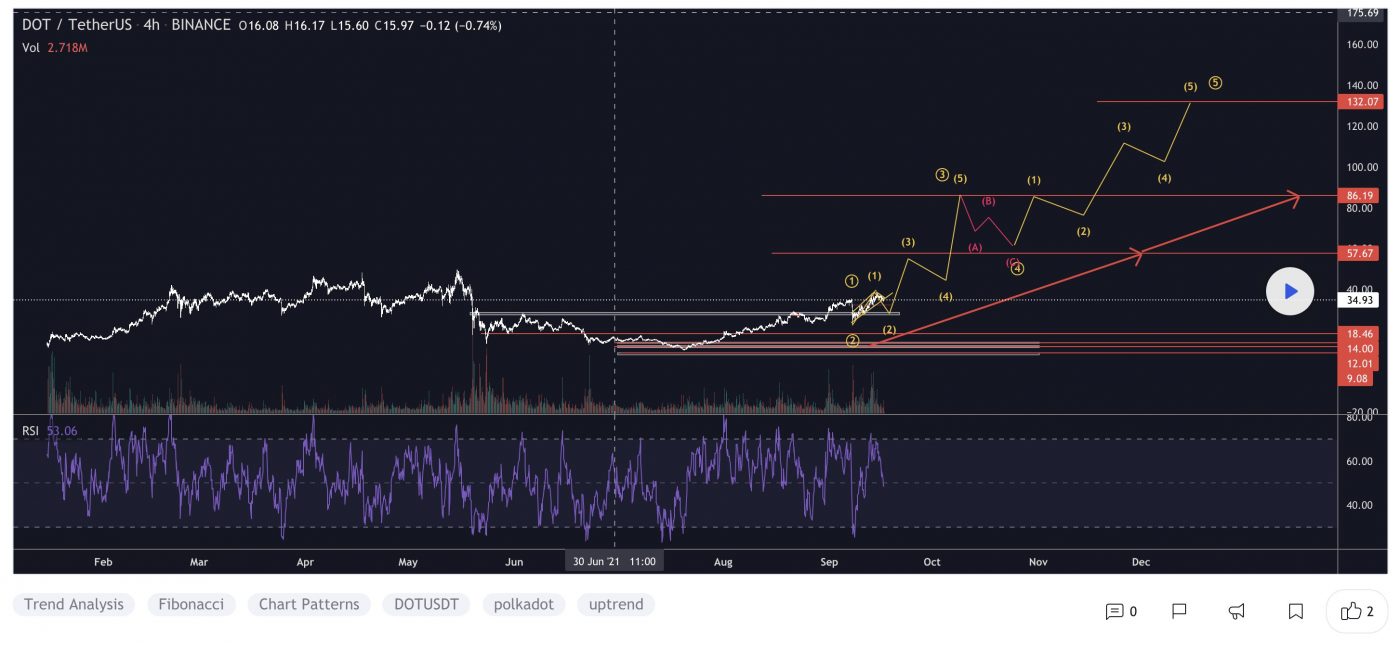
At the time of writing, DOT is ranked the 8th cryptocurrency globally and the current price is A$34.97. Let’s take a look at the chart below for price analysis:

Source: TradingView

DOT‘s nearly 87% retracement from its early May high found a low near A$20.65 in late June before July’s bullish trend began.

The price is currently approaching resistance at a swing high near A$36.89. If this level breaks, bulls might target the swing highs near A$38.52, A$39.80, and potentially up to A$41.68. Resistance near A$43.05 and A$45.21 could cap this move.

If the market remains bullish for the near term, bulls might buy at A$33.06. However, a stop run into A$31.77 could offer a higher probability entry. A steeper drop could reach below the swing low into possible support near A$28.75.

2. Cardano (ADA)

Cardano ADA is a proof-of-stake blockchain platform that says its goal is to allow “changemakers, innovators and visionaries” to bring about positive global change. The open-source project also aims to “redistribute power from unaccountable structures to the margins to individuals”, helping to create a society that is more secure, transparent and fair.

Cardano is used by agricultural companies to track fresh produce from field to fork, while other products built on the platform allow educational credentials to be stored in a tamper-proof way, and retailers to clamp down on counterfeit goods.

ADA Price Analysis

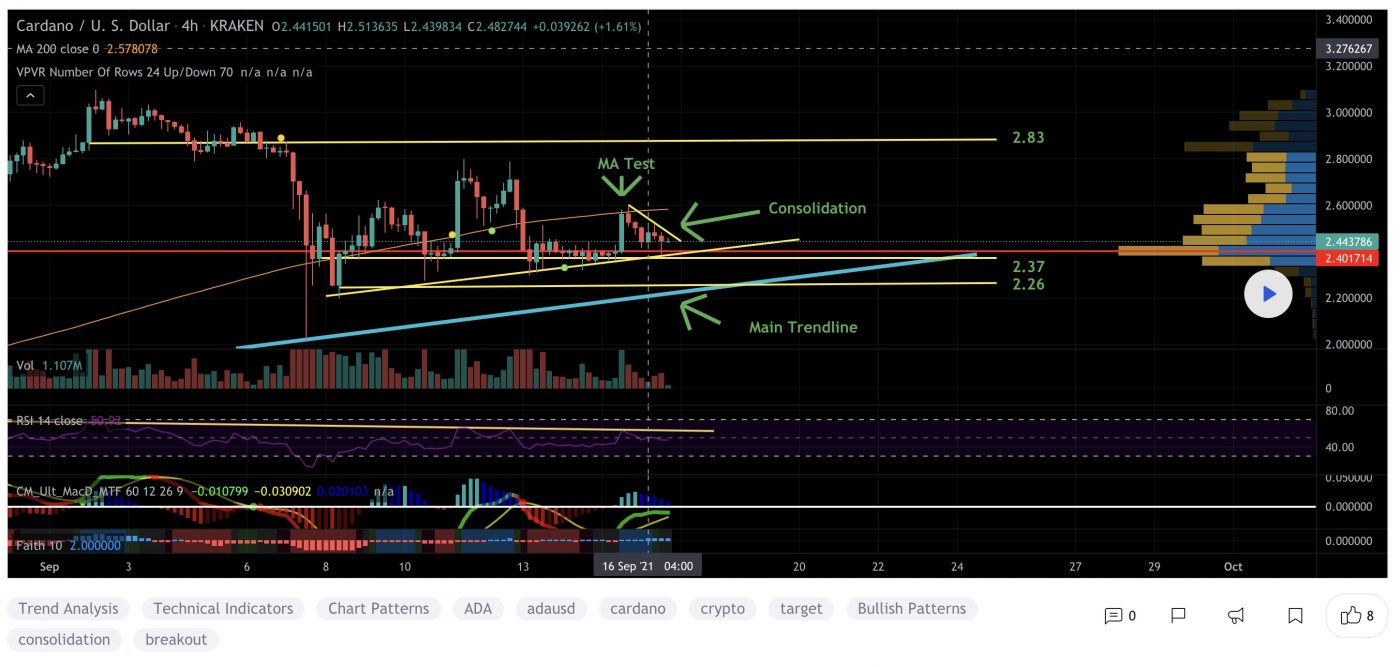
At the time of writing, ADA is ranked the 3rd cryptocurrency globally and the current price is A$3.36. Let’s take a look at the chart below for price analysis:

Source: TradingView

ADA‘s chart paints a different picture than many other altcoins, with August’s high leading to a massive range after setting a low near A$1.90 in July.

The nearly 85% spike within two weeks at the beginning of August makes immediate bids questionable. However, the price may be finding support near A$3.21 and possibly near A$3.14. Since the price swept the impulse’s high at A$3.05, bulls might be waiting to enter near the swing low and gap near A$2.93, or slightly lower near A$2.87.

Little resistance lies overhead, although some might exist between A$3.42 and approximately A$3.48, just above the current price. A sweep and rejection of the high near A$3.57 would make most areas of possible support highly suspect and could mark the end of the bullish trend.

3. Decentraland (MANA)

Decentraland MANA defines itself as a virtual reality platform powered by the Ethereum blockchain that allows users to create, experience, and monetise content and applications. In this virtual world, users purchase plots of land that they can later navigate, build upon and monetise.

Decentraland uses two tokens: MANA and LAND. MANA is an ERC-20 token that must be burned to acquire non-fungible ERC-721 LAND tokens. MANA tokens can also be used to pay for a range of avatars, wearables, names and more on the Decentraland marketplace.

MANA Price Analysis

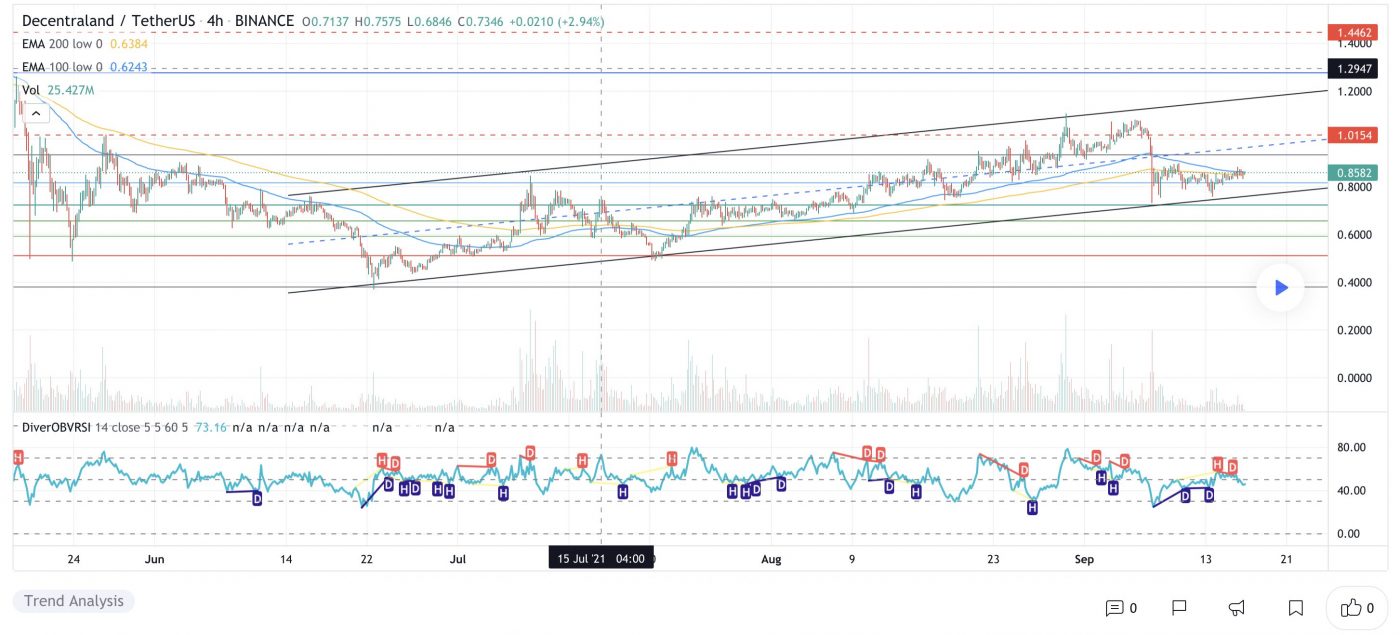
At the time of writing, MANA is ranked the 77th cryptocurrency globally and the current price is A$1.16. Let’s take a look at the chart below for price analysis:

Source: TradingView

Like many other altcoins, MANA set a high in early May before retracing 83% to the low at A$0.8539 in July.

Price broke through resistance near A$1.24, which may mark an area of possible support on a retracement. If this support fails, bulls might also step in near A$1.12. However, a drop this far increases the chances of a stop run to A$1.03 and possibly into support near A$0.9562. For now, continuing bullish market conditions could help A$1.00 become support.

The swing high around A$1.25 gives bulls a reasonable first target, with A$1.31 also likely to draw the price upward. Higher-timeframe resistance beginning near A$1.33 or A$1.35 could cap the move or trigger consolidations. If bullish market conditions continue, bulls might test probable resistance near A$1.40.

Where to Buy or Trade Altcoins?

These coins have high liquidity on Binance Exchange, so that could help with trading on AUD/USDT/BTC pairs. And if you’re looking at buying and HODLing cryptos, then Swyftx Exchange is an easy-to-use popular choice in Australia.
Categories
Crypto News EOS Market Analysis Trading Zilliqa

Top 3 Coins To Watch Today: ZIL, CELR, EOS – September 16 Trading Analysis

Let’s take a closer look at today’s altcoins showing breakout signals. We’ll explain what the coin is, then dive into the trading charts and provide some analysis to help you decide.

1. Zilliqa (ZIL)

Zilliqa ZIL is a public, permissionless blockchain designed to offer high throughput with the ability to complete thousands of transactions per second. It seeks to solve the issue of blockchain scalability and speed by employing sharding as a second-layer scaling solution. The platform is home to many decentralised applications, and as of October 2020 it also allows for staking and yield farming. The native utility token of Zilliqa, ZIL, is used to process transactions on the network and execute smart contracts.

ZIL Price Analysis

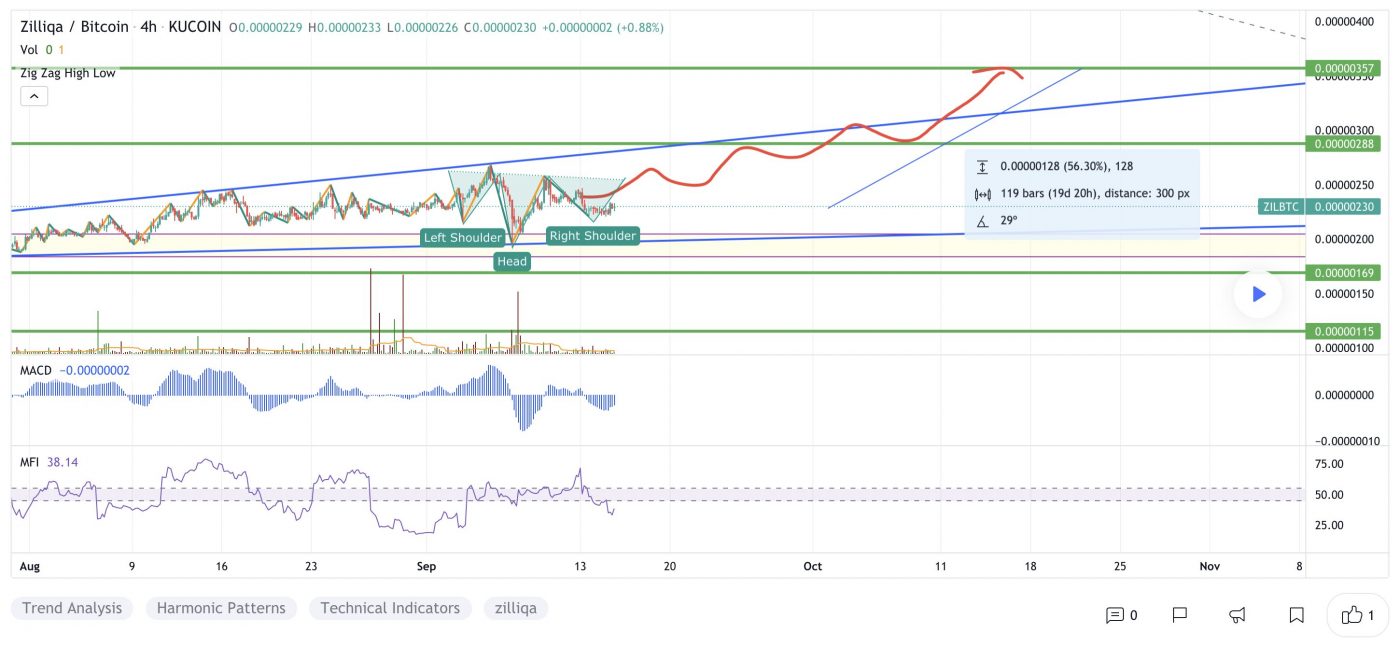
At the time of writing, ZIL is ranked the 85th cryptocurrency globally and the current price is A$0.1492. Let’s take a look at the chart below for price analysis:

Source: TradingView

ZIL‘s nearly 83% drop from its May highs found a low near A$0.09538 in July before closing over a short-term high around A$0.1237.

This daily close over the high could signal a shift in market structure that might reach probable resistance near A$0.1533. A sustained bullish move may target the swing high at A$0.1647. If this stop run occurs, a run beyond the high into probable resistance near A$0.1788 and A$0.1950 is possible.

Bulls could buy a retracement to possible support near A$0.1389, just above the August monthly open. A bearish turn in the marketplace may propel the price toward possible support near A$0.1236. 

However, relatively equal lows near A$0.1194 and A$0.1124 provide an attractive target for bears if the market resumes its bearish trend. A run on these lows might find support between A$0.1015 and A$0.1066.

2. Celer Network (CELR)

The Celer Network CELR is a smartly designed layer-2 scaling solution that provides off-chain transaction handling. The Celer platform offers fast, simple and secure off-chain transactions for both payments and smart contracts. The project was among the first to be developed using the Substrate framework and is part of the Polkadot ecosystem. As to the overall goal of the network, its founders envisioned unleashing the full potential of blockchain and revolutionising Dapps with more efficient and productive outputs.

CELR Price Analysis

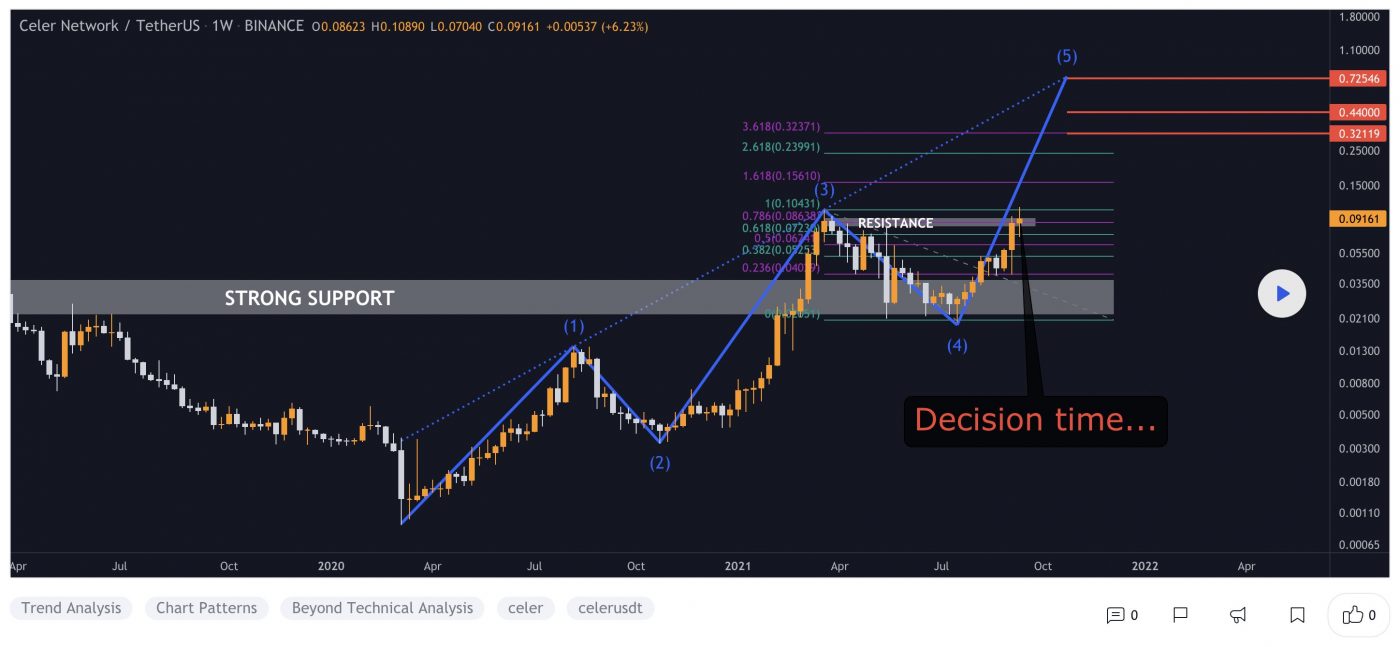
At the time of writing, CELR is ranked the 125th cryptocurrency globally and the current price is A$0.1249. Let’s take a look at the chart below for price analysis:

Source: TradingView

CELR‘s massive May spike retraced near A$0.03841 into the consolidation that began the impulse before bouncing to A$0.04266. 

This consolidation could provide support again, although bears would first have to push the price through possible support near A$0.1045. The market’s structure may be shifting bearish, with A$0.09365 likely to provide some resistance if this is the case. A sustained bearish move could reach the swing low near A$0.08973 before finding support near A$0.08456.

However, the bullish higher-timeframe trend may prevail, with relatively equal highs near A$0.1290 potentially providing an attractive target to lure the price over the September monthly high. If so, the price could reach for the midpoint of the massive wick near A$0.1377.

3. Eos (EOS)

EOS is a platform designed to allow developers to build decentralised apps. The project’s goal is relatively simple: to make it as straightforward as possible for programmers to embrace blockchain technology and ensure the network is easier to use than rivals. As a result, tools and a range of educational resources are provided to support developers who want to build functional apps quickly. EOS also aims to improve the experience for users and businesses. While the project tries to deliver greater security and less friction for consumers, it also vies to unlock flexibility and compliance for enterprises.

EOS Price Analysis

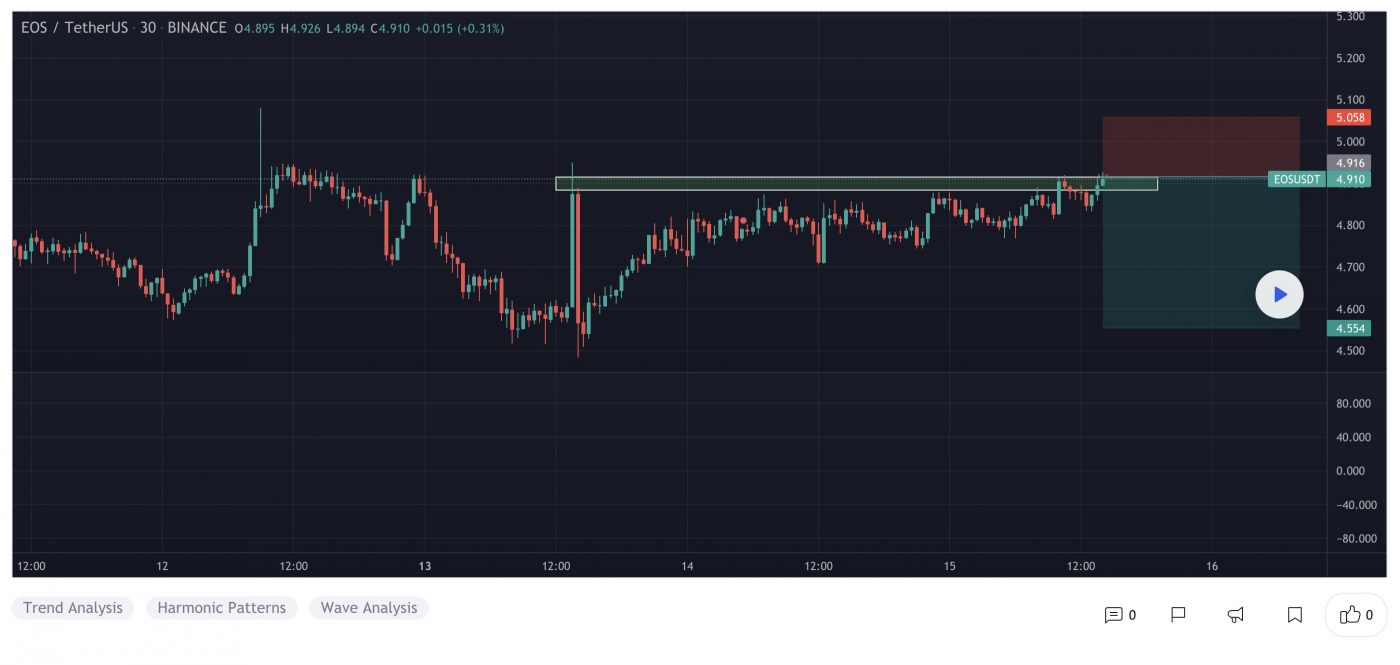
At the time of writing, EOS is ranked the 38th cryptocurrency globally and the current price is A$6.70. Let’s take a look at the chart below for price analysis:

Source: TradingView

EOS set a high near A$18.34 in May before retracing nearly 93% to find a low near A$6.10. The price consolidated around this level before the strong bullish impulse during the past several weeks.

Probable resistance near A$6.90 is slowing the bullish advance down. However, another leg might target the last swing high at A$7.24 and relatively equal highs at A$7.86. Resistance near A$8.15 could cap the move before the second swing high. Beyond these levels, little stands in the bulls’ way before reaching the swing high near A$8.94.

A retracement before a move higher might find support in the daily gap near A$6.05, just above the August monthly open. Relatively equal lows near A$5.83 could also provide support. Run-on stops at A$5.32 and A$5.08 might find support in the gap beginning near A$4.91 or a high-timeframe level near A$4.56.

Where to Buy or Trade Altcoins?

These coins have high liquidity on Binance Exchange, so that could help with trading on AUD/USDT/BTC pairs. And if you’re looking at buying and HODLing cryptos, then Swyftx Exchange is an easy-to-use popular choice in Australia.
Categories
Crypto News Market Analysis Trading

ACM Surges +85% in a Single Day after Partnership between FTX and Chiliz to promote and launch Fan Tokens

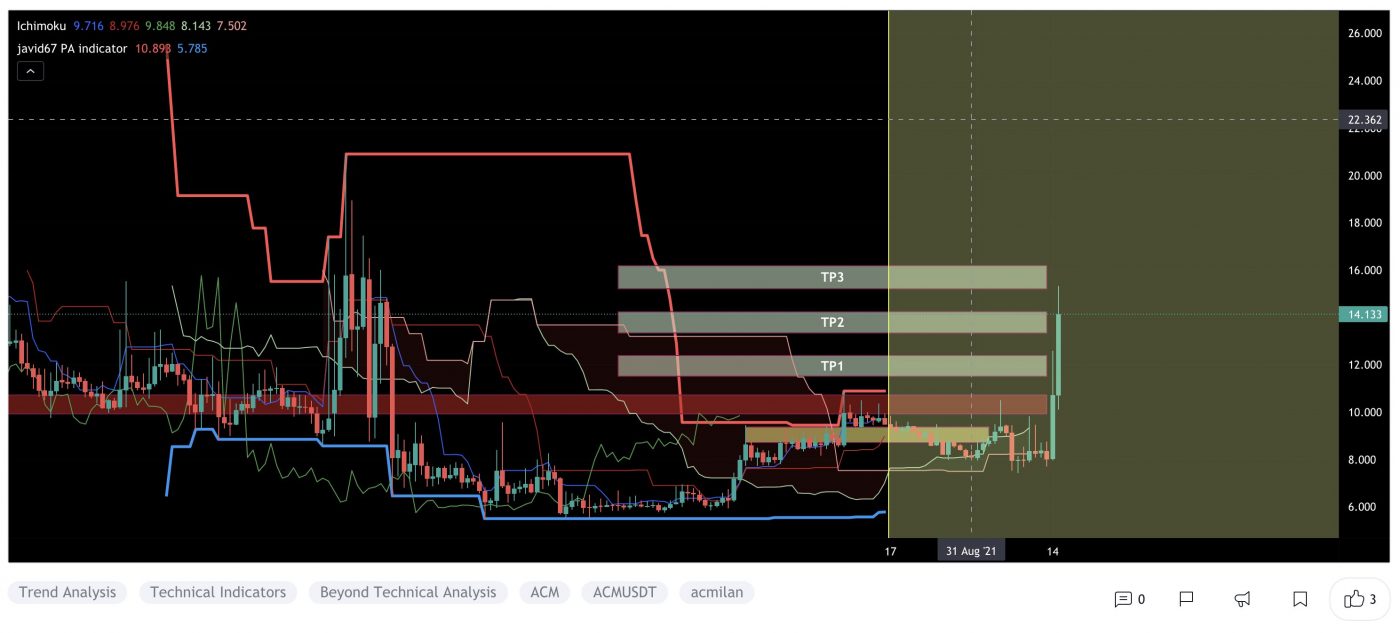
ACM Fan Token is trading in an uptrend, like many other Altcoins. The cryptocurrency ACM just went up +85% in a single day by breaking a rising wedge pattern with strong buying volume on multiple exchanges and surges over +130% in a week.

What is ACM Fan Token?

The AC Milan Fan Token ACM is a utility token that gives AC Milan fans a tokenized share of influence on club decisions using the Socios application and services. The token serves as a membership key that allows users to compete for exclusive rewards, club recognition, and more.ACM token holders can vote via smart contract on “fan decision” polls published by AC Milan. Token holders can interact with the Socios platform (voting on polls, competing in contests and quizzes, connecting/chatting with like-minded users, etc.) and earn rewards.

ACM Price Analysis

At the time of writing, ACM is ranked the 570th cryptocurrency globally and the current price is A$19.44. Let’s take a look at the chart below for price analysis:

Source: TradingView

After looking at the above 1-Day candle chart, we can clearly see that ACM was trading inside the rising wedge pattern on the ACM/USDT pair. The first resistance was on the A$13.82 price level, which ACM broke with a strong bullish trend buying volume and is now heading towards the recent high price at A$20.17. Seeing that many Altcoins are holding a strong position this week after the recent bitcoin price crash, ACM may continue to increase in the uptrend if traders keep buying with high volume.

“The Rising Wedge is a bearish pattern that begins wide at the bottom and contracts as prices move higher and the trading range narrows. As a reversal pattern, the rising wedge will slope up and with the prevailing trend.”

What Do the Technical Indicators Say?

The ACM TradingView indicators (on the 1 day) mainly indicate ACM as a Strong Buy, except the Oscillators which indicate ACM as a Buy.

So Why Did ACM Breakout?

General market sentiment seems to suggest cryptos are hopefully turning back bull run season after recent price corrections. Another reason for this sudden pump in price could be whales secretly buying ACM for the coming Altcoins rally. Recent news was also announced regarding the Partnership between FTX and Chiliz.

Where to Buy or Trade ACM?

ACM has the highest liquidity on Binance Exchange so that would help for trading ACM/BTC or ACM/USDT pairs. And if you’re looking at buying and HODLing cryptos, then Swyftx Exchange is an easy-to-use popular choice in Australia.
Categories
Crypto News IOTA Market Analysis Trading

Top 3 Coins To Watch Today: IOTA, ONE, WAN – September 15 Trading Analysis

Let’s take a closer look at today’s altcoins showing breakout signals. We’ll explain what the coin is, then dive into the trading charts and provide some analysis to help you decide.

1. IOTA (MIOTA)

IOTA is a distributed ledger with one big difference: it isn’t actually a blockchain. Instead, its proprietary technology is known as Tangle, a system of nodes that confirm transactions. The foundation behind the platform says this offers far greater speeds than conventional blockchains – and an ideal footprint for the ever-expanding Internet of Things ecosystem.

IOTA Price Analysis

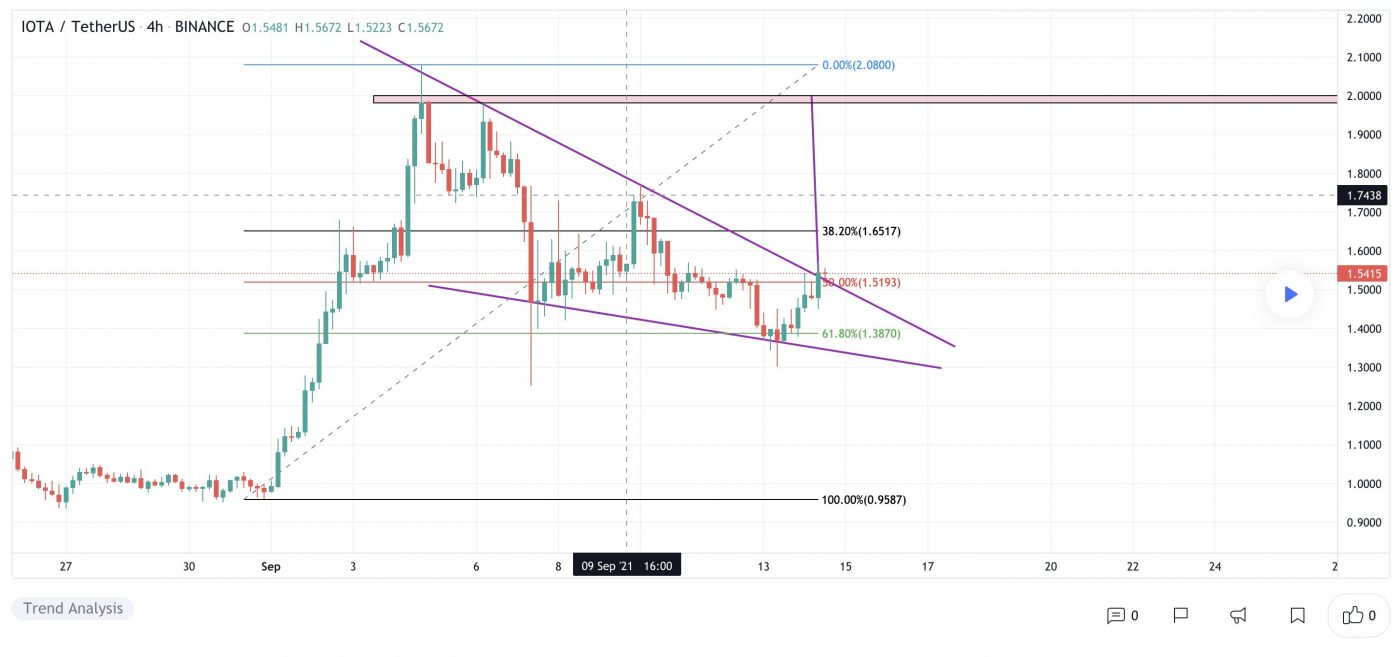
At the time of writing, IOTA is ranked the 40th cryptocurrency globally and the current price is A$1.53. Let’s take a look at the chart below for price analysis:

Source: TradingView

After a 61% decline from May to June, IOTA has ranged between A$1.24 and A$1.03.

The recent rally is approaching probable resistance near A$1.72 – but could be aiming for stops above the relatively equal highs near A$1.79. Continuation of the bullish move could target the daily gap near A$1.87.

Aggressive bulls might add to positions near A$1.47 and A$1.44. Price action near A$1.40 may be more likely to provide support – if the price reaches it – during any retracements.

Relatively equal lows clustered around A$1.38 seem likely to be swept if the bearish trend resumes. If this move occurs, the price might find support at the significant higher-timeframe level near A$1.32.

2. Harmony (ONE)

Harmony ONE is a blockchain platform designed to facilitate the creation and use of decentralised applications (DApps). The network aims to innovate the way decentralised applications work by focusing on random state sharding, which allows creating blocks in seconds. Focusing on processing speed and validation, the Harmony mainnet aims to revolutionise block creation. By introducing the sharding process, the company reduced node validation times significantly.

ONE Price Analysis

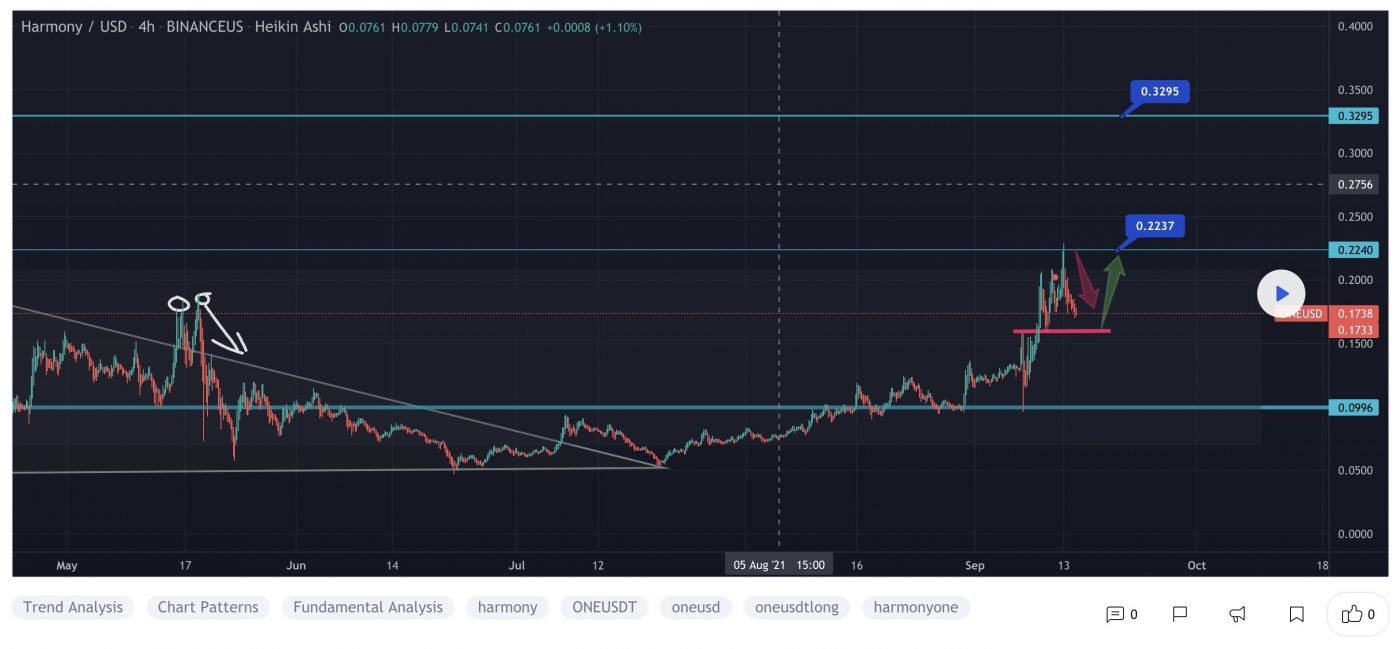
At the time of writing, ONE is ranked the 67th cryptocurrency globally and the current price is A$0.1728. Let’s take a look at the chart below for price analysis:

Source: TradingView

ONE‘s 85% retracement from its May highs set a low near A$0.0922 during its consolidation that began in July.

Relatively equal highs near A$0.1855 could be the current target if the price breaks through resistance beginning near A$0.1903. Bullish continuation might reach through the next significant swing high near A$0.2158 into the daily gap near A$0.2496.

If bullish strength continues, the zones just below the monthly open near A$0.2530 and A$0.2614 could halt any retracement. 

A bearish shift in the market might seek the relatively equal lows near A$0.1624 into possible support near A$0.1588. If this down move occurs, the swing low near A$0.1436 and possible support near A$0.1369 may be the primary objective.

3. Wanchain (WAN)

Wanchain WAN is a distributed ledger that allows for cross-chain transactions and the interoperability of multiple chains. Although Wanchain facilitates transactions between blockchains, it is also a stand-alone blockchain that runs autonomously. The protocol acts as a distributed ledger that processes and maintains records of cross-chain transactions.

WAN Price Analysis

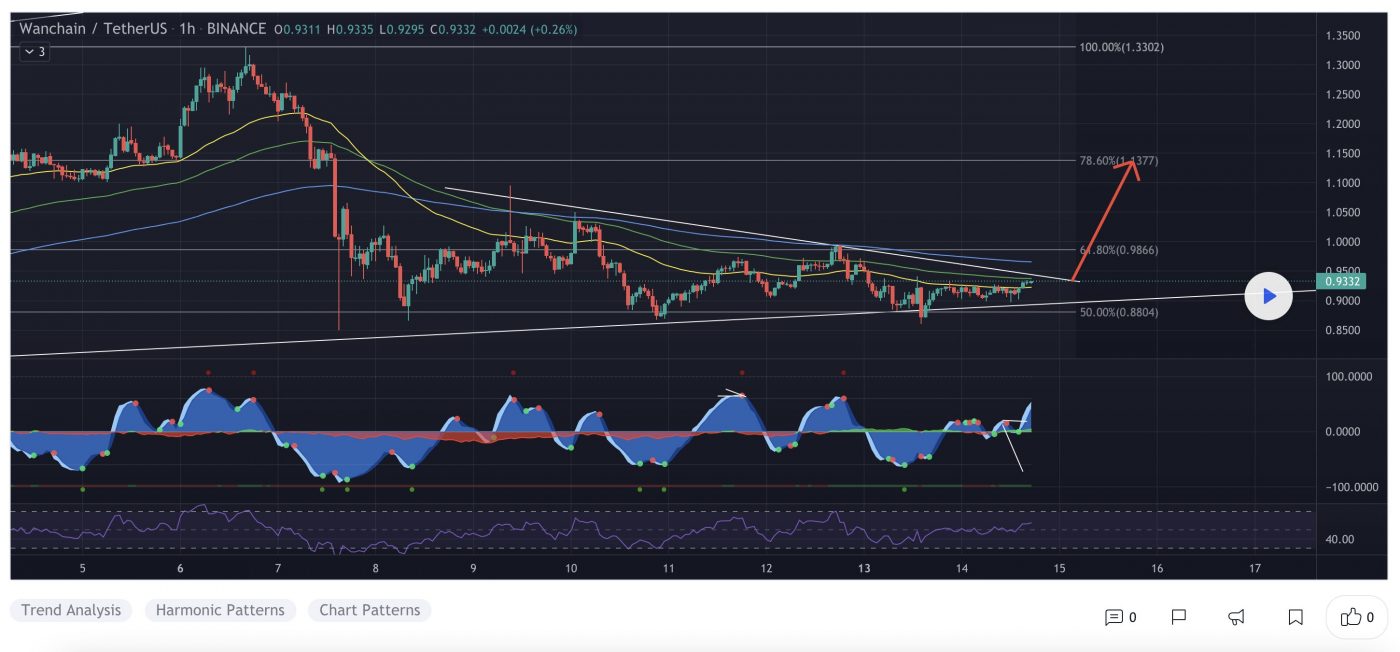
At the time of writing, WAN is ranked the 294th cryptocurrency globally and the current price is A$1.27. Let’s take a look at the chart below for price analysis:

Source: TradingView

After retracing nearly 70% from its May high, WAN set a low near A$0.9542 as it formed its current range.

Last week, the price swept highs near A$1.53, which now also marks the September monthly high. Relatively equal daily highs near A$1.35 provide a reasonable target, although resistance beginning near $1.37 could cap the move. A break of this resistance is likely to target the swing high near A$1.45 into higher-timeframe resistance beginning near A$1.42.

The current area near A$1.25 could provide support, although bulls may be more likely to buy near the price fractal near A$1.20 if a retracement reaches this level. A break of this area could continue down to sweep the July low near A$1.17 into possible support beginning near A$1.13.

Where to Buy or Trade Altcoins?

These coins have high liquidity on Binance Exchange, so that could help with trading on AUD/USDT/BTC pairs. And if you’re looking at buying and HODLing cryptos, then Swyftx Exchange is an easy-to-use popular choice in Australia.