Categories
Binance Crypto News Market Analysis Swyftx Trading VeChain

Top 3 Coins To Watch Today: VET, ALICE, SHIB – July 16 Trading Analysis

Let’s take a closer look at today’s altcoins showing breakout signals. We’ll explain what the coin is, then dive into the trading charts and provide some analysis to help you decide.

1. VeChain (VET)

VeChain VET is a blockchain-powered supply chain platform. VeChain aims to use distributed governance and Internet of Things (IoT) technology to create an ecosystem that solves some of the major problems with supply chain management.

VET Price Analysis

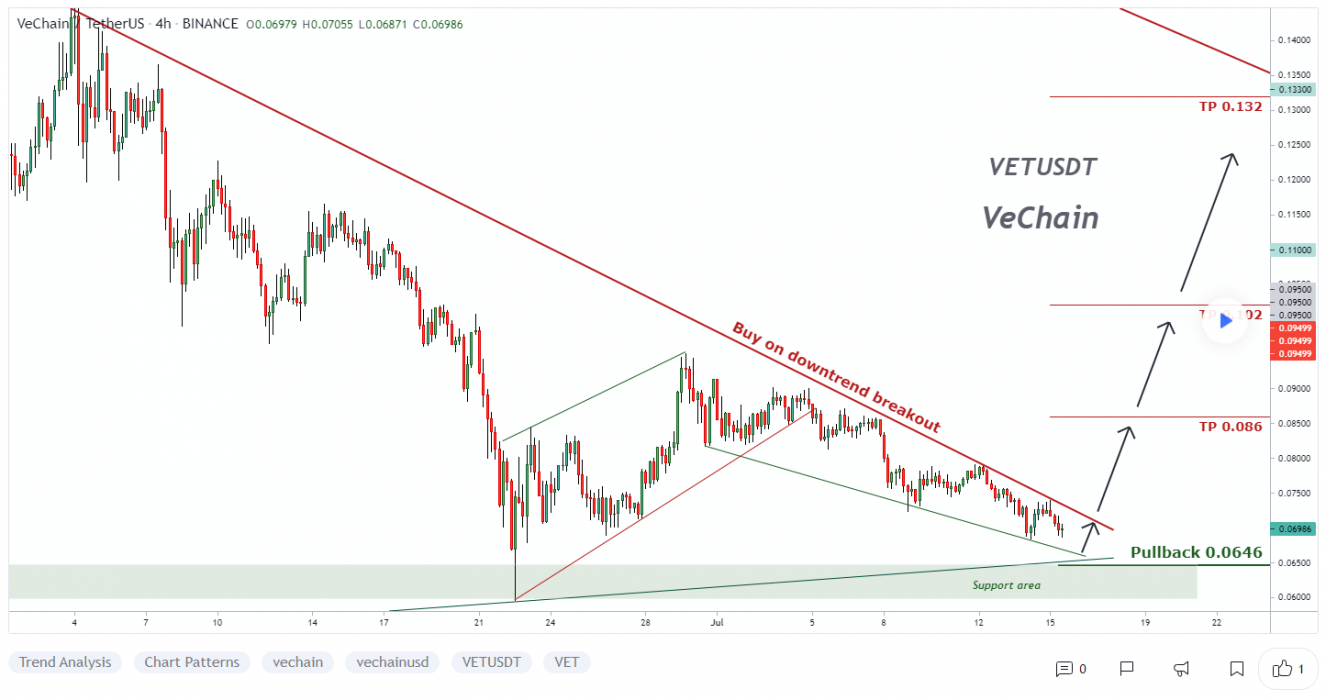
At the time of writing, VET is ranked the 23rd cryptocurrency globally and the current price is A$0.09351. Let’s take a look at the chart below for price analysis:
Source: TradingView

During July, VET has consolidated under the July monthly open inside an approximately 25% range. This consolidation could point to accumulation. 

Bulls immediately bought up dips to support at a weekly level near A$0.08749 and a monthly level near A$0.1057, showing substantial buyer interest.

A cluster of relatively equal daily lows around A$0.08544 provides an attractive target for a stop run, creating a potentially excellent entry for bulls. More aggressive bulls could enter on dips to the closer support beginning at A$0.07951

If Bitcoin tumbles, a more pronounced dip could reach as low as the equal lows near A$0.07352, running stops into support beginning at A$0.07015. This move would give a good risk/reward entry for bulls targeting the high below resistance starting at A$0.1162, the relatively equal highs near A$0.1492, and the June high near A$0.1917.

2. MyNeighborAlice (ALICE)

ALICE is a multiplayer builder game, where anyone can buy and own virtual islands, collect and build exciting items and meet new friends. Inspired by successful games such as Animal Crossing, the game combines the best of the two worlds – a fun narrative for regular players who want to enjoy the gameplay experience as well as an ecosystem for players who want to collect and trade Non-Fungible Tokens (NFTs).

ALICE Price Analysis

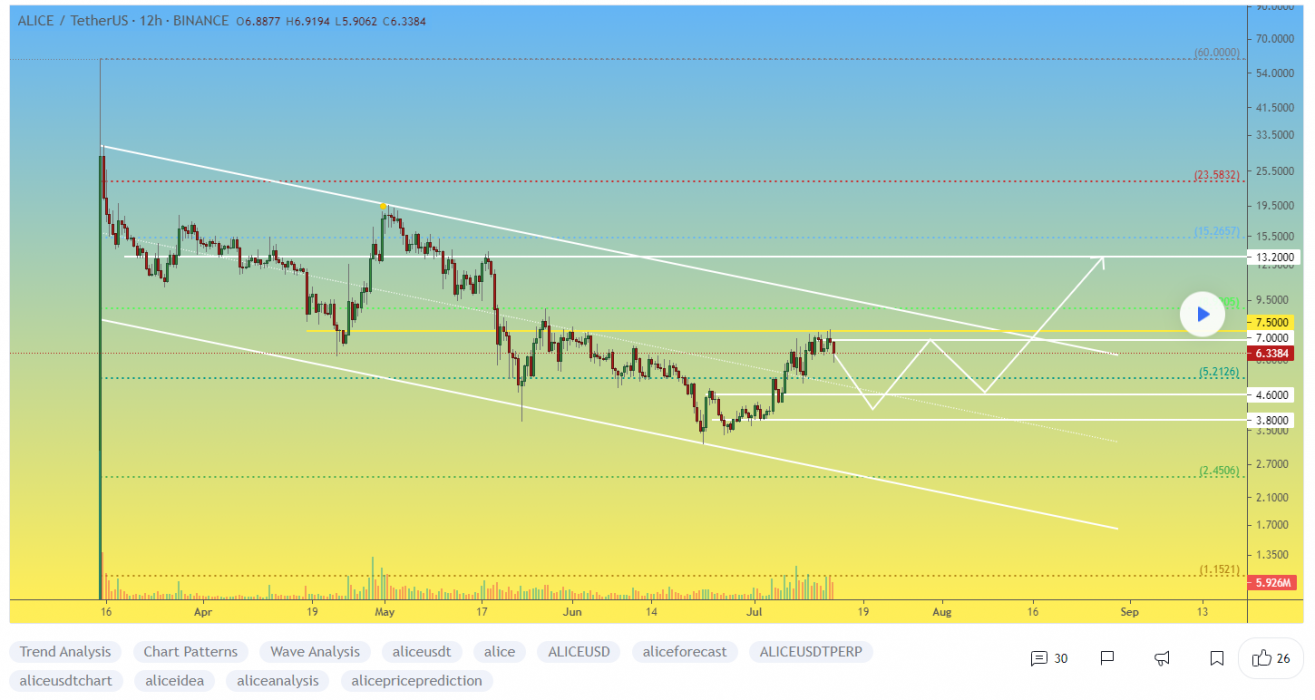
At the time of writing, ALICE  is ranked the 187th cryptocurrency globally and the current price is A$10.61. Let’s take a look at the chart below for price analysis:
Source: TradingView

After accumulating under the July monthly open, ALICE rallied 129% in a week before retracing to support near A$9.55.

Buyers continue to snatch up dips under the weekly open, suggesting that accumulation is still taking place. 

Bulls could look for entries in this region while being conscious of a potential stop run below the cluster of lows at A$8.82. Two areas of support, beginning near A$8.57 and A$8.29, provide probable buys if the price dips this low.

The equal highs near A$12.63 provide a first reasonable bullish target. If the price takes this target and penetrates the surrounding resistance, the next probable resistance begins near A$14.66. Possible targets include the old highs just above this resistance near A$19.83, A$21.46, and A$24.39.

3. Shiba Inu (SHIB)

Shiba Inu SHIB coin was created anonymously in August 2020 under the pseudonym “Ryoshi.” The meme coin quickly gained speed and value as a community of investors was drawn in by the cute charm of the coin paired with headlines and Tweets from personalities like Elon Musk and Vitalik Buterin.

SHIB Price Analysis

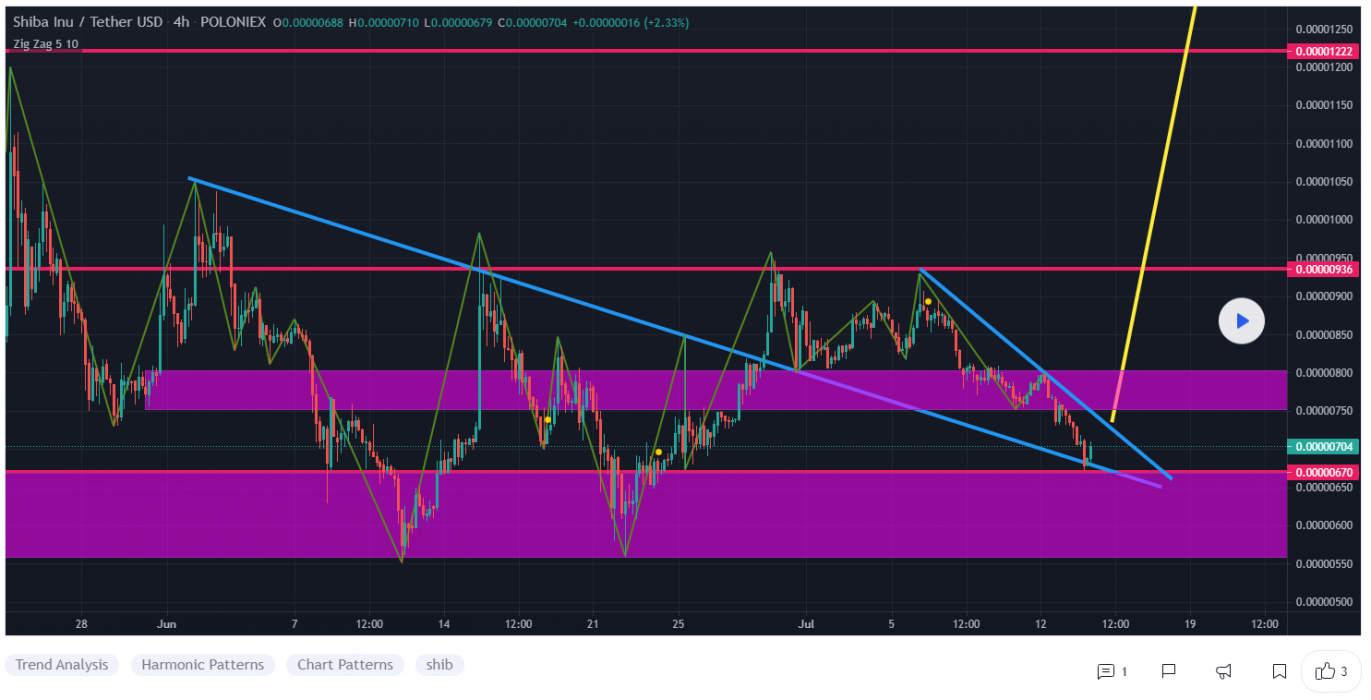
At the time of writing, SHIB is ranked the 34th cryptocurrency globally and the current price is A$0.000009329. Let’s take a look at the chart below for price analysis:
Source: TradingView

SHIB wasted no time during June, rocketing upward over 85% from the last week of the month into the resistance near A$0.000015829.

For the last several days, the price has consolidated sideways and appears to be flipping old resistance near A$0.000011829 to support. If this level breaks – perhaps due to the tempting daily equal lows below – the next support begins near A$0.000008529.

Bulls entering at these levels could set their first target near the previous resistance near A$0.000012159. Beyond this level, probable targets include the old highs near A$0.000013529 and the resistance above near A$0.000013929.

A break of this resistance later this month could continue to the highs near A$0.000015229 and A$0.000015829.

Where to Buy or Trade Altcoins?

These three coins have the high liquidity on Binance Exchange, so that could help with trading on AUD/USDT/BTC pairs. And if you’re looking at buying and HODLing cryptos, then Swyftx Exchange is an easy-to-use popular choice in Australia.

Categories
Binance Crypto News Market Analysis Swyftx Trading

Top 3 Coins To Watch Today: AXS, SAND, OGN – July 15 Trading Analysis

Let’s take a closer look at today’s altcoins showing breakout signals. We’ll explain what the coin is, then dive into the trading charts and provide some analysis to help you decide.

1. Axie Infinity (AXS)

Axie Infinity AXS is a blockchain-based trading and battling game that is partially owned and operated by its players. Each Axie is a non-fungible token (NFT) with different attributes and strengths and can be entered into 3v3 battles, with the winning team earning more experience (exp) points that are used to level up an Axie’s stats or evolve its body parts.

AXS Price Analysis

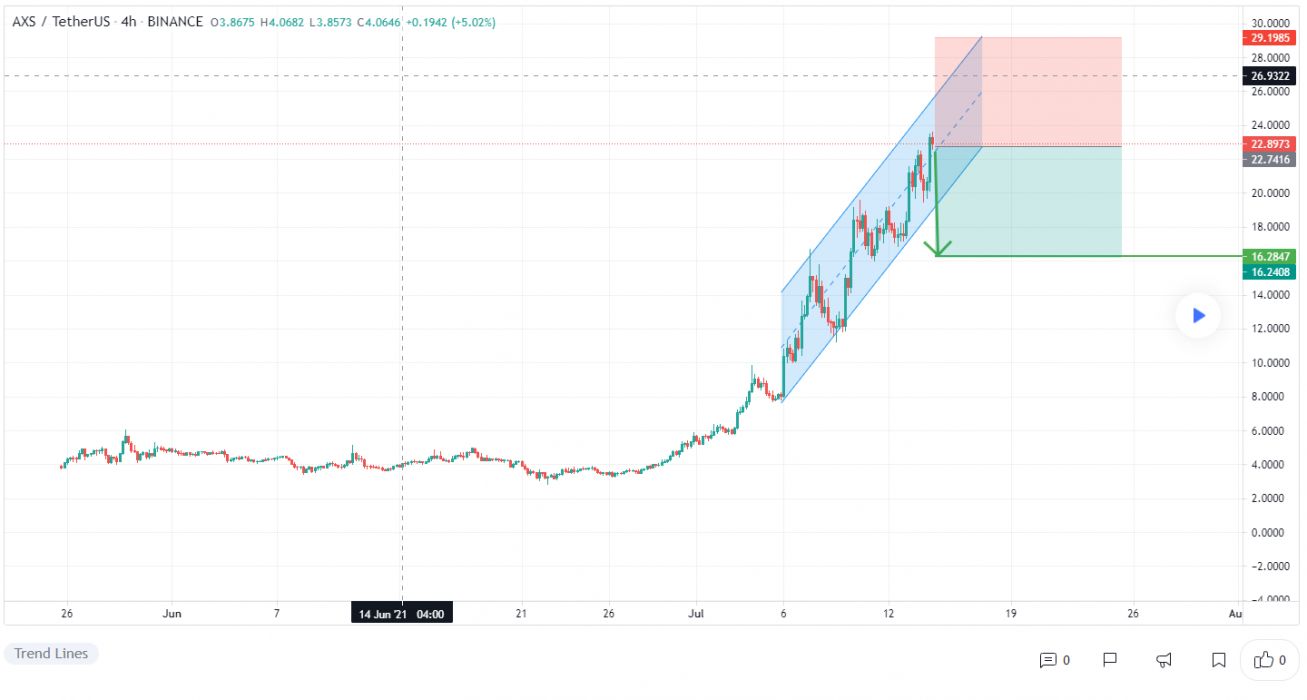
At the time of writing, AXS is ranked the 60th cryptocurrency globally and the current price is A$30.85. Let’s take a look at the chart below for price analysis:

Source: TradingView

AXS exploded over 390% from the monthly open to tag the 400% extension near A$30.54. This level could continue to provide resistance, although early morning trading suggests that the 68% extension near A$32.25 could be turning from resistance to support.

A drop to the daily gap beginning at A$25.45 could provide an excellent entry for traders who can’t watch intraday price action. If this gap fills, the zone between A$22.00 and A$20.65 provides the next logical support. 

Technical analysis can’t predict a final target, but the 450% and 500% extensions near A$34.87 and A$39.55 are likely to provide significant resistance. Traders planning to take profits along the way can also watch the 435% extension near A$32.17.

2. The Sandbox (SAND)

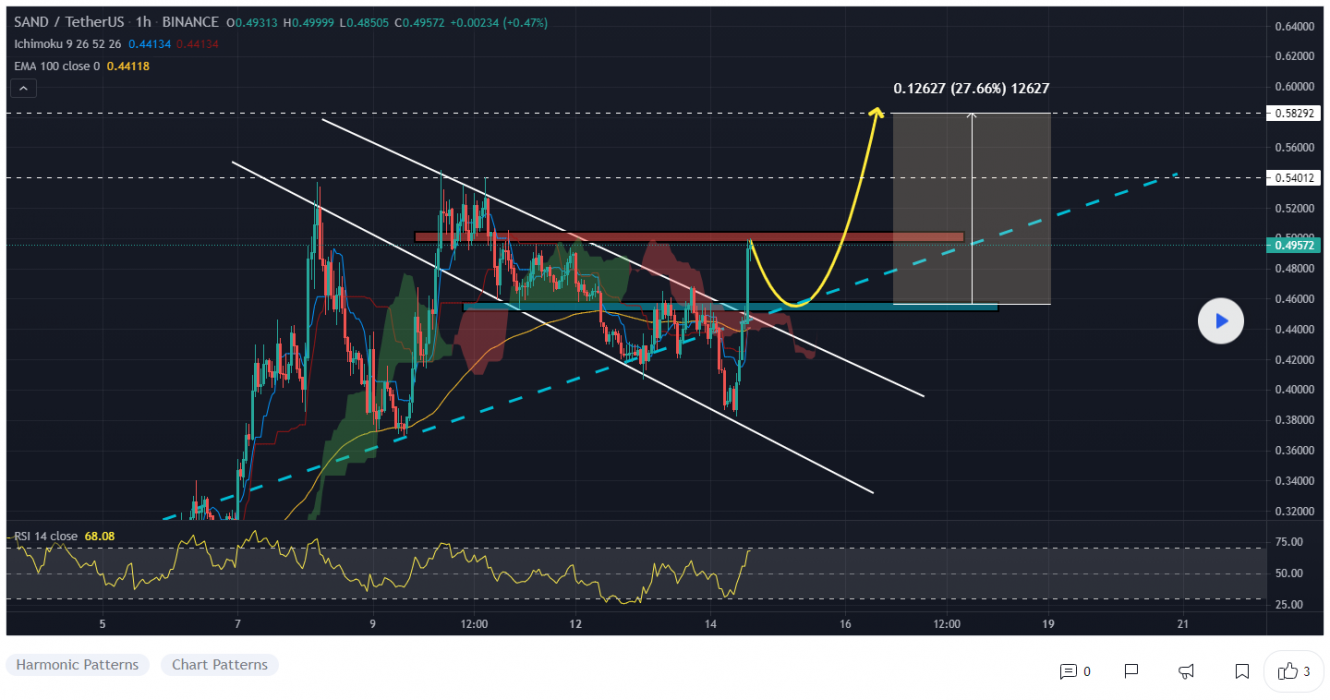
The Sandbox SAND is a blockchain-based virtual world allowing users to create, build, buy and sell digital assets in the form of a game. By combining the powers of decentralised autonomous organisations (DAO) and non-fungible tokens (NFTs), the Sandbox creates a decentralised platform for a thriving gaming community.

SAND Price Analysis

At the time of writing, SAND is ranked the 112th cryptocurrency globally and the current price is A$0.6759. Let’s take a look at the chart below for price analysis:

Source: TradingView

SAND’s stunning rally from June 25 transitioned to a slower continuation during July. However, the 127% extension near A$0.6945 has provided stiff resistance and pinned down the daily closes for the latter part of last week.

Traders could begin looking for entries in support created by the gap from A$0.5844 to A$0.5587. A higher risk-to-reward opportunity could present itself at probable support between A$0.6012 and A$0.5247, just above the weekly open. 

A deeper market retracement could drop below the relatively equal lows near A$0.4829, giving a higher probability entry in the support from A$0.4588 to A$0.4259.

As price explores thin air, there’s no way to predict the final target. However, the 100% and 168% extensions near A$0.8955 and A$0.9657 are likely to provide more significant resistance. The 68% and 127% extensions near A$0.8514 and A$0.8047 are reasonable areas to take profits along the way.

3. Origin Protocol (OGN)

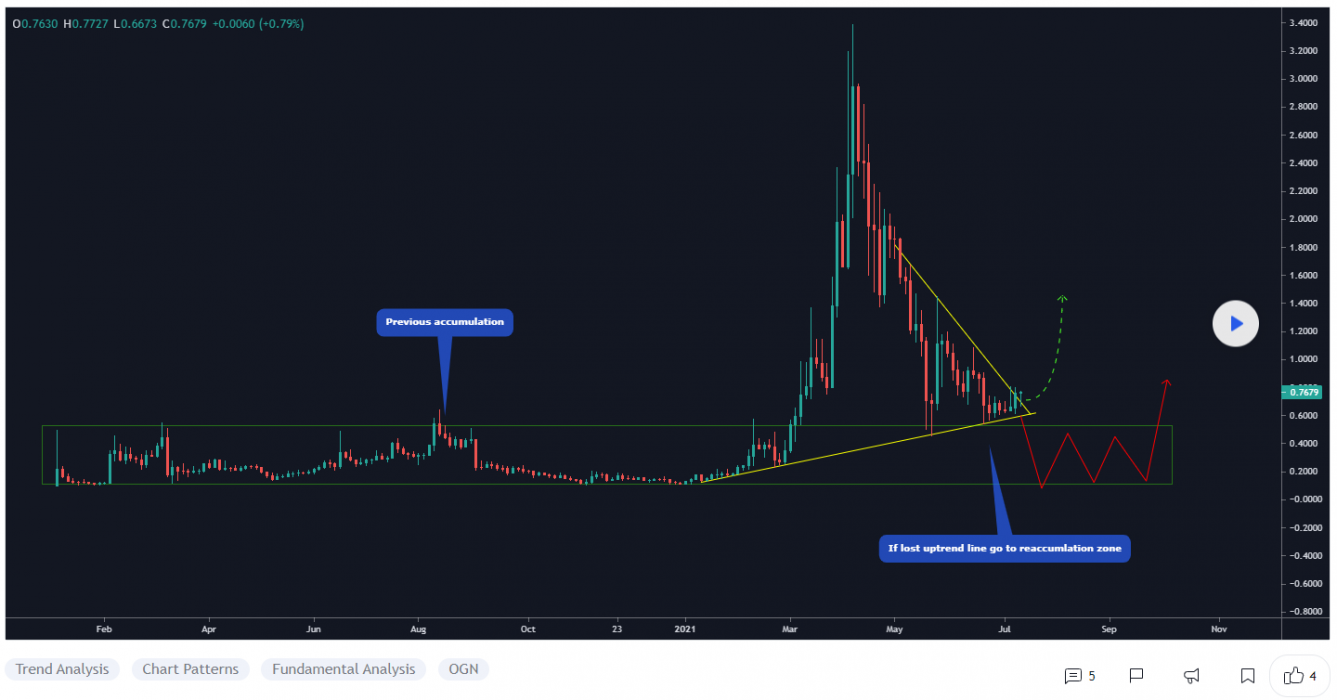
Origin Protocol OGN is a network that allows market participants to share goods and services through peer-to-peer (P2P) networks. The platform aims to create an extensive online marketplace leveraging the Ethereum (ETH) blockchain and Interplanetary File System (IPFS) in order to eliminate the need for middlemen.

OGN Price Analysis

At the time of writing, OGN is ranked the 134th cryptocurrency globally and the current price is A$1.08. Let’s take a look at the chart below for price analysis:

Source: TradingView

OGN climbed just over 20% from July’s monthly open as it positioned itself to challenge two old swing highs.

The region between A$0.8568 and A$0.8047 has provided support for the last few days, making it a reasonable place for aggressive traders to take smaller-size positions. However, a better risk-reward entry might form at support between A$0.9144 and A$0.9572.

If the resistance between A$1.17 and A$1.30 breaks, the next resistance is between A$1.41 and the May swing high at A$1.68, which marks the first primary target for this trend.

Beyond this first target, traders could target a swing high from last April at A$2.30 and possibly up to resistance between A$2.51 and A$2.72.

Where to Buy or Trade Altcoins?

These three coins have the high liquidity on Binance Exchange, so that could help with trading on AUD/USDT/BTC pairs. And if you’re looking at buying and HODLing cryptos, then Swyftx Exchange is an easy-to-use popular choice in Australia.

Categories
Binance Crypto News Market Analysis Swyftx Trading

Top 3 Coins To Watch Today: HBAR, ZEC, GRT – July 14 Trading Analysis

Let’s take a closer look at today’s altcoins showing breakout signals. We’ll explain what the coin is, then dive into the trading charts and provide some analysis to help you decide.

1. Hedera Hashgraph (HBAR)

Billed as the “trust layer of the internet”, Hedera Hashgraph HBAR is a public network that allows individuals and businesses to create powerful decentralised applications (DApps).

It is designed to be a fairer, more efficient system that eliminates some of the limitations older blockchain-based platforms face, such as slow performance and instability.

HBAR Price Analysis

At the time of writing, HBAR is ranked the 54th cryptocurrency globally and the current price is A$0.2414. Let’s take a look at the chart below for price analysis:

Source: TradingView

During the weekend it swung around A$0.2614 as it tested support near A$0.2247.

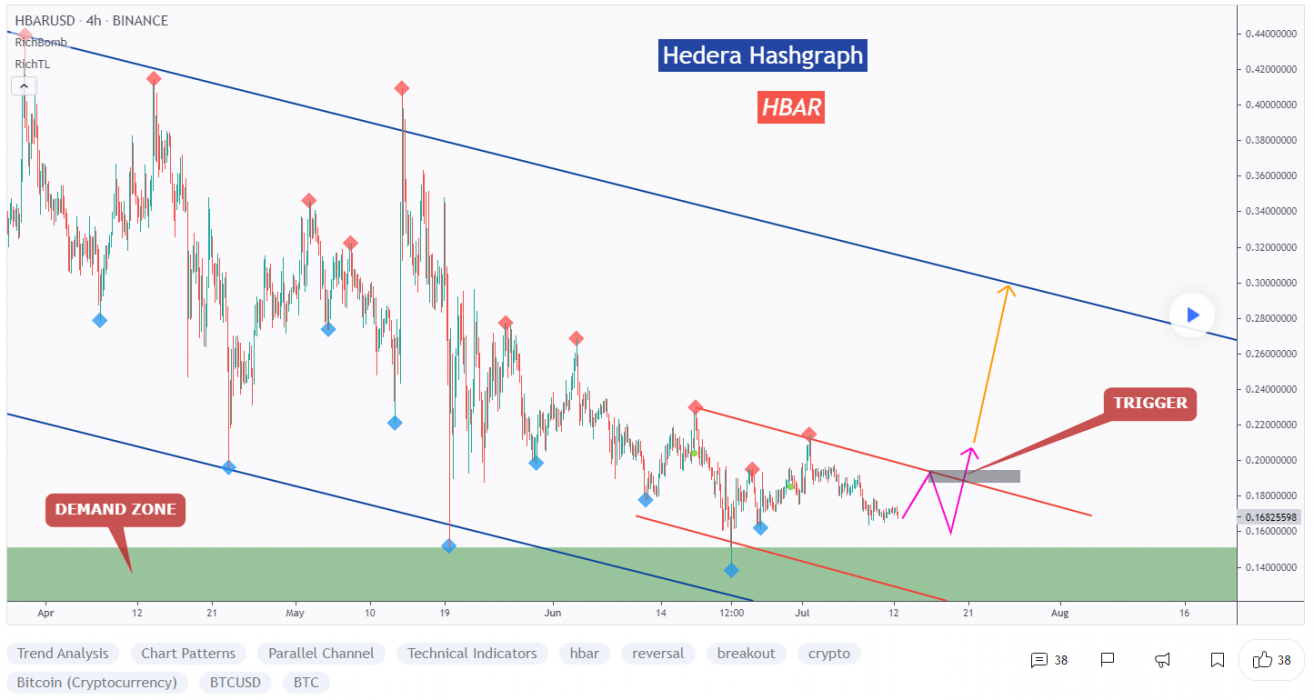
Following H4 candle chart: HBAR is forming a channel in red but our upper trendline is not valid yet, so we are waiting for a new swing high to form around it to consider it our trigger swing.

Aggressive traders expecting expansion to the upside could look for entries near possible support around A$0.2094. Bids near A$0.1855 may be able to capitalise on an attempt to run the stops below the weekend’s swing low. A stop run below this low may reach into possible support near A$0.1529.

In the short term, A$0.3442 may provide some resistance. The swing high near A$0.3169 looks like a first target, with the area just above up to A$0.3352 possibly creating resistance.

2. Zcash (ZEC)

ZEC is a decentralised cryptocurrency focused on privacy and anonymity. It uses the zk-SNARK zero-knowledge proof technology that allows nodes on the network to verify transactions without revealing any sensitive information about those transactions.

ZEC Price Analysis

At the time of writing, ZEC is ranked the 64th cryptocurrency globally and the current price is A$141.34. Let’s take a look at the chart below for price analysis:

Source: TradingView

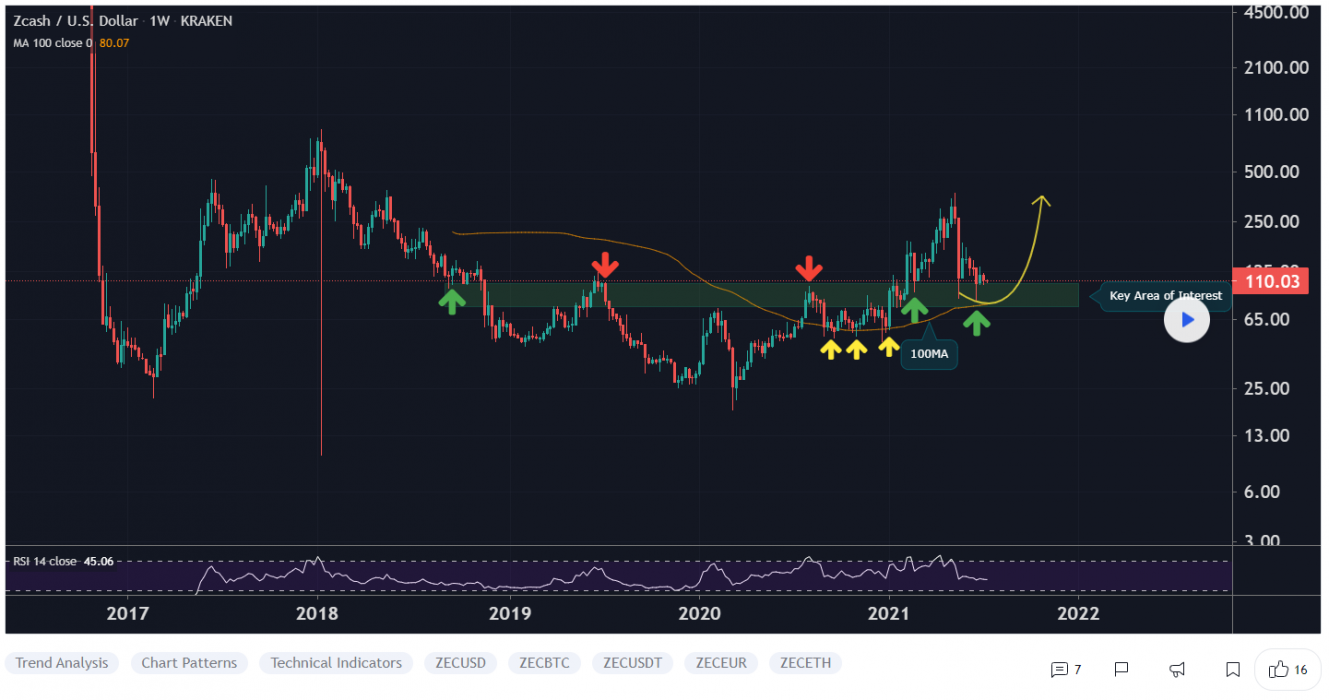
The weekend’s 21% drop was immediately bought up and closed the day bullish, suggesting strength for ZEC bulls.

Aggressive traders could look for support near A$132.25. Levels near A$125.78 and A$118.57 also provide areas for bids during a retracement.

The A$110.25 lower range of support is coinciding with the 100W Moving Average, which has been respected multiple times since August 2020 and up until January 2021.

Little resistance rests overhead, but the area between A$145.62 and the swing high at A$152.74 may cap an initial move upward. Extensions seem to indicate A$163.55 and A$169.24 as take-profit zones.

3. The Graph (GRT)

The Graph GRT is working to bring reliable decentralised public infrastructure to the mainstream market. To ensure economic security of The Graph Network and the integrity of data being queried, participants use Graph Token. GRT is a work token that is locked-up by Indexers, Curators and Delegators in order to provide indexing and curating services to the network.

GRT Price Analysis

At the time of writing, GRT is ranked the 48th cryptocurrency globally and the current price is A$0.8814. Let’s take a look at the chart below for price analysis:

Source: TradingView

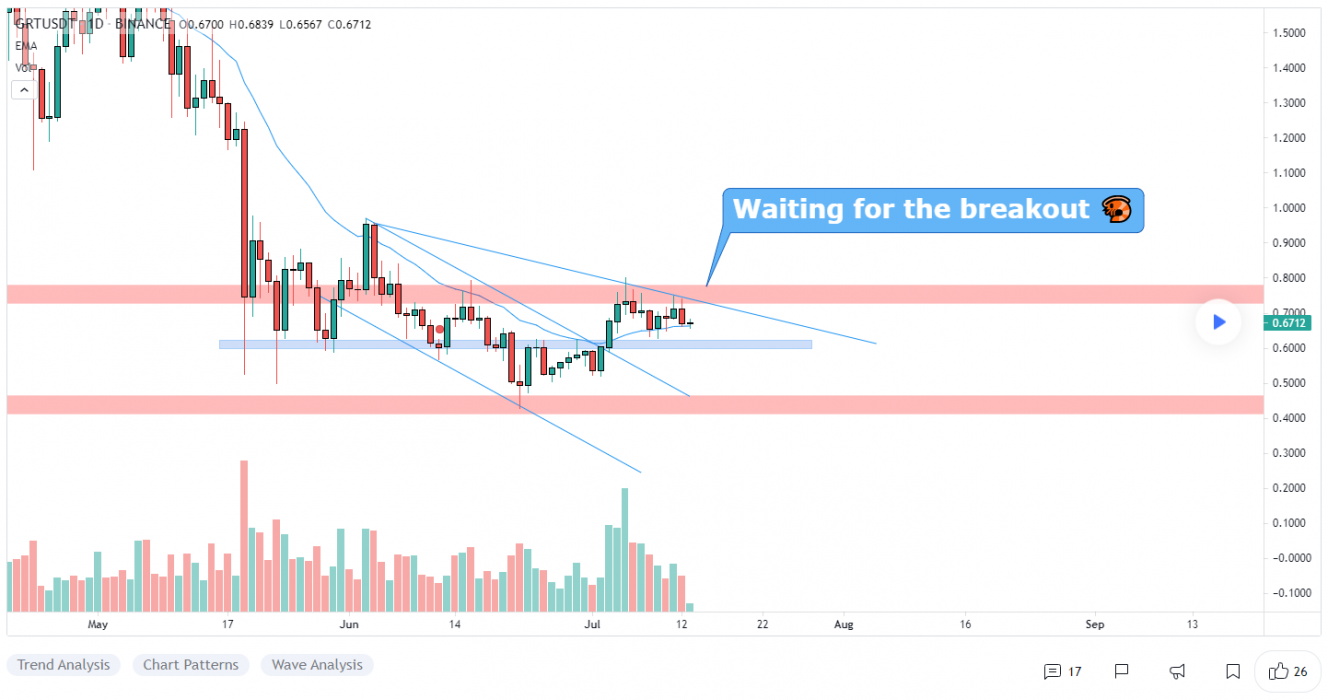
An impressive 163% two months for GRT has retraced over 56% as the price consolidates near the weekly gap beginning near A$0.8547.

The equal lows at this weekly gap might see a stop run before any further move up. The area near A$0.8214 at the top of a daily gap could provide support.

The bottom of the gap seems a more likely support, ranging from approximately A$0.7244 to the consolidation that started the massive move upward. If this level fails, traders could look for sensitivity near the middle of the monthly gap near A$0.6437.

Impulses upward during retracement are possible, but the most substantial resistance seems just below the June swing high near A$1.10. This swing high provides a clear first target, with any targets beyond challenging to predict.

Where to Buy or Trade Altcoins?

These three coins have the high liquidity on Binance Exchange, so that could help with trading on AUD/USDT/BTC pairs. And if you’re looking at buying and HODLing cryptos, then Swyftx Exchange is an easy-to-use popular choice in Australia.
Categories
Binance Crypto News Market Analysis Swyftx Trading

Top 3 Coins To Watch Today: BNB, FWT, KAVA – July 13 Trading Analysis

Let’s take a closer look at today’s altcoins showing breakout signals. We’ll explain what the coin is, then dive into the trading charts and provide some analysis to help you decide.

1. Binance Coin (BNB)

BNB is the cryptocurrency of the Binance platform. It is a trading platform exclusively for cryptocurrencies. The name “Binance” is a combination of binary and finance. The cryptocurrency currently has a daily trading volume of 1.5 billion – 2 billion US dollars and is still increasing. In total, there will only be 200 million BNBs. 

BNB Price Analysis

At the time of writing, BNB is ranked the 4th cryptocurrency globally and the current price is A$430.07. Let’s take a look at the chart below for price analysis:

Source: TradingView

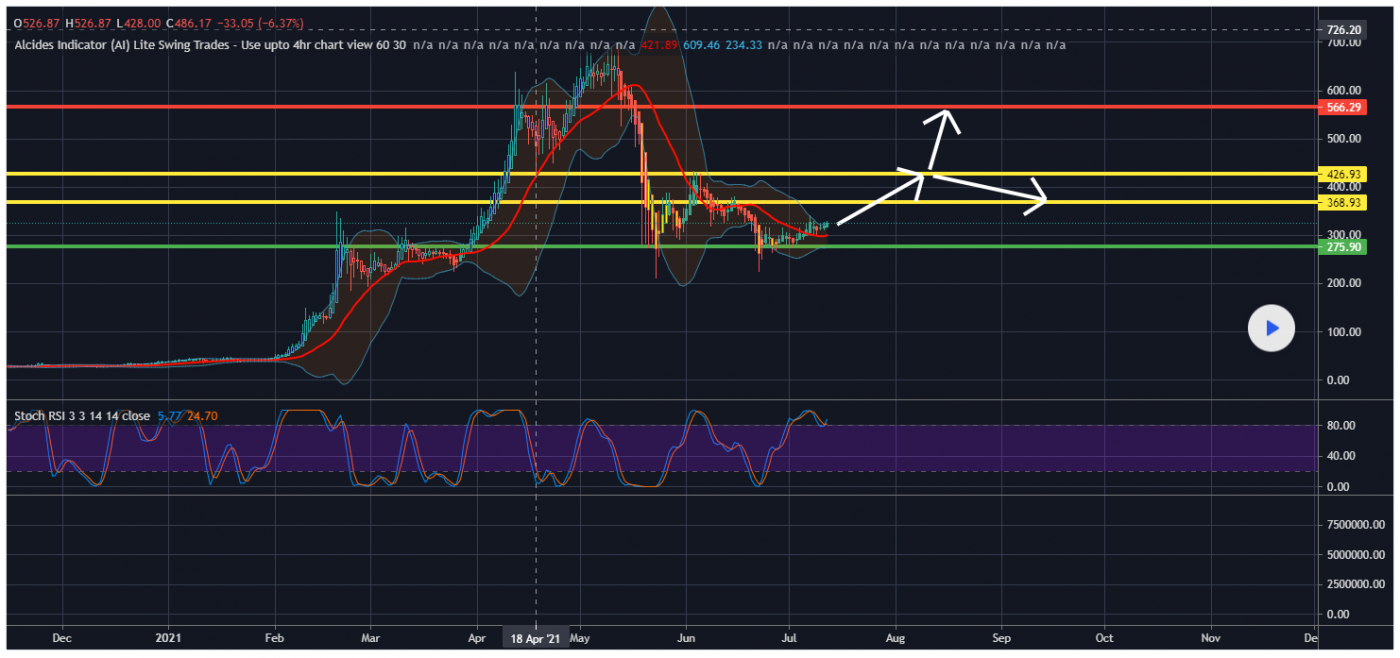
After dropping nearly 70% in less than two weeks, BNB found a low just above the monthly gap near A$282.79. Since then, the price has been consolidating in a range between A$578.41 and A$282.79.

The weekly level near A$388.55 may continue to provide support during a run on the local swing lows. The monthly gap beginning near A$280.79 will likely give the next higher-timeframe support if this level fails.

The price is currently chewing into potentially strong resistance near A$437.50. A sweep of the relatively equal highs near A$456.85, and a daily close above this level could signal a move to the next set of relatively equal highs near A$507.05. 

Just above these highs, probable resistance rests near A$525.96, which may cap the price until the market moves out of consolidation. However, any significant bullish shift in market conditions during the next few weeks could help bulls reach the swing high near A$578.41, running stops into probable resistance near A$616.71.

2. Freeway Token (FWT)

FWT are the native utility tokens for AuBit Freeway – a ground-breaking new asset management platform built for greater total returns on the world’s top investment products with no additional risk.

FWT Price Analysis

At the time of writing, FWT is ranked the 488th cryptocurrency globally and the current price is A$0.0118. Let’s take a look at the chart below for price analysis:

Source: TradingView

FWT accompanied the rest of the market in the mid-Q2 drop, falling nearly 83% from its mid-May high until it found a low late in June.

Price action in late June formed a weekly support level near A$0.011, which has so far held up the price. The most recent swing low inside this range, near A$0.010, might be the target for any future stop runs. After this low, the swing low near A$0.0072 and the gap beginning near A$0.0071 marks possible higher-timeframe support.

The price is currently battling with significant higher-timeframe resistance levels, with the closest probable resistance resting near A$0.012, just over the July monthly open. A sweep of the relatively equal highs above this resistance might find sellers near A$0.013 – but could reach as high as A$0.016.

3. Kava.io (KAVA)

Kava is a cross-chain DeFi lending platform that allows users to borrow USDX stablecoins and deposit a variety of cryptocurrencies to begin earning a yield. The Kava DeFi hub operates like a decentralised bank for digital assets, allowing users to access a range of decentralised financial services, including its native USD-pegged stablecoin USDX, as well as synthetics and derivatives. Through Kava, users are able to borrow USDX tokens by depositing collateral, effectively leveraging their exposure to crypto assets.

KAVA Price Analysis

KAVA is ranked the 124th cryptocurrency globally and the current price is A$$5.83. Let’s take a look at the chart below for price analysis:

Source: TradingView

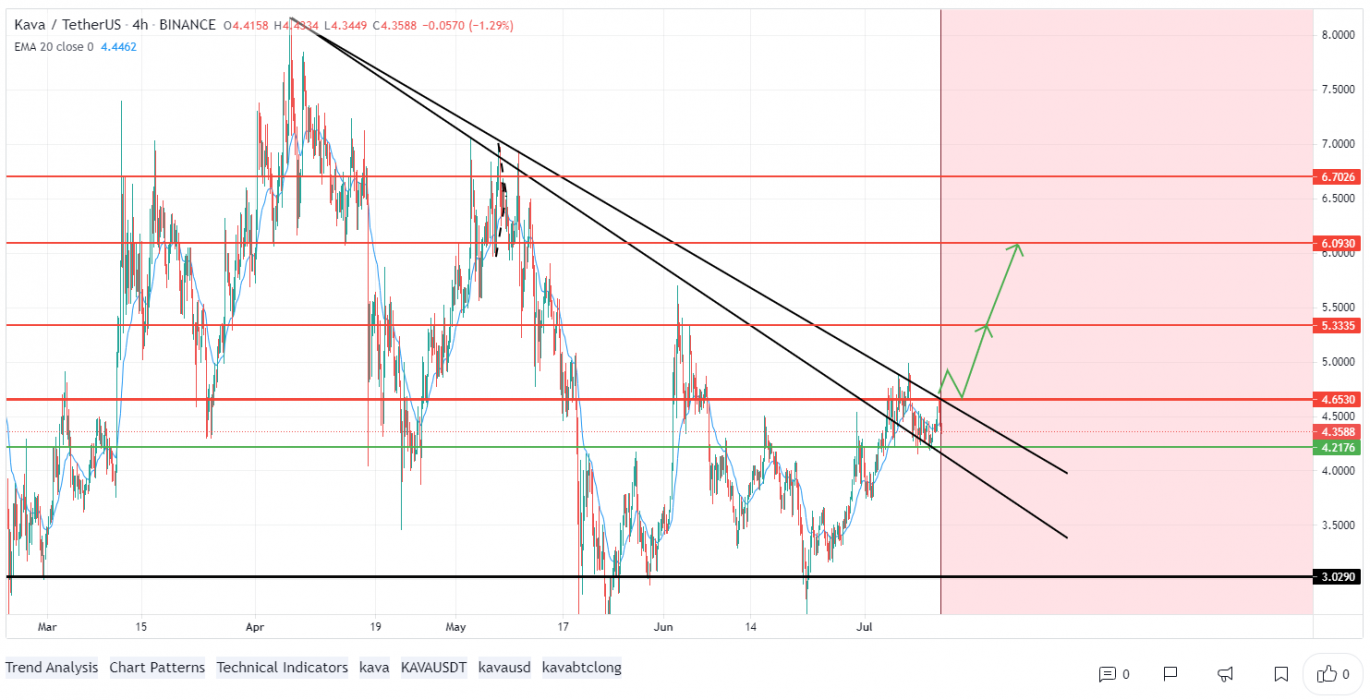
KAVA has been trading through a massive range since April, with the price showing mild bullishness during July.

The breaks of the swing highs at A$5.46 and A$6.02 led to support forming near A$5.55. Some bulls will likely wait for a more favourable entry on a potential stop run that could reach near A$4.74. 

If the support near A$5.55 continues to hold, the recent swing high at $4.9845 is likely the next short-term target. This potential bullish swing might end with a run on short stops up to A$7.61 and A$7.88. 

Higher-timeframe resistance between A$7.59 and A$8.12 may cap any move upwards until the overall market becomes more bullish. However, any significant bearish move in Bitcoin will likely push the price down toward the low and possible support near A$2.82.

Where to Buy or Trade Altcoins?

These three coins have the high liquidity on Binance Exchange, so that could help with trading on AUD/USDT/BTC pairs. And if you’re looking at buying and HODLing cryptos, then Swyftx Exchange is an easy-to-use popular choice in Australia.
Categories
Binance Crypto News Market Analysis Swyftx Trading

Top 3 Coins To Watch This Week: CELR, FET, SXP – Trading Analysis

Let’s take a closer look at this week’s altcoins showing breakout signals. We’ll dive into the trading charts and provide some analysis to help you.

1. Celer Network (CELR)

The Celer Network (CELR) is a smartly designed layer-2 scaling solution that provides off-chain transactions handling. The Celer platform offers fast, simple and secure off-chain transactions for both payments and smart contracts. The project was among the first to be developed using the Substrate framework and is part of the Polkadot ecosystem. As to the overall goal of the network, its founders envisioned unleashing the full potential of blockchain and revolutionising Dapps with more efficient and productive outputs.

CELR Price Analysis

At the time of writing, CELR is ranked the 174th cryptocurrency globally and the current price is A$0.03565. Let’s take a look at the chart below for price analysis:

Source: TradingView

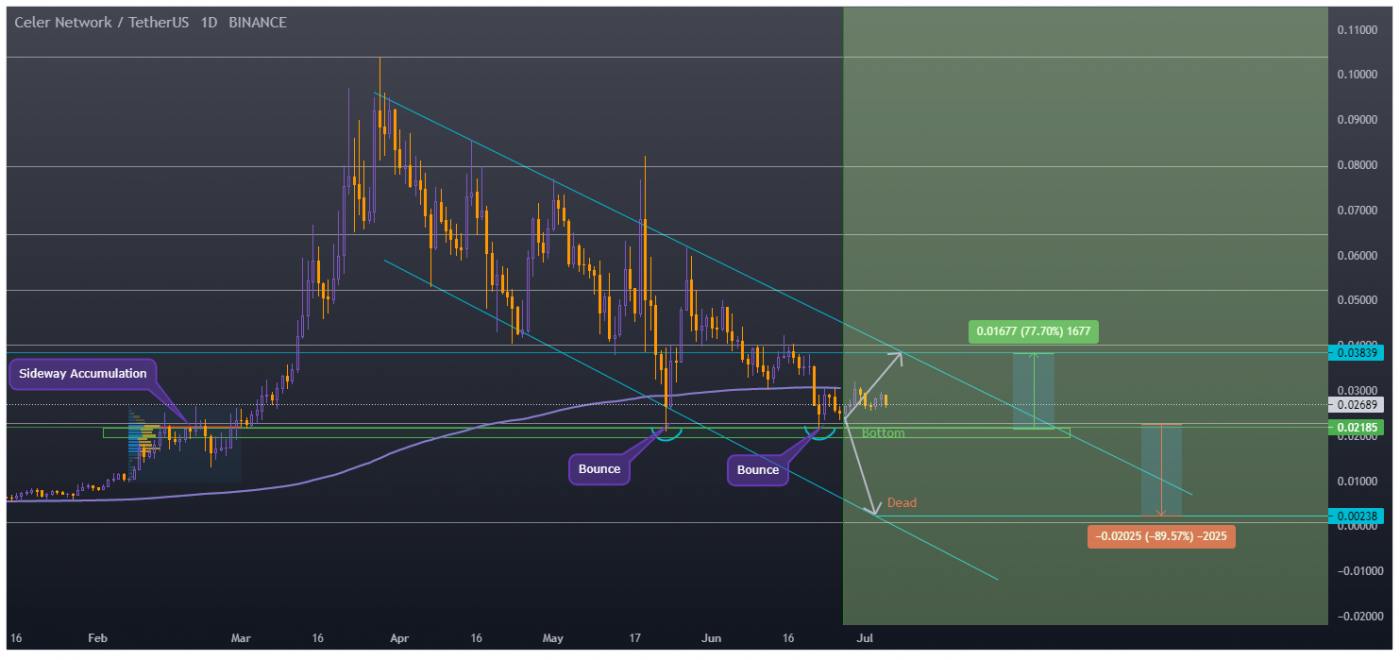
After retracing nearly 80 percent from its highs, CELR wicked into the monthly gap beginning near A$0.02814. This wick formed the bottom of the current range.

The price shows no apparent signs of a longer-term reversal, which may mean that the closest resistance near A$0.04012 will continue to suppress the price. However, some support could be found near the monthly open, possibly giving bulls footing for a stop run through the swing high at A$0.04296. 

This move could continue into resistance near A$0.04731 and spike through the relatively equal highs near A$0.05047. A break of the next swing high near A$0.05631 is likely to find resistance once it reaches A$0.05733. If this move occurs, it may suggest a longer-term reversal.

A retest of possible support near A$0.03142 could provide an entry for a short-term trade. However, there is a higher probability for more substantial support near A$00.01715 after a run on the lows at A$0.02810 and A$0.01715.

2. Fetch.ai (FET)

Fetch.ai is a platform that aims to connect Internet of Things (IoT) devices and algorithms to enable collective learning. It was launched in 2017 by a team based in Cambridge, UK. Fetch.ai is built on a high-throughput sharded ledger and offers smart contract capabilities to deploy machine learning and artificial intelligence solutions for decentralised problem-solving.

These open-source tools are designed to help users create ecosystem infrastructure and deploy commercial models.

FET Price Analysis

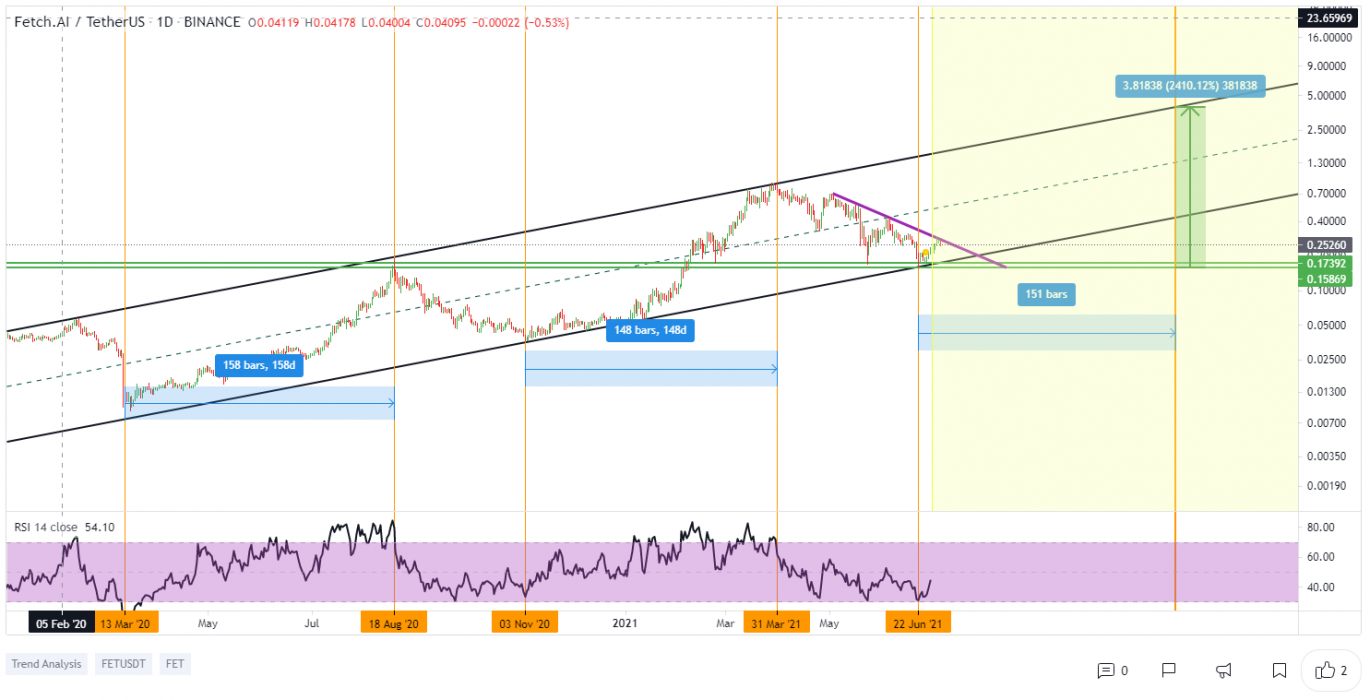
At the time of writing, FET is ranked the 156th cryptocurrency globally and the current price is A$0.3367. Let’s take a look at the chart below for price analysis:

Source: TradingView

FET has dropped nearly 82 percent from its highs, with the current low’s wick on June 22 taking stops below two major swing lows.

The resulting bounce found resistance near A$0.3764, which could continue to cap upward movement. If the price finds support in the current region near A$0.3536, it could continue to resistance near A$0.4183. A more substantial move might run stops above the swing high near A$0.4536 into resistance near A$0.4718.

A break below the monthly open is likely to target buy stops near A$0.2710, an area that could provide some support. A move below this level could target below the swing low at A$0.2169, possibly reaching the gap beginning near A$0.1700.

3. Swipe (SXP)

Swipe is a platform that looks to form a bridge between the fiat and cryptocurrency worlds with its three main existing products: the Swipe multi-asset mobile wallet, the Swipe cryptocurrency-funded debit card, and the Swipe Token (SXP).

This ecosystem is powered by the Swipe Token (SXP), which functions as the fuel for the Swipe Network, and is used for paying transaction fees. Holders of SXP tokens are eligible for exclusive discounts on the Swipe app and the token can be used for making fiat payments with the Swipe debit card.

SXP Price Analysis

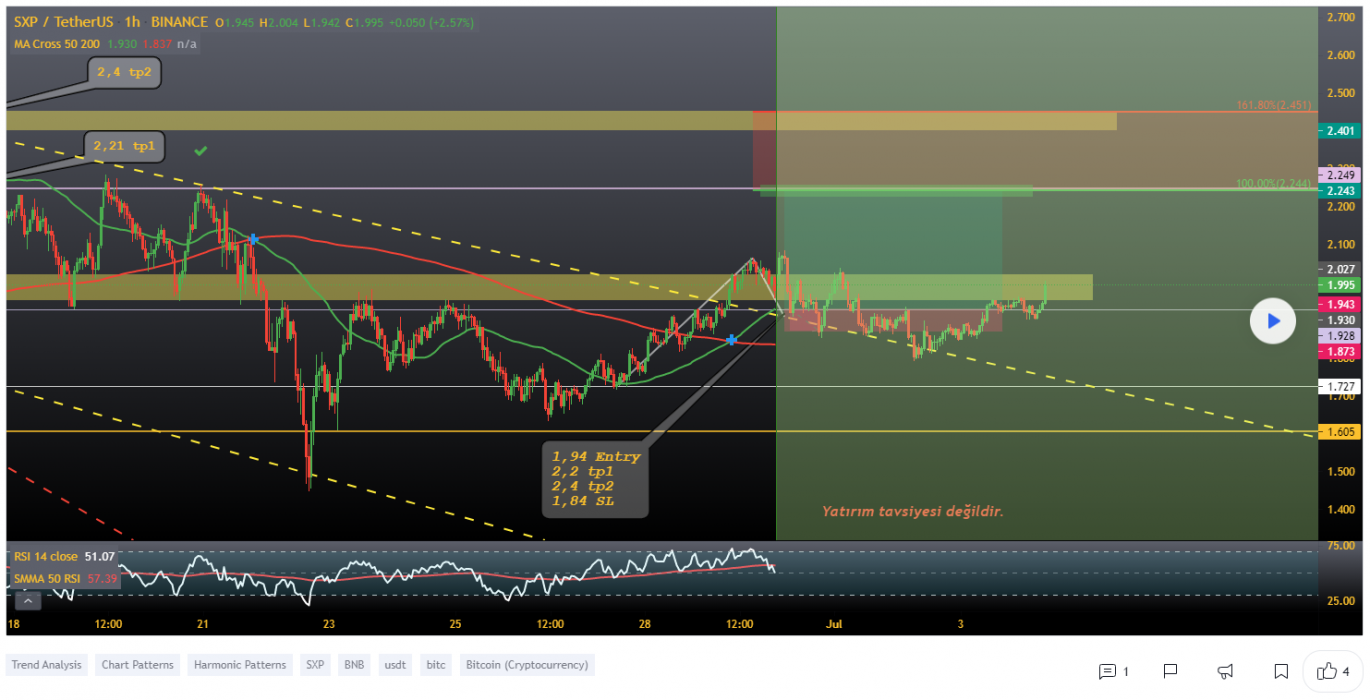
At the time of writing, SXP is ranked the 158th cryptocurrency globally and the current price is A$2.59. Let’s take a look at the chart below for price analysis:

Source: TradingView

SXP’s 77 percent drop has filled the February monthly gap twice as the price consolidates between A$1.78 and A$3.31.

Price’s current region, between A$2.69 and A$2.50 and just under the monthly open, could continue to give support. If this area continues to hold, the cluster of relatively equal range highs up to A$3.31 is a likely target. 

An animated move through these highs could reach up to the daily gap beginning at A$3.69. The area between A$4.26 and A$4.07 provides a likely cap for a move into this zone.

A drop lower could be a run-on stop under A$2.38 and find support near A$2.24. If this level is lost, the swing low at A$1.78 is a likely target, with A$1.60 possibly giving support.

Where to Buy or Trade Altcoins?

These three Altcoins have the high liquidity on Binance Exchange, so that could help with trading on USDT or BTC pairs. And if you’re looking at buying and HODLing cryptos, then Swyftx Exchange is an easy-to-use popular choice in Australia.
Categories
Binance Crypto News Market Analysis Swyftx Trading

Top 3 Coins To Watch This Week: EGLD, MINA, ORN – Trading Analysis

Let’s take a closer look at this week’s altcoins showing breakout signals. We’ll dive into the trading charts and provide some analysis to help you.

1. Elrond (EGLD)

Elrond is a blockchain protocol that seeks to offer extremely fast transaction speeds by using sharding. The project describes itself as a technology ecosystem for the new internet, which includes fintech, decentralised finance and the Internet of Things. Its smart contracts execution platform is reportedly capable of 15,000 transactions per second, six-second latency and a $0.001 transaction cost.

EGLD Price Analysis

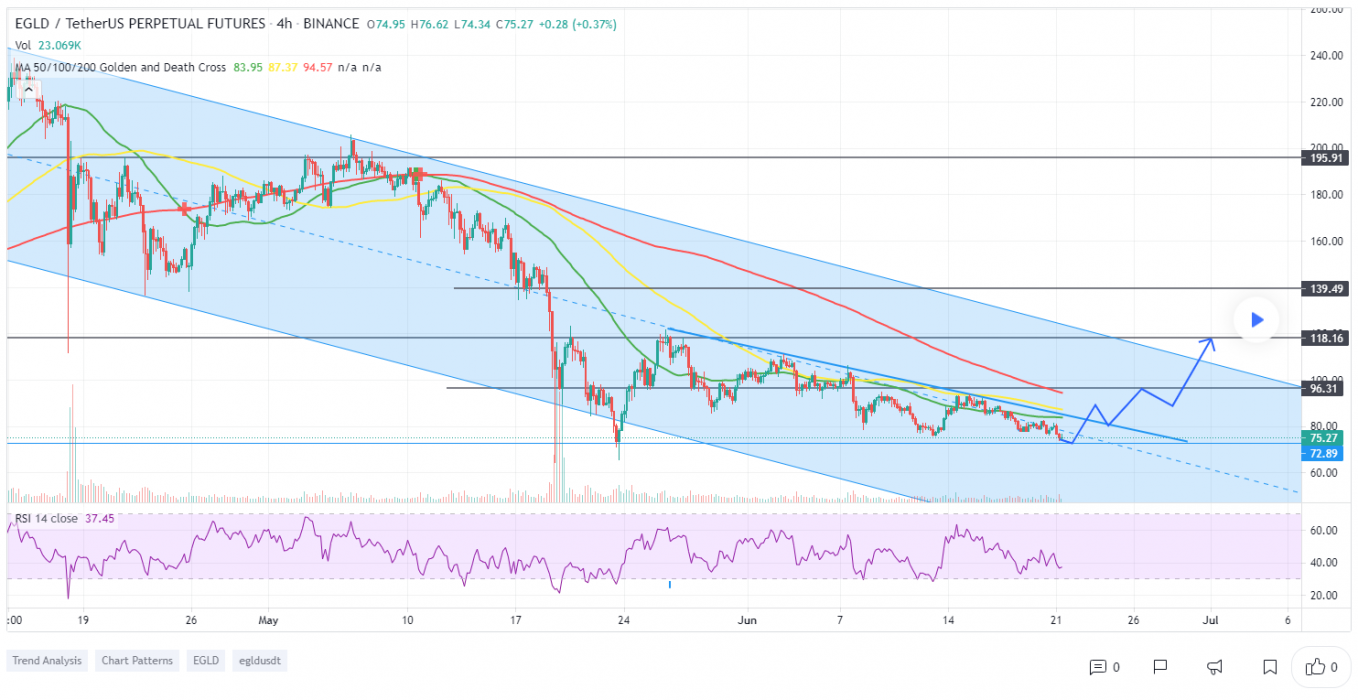
At the time of writing, EGLD is ranked the 63rd cryptocurrency globally and the current price is A$94. Let’s take a look at the chart below for price analysis:

Source: Tradingview

EGLD‘s stunning – nearly 4,000% – climb since Q4 2020 has since retraced 73%, finding some support near A$87.05.

Retracements toward the monthly open, possibly running stops near $141.15 and $147.60, are likely to be capped between $145.25 and $153.64. A break through this level may find another area of resistance near the gap and old swing lows near $161.62 – possibly spiking up to $177.82.

The price appears to be struggling to maintain support between $113.23 and $98.69, making the swing lows near $100.85, $87.05, and $76.99 likely shorter-term targets. 

A run on these lows could find another area of support near $73.95. If this area fails to hold, a drop to the lower end of the monthly gap around $39.54 may be on the cards, with $34.02 offering some hope of support.

2. Mina Protocol (MINA)

Mina Protocol is a minimal “succinct blockchain” built to curtail computational requirements in order to run DApps more efficiently. Mina has been described as the world’s lightest blockchain, since its size is designed to remain constant despite growth in usage. Furthermore, it remains balanced in terms of security and decentralisation. Mina is working on achieving an efficient distributed payment system that enables users to natively verify the platform right from the genesis block. Its technical whitepaper calls this a “succinct blockchain”.

Mina Price Analysis

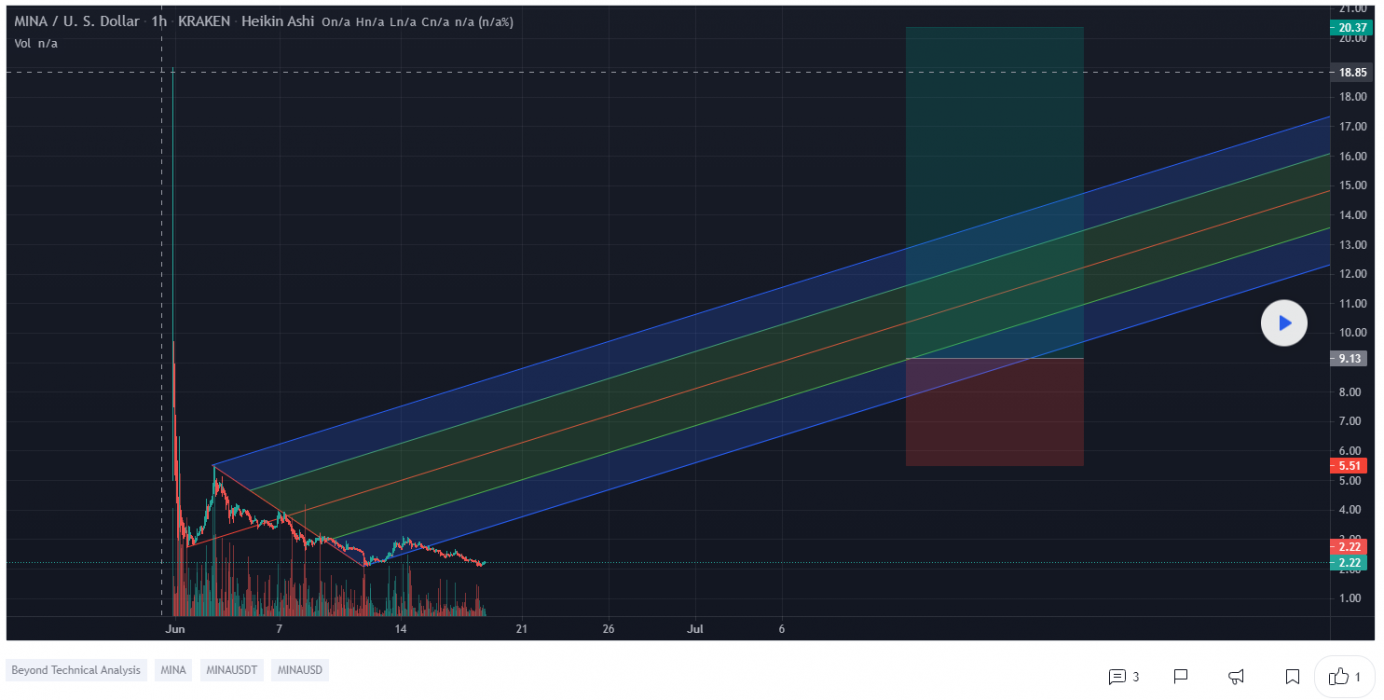
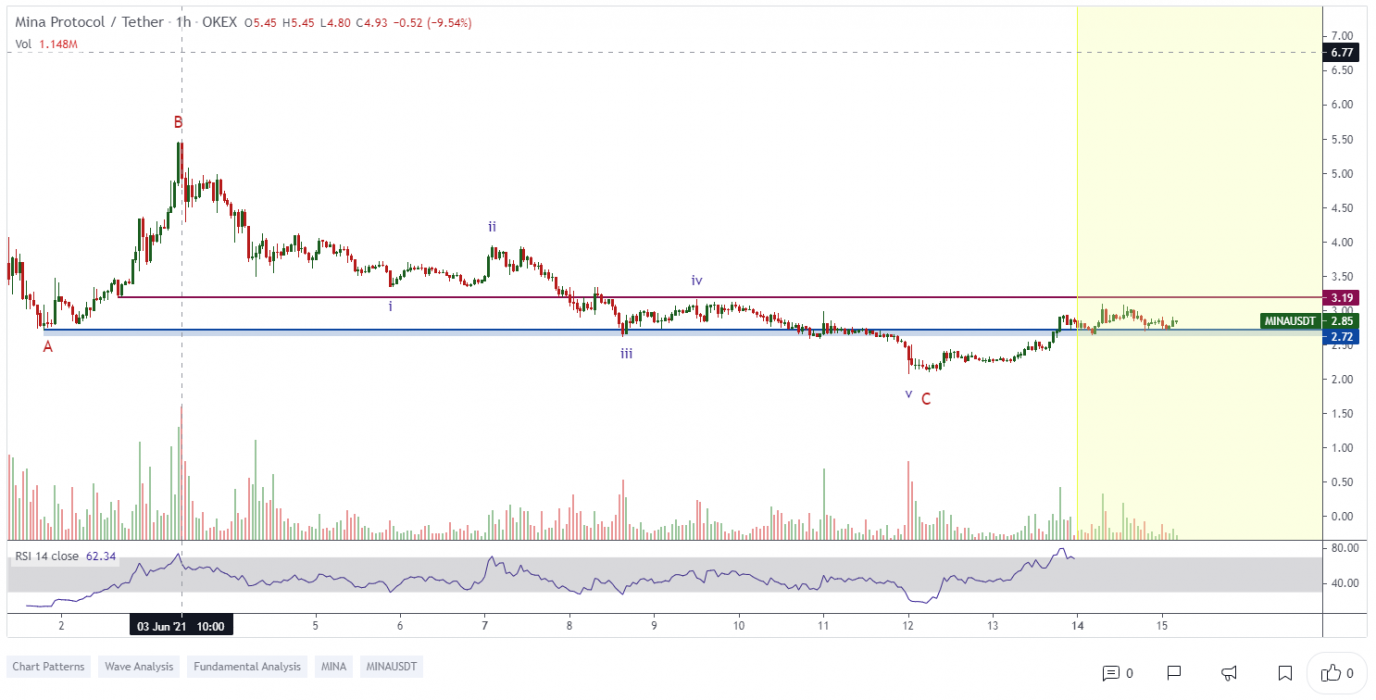
At the time of writing, MINA is ranked the 233rd cryptocurrency globally and the current price is A$2.08. Let’s take a look at the chart below for price analysis:

Source: Tradingview

MINA has continued its steady downtrend. Meanwhile, the chart offers bulls no strong support for long entries.

The recent low at A$2.39 is likely to be swept – a region that offers a glimmer of hope for support based on some methods of measuring moves. However, bulls are likely to wait for more signs of support and a market structure shift before entering long positions.

Resistance rests just overhead between $2.77 and $3.26. The gap at $3.04 offers a high probability target for any potential downtrend retracements. 

A more substantial bullish shift in the markets could help the price run the stops near $4.11 into resistance, beginning near $4.19. Any move upward is likely to find a cap near $5.51, although the current chart offers no hints that a movement this large should occur anytime soon.

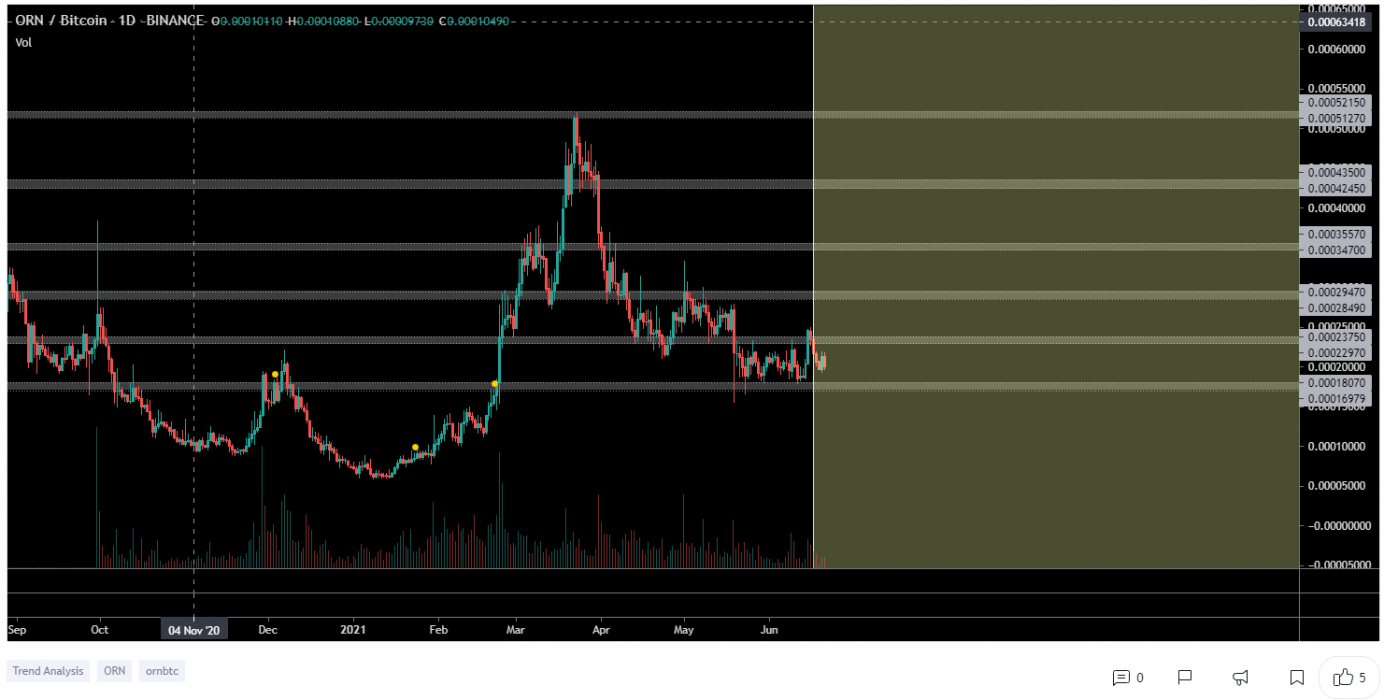
3. Orion Protocol (ORN)

Orion aims to solve the difficulties in performing profitable transactions associated with the lack of liquidity on the majority of crypto exchanges. This is the case for both centralised and decentralised exchanges. Orion’s solution to this is to aggregate exchanges’ order books into one simple-to-use-and-understand terminal.

The Orion Protocol’s goal is to help users get the best returns out of their investments while also lowering the risks associated with using multiple exchanges.

ORN Price Analysis

At the time of writing, ORN is ranked the 236th cryptocurrency globally and the current price is A$8.54. Let’s take a look at the chart below for price analysis:

Source: Tradingview

After an 83% retracement from its March highs, ORN found a temporary low near A$6.53. A recent move above $12.61 could be the first sign of a bullish shift – but could also signal a stop run before the next drop lower. 

If the market adopts a more bullish tone, the price could run through the most recent swing high. If this bounce occurs, it would likely find some resistance near $13.85, possibly reaching up to $16.51.

However, a move below the closest support near $6.558 makes stop runs on the swing lows near $7.63 and $6.53 likely. A confluence of several levels near $5.71 could provide a temporary bounce. Still, a sustained bearish market will likely target $5.18 and even $2.39.

Where to Buy or Trade Altcoins?

These three Altcoins have the high liquidity on Binance Exchange, so that could help with trading on USDT or BTC pairs. And if you’re looking at buying and HODLing cryptos, then Swyftx Exchange is an easy-to-use popular choice in Australia.

Categories
Binance Crypto News Market Analysis Swyftx Trading

Top 3 Coins To Watch This Week: MINA, MTS, XVS – Trading Analysis

Let’s take a closer look at this week’s altcoins showing breakout signals. We’ll dive into the trading charts and provide some analysis to help you.

1. Mina Protocol (MINA)

Mina Protocol is a minimal “succinct blockchain” built to curtail computational requirements in order to run DApps more efficiently. Mina has been described as the world’s lightest blockchain since its size is designed to remain constant despite growth in usage. Furthermore, it remains balanced in terms of security and decentralisation. Mina is working on achieving an efficient distributed payment system that enables users to natively verify the platform right from the genesis block. Its technical whitepaper calls this a “succinct blockchain”.

Mina Price Analysis

At the time of writing, MINA is ranked the 223rd cryptocurrency globally and the current price is A$3.68. Let’s take a look at the chart below for price analysis.

Source: TradingView

Since the beginning of June, MINA has been in a gentle downtrend. The future likely holds more stop runs and erratic volatility until the chart forms more substantial high-timeframe levels.

A retracement might uncover support near A$3.50, which is the daily high of the last swing low. The high of the wick beginning near $3.02 may also provide support. However, bulls will likely remain wary of the current downtrend, making the low at $2.71 the likely next bearish target.

Just above, the daily gap beginning near $4.10 may provide resistance to bulls, possibly marking a future range high. A push through this level is likely to target the swing high near $5.12 – perhaps running to probable resistance near $5.38. Strength above this level might signal the start of a bullish trend, encouraging bulls to “buy the dip”.

2. Metal (MTL)

Metal (MTL) is the native currency of Metal products and an essential part of the Metal ecosystem. Sending and receiving any crypto to friends on Metal Pay is, according to the team, instant, and feeless. Designed to make cryptocurrency payments fast and easy, users pay zero fees when sending, receiving, buying or selling MTL.

MTL Price Analysis

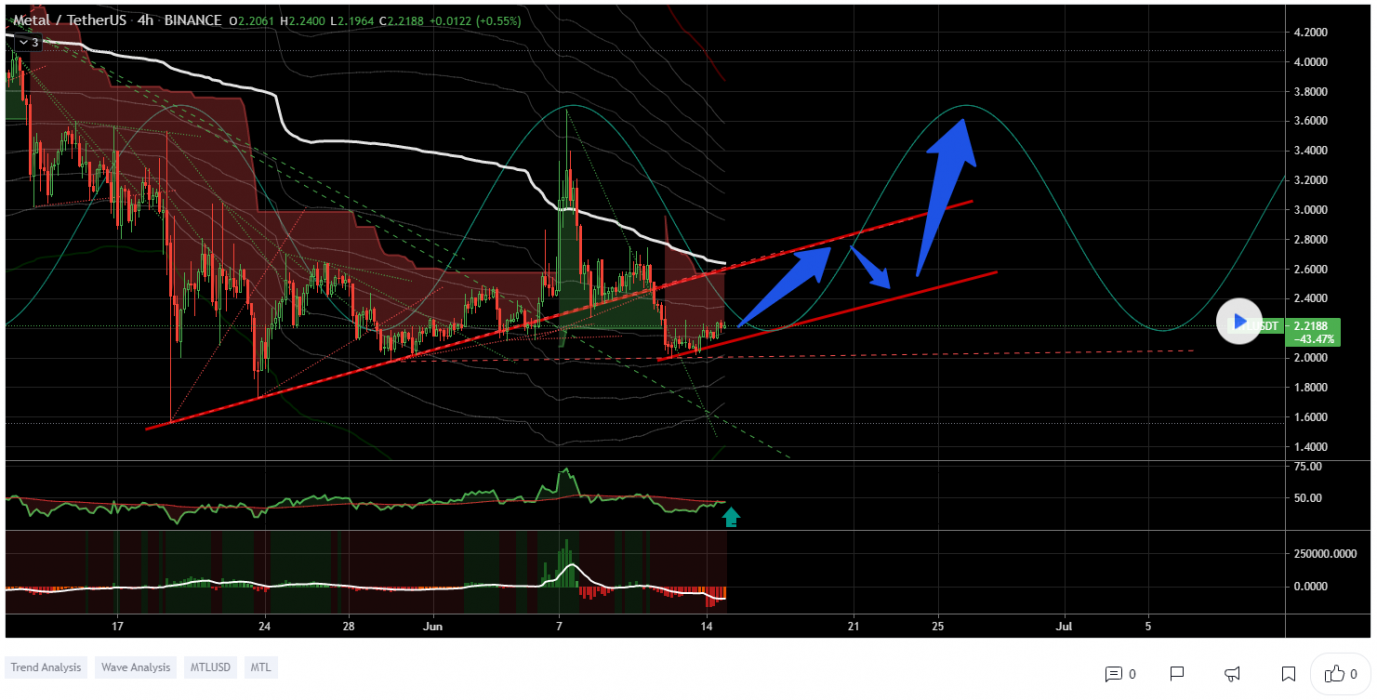
At the time of writing, MTL is ranked the 190th cryptocurrency globally and the current price is A$2.91. Let’s take a look at the chart below for price analysis.

Source: TradingView

March 29’s 450% bullish daily candle has since bled near 85%, with the MTL finding a low near $2.02 in mid-May.

Bulls are buying each drop into support near $2.74, with higher lows forming each time. However, the equal lows near $2.56 create an attractive target for a stop run. Still, bulls might buy this dip near possible support beginning at $2.44.

Just over the June monthly open, $3.18 marks the beginning of a probable resistance zone. A breakthrough in this area might target the equal highs near $3.57 before running into possible resistance near $3.75.

A sustained move upward – perhaps from a market-wide bullish shift – could reach the swing high near $4.77 before encountering probable resistance near $4.87.

3. Venus (XVS)

Venus is an algorithmic money market and synthetic stablecoin protocol launched exclusively on Binance Smart Chain (BSC). The protocol introduces simple-to-use crypto-asset lending and borrowing solution to the decentralised finance (DeFi) ecosystem, enabling users to directly borrow against collateral at high speed while losing less to transaction fees. In addition, Venus allows users to mint VAI stablecoins on-demand within seconds by posting at least 200% collateral to the Venus smart contract.

XVS Price Analysis

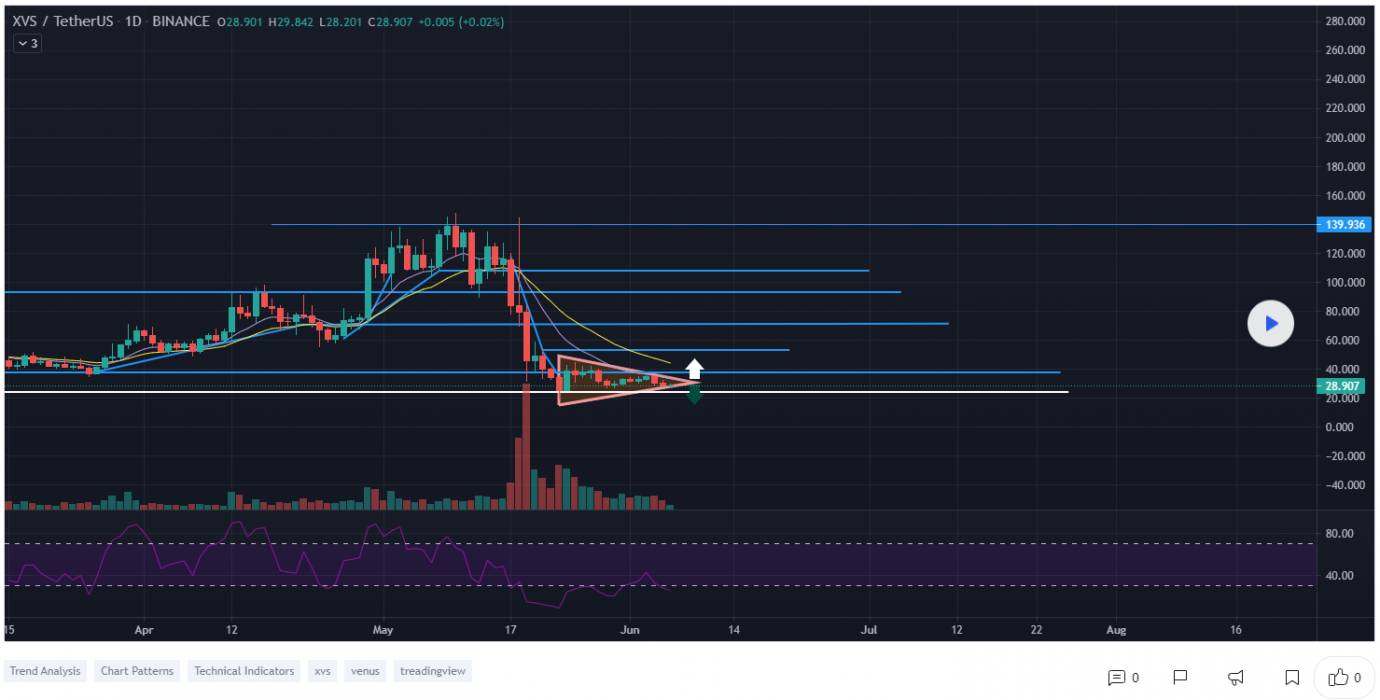
At the time of writing, XVS is ranked the 144th cryptocurrency globally and the current price is A$33.02. Let’s take a look at the chart below for price analysis.

Source: TradingView

During five days in May, XVS dumped over 86% before finding support near $25.67. Consolidation above this level has created a series of relatively equal lows, which are likely to be swept before any longer-term bullish trend begins. 

In the shorter term, the price might establish support near $32.72 before running the swing high at $37.28. If this bullish move occurs, the price could reach resistance near the June monthly open around $42.94 – and even sweep the swing high near $46.42.

Some support might exist at the daily gap near $20.11. A move this low would also fill the February monthly gap and set the stage for a possible bullish reversal.

If this level fails to hold, the price will likely explore the next monthly gap between $12.30 and $6.21. In this zone, the daily swing low at $8.66 makes a likely target.

Where to Buy or Trade Altcoins?

These three Altcoins have the high liquidity on Binance Exchange, so that could help for trading on USDT or BTC pairs. And if you’re looking at buying and HODLing cryptos, then Swyftx Exchange is an easy-to-use popular choice in Australia.
Categories
Binance Crypto News Ethereum Market Analysis Swyftx Trading

Top 3 Coins To Watch This Week: ETH, ELA, OGN – Trading Analysis

Let’s take a closer look at this week’s altcoins showing breakout signals. We’ll dive into the trading charts and provide some analysis to help you.

1. Ethereum (ETH)

Ethereum is a decentralized open-source blockchain system that features its own cryptocurrency, Ether. ETH works as a platform for numerous other cryptocurrencies, as well as for the execution of decentralized smart contracts.

Ethereum’s own purported goal is to become a global platform for decentralized applications, allowing users from all over the world to write and run software that is resistant to censorship, downtime, and fraud.

Ethereum Price Analysis

At the time of writing, ETH is ranked 2nd cryptocurrency globally and the current price is A$3571. Let’s take a look at the chart below for price analysis.

Source: TradingView

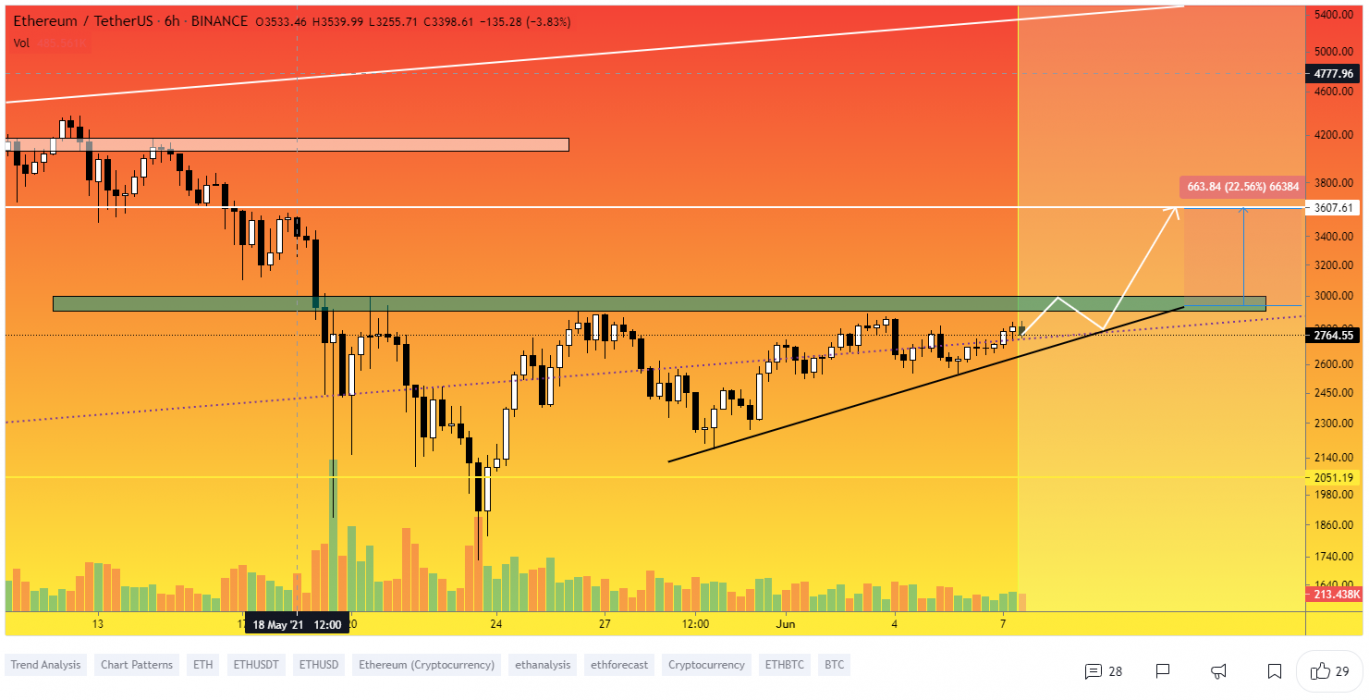
ETH‘s stunning rally to $5647 plummeted over 60 percent during May to sweep consolidation lows at $2576. This sweep of the lows could set the stage for a new bullish cycle to begin. 

The price is currently balancing around the June monthly open. A quick stop runs into support beginning near $2527 could set the stage for a move into the daily gap beginning near $3255 – potentially reaching resistance near $4624.

A sweep of the highs near $3752, followed by a sharp sell-off, could hint that bears are preparing to run the swing low near $2810 AUD. This drop could find support around $2479 in the candle wick that created the May low. If the market remains bearish, the price will likely sweep May’s low into possible support near $2192.

2. Elastos (ELA)

Elastos aims to be a blockchain-powered version of the internet. The project originates all the way back to the year 2000; however, the current version that is based on blockchain technology and has been in active development by Elastos was founded in June 2017.

The team behind the project genuinely believes that Ethereum, as well as DApp platforms, faces limitations in scaling. While they are great for smart contracts, they are slow, not flexible at all, and inconvenient for full applications, according to Elastos. Elastos is a platform for decentralized apps (DApps for short) that claims to solve many of these limitations.

ELA Price Analysis

At the time of writing, ELA is ranked the 366th cryptocurrency globally and the current price is A$5.44. Let’s take a look at the chart below for price analysis.

Source: TradingView

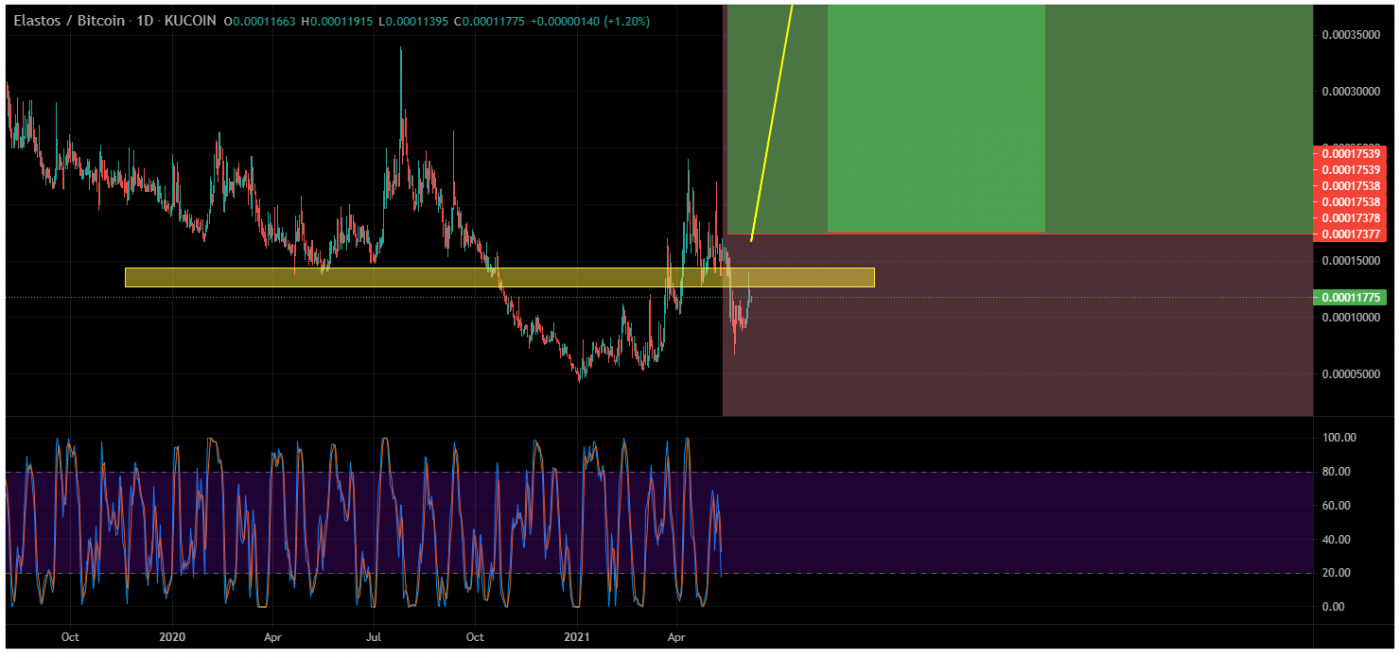
ELA formed relatively equal lows near A$3 after dropping over 81 percent during May. These lows could provide the target for another leg down, possibly finding support in the monthly gap of around $2.63. 

If this sweep of the $3.90 swing lows occurs, more aggressive bulls might begin bidding the weekly level near the swing low around $3.37. Should the market take a more bullish turn, the level just below near $5.08 could provide some short-term support.

The steep drop left large areas of inefficient price action, making the daily gap up to $7.60 likely to be touched or filled. A sustained move through this resistance could visit a significant area on the monthly and weekly chart near $9.55.

3. Origin Protocol (OGN)

Origin Protocol is a network that allows market participants to share goods and services through peer-to-peer (P2P) networks. The platform aims to create an extensive online marketplace leveraging the Ethereum (ETH) blockchain and Interplanetary File System (IPFS) in order to eliminate the need for middlemen.

The protocol allows for the creation of a decentralized setting where both buyers and sellers can connect, check for available listings, write reviews, and perform many other actions. With this, fractional usage of assets can be traded more easily.

OGN Price Analysis

At the time of writing, OGN is ranked the 139th cryptocurrency globally and the current price is A$1.19. Let’s take a look at the chart below for price analysis.

Source: TradingView

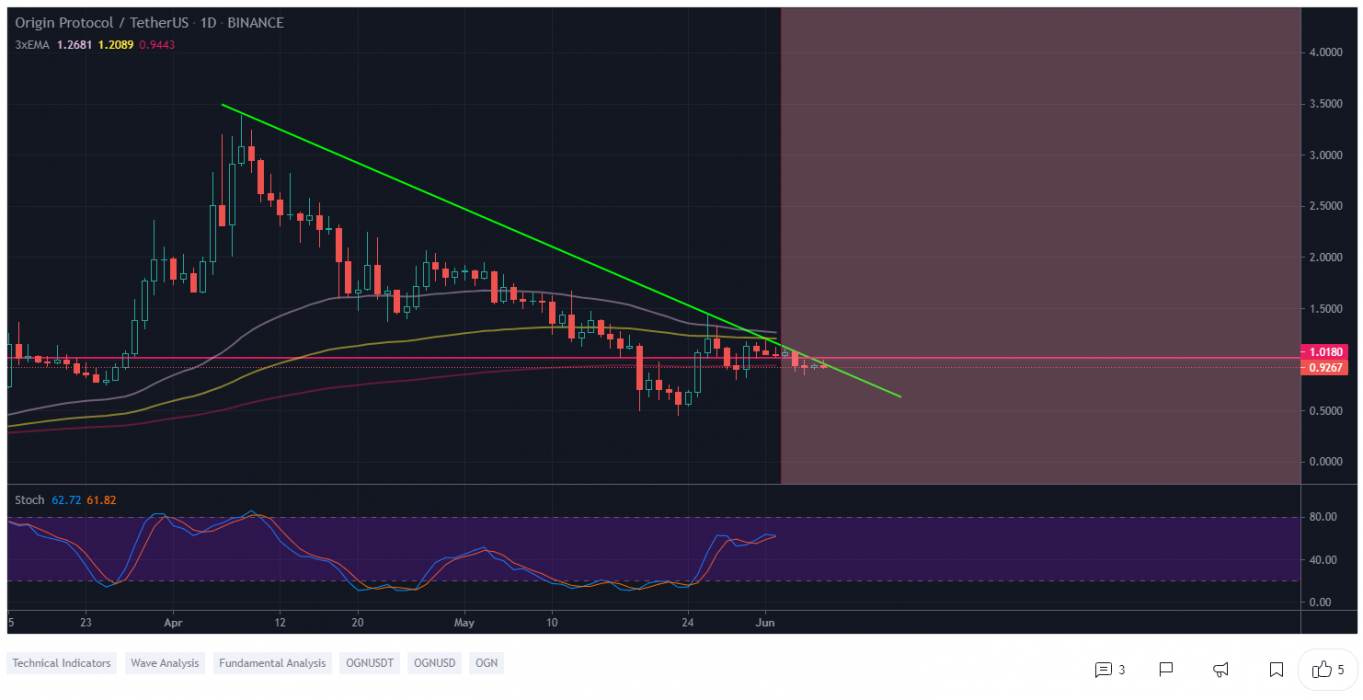
April started a gradual 87 percent decline in OGN‘s price. The move into February’s swing high saw a sharp jump in price, showing that some support exists near $0.59.

A sweep of the most recent swing lows into possible support beginning near $1.04 could lead to a rally over the June monthly open. This rally would likely sweep the swing high into the resistance near $1.55. 

This potential bullish move could continue through the relatively equal swing highs near $1.89 – but is likely to find some resistance in the weekly level around $2.

Continued bearishness in the crypto markets might push the price to fill the weekly gap down to $0.54. This drop would sweep the stops under May’s low and potentially mark a new accumulation zone for the next bullish cycle.

Where to Buy or Trade Altcoins?

These 3 Altcoins have the highest liquidity on , so that could help for trading on USDT or BTC pairs. Instead, if you’re looking at buying and HODLing cryptos, then  is a popular choice in Australia.
Categories
Binance Cardano Crypto News Market Analysis Swyftx Trading

Top 3 Coins To Watch This Week: ADA, CLO, VRA – Trading Analysis

Let’s take a closer look at this week’s altcoins showing breakout signals. We’ll dive into the trading charts and provide some analysis to help you.

1. Cardano (ADA)

Cardano is a proof-of-stake blockchain platform that says its goal is to allow “changemakers, innovators, and visionaries” to bring about positive global change. The open-source project also aims to “redistribute power from unaccountable structures to the margins to individuals” — helping to create a society that is more secure, transparent, and fair.

ADA Price Analysis

At the time of writing, ADA is ranked 4th cryptocurrency globally and the current price is $2.14 AUD. Let’s take a look at the chart below for price analysis.

Source: TradingView

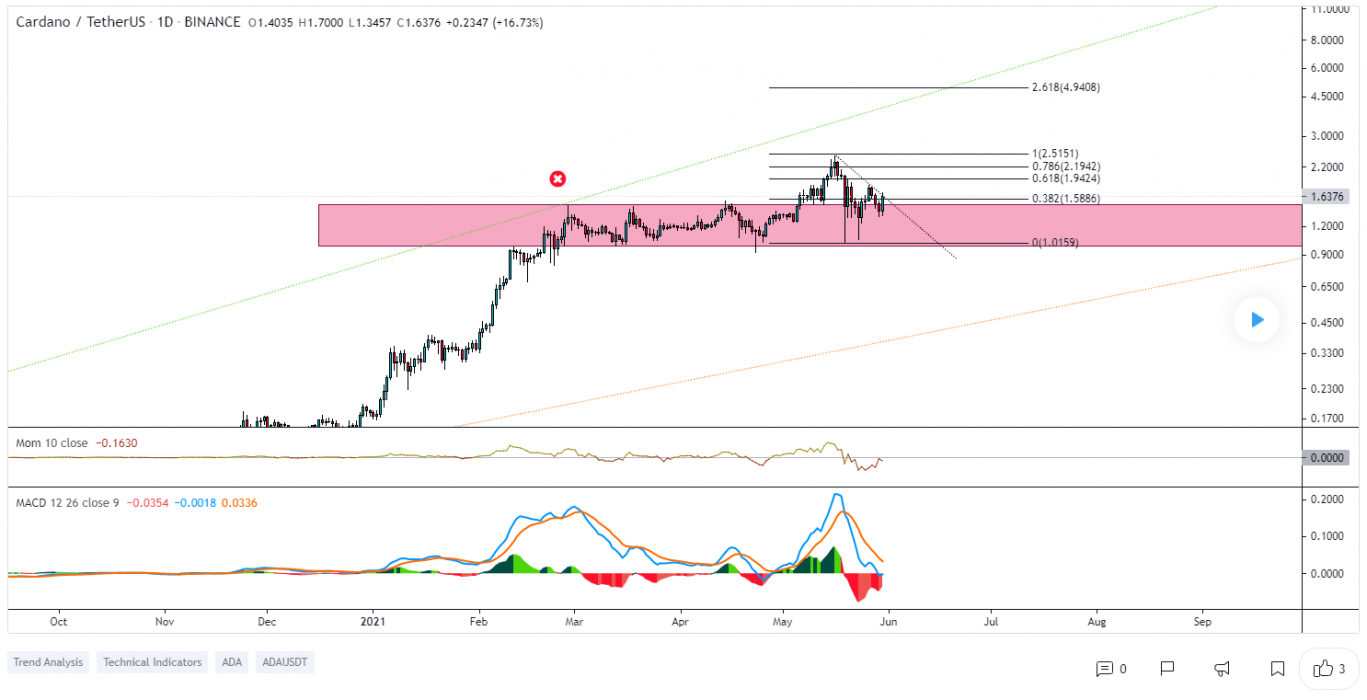
ADA‘s 97% climb during early May returned to the monthly open, sweeping lows several times down to $1.32 AUD.

Last week, the price bounced from the monthly open near $1.78 AUD again, creating possible support near $2.02 AUD. A quick sweep of this recent swing low could reach into a support area near $1.70 AUD, while a sharp downturn in the market is likely to run for the relatively equal lows near $1.40 AUD.

If the price breaks through the closest significant resistance near $2.30 AUD, the swing high at $2.45 AUD is a likely target. This move could reach a daily gap near $2.60 AUD.

Strong bullish momentum could propel the price to resistance near $2.81 AUD. If this move occurs, the significant swing high near $3.15 AUD provides a reasonable goal.

2. Callisto Network (CLO)

Callisto Enterprise, a branch company focusing on enterprise applications of blockchain technology. Several major public transport companies from central and eastern Europe have joined in this initiative.

Callisto has built a scalable blockchain ecosystem featuring a staking mechanism, a full DeFi protocol, and a stablecoin. Callisto Network is a self-sustaining and self-funded blockchain ecosystem, not financed by pre-mined coins or an ICO.

CLO Price Analysis

At the time of writing, CLO is ranked 513th cryptocurrency globally and the current price is $0.02086 AUD. Let’s take a look at the chart below for price analysis.

Source: TradingView

CLO spent the month of May ranging across the monthly open, reaching 26.5% over and 45% below.

The price is currently consolidating between adjacent resistance and support at $0.01675 AUD with no clear higher-timeframe trend. A strong move over the monthly open could signal a run to resistance beginning near $0.02275 AUD. 

This move would likely target the swing high at $0.02541 AUD and relatively equal highs near $0.02761 AUD. A sustained bullish trend could reach up to the April high near $0.03500 AUD.

Bulls might see a sweep of the relatively equal lows near $0.01142 AUD as a chance to buy at a discount. If this level fails to hold, the next significant area for the price to find buyers is likely near the consolidation around $0.00724 AUD that began March’s bullish trend.

3. Verasity (VRA)

Verasity is a Protocol and Product Layer Platform for Esports and Video Entertainment. Verasity’s mission is to significantly increase advertising revenues for video publishers on any video platform through its rewarded player and ad stack utilizing its patented protocol layer on the blockchain – Proof of View. PoV is the only Protocol Layer patented technology for the blockchain USA Patent.

VRA Price Analysis

At the time of writing, VRA is ranked 394th cryptocurrency globally and the current price is $0.02433 AUD. Let’s take a look at the chart below for price analysis.

Source: TradingView

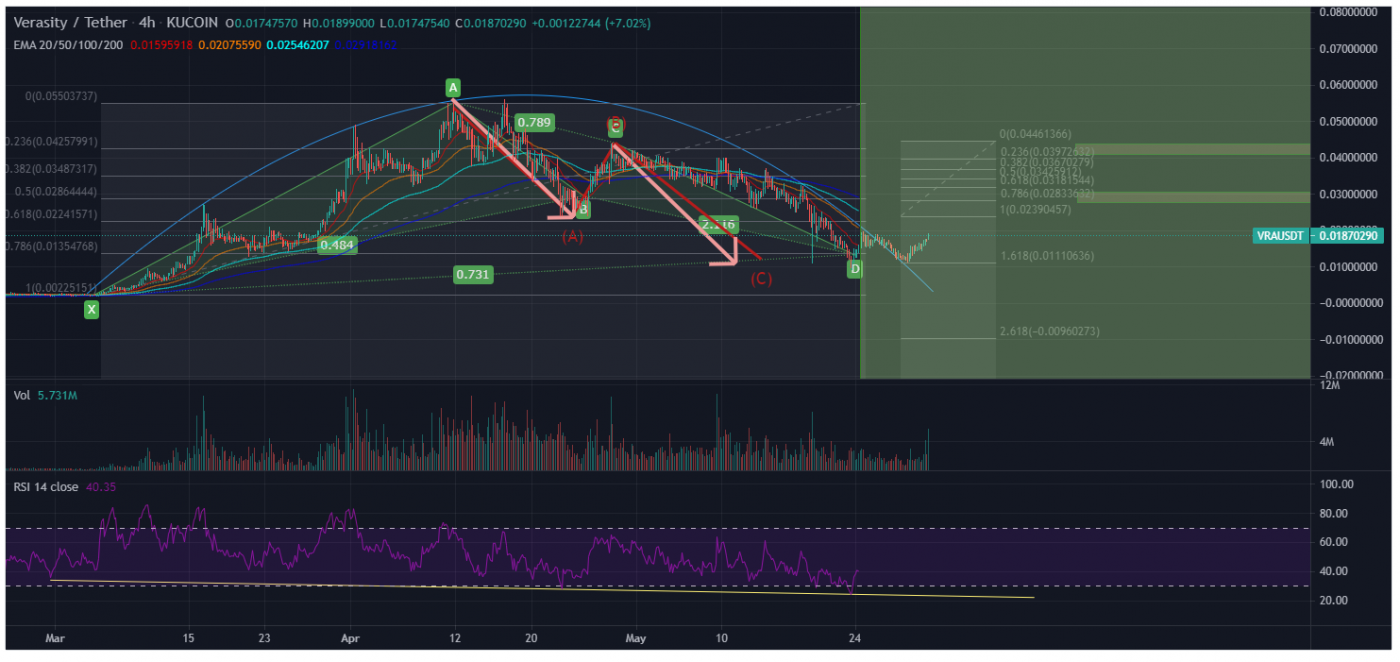
VRA‘s strong downtrend that began in mid-April has retraced most of its Q1 move, recently sweeping lows near $0.0168 AUD but struggling to find strong support.

A sweep of the relatively equal lows near $0.0128 AUD into possible support around $0.00122 AUD, combined with bullish market conditions, could be the catalyst that begins to form a bottom. If this level fails, bulls might buy the monthly gap’s low near $0.0098 AUD.

The swing low near $0.0326 AUD may form resistance to any sudden pumps as holders unload some of their position. A more substantial move might sweep relatively swing highs into probable resistance near $0.0438 AUD, potentially reaching up to the May monthly open near $0.0521 AUD.

Where to Buy or Trade Altcoins?

These 3 Altcoins have high liquidity on Binance Exchange so that could help with trading. Instead, if you’re looking at buying and HODLing cryptos, then Swyftx Exchange is a popular choice in Australia.

Categories
Binance Crypto News Market Analysis Swyftx Trading

Polygon (MATIC) Just Surged +118% in a day as Dotmoovs is scaling with Polygon

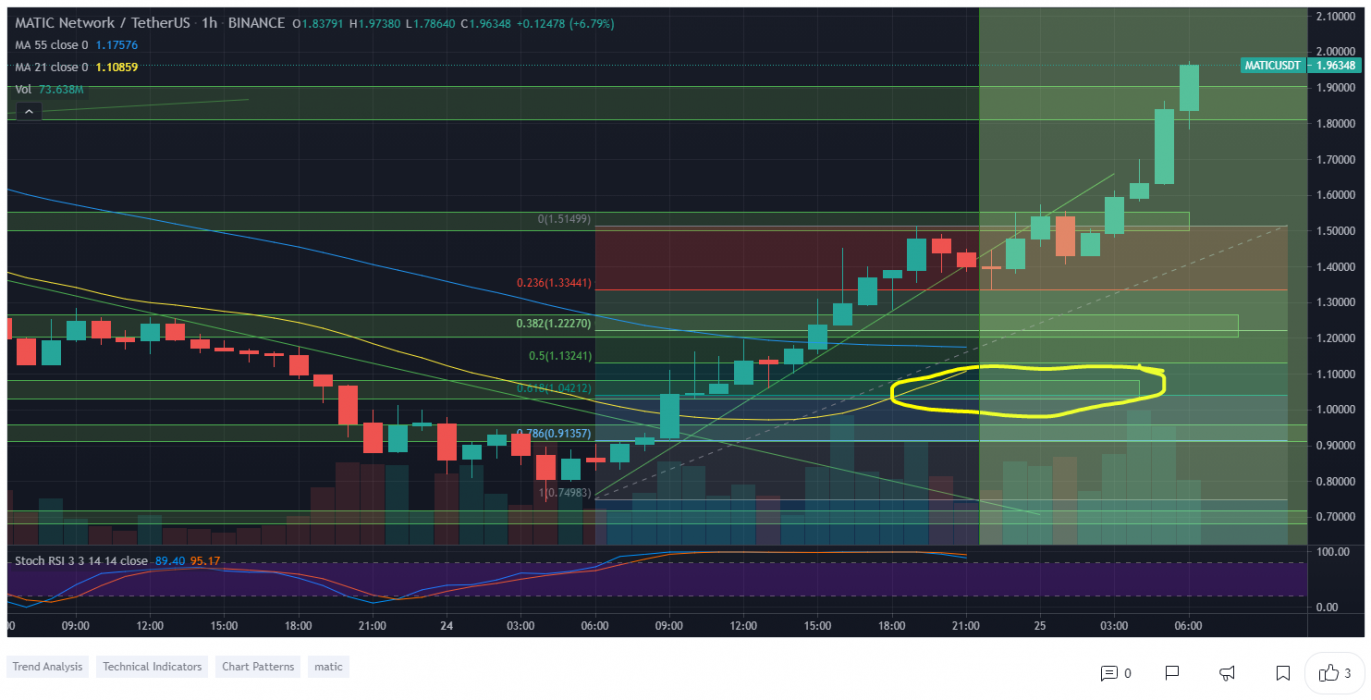
Polygon (MATIC) is trading in an uptrend, like many other altcoins. The cryptocurrency MATIC just went up +118% in a single day by breaking a falling wedge pattern with strong buying volume and surges over +145.23% in a week.

What is MATIC?

Polygon (previously Matic Network) is one of the first well-structured, easy-to-use platform for Ethereum scaling and infrastructure development. Its core component is Polygon SDK, a modular, flexible framework that supports building multiple types of applications.

Polygon effectively transforms Ethereum into a full-fledged multi-chain system (aka Internet of Blockchains). This multi-chain system is akin to other ones such as Polkadot, Cosmos, Avalanche, etc. with the advantages of Ethereum’s security, vibrant ecosystem, and openness.

MATIC Price Analysis

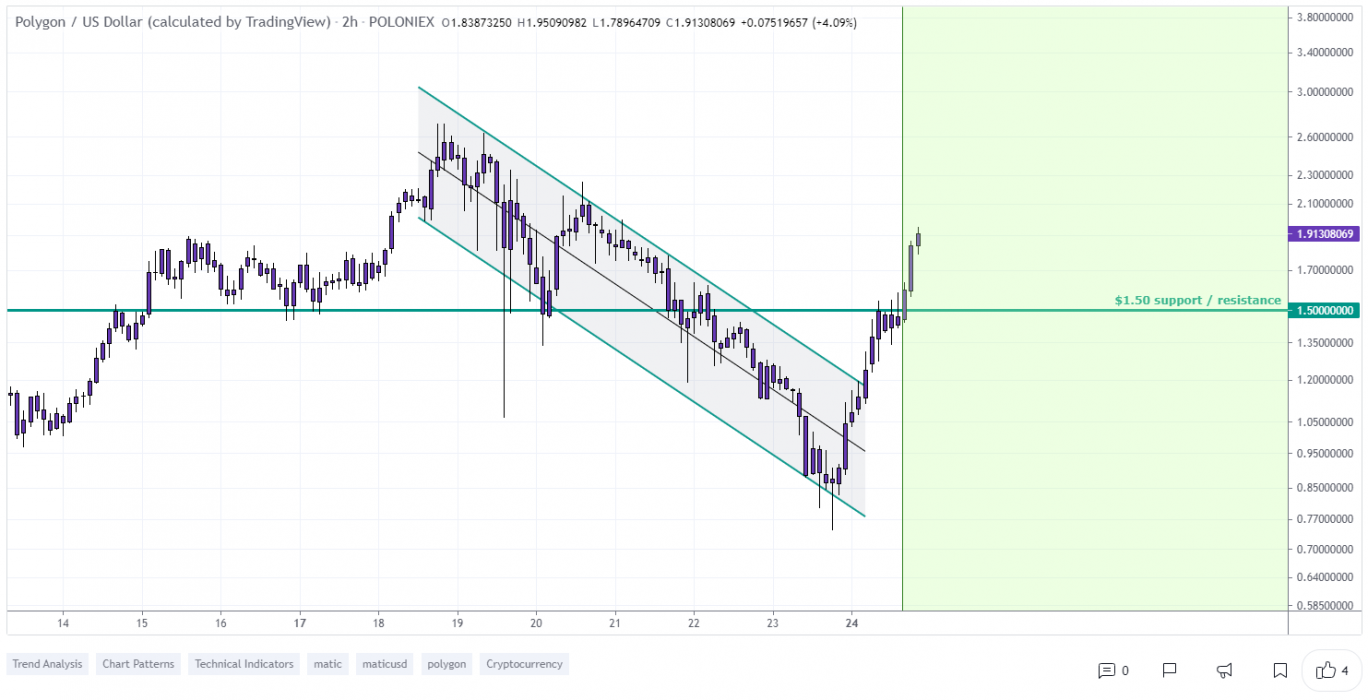
At the time of writing, MATIC is ranked 13th cryptocurrency globally and the current price is $2.41 AUD. This is a +145.23% increase since 18th May 2021 (7 days ago) as shown in the chart below.

Source: TradingView

After looking at the above 2-hour candle chart, we can clearly see that Matic was trading inside the falling wedge pattern on the MATIC/USDT pair. The first resistance was on the $1.90 AUD price levels which MATIC broke with a strong bullish trend buying volume and is now heading towards the all-time high price in AUD. Seeing that many altcoins are holding a strong position this week after the recent bitcoin crash recovery, MATIC might continue to increase in the uptrend if the traders keep buying with high volume.

“The Falling Wedge is a bullish pattern that begins wide at the top and contracts as prices move lower. This price action forms a cone that slopes down as the reaction highs and reaction lows converge.”

Source: TradingView

What Do The Technical Indicators Say?

TradingView indicators for MATIC

TradingView indicators (on the 1 day window) mainly suggest MATIC as a strong buy, except the Oscillators which indicate MATIC as a neutral.

So Why Did Matic Breakout?

General market sentiment seems to suggest cryptos are hopefully turning back bull run season after recent massive price corrections. Another reason for this sudden pump in price could be whales secretly buying MATIC for the next Altcoins rally. Recent news also announced exciting development involving Polygon.

Investors are taking a deep interest into Polygon. Its unique model, success in drawing users from larger blockchains, and high-and-growing market capitalization make it a safer bet for buyers. Growth seems very likely. But, at what rate the token will grow is a point of contention among analysts.

Where to Buy or Trade Matic?

MATIC has high liquidity on the Binance exchange which could help for trading MATIC/BTC or MATIC/USDT pairs. Instead, if you’re looking at buying and HODLing cryptos, then Swyftx Exchange is a popular choice in Australia.