Categories
Alpha Finance Lab Crypto News Groestlcoin Market Analysis

Top 3 Coins to Watch Today: ALPHA, GRS, REI – July 5 Trading Analysis

Let’s take a closer look at today’s altcoins showing breakout signals. We’ll explain what the coin is, then dive into the trading charts and provide some analysis to help you decide.

1. Alpha Finance (ALPHA)

Alpha Finance Lab ALPHA is a cross-chain DeFi platform that looks to bring Alpha to users across a variety of different blockchains, including Binance Smart Chain (BSC) and Ethereum. The platform aims to produce an ecosystem of DeFi products that address unmet needs in the industry while remaining simple to use and access. ALPHA is the native utility token of the platform. Token holders can earn a share of network fees by staking ALPHA tokens to cover any default loans. Other use cases for the token include liquidity mining and governance voting.

ALPHA Price Analysis

At the time of writing, ALPHA is ranked the 349th cryptocurrency globally and the current price is US$0.1157. Let’s take a look at the chart below for price analysis:
Source: TradingView

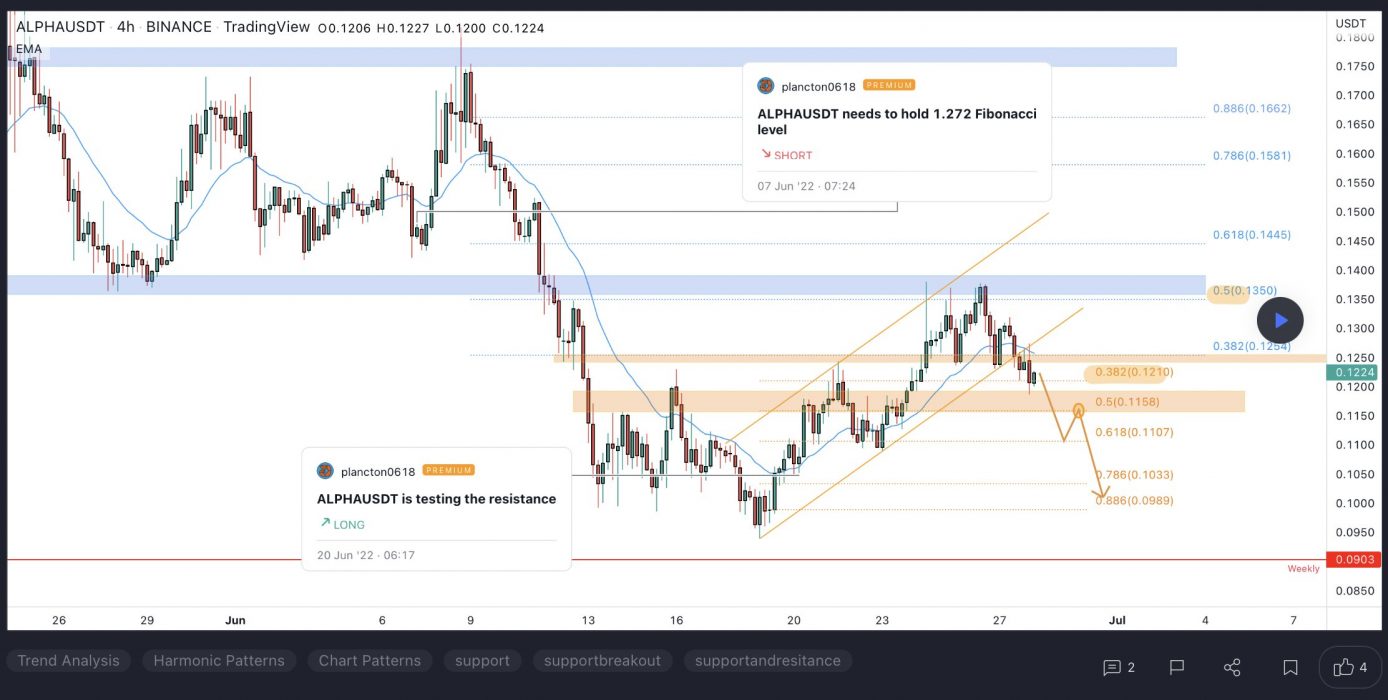
ALPHA dropped almost 87% from its April high by June 18, then saw a small rally. In the last week, the price has retraced before beginning consolidation near the 9 EMA.

The high of June 18’s swing low candle has given support near $0.1095. This level, just under the July monthly open, could continue to provide support.

The closest resistance is likely above June 26’s swing high, near $0.1232. This area showed inefficient trading before late June’s revisit.

A rally to this level could reach higher, to $0.1380. Relative equal highs provide an attractive target to bulls aiming for bears’ stops. This area also contains the 40 EMA, shows inefficient trading on the daily and weekly charts, and aligns with May’s consolidation lows.

A more sustained rally might reach higher to $0.1816. This is a significant swing high that started early June’s breakdown. The price is less likely to reach this high while market conditions remain bearish.

Since the larger market is bearish, traders should expect lower prices in the longer term. The weekly chart shows inefficient trading from $0.0960 to $0.0556. This general area may provide support for a longer-term bottom.

Inside this region, $0.0822 to $0.0800 shows inefficient trading on the daily chart. This level may be a sensitive bearish target, even if it doesn’t form a long-term bottom.

2. Groestlcoin (GRS)

Groestlcoin GRS is mined using the Groestl algorithm. Groestl was chosen as one of the five finalists of the NIST hash function competition. It uses the same S-box as AES in a custom construction. The cryptocurrency operates as open source software on a peer-to-peer model (transactions take place directly between the payer and payee). This means that no trusted intermediary, such a bank or PayPal, is required to verify the details of the sender and receiver. Rather, the transactions are verified by nodes (the network of computers/users spread globally) and recorded in an open ledger.

GRS Price Analysis

At the time of writing, GRS is ranked the 502nd cryptocurrency globally and the current price is US$0.3456. Let’s take a look at the chart below for price analysis:
Source: TradingView

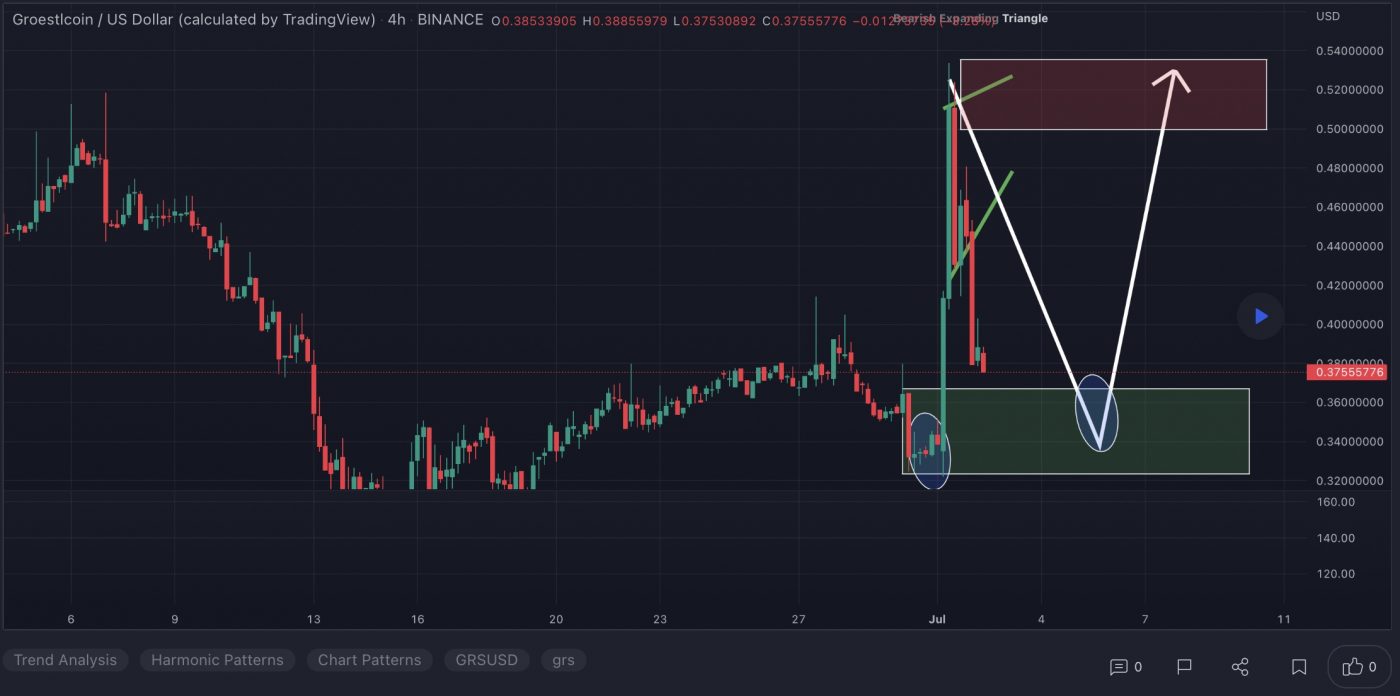
GRS fell 66% from its April high before forming a range of fast, wild price moves.

An area near $0.3220 has provided support during three retests and could provide support again. Bulls may want to be cautious since many retests of a level increase the chance it will break. 

Still, this level marks the swing low that began July 1’s massive rally. A bounce could happen after the price takes bulls’ stops under this low.

A drop lower could tag a level near $0.2698. This level overlaps with swing highs at the top of the 2020-2021 bull run’s consolidation range.

Below, $0.2267 is also within striking range and could provide some support. This area, deeper in the old consolidation range, is the last point of significant accumulation before December 2020’s explosive rally.

Above, $0.4452 has provided resistance and could provide resistance again. Bears rejected bulls at this level on July 1, which overlaps with the June monthly open.

If the price breaks through this level, $0.5456 might be the next resistance. Moving to this level would run bears’ stops above relative equal swing highs. 

This level also shows inefficient trading on the monthly chart. It’s also near the final consolidation’s low before May 5’s sudden price collapse. Still, the market has shown no signs that a significant bullish reversal will come soon.

3. REI Network (REI)

REI Network was developed to better adapt to the development trend of the blockchain, and to achieve a lightweight, Ethereum-compatible, higher-performance, and no-fee blockchain framework. It is a new EVM-compatible public chain compared to GXChain 2.0, is development-friendly, lightweight and free, and thus can fully support the development of various types of on-chain dApps such as DeFi, GameFi, and Metaverse.

REI Price Analysis

At the time of writing, REI is ranked the 445th cryptocurrency globally and the current price is US$0.03521. Let’s take a look at the chart below for price analysis:
Source: TradingView

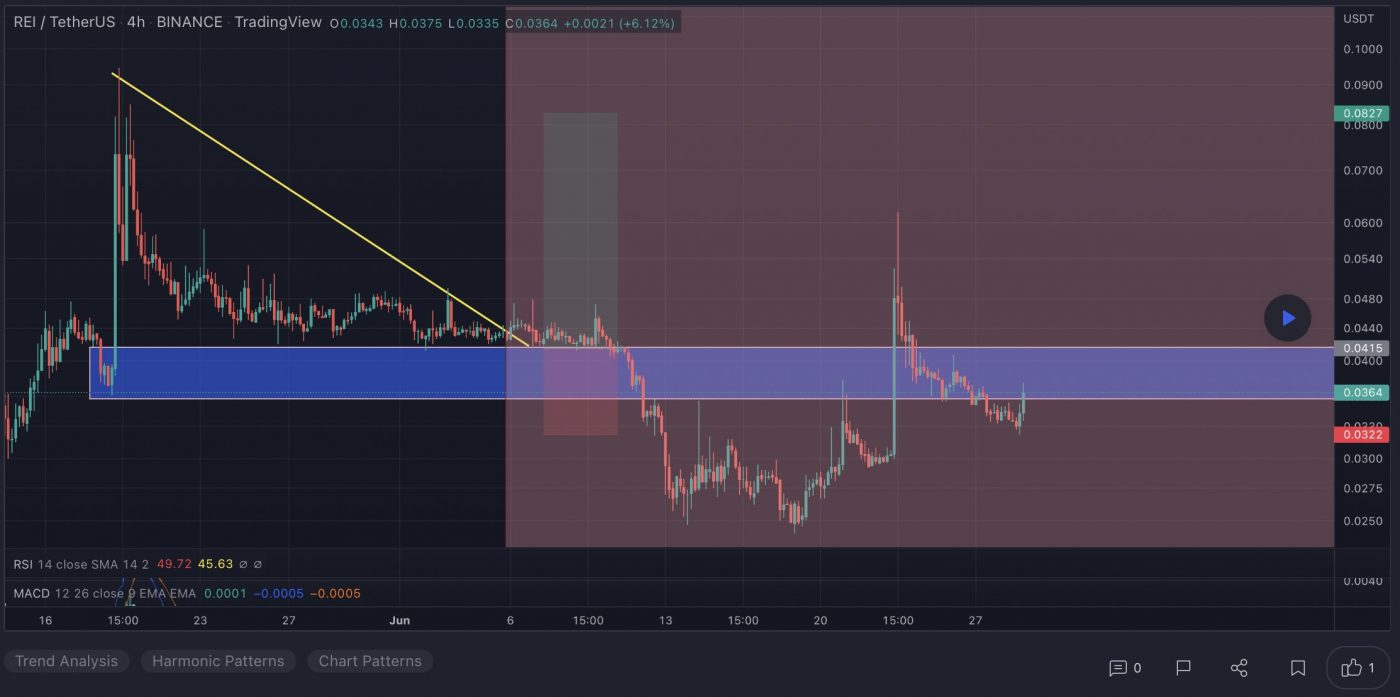
REI had a sharp 89% drop over nine days, beginning on May 4. So far, the price has respected this drop’s low.

Under the July open, $0.03171 provided support during a retest on June 30 and could provide support again. 

This level is near the high of mid-June’s consolidation range, and a significant swing low’s candle body formed on May 12. Anticipation for next week’s hard fork could help the price hold this level as support.

The recent swing high suggests resistance near $0.03825. The 40 EMA is entering this level, and daily candle bodies show that bulls rejected bears in this area on June 23.

If the bulls break through this level, the next significant resistance may be near $0.04784. This level provided resistance during late May and early June’s trading. It’s also near the midpoint of bearish rejections on May 19 and June 23.

A much more significant rally could reach as high as $0.10218 – unlikely, unless the overall market turns more bullish. This area shows inefficient trading on higher-timeframe charts. It is near April’s consolidation lows that preceded the last significant breakdown.

The charts show very little below the current price to suggest possible support. A swing low near $0.02000, where May’s drop ended, could provide support again. 

Below this swing low, no historical price action indicates support. The current range’s 25% extensions could hint at $0.00750 to $0.00500 as an area of possible interest to bulls.

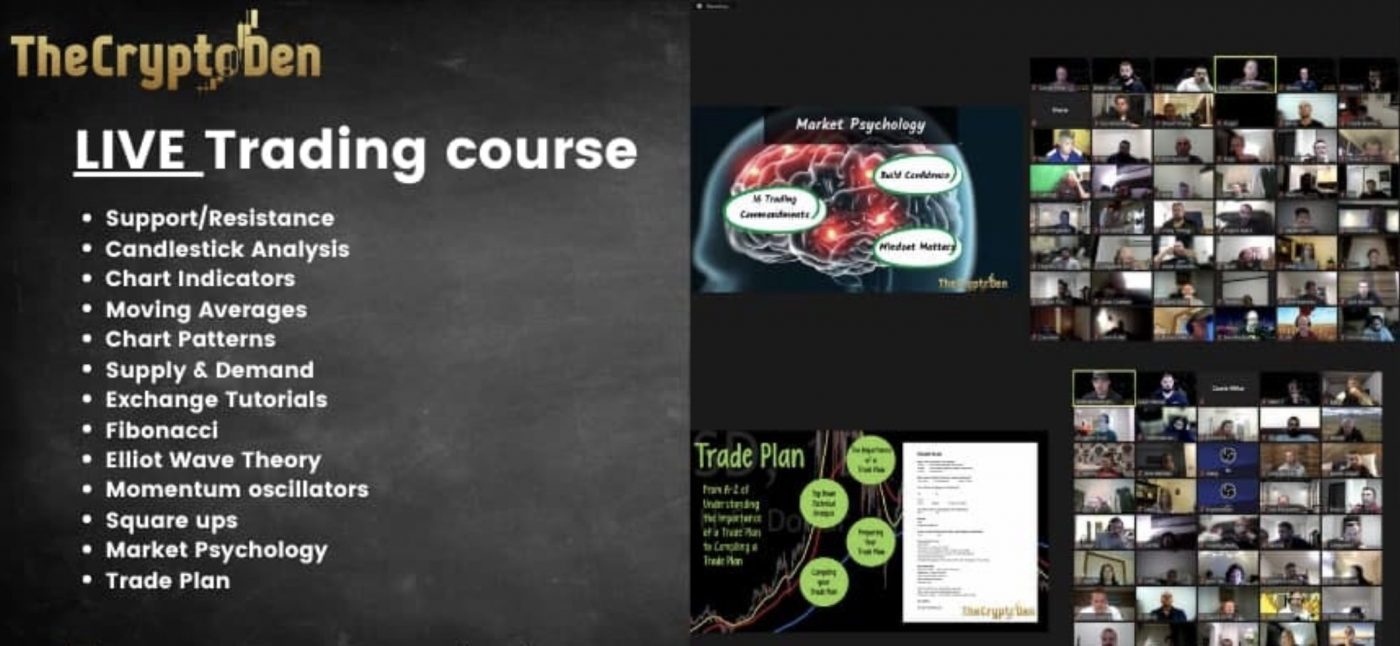
Learn How to Trade Live!

Join Dave and The Crypto Den Crew and they’ll show you live on a webinar how to take your crypto trading to the next level.
Where to Buy or Trade Altcoins?

These coins have high liquidity on Binance Exchange, so that could help with trading on AUD/USDT/BTC pairs. And if you’re looking at buying and HODLing cryptos, then Swyftx Exchange is an easy-to-use popular choice in Australia.

Categories
Alpha Finance Lab Balancer Crypto News Gala Market Analysis Trading

Top 3 Coins to Watch Today: GALA, BAL, ALPHA – June 8 Trading Analysis

Let’s take a closer look at today’s altcoins showing breakout signals. We’ll explain what the coin is, then dive into the trading charts and provide some analysis to help you decide.

1. Gala (GALA)

GALA aims to take the gaming industry in a different direction by giving players back control over their games. Gala Games’ mission is to make “blockchain games you’ll actually want to play”. The project wants to change how players can spend hundreds of dollars on in-game assets and countless hours playing the game, all of which could be taken away from them with the click of a button. It plans to reintroduce creative thinking by giving players control of the games and in-game assets with the help of blockchain technology.

GALA Price Analysis

At the time of writing, GALA is ranked the 78th cryptocurrency globally and the current price is US$0.08352. Let’s take a look at the chart below for price analysis:

Source: TradingView

After setting a low last week, GALA turned into a recovery trend to make the new monthly highs.

The following 78% plummet found support near $0.06439, sweeping under the 40 EMA into the 60.8% retracement level before bouncing to resistance beginning at $0.07920.

This area could continue to provide resistance, possibly causing a retracement to the 9 EMA and 18 EMA near $0.08612, where aggressive bulls might begin bidding. The level near $0.09154, which has confluence with the 40 EMA, may see more interest from bulls loading up for an attempt on probable resistance beginning near $0.09985. 

However, if Bitcoin continues its sideways trend, much lower prices could be seen. The old support near $0.06380 could provide at least a short-term bounce. If this level fails, the old highs near $0.05835 might also give support and see the start of a new bullish cycle after retesting these support levels.

2. Balancer (BAL)

Balancer BAL is an automated market maker (AMM) that was developed on the Ethereum blockchain and launched in March 2020. It was able to raise a $3 million seed round by Placeholder and Accomplice. Balancer protocol functions as a self-balancing weighted portfolio, price sensor, and liquidity provider. It allows users to earn profits through its recently introduced token, BAL, by contributing to customisable liquidity pools.

BAL Price Analysis

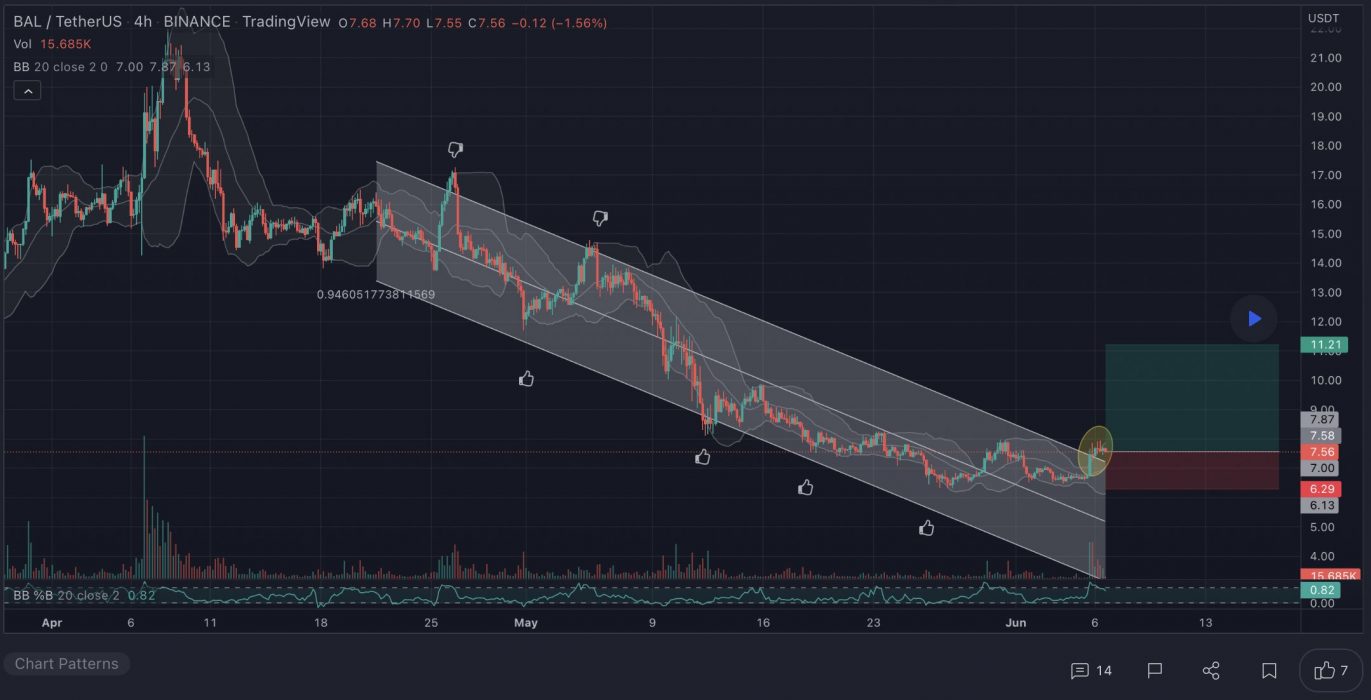
At the time of writing, BAL is ranked the 414th cryptocurrency globally and the current price is US$7.11. Let’s take a look at the chart below for price analysis:

Source: TradingView

Since the beginning of Q2, BAL has retraced 70% – a relatively high amount compared to many other altcoins. However, it continues to creep to monthly lows, suggesting that the consolidation period may be near its end.

Aggressive bulls could look for entries in new possible support between $6.90 and $6.78. A dip below this area might also find support near $6.70. However, a daily close near $7.25 brings bullish strength into question. 

A sudden drop in the market is likely to test possible support beginning near $7.00. This retracement would create extensions suggesting $6.55-$6.13 as a potential target for bulls. 

Currently, extensions indicate a reasonable take-profit zone near $7.36 to $7.63, with $7.95 having the most confluence. If bulls can maintain strength, confluent extensions point to $8.32-$9.00 as a reasonable next target.

3. Alpha Finance (ALPHA)

Alpha Finance Lab ALPHA is a cross-chain DeFi platform that looks to bring Alpha to users across a variety of different blockchains, including Binance Smart Chain (BSC) and Ethereum. The platform aims to produce an ecosystem of DeFi products that address unmet needs in the industry while remaining simple to use and access. ALPHA is the native utility token of the platform. Token holders can earn a share of network fees by staking ALPHA tokens to cover any default loans. Other use cases for the token include liquidity mining and governance voting.

ALPHA Price Analysis

At the time of writing, ALPHA is ranked the 346th cryptocurrency globally and the current price is US$0.1522. Let’s take a look at the chart below for price analysis:

Source: TradingView

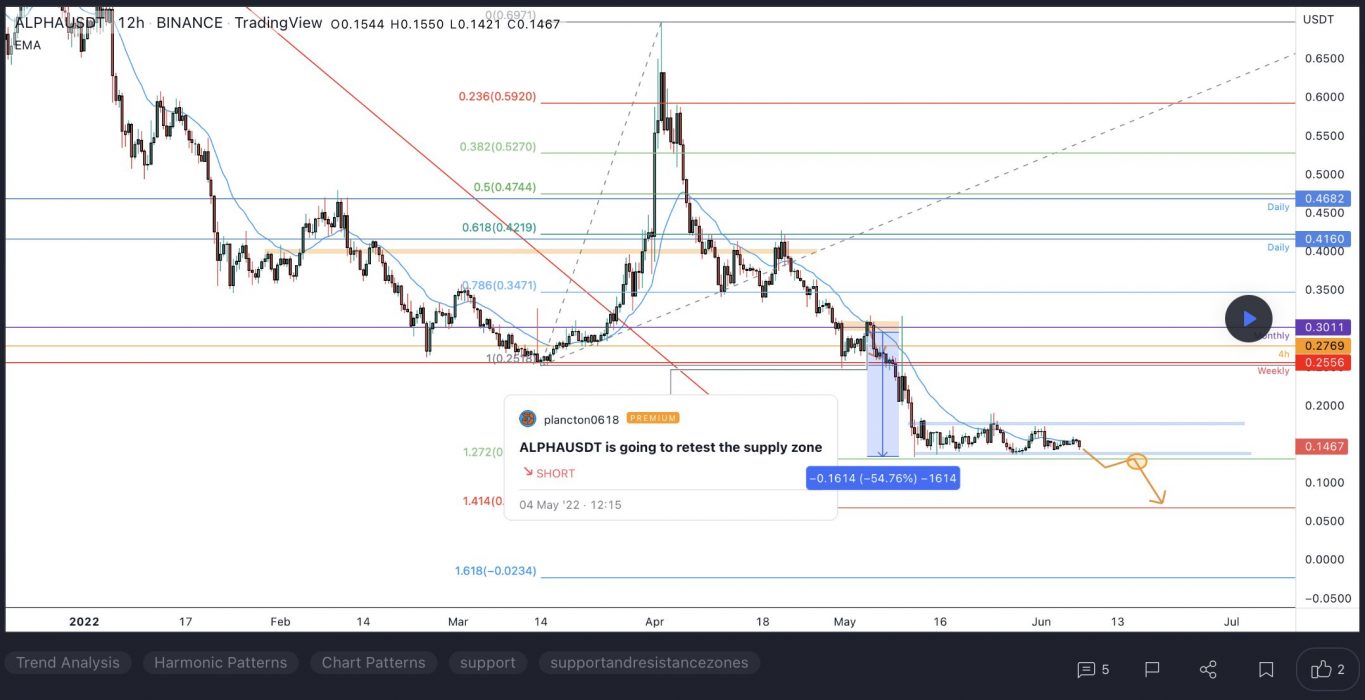
ALPHA‘s 65% rally from its Q1 lows met resistance near $0.5995, before creating a new range for Q2.

After a bearish flip of the 9, 18 and 40 EMAs, the price broke below $0.2110. This area, which has confluence with multiple swing lows and the May monthly open, may provide resistance on any future retest.

The price might find support near $0.1475 to $0.1408 if the overall market’s conditions turn more bullish. This zone has confluence with the 61.8% to 78.6% retracements and accumulation zone for Q1’s rally.

Suppose the price does rally through the probable resistance near the monthly open. In this case, the Q2 swing highs and above, near $0.2561, could provide resistance again. A shift back to more bullish market conditions could push the price to the 50% extension of the summer’s swing, near $0.2834.

Learn How to Trade Live!

Join Dave and The Crypto Den Crew and they’ll show you live on a webinar how to take your crypto trading to the next level.

Where to Buy or Trade Altcoins?

These coins have high liquidity on Binance Exchange, so that could help with trading on AUD/USDT/BTC pairs. And if you’re looking at buying and HODLing cryptos, then Swyftx Exchange is an easy-to-use popular choice in Australia.

Categories
Algorand Alpha Finance Lab Crypto News Litecoin Market Analysis Trading

Top 3 Coins to Watch Today: LTC, ALGO, ALPHA – May 5 Trading Analysis

Let’s take a closer look at today’s altcoins showing breakout signals. We’ll explain what the coin is, then dive into the trading charts and provide some analysis to help you decide.

1. Litecoin (LTC)

Litecoin LTC is a cryptocurrency designed to provide fast, secure and low-cost payments by leveraging the unique properties of blockchain technology. The cryptocurrency was created based on the Bitcoin protocol, but it differs in terms of the hashing algorithm used, hard cap, block transaction times, and a few other factors. Litecoin has a block time of just 2.5 minutes and extremely low transaction fees, making it suitable for micro-transactions and point-of-sale payments.

LTC Price Analysis

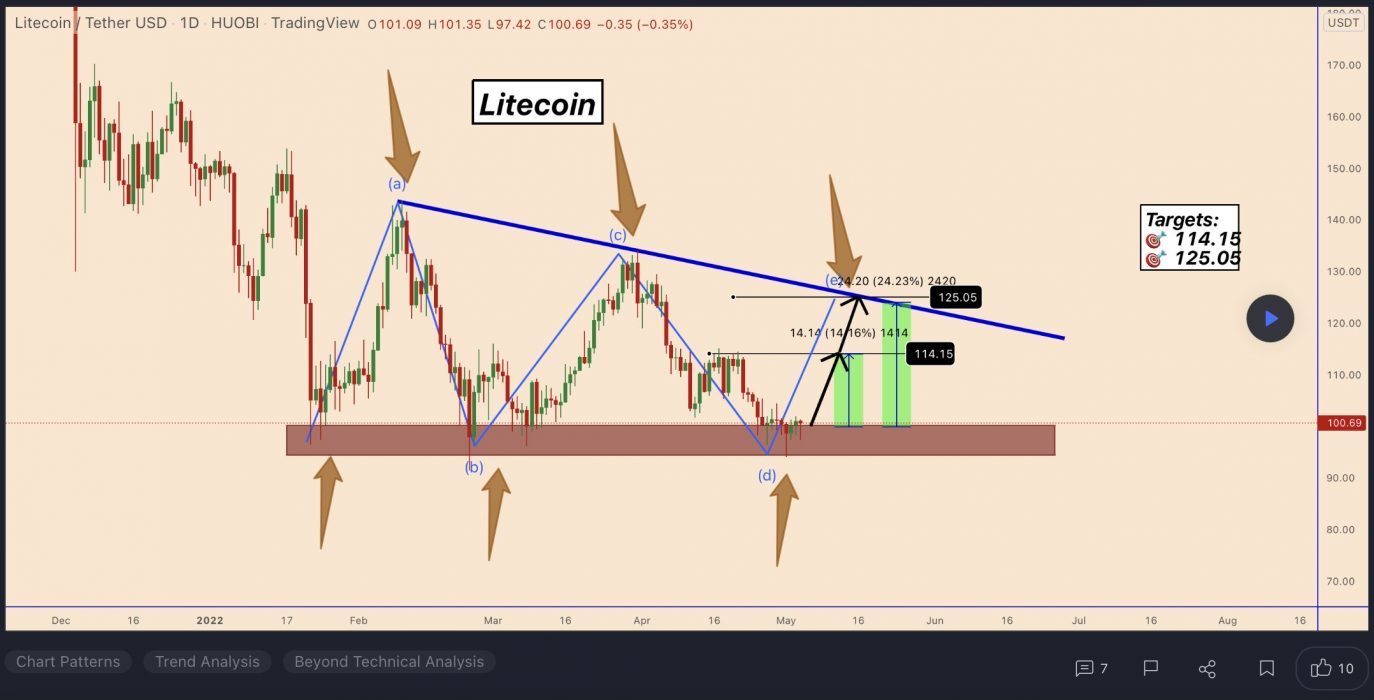
At the time of writing, LTC is ranked the 22nd cryptocurrency globally and the current price is US$102.67. Let’s take a look at the chart below for price analysis:

Source: TradingView

After setting a low last month, LTC kicked off a recovery trend that gained nearly 23% to break the weekly highs.

The following 55% plummet found support near $96.36, sweeping under the 40 EMA into the 61.8% retracement level before bouncing to resistance beginning at $110.53.

This area could continue to provide resistance, possibly causing a retracement to the 9 EMA and 18 EMA near $120.12, where aggressive bulls might begin bidding. The level near $133.98, which has confluence with the 40 EMA, may see more interest from bulls loading up for an attempt on probable resistance beginning near $149.13. 

However, if Bitcoin continues its sideways trend, much lower prices could be seen. The old support near $96.18 could provide at least a short-term bounce. If this level fails, the old monthly lows near $89.23 might also give support and see the start of a new bullish cycle after retesting these support levels.

2. Algorand (ALGO)

The Algorand ALGO blockchain is a permissionless, pure proof-of-stake blockchain protocol. Unlike Proof-of-Work (PoW) blockchains, where the root block must be validated by randomly selected validators (using computing power), in the pure proof-of-stake approach all of the validators are known to one another and only have to agree on the next block in order to create a new block. Algorand was invented to speed up transactions and improve efficiency in response to the slow transaction times of Bitcoin and other blockchains.

ALGO Price Analysis

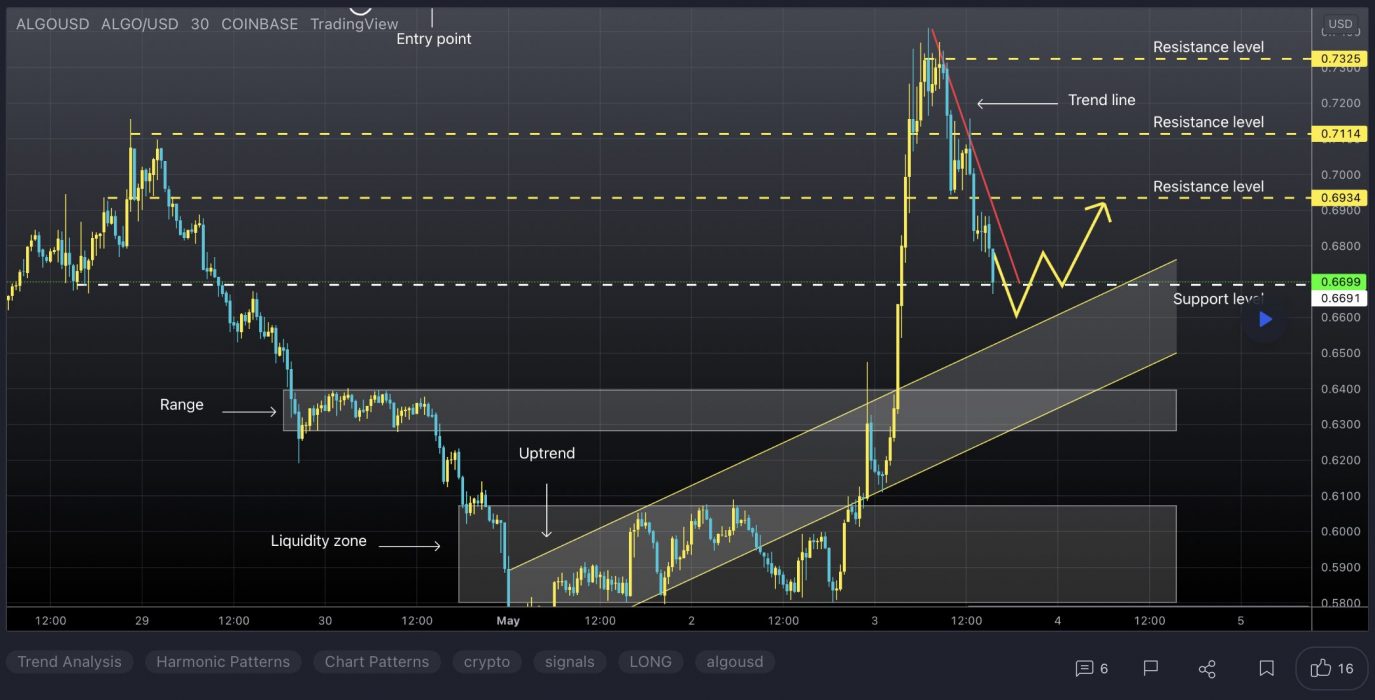
At the time of writing, ALGO is ranked the 30th cryptocurrency globally and the current price is US$0.6615. Let’s take a look at the chart below for price analysis:

Source: TradingView

After creating a second equal low during last month, ALGO gained nearly 20% into resistance that starts near $0.7522.

Swing traders looking for a continuation to the nearest cluster of relatively equal highs around $0.8412 might look for bids near $0.9036. More significant resistance rests above, near $0.9815. A group of significant swing highs at $1.10 and $1.16 give possible targets if this resistance breaks.

A stop run on the recent low at $0.6533 into possible support beginning near $0.6130 might see stronger bidding. This area also has a confluence with the recent monthly lows.

3. Alpha Finance (ALPHA)

Alpha Finance Lab ALPHA is a cross-chain DeFi platform that looks to bring Alpha to users across a variety of different blockchains, including Binance Smart Chain (BSC) and Ethereum. The platform aims to produce an ecosystem of DeFi products that address unmet needs in the industry while remaining simple to use and access. ALPHA is the native utility token of the platform. Token holders can earn a share of network fees by staking ALPHA tokens to cover any default loans. Other use cases for the token include liquidity mining and governance voting.

ALPHA Price Analysis

At the time of writing, ALPHA is ranked the 306th cryptocurrency globally and the current price is US$0.2847. Let’s take a look at the chart below for price analysis:

Source: TradingView

ALPHA‘s 60% rally from its Q1 lows met resistance near $0.5995, before creating a new range for Q2.

After a bearish flip of the 9, 18 and 40 EMAs, the price broke below $0.4310. This area, which has confluence with multiple swing lows and the February monthly open, may provide resistance on any future retest.

The price might find support near $0.3045 to $0.2549 if the overall market’s conditions turn more bullish. This zone has confluence with the 61.8% to 78.6% retracements and accumulation zone for Q1’s rally.

Suppose the price does rally through the probable resistance near December’s open. In that case, the January swing highs and above, near $0.4561, could provide resistance again. A shift back to more bullish market conditions could push the price to the 50% extension of the summer’s swing, near $0.5034.

Learn How to Trade Live!

Join Dave and The Crypto Den Crew and they’ll show you live on a webinar how to take your crypto trading to the next level.

Where to Buy or Trade Altcoins?

These coins have high liquidity on Binance Exchange, so that could help with trading on AUD/USDT/BTC pairs. And if you’re looking at buying and HODLing cryptos, then Swyftx Exchange is an easy-to-use popular choice in Australia.