Synthetix SNX has already gone up over +52% this month, and the trading analysis suggests that there might be another wave incoming. Let’s take a look at SNX and what the charts are telling us about price analysis, and possible reasons for the recent breakout.
What is SNX?
Synthetix is a derivatives liquidity protocol on Ethereum that enables the issuance and trading of synthetic assets. Each synthetic asset (or Synth) is an ERC20 token that tracks the price of an external asset; for example, each USD token tracks the price of the US dollar and unlike the other synthetic assets, is fixed at 1. A wide variety of Synths exists within Synthetix, including fiat currencies, cryptocurrencies, commodities, and inverse indexes. In principle, the system can support any asset with a clear price and provides on-chain exposure to an unlimited range of real-world assets. The protocol will enable a variety of trading features including binary options, futures, and more.
SNX Quick Stats
| Symbol: | SNX |
| Global rank: | 33 |
| Market cap: | $1,147,454,062 AUD |
| Current price: | $10.79 AUD |
| All time high price: | $14.30 AUD |
| 1 day: | +29.61% |
| 7 day: | +52.08% |
| 1 year: | +472.56% |
SNX Price Analysis
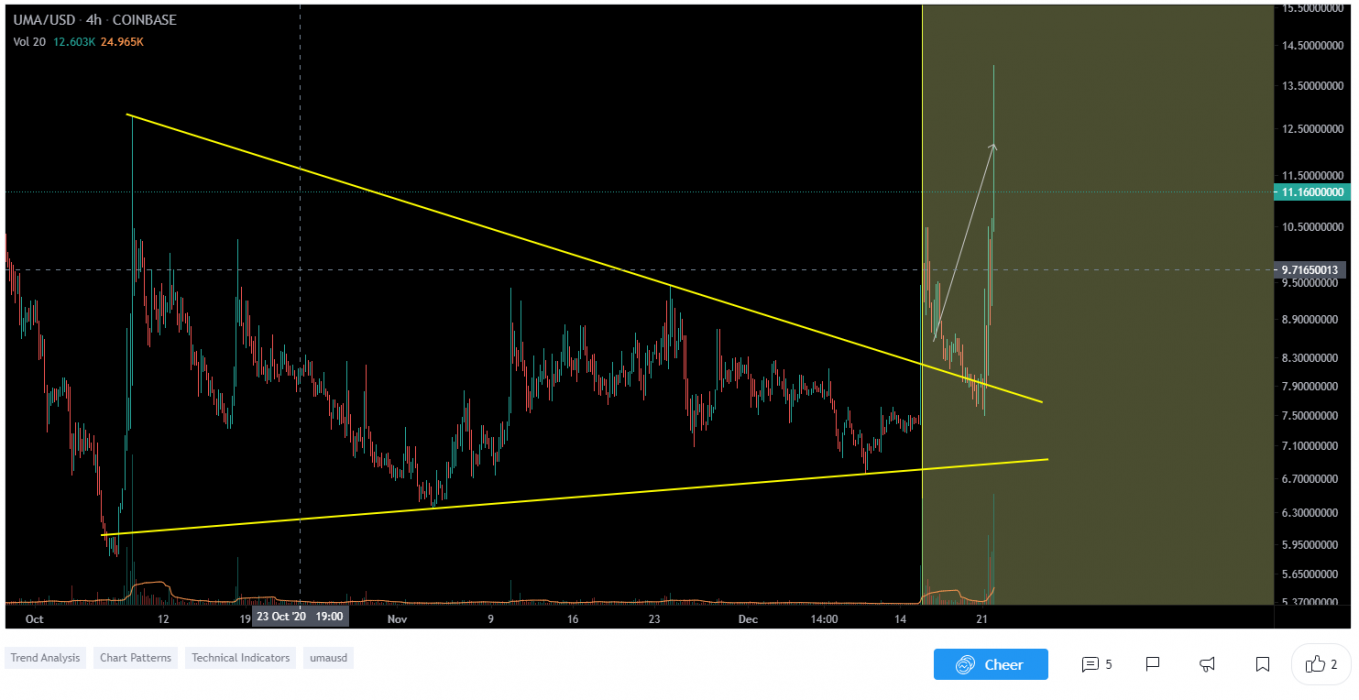
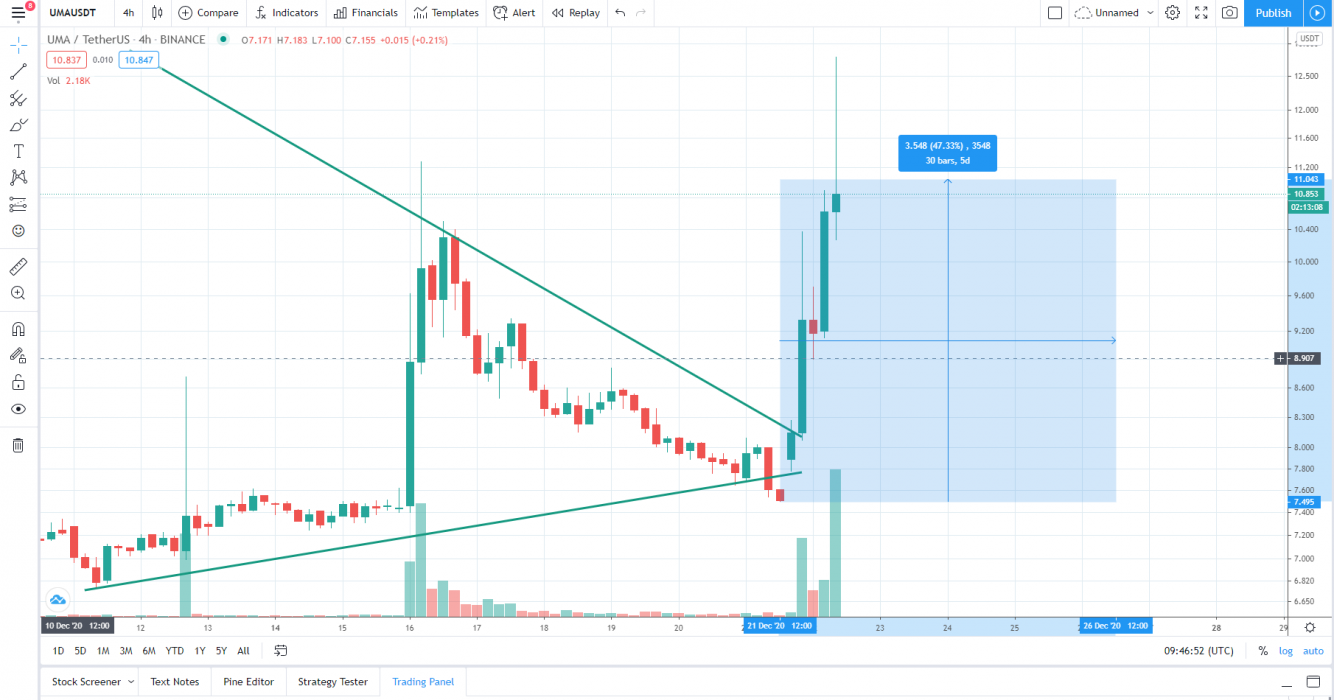
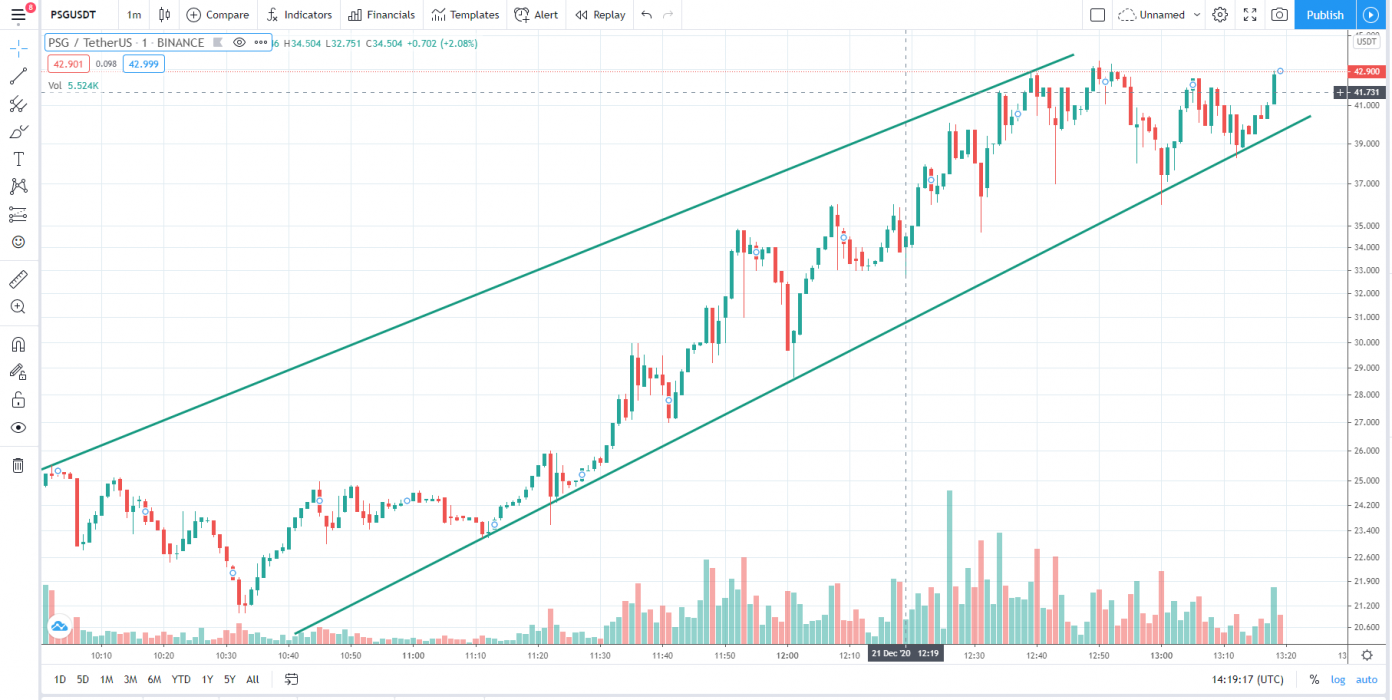
At the time of writing, SNX is ranked 33rd cryptocurrency globally and the current price is $10.79 AUD. This is a +52.08% increase since 17th December 2020 (7 days ago) as shown in the chart below.
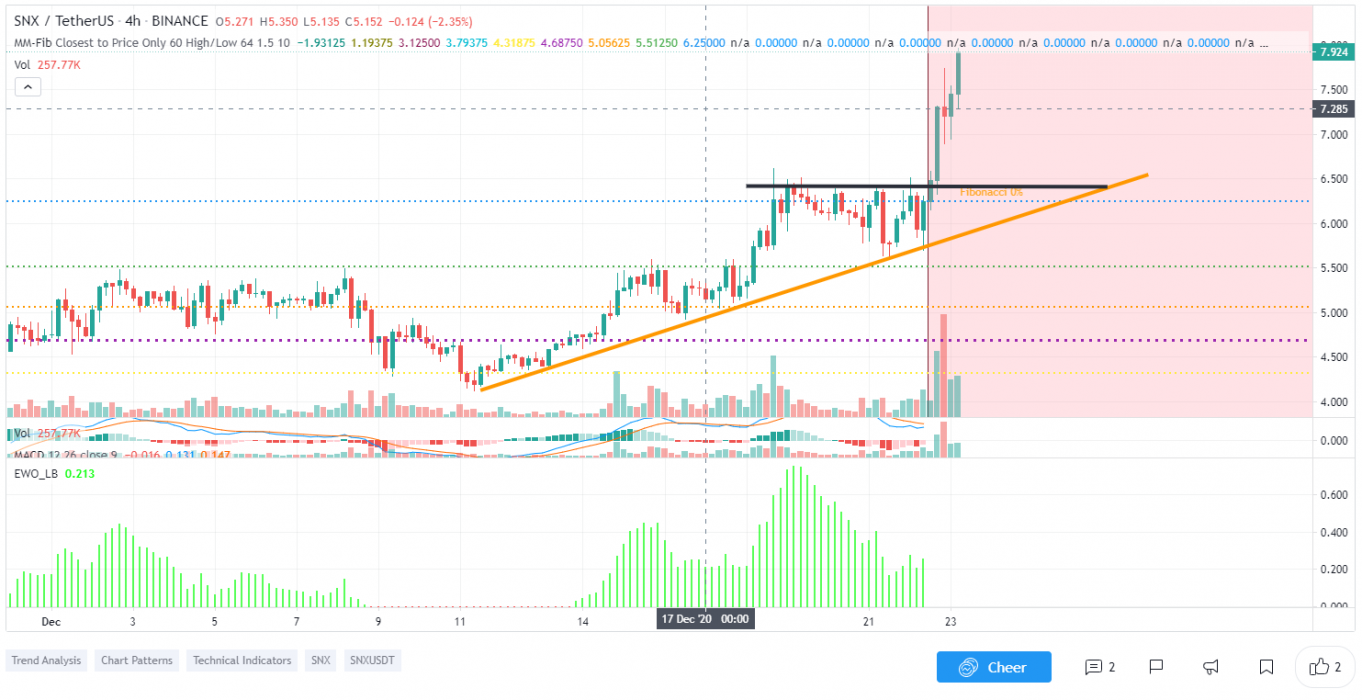
After looking at the above 4-hour candle chart, we can clearly see that SNX was trading inside the rising wedge pattern on the SNX/USDT pair. The first resistance was on the $7.12 price level which SNX broke with a strong bullish trend buying volume and is now heading towards the all-time high price. Seeing that many altcoins are waking up bullish today, SNX is likely to continue to increase in the uptrend.
‘A rising wedge is a technical indicator, suggesting a reversal pattern frequently seen in bear markets. This pattern shows up in charts when the price moves upward with pivot highs and lows converging toward a single point known as the apex.”
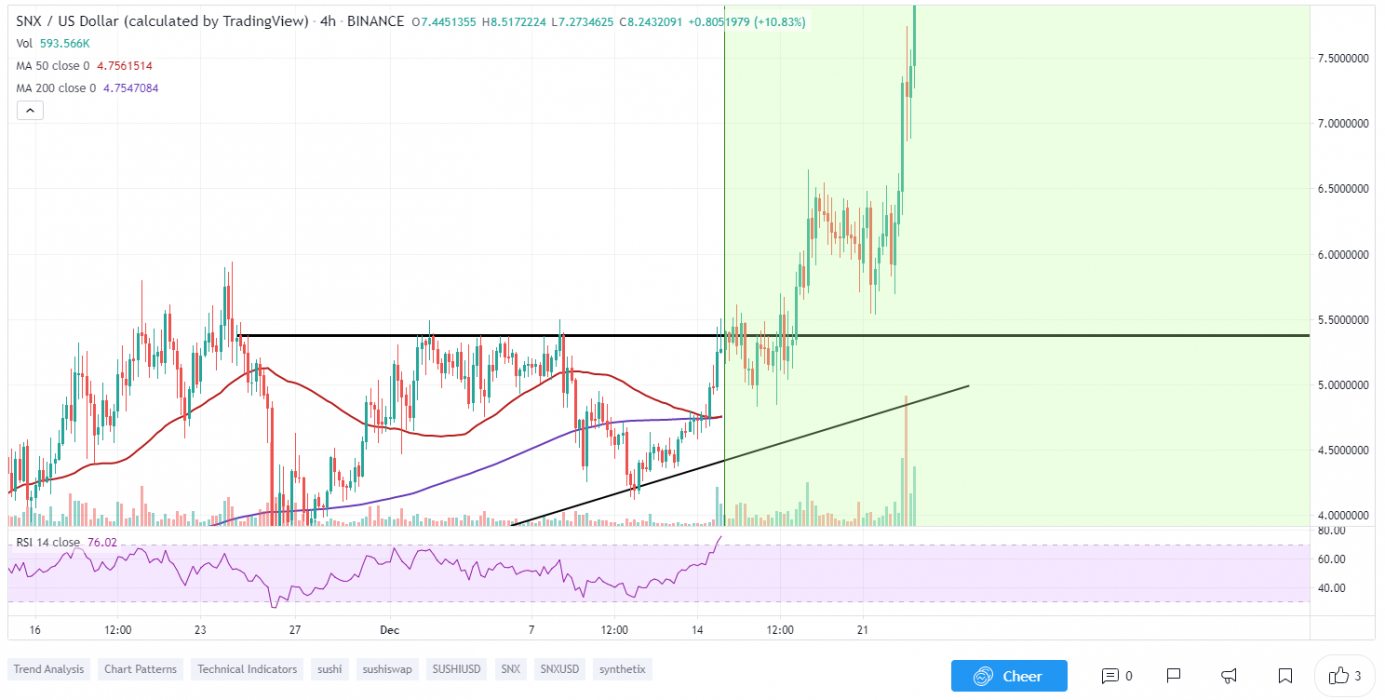
What do the Technical indicators say?

The SNX TradingView indicators (on the 1 day) mainly indicate SNX as a buy, except the Oscillators which indicate SNX as a sell.
So Why did SNX Breakout?
The recent rise in Bitcoin over 100% since the halving in May and then the suggested start of the Altcoin season could have contributed to the recent breakout. Another reason could be the whales, secretly stacking up SNX to their portfolio for this Altcoin rally. It could also be contributed to some of the recent news of Synthetix Staking DApp Launch.
Recent Synthetix News & Events:
- 26 September 2020 – Bitfinex Listing
- 02 October 2020 – P2PB2B Listing
- 08 October 2020 – Deneb Release
Where to Buy or Trade SNX?
SNX has the highest liquidity on Binance Exchange so that would help for trading SNX/USDT or SNX/BTC pairs. However, if you’re just looking at buying some quick and hodling then Swyftx Exchange is a popular choice in Australia.

