Categories
Crypto News Initial Coin Offering Market Analysis Trading

Graph Breakout Analysis – GRT Pumps +502% on Binance Launchpad

After the launch of Graph on Binance Launchpad today, GRT took a strong Breakout with +502% gains in a single day. Let’s take a quick look at GRT, price analysis, and possible reasons for the recent breakout.

What is Graph?

The Graph is an indexing protocol and global API for organizing blockchain data and making it easily accessible with GraphQL. Developers can use Graph Explorer to search, find, and publish all the public data they need to build decentralized applications. The Graph Network makes it possible to build serverless Decentralized Apps that run entirely on public infrastructure.

Graph Quick Stats

SYMBOL:GRT
Global rank:71
Market cap:$296,431,814 AUD
Current price:$0.3519 AUD 
All-time high price:$0.4670 AUD
1 day:+502.26%
7 day:+527.70%
1 year:+527.70%

Graph Price Analysis

At the time of writing, GRT is ranked 71st cryptocurrency globally and the current price is $0.3519 AUD. This is a +502.26% increase since the launch of its ICO at Binance Launchpad today (18th December 2020). Have a look at the chart below for price analysis.
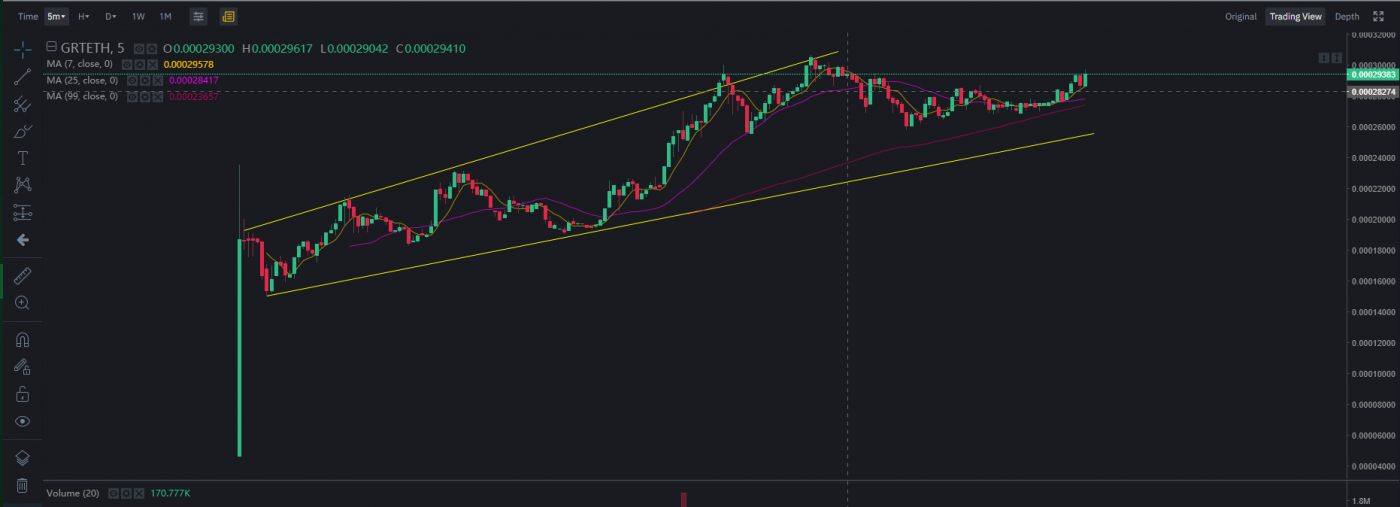
Source: Binance TradingView

After the launch of Graph on Binance Launchpad, It pumped up to $0.4670 AUD having +502% gains in just a few hours and the initial opening price of GRT was $0.0813 AUD at Binance Exchange with many different trading pairs like GRT/BTC, GRT/USDT, and GRT/ETH.

Currently, GRT is trading at $0.3519 AUD price levels after breaking out the squeeze resistance in its sideways trend & now heading towards its all-time high price.

What do the technical indicators say?

The Graph TradingView indicators (on the 1 day) mainly indicate GRT as a strong buy, except the Oscillators which indicate GRT as a neutral.

So Why did Graph Breakout?

After the opening at Binance Launchpad, mostly ICO’s pumps after going live on exchange for trade and, the recent rise in Bitcoin over 100% since the halving in May and then the suggested start of the Altcoin season could have contributed to the recent breakout. It could also be contributed to some recent news of The Graph Mainnet Launch.

Recent Graph News & Events:

Where to Buy or Trade Graph?

The graph has the highest liquidity on Binance Exchange so that would help for trading GRT/BTC, GRT/ETH, or GRT/USDT pairs. However, you can also buy GRT from different exchanges listed on Coinmarketcap.

Categories
Crypto News Market Analysis Trading

Audius Breakout Analysis – AUDIO Pumps +40% in a Single Day

The cryptocurrency Audius AUDIO just went up over +40% in a single day. Let’s take a quick look at AUDIO, price analysis, and possible reasons for the recent breakout.

What is Audius?

Audius is a decentralized music-sharing and streaming protocol that facilitates direct transactions between listeners and creators, giving everyone the freedom to distribute, monetize, and stream any audio content.

Audius Quick Stats

SYMBOL:AUDIO
Global rank:314
Market cap:$39,592,849 AUD
Current price:$0.3289 AUD
All-time high price:$0.6990 AUD
1 day:+40.52%
7 day:+55.15%
1 year:+176.33%

Audius Price Analysis

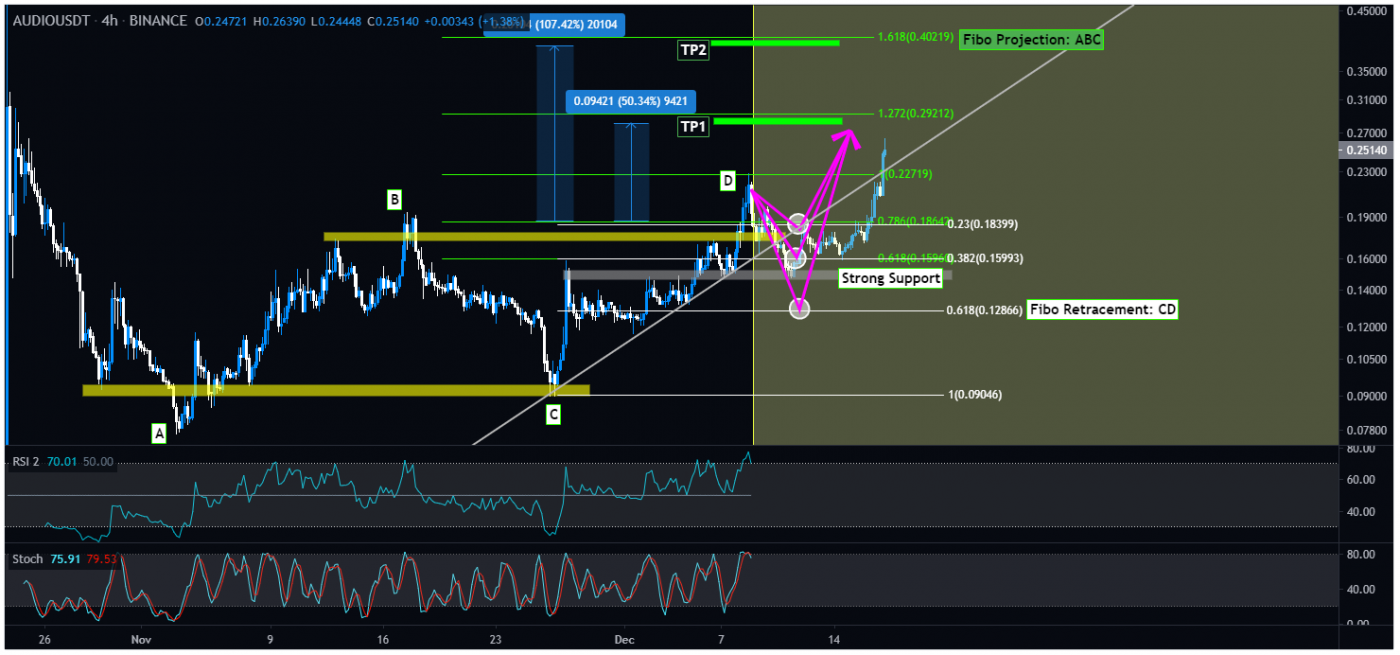
At the time of writing, AUDIO is ranked 314th cryptocurrency globally and the current price is $0.3289 AUD. This is a +55.15% increase since 11th December 2020 (7 days ago) as shown in the chart below.

Source: TradingView

In the past week, there was a strong rise in Bitcoin, Ethereum, and Ripple. As a result, Audius (AUDIO) also formed strong support near $0.2586 before starting a fresh increase against the AUD.

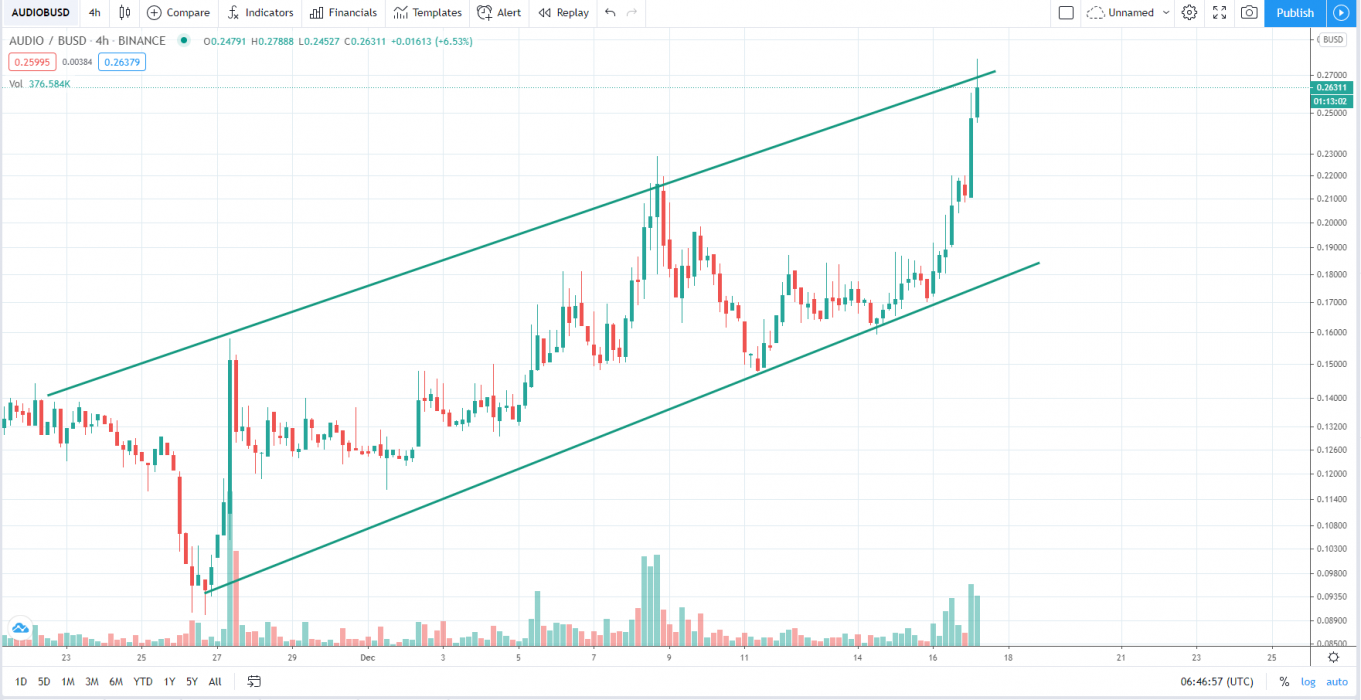
If we see the above 4-hour candle chart, AUDIO is forming a Rising Wedge pattern and is now currently trading at $0.3289 AUD after a successful breakout today. The next resistance is on the $0.4125 AUD price levels which can be broken any time soon if AUDIO keeps trading in the uptrend with strong buying volume.

“A rising wedge is a technical indicator, suggesting a reversal pattern frequently seen in bear markets. This pattern shows up in charts when the price moves upward with pivot highs and lows converging toward a single point known as the apex.”

Source: TradingView

If we zoom out and take a look at the price over the past few days or so, we can see the recent breakout more clearly, the price chart looks in a strong uptrend which is good for long-term growth.

What do the Technical indicators say?

The  AUDIO TradingView indicators (on the 1 day) mainly indicate AUDIO as a buy, except the Oscillators which indicate AUDIO as a Neutral.

So Why did AUDIO Breakout?

The recent rise in Bitcoin over 100% since the halving in May and then the suggested start of the Altcoin season could have contributed to the recent breakout. Another reason could be the whales, secretly stacking up AUDIO to their portfolio for the next Altcoins rally. It could also be contributed to some of the recent news of Audius Mainnet.

Recent AUDIO News & Events:

Where to Buy or Trade Audius?

Audius has the highest liquidity on Binance Exchange so that would help for trading AUDIO/USDT or AUDIO/BTC pairs. However, you can also buy AUDIO from different exchanges listed on Coinmarketcap.

Categories
Australia Crypto News

Australian Crypto Lender, Helio has Established a US Branch

The Australian leading cryptocurrency-backed lending company, Helio Lending, is expanding its operations in the United States and would be tapping from the flourishing crypto lending business in the country. The company precisely announced in a publication on Thursday that it has established a branch in a US state. Additionally, it hired one of the popular crypto experts and advisors, Min H. Kim, to spearhead the operations in the country. 

Helio Expands Crypto Lending to the US

Launched in 2018, Helio is reportedly the first independent crypto-related company operating in Australia. It’s regulated and operates with the Australian Credit Licence. Having gained prominence by building a unique and propriety platform for Australians to obtain loans with their digital currencies, the company is looking to step up its service, starting with the United States crypto market. As reported, Helio established its US headquarters in San Francisco.

Following the establishment of the US branch, the chairman of John O’Shea, said they look “forward to a mutually rewarding endeavor as we enter 2021 with some solid momentum and a crypto-lending industry that is bursting at the seams.”

According to the report, Ms. Kim will oversee Helio operations in the United States, its digital currency loan portfolio, and business partnerships. She will be responsible for drafting and managing the company’s daily activities. With rich experience in cryptocurrencies and other related services, Ms. Kim said she is a “firm believer that crypto collateralized lending is here to stay as one of the fastest-growing mainstream use cases.”

Helio Prepares for US Growth

Aside from hiring the former Director of Marketing at Huobi U.S., Ms. Kim, the company seemingly has plans to perform better in the country. According to O’Shea, “the Company has engaged counsel to perform exploratory due diligence on a possible change of control transaction through which Helio Lending would potentially merge with a US publicly listed company and become the majority shareholder.”

Categories
Bitcoin Crypto News

How a Reporter Spent 10 Bitcoin Worth US1,000 in Sushi Dinner Seven Years ago

Early Bitcoin (BTC) investors who sold off their coin many years ago are beginning to scratch their heads in regret as the digital currency posts a five-digit value. A typical example is Laszlo Hanyecz, who traded 10,000 Bitcoin for two Papa John’s pizzas on May 22, 2010. These cryptocurrencies are now worth US$234 million following the current price of BTC on Coinmarketcap. 

On December 16, The New York Times reported another case where a tech reporter spent about 10 Bitcoin on a Sushi dinner she hosted for strangers.

10 BTC Spent in a Single Sushi Dinner

Known as Kashmir Hill, the tech reporter for The New York Times bought some Bitcoin back in 2013 as the cryptocurrency was getting popular among technology junkies. Hill noted that she bought the Bitcoin at US$136 each from the now-leading United States cryptocurrency exchange, Coinbase. While she tried to explore the value and use case of the cryptocurrency, the options were limited as only a few places could accept the technology then.

As the efforts to spend the cryptocurrency proved fatal – caused her to lose weight as no eateries accepted the crypto – Hill decided to host a memorable Sushi dinner party as she intended to sell off the cryptocurrency. The dinner party was hosted in one of the few places in San Francisco that supported Bitcoin. Many people turned up for dinner, including entrepreneurs working on Bitcoin apps back then. 

This is Why You Should HODL

The party caused about US$957, which was settled with 10 Bitcoin then. In comparison with today’s price, these cryptocurrencies will be worth about $234,960, which indeed is a lot of money that was spent in a single sushi dinner. 

“I felt guilty at the time, making Yung Chen [the restaurant owner] accept $1,000 worth of funny money because it was unclear to me whether Bitcoin should be worth anything at all,” the tech reported said.

Categories
Bitcoin Crypto News Market Analysis Trading

Bitcoin Breakout Analysis – BTC Price Hits New High at $30k AUD with +15% Gains in a Day

Bitcoin hits a fresh record high above $30,000 AUD on Thursday, extending a wild rally for the cryptocurrency that has seen it more than triple in value this year.

The world’s most valuable digital currency surged +15% to $30,902 AUD according to crypto market data provider Coin Metrics, taking its year-to-date gains to more than +200%.

What is Bitcoin?

Bitcoin is a decentralized cryptocurrency originally described in a 2008 whitepaper by a person, or group of people, using the alias “Satoshi Nakamoto” It was launched soon after, in January 2009.

Bitcoin is a peer-to-peer online currency, meaning that all transactions happen directly between equal, independent network participants, without the need for any intermediary to permit or facilitate them. Bitcoin was created, according to Nakamoto’s own words, to allow “online payments to be sent directly from one party to another without going through a financial institution.”

Bitcoin Quick Stats

SYMBOL:BTC
Global rank:1st
Market cap:$551,313,622,271 AUD
Current price:$30,124 AUD
All time high price:$30,902 AUD
1 day:+15.96%
7 day:+24.53%
1 year:+241.59%

Bitcoin Price Analysis

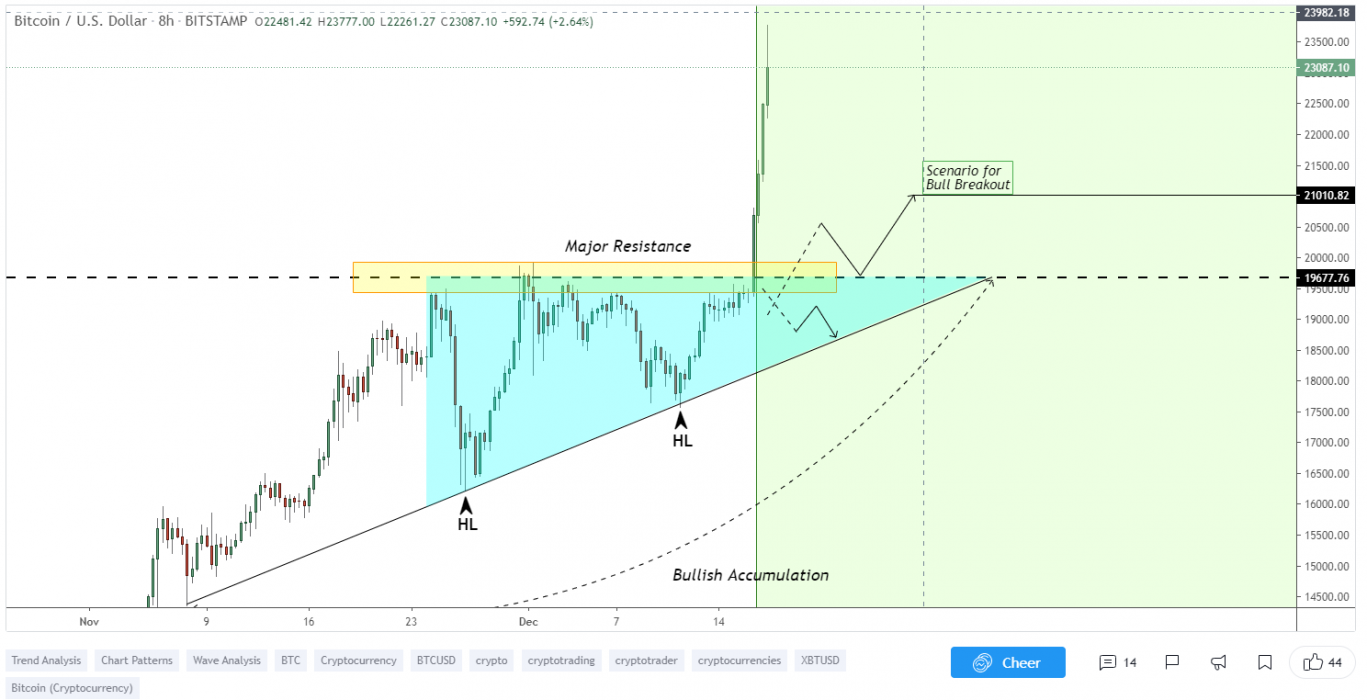
At the time of writing, Bitcoin is ranked 1st cryptocurrency globally and the current price is $30,124 AUD. This is a +24.53% increase since 11th December 2020 (7 days ago) as shown in the chart below.

Source: TradingView

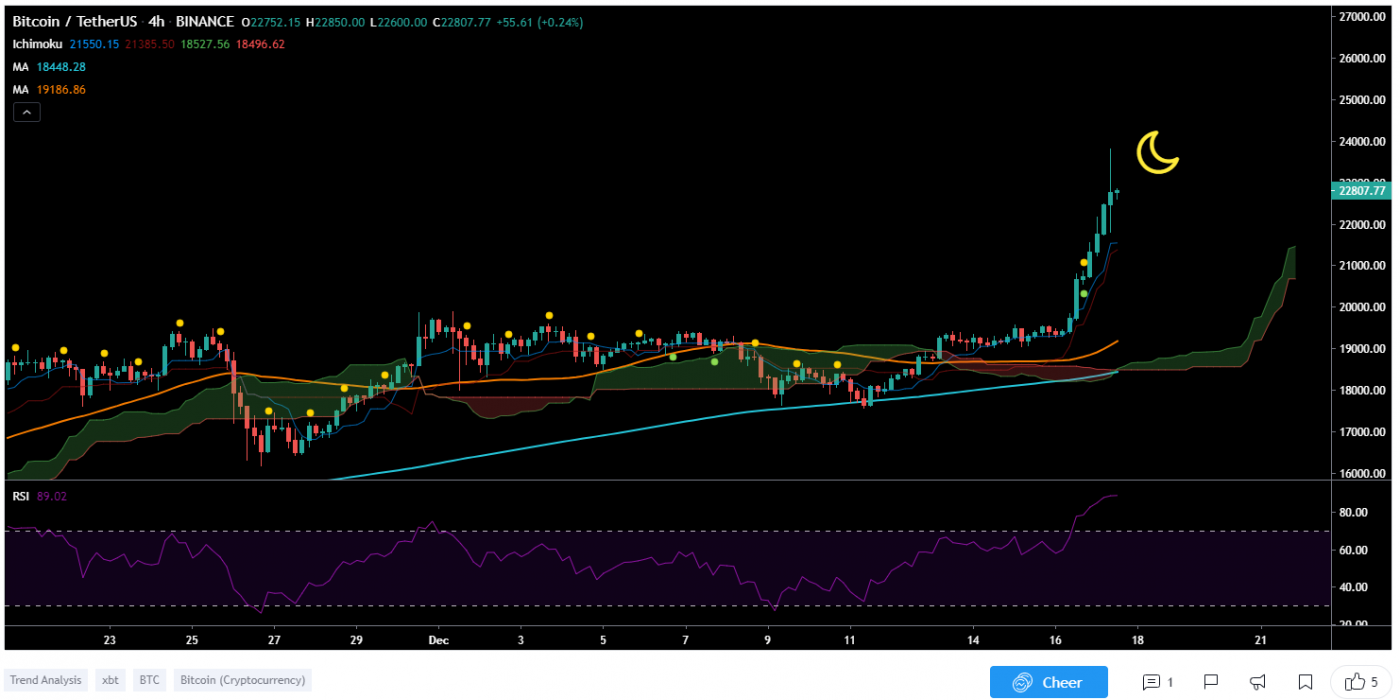
After looking at the above 8-hour candle chart, we can clearly see that Bitcoin was trading inside the rising wedge pattern on the BTC/USDT pair. The first resistance was on the $26,151 AUD price levels which BTC broke with a strong bullish trend buying volume and made a new all-time high above +$30k AUD. Seeing that the whole crypto market is waking up bullish today, Bitcoin is likely to continue the uptrend to make new all-time high prices.

“A rising wedge is a technical indicator, suggesting a reversal pattern frequently seen in bear markets. This pattern shows up in charts when the price moves upward with pivot highs and lows converging toward a single point known as the apex.”

Source: TradingView

The cryptocurrency rose by more than +15% on Thursday to reach $30,472 against the AUD, extending a winning streak this year amid growing interest among big investment companies attracted to its potential for quick gains.

The price of bitcoin has surged by more than +400% this year from a low point of around $4,718 AUD in March when the coronavirus pandemic triggered a deep sell-off in financial markets around the world.

Analysts said that unlike in previous surges, a major price driver appeared to be more institutional investors buying into the cryptocurrency.

What do the Technical Indicators say?

The  Bitcoin TradingView indicators (on the 1 day) mainly indicate BTC as a buy, except the Oscillators which indicate BTC as a neutral.

So Why did Bitcoin Breakout?

The recent rise in Bitcoin over 100% since the halving in May and then the suggested start of the Altcoin season could have contributed to the recent breakout of Bitcoin. Another reason could be the whales, secretly stacking up Bitcoin to their portfolio for the next bull run rally.

A few other reasons for Bitcoin’s return to the record highs. It’s about $30,124 as of this writing, matching the previous highs from 2017’s original explosion.

Reason One: Paypal and Square’s Cash App, according to reports, are in a race to acquire enough Bitcoin to facilitate the next generation of their money transferring services. They both seek to allow their massive user bases to be able to seamlessly transact with merchants in Bitcoin, moving money back and forth from sovereign currencies into Bitcoin, etc.

Reason Two: Wall Street legends are being won over. Don’t underestimate the pull of FOMO, peer pressure, idol worship, etc, Read this article in Barron’s about how institutions are afraid of missing out.

Reason Three: Gold and Silver aren’t “working.” Go look at a chart of gold or a gold ETF since the summer. It peaked in July in US dollar terms. The weakening (some would say plunging) dollar is one of the biggest macro stories around right now. Gold should be rallying. So far it’s not. Just fell below its 200-day last week.

Recent Bitcoin News & Events:

Where to Buy or Trade Bitcoin?

Bitcoin has the highest liquidity on Binance Exchange so that would help for trading USDT/BTC pair. However, if you’re just looking at buying some quick and hodling Bitcoin then Swyftx Exchange is a popular choice in Australia.

Categories
Australia Crypto News Cryptocurrencies Investing

Australian Fund Managers vs General Population – Who’s More Optimistic About Crypto?

Bitcoin recently broke the all-time high. In a country like Australia, where 91.4% of respondents to a survey stated that they were aware of at least one cryptocurrency, opinions are naturally split.

General Public Optimistic Despite Some Bearish Asset Managers

Although some investment management firms such as the Pendal Group are optimistic on Bitcoin – with management at the firm considering Bitcoin a better investment than government bonds, other financiers have a less optimistic approach.

“Bitcoin is a cockroach that exists. They can’t ban it out of existence.

We think ultimately that government bonds will turn into a dead asset class, so we now have to imagine what it will be like for other assets classes when bonds are no longer relevant to hold in a portfolio.”

Geoff Wilson – the chairman and founder of Wilson Asset Management – stated that despite being enthusiastic about blockchain technology, he did not see Bitcoin in the same light, considering it a risky investment.

“As an investment, it is extremely volatile and appears to be easily manipulated. Thus it is not a prudent investment, it is not strategic for us as an investor and in our view, it is not sustainable.”

Other fund managers were even more bearish on Bitcoin and cryptocurrencies in general, with one Aussie financier saying that when wanting a good punt, he preferred to visit a casino.

Meanwhile Jamie Hannah – the deputy head of investments at VanEck – has found a middle-of-the-road-solution by listing a Bitcoin exchange-traded note in Germany. This allows investors to purchase Bitcoin-related funds without having to invest in crypto themselves.

This decision came following a noted increase in interest by clients of the firm, even when advised against it – after all, 2 out of 5 Aussies consider Bitcoin a good investment, and over 18% are in possession of crypto tokens.

It’s worth noting however that investors such as JPMorgan and Goldman Sachs have also been dismissive of crypto in the past – and had a change of heart. Like any investment, crypto may have its detractors – but only time will tell who is right.

Categories
Crypto News Market Analysis Trading

Prometeus Breakout Analysis – Parabolic Breakout on PROM with +90% Gain in a Single Day

Prometeus PROM just pumped up to +90% in a single day with a strong breakout on Binance & other Exchanges. Let’s take a quick look at PROM, price analysis, and possible reasons for the recent breakout.

What is Prometeus?

Prometeus Network describes itself as a secure and decentralized ecosystem designed to solve real-world problems in data brokerage. It was created for the Influencer Marketing, Medical, and Insurance data market industries. Prometeus Network is developed by Prometeus Labs, a company of data scientists and entrepreneurs.

PROM Quick Stats

SYMBOL:PROM
Global rank:199
Market cap:$43,632,422 AUD
Current price:$6.89 AUD
All time high price:$7.50 AUD
1 day:+90.25%
7 day:+105.66%
1 year:+1345.47%

PROM Price Analysis

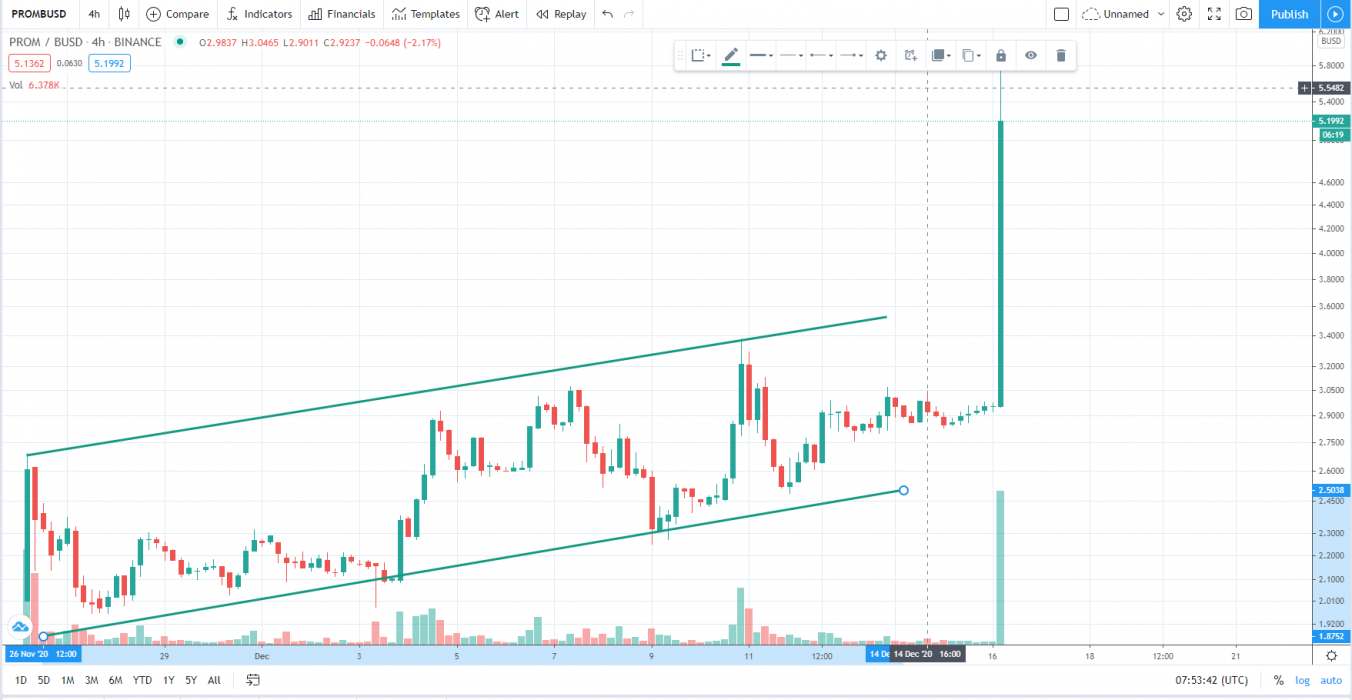
At the time of writing, PROM is ranked 199th cryptocurrency globally and the current price is $6.89 AUD. This is a +105.66% increase since 10th December 2020 (7 days ago) as shown in the chart below.

Source: TradingView

After looking at the above 4-hour candle chart, we can clearly see that PROM was trading inside the inverse head and shoulders pattern on the PROM/BUSD pair. The first resistance was on the $3.12 AUD price level which PROM broke with a strong bullish trend buying volume and is now heading towards the all-time high price. Seeing that many altcoins are waking up bullish today, PROM is likely to continue to increase in the uptrend.

“An inverse head and shoulders pattern is comprised of three component parts: After long bearish trends, the price falls to a trough and subsequently rises to form a peak. … The price falls for the third time, but only to the level of the first trough, before rising once more and reversing the trend.”

What do the Technical indicators say?

The  PROM TradingView indicators (on the 1 day) mainly indicate PROM as a buy, except the Oscillators which indicate PROM as a sell.

So Why did PROM Breakout?

The recent rise in Bitcoin over 100% since the halving in May and then the suggested start of the Altcoin season could have contributed to the recent breakout. Another reason could be the whales, secretly stacking up PROM to their portfolio for this Altcoin rally. It could also be contributed to some of the recent news of Binance Listing PROM to Innovation Zone.

Recent PROM News & Events:

Where to Buy or Trade PROM?

Prometeus has the highest liquidity on Binance Exchange so that would help for trading PROM/BUSD or PROM/BNB pairs. However, you can also buy PROM from different exchanges listed on Coinmarketcap.

Categories
Bancor Crypto News Market Analysis Trading

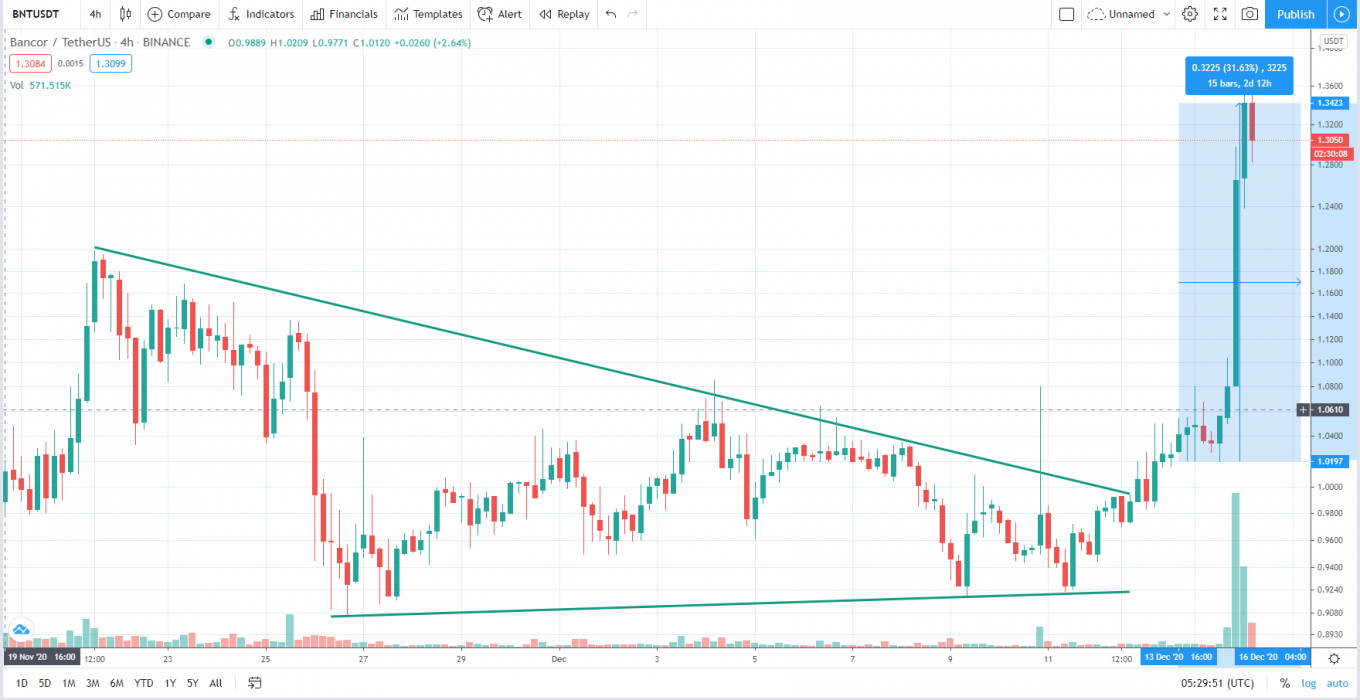
Bancor Breakout Analysis – BNT Performing Active Uptrend with +29% Gains in a Day

Bancor is trading in active uptrend here like many other Altcoins. The Cryptocurrency Bancor BNT just went up +29% in a single day and surges over +32% in a week.

What is Bancor?

Bancor is an on-chain liquidity protocol that enables automated, decentralized exchange on Ethereum and across blockchains. The protocol is made up of a series of smart contracts that are designed to pool liquidity and perform peer-to-contract trades in a single transaction with no counterparty. Users stake BNT in automated market makers in exchange for trading fees, BNT staking rewards, and voting rights in the Bancor DAO. Bancor has processed more than $2 billion in trade volume across thousands of tokens, with millions in fees generated by stakers.

Bancor Quick Stats

SYMBOL:BNT
Global rank:93
Market cap:$164,380,611 AUD
Current price:$1.77 AUD
All time high price:$13.31 AUD
1 day:+29.79%
7 day:+32.04%
1 year:+419.44%

Bancor Price Analysis

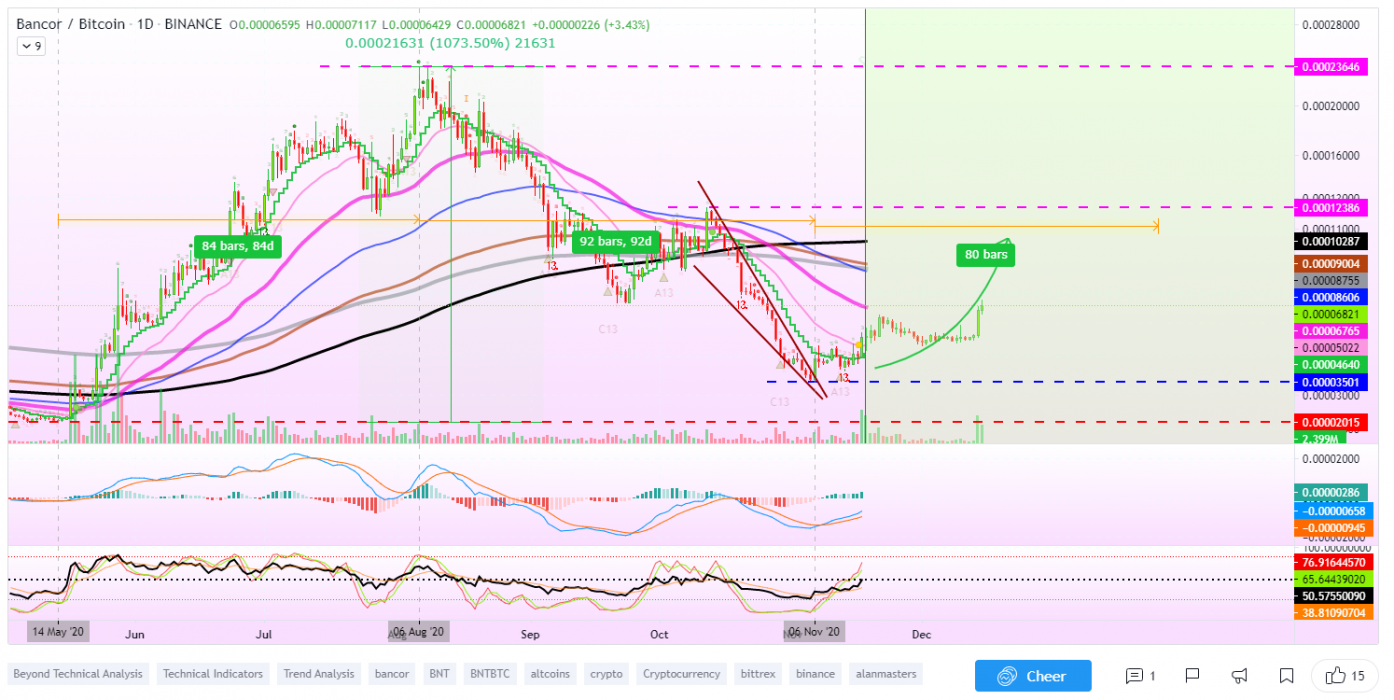
At the time of writing, Bancor is ranked 93rd cryptocurrency globally and the current price is $1.77 AUD. This is a +32.04% increase since 9th December 2020 (7 days ago) as shown in the chart below.

Source: TradingView

If we see the above 2-hour candle chart, BNT just bounced back from its support levels of $0.91 AUD and took a strong breakout from Descending Triangle within the next resistance which was at $1.25 AUD. The blue line is acting as a support level for this Descending triangle trend.

“A descending triangle is a bearish chart pattern used in technical analysis that is created by drawing one trend line that connects a series of lower highs and a second horizontal trend line that connects a series of lows”

Source: TradingView

What do the technical indicators say?

The BNT TradingView indicators (on the 1 day) mainly indicate BNT as a buy, except the Oscillators which indicate BNT as a neutral.

So Why did BNT Breakout?

The recent rise in Bitcoin over 100% since the halving in May and then the suggested start of the Altcoin season could have contributed to the recent breakout. It could also be contributed to some of the recent news of BNT Liquidity Mining Rewards.

Recent BNT News & Events:

Where to Buy or Trade BNT?

Bancor has the highest liquidity on Binance Exchange so that would help for trading BNT/USDT or BNT/BTC pairs. However, if you’re just looking at buying some quick and hodling then Swyftx Exchange is a popular choice in Australia.

Categories
Bitcoin Crypto News Market Analysis Tether

Bitcoin Daily Issuance Reaching New Lows As Supply Drys Up

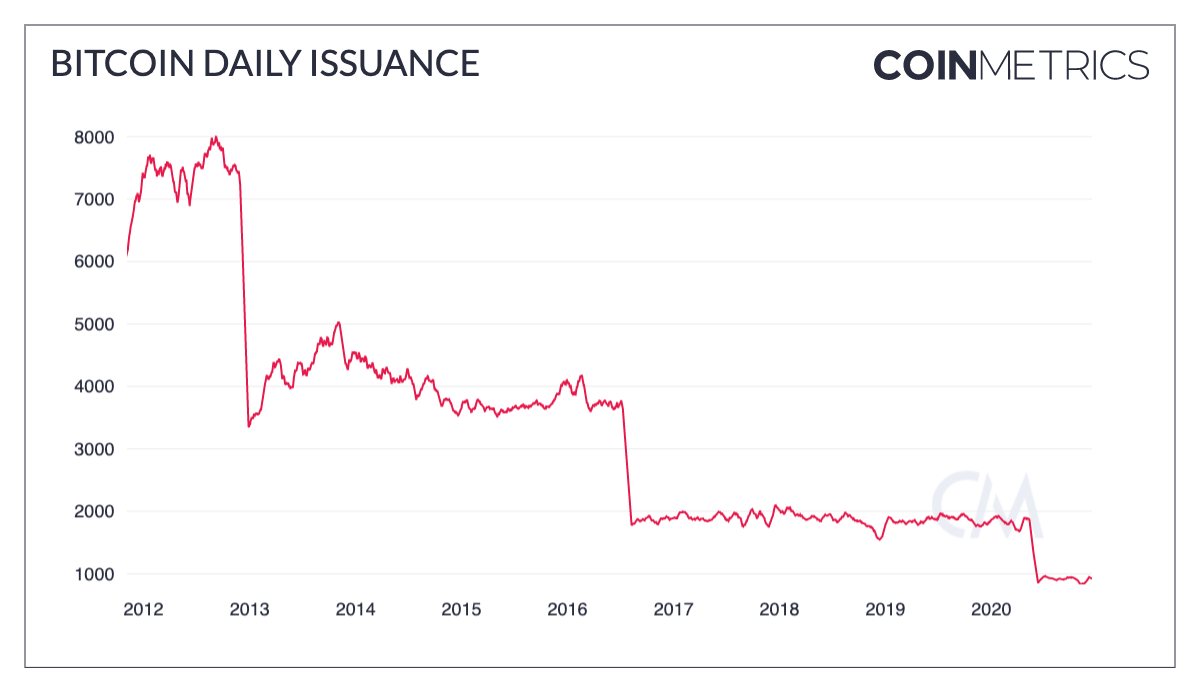
Bitcoin issuance is decreased by 50% every four years. These halvings are also a core part of the Bitcoin protocol, and are predictable well into the future.

Source: Coin Metrics Network Data Charts

New bitcoins are issued every time a new block is mined as a reward for the miner who successfully mined the block. This is the only way that new bitcoins can be created and is a key part of the Bitcoin protocol. 

Bitcoin’s current block reward is 6.25, which means 6.25 new bitcoins are issued every time a block is mined. On average, blocks are mined every ten minutes, which typically means about 800-1000 new bitcoins are issued every day. There’s slight variance from day to day due to the unpredictable nature of exactly how often new blocks are mined (Bitcoin’s difficulty adjusts every two weeks to keep the average block time around ten minutes), but over the long term this supply issuance is deterministic and predictable. 

Tether (USDT) Supply Soars

Source: Coin Metrics Network Data Charts

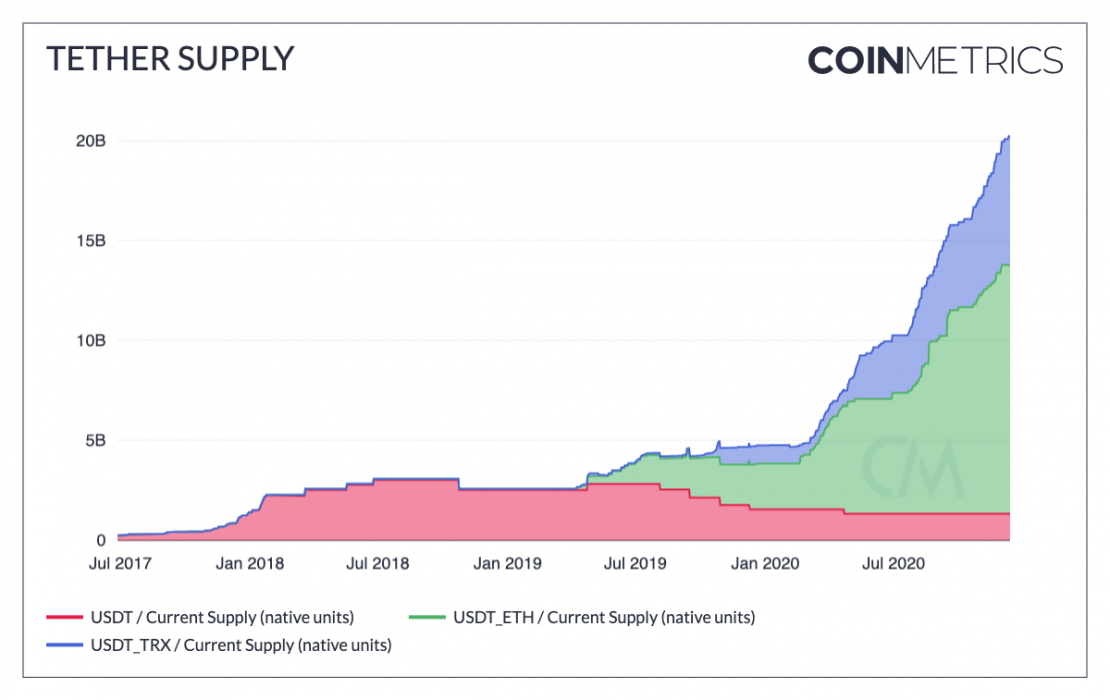
Tether’s total supply has passed 20 billion. After initially launching on Omni, the Ethereum based version of Tether (USDT_ETH) and Tron based version of Tether (USDT_TRX) have both grown rapidly over the last year (see our report “The Rise of Stablecoins” for an exploration of why stablecoins have been exploding). Tether is still the undisputed leader of stablecoins, with over 5x the supply of any other stablecoin. But regulatory action is once again heating up with the recent introduction of the STABLE Act. Tether may once again come under fire in 2021.

Categories
Crypto News Market Analysis Trading

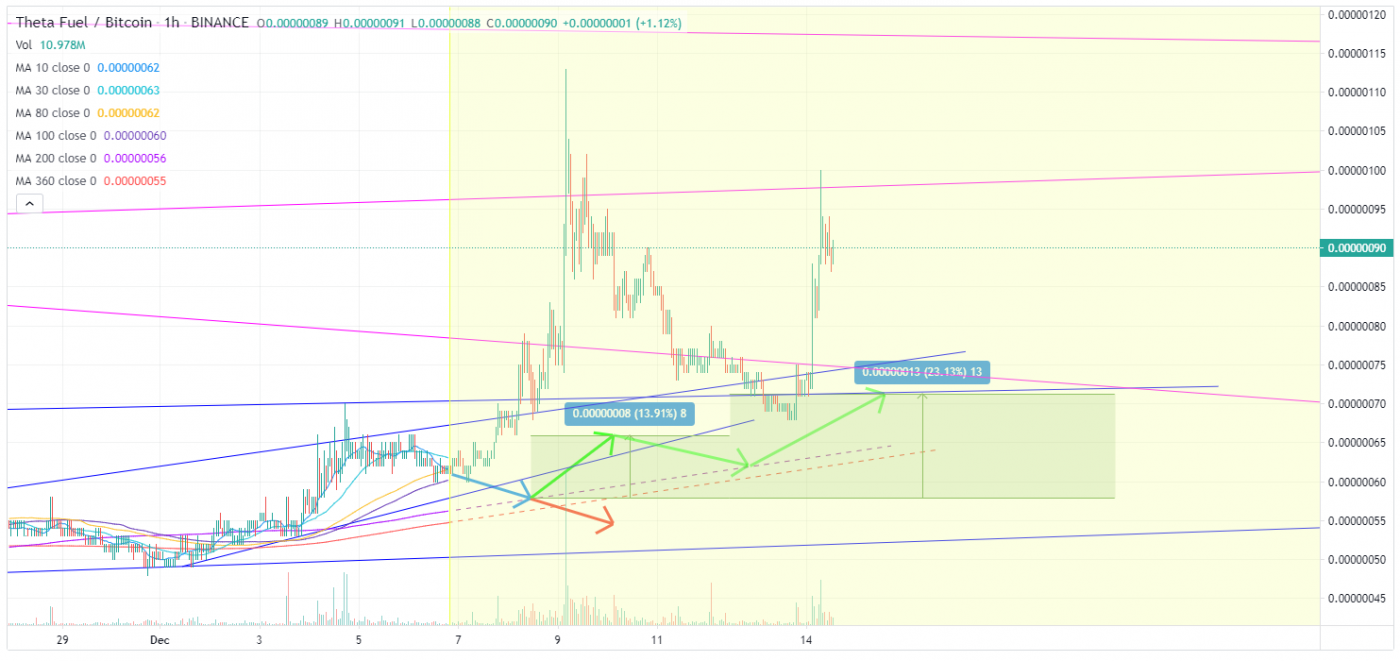
Theta Fuel Breakout Analysis – TFUEL Pumps +42% in a Week

Theta Fuel is trading in active uptrend here like many other altcoins. The Cryptocurrency TFUEL just went up +27.96% in a single day and surges over +42.12% in a week.

What is Theta Fuel?

Theta Fuel is the second token (gas token) of the Theta Network. Theta Fuel is a native token on the Theta blockchain. TFUEL powers on-chain operations like payments to relayers for sharing a video stream, or for deploying or interacting with smart contracts. Relayers earn TFUEL for every video stream they relay to other users on the network.

TFUEL Quick Stats

SYMBOL:TFUEL
Global rank:114
Market cap:$112,242,519 AUD
Current price:$0.0226 AUD
All time high price:$0.0331 AUD
1 day:+27.96%
7 day:+42.12%
1 year:+594.07%

TFUEL Price Analysis

At the time of writing, TFUEL is ranked 114th cryptocurrency globally and the current price is $0.0226 AUD. This is a +42.12% increase since 8th December 2020 (7 days ago) as shown in the chart below.

Source: TradingView

After looking at the above 1-hour candle chart, we can clearly see that TFUEL was trading inside the falling wedge pattern on the TFUEL/BTC pair. The first resistance was on the $0.0165 AUD price levels which TFUEL broke with a strong bullish trend buying volume and is now heading towards the next resistance at $0.0254 AUD & $0.0286 AUD respectively. Seeing that many altcoins are waking up bullish today, TFUEL is likely to continue the uptrend.

“The falling wedge pattern is a continuation pattern formed when price bounces between two downward slopings, converging trendlines. It is considered a bullish chart formation but can indicate both reversal and continuation patterns – depending on where it appears in the trend”

Source: TradingView

What do the Technical Indicators say?

The  TFUEL TradingView indicators (on the 1 day) mainly indicate TFUEL as a strong buy, except the Oscillators which indicate TFUEL as a buy.

So Why did TFUEL Breakout?

The recent rise in Bitcoin over 100% since the halving in May and then the suggested start of the Altcoin season could have contributed to the recent breakout. Another reason could be the whales, secretly stacking up TFUEL to their portfolio for this Altcoins rally. It could also be contributed to some of the recent news of TFUEL Staking & Burning.

Recent TFUEL News & Events:

Where to Buy or Trade TFUEL?

Theta Fuel has the highest liquidity on Binance Exchange so that would help for trading TFUEL/USDT or TFUEL/BTC pairs. However, if you’re just looking at buying some quick and hodling then Swyftx Exchange is a popular choice in Australia.