Categories
Binance Crypto News Initial Coin Offering Market Analysis Trading

Coin98 Surges +1850% Amid listing on Binance Launchpad – C98 Breakout Analysis

After the launch of Coin98 on Binance Launchpad, C98 took a strong Breakout with +1850% gains in a single day. Let’s take a quick look at C98, price analysis, and possible reasons for the recent breakout.

What is Coin98?

Coin98 is a decentralized finance (DeFi) solution that allows users access to cross-chain swaps, staking, and yield farming. The Coin98 exchange describes itself as a multi-chain liquidity aggregator that supports assets across a variety of blockchains, including but not limited to Ethereum, Binance Smart Chain, Solana, and Tron. Coin98 also has a wallet amongst its offerings, which supports over 20 networks on both its mobile and desktop platforms.

C98 Price Analysis

At the time of writing, C98 is ranked 2549th cryptocurrency globally and the current price is A$1.41. This is a +1268% increase since the launch of its ICO at Binance Launchpad on (23rd July 2021). Have a look at the chart below for price analysis.

Source: Binance Charts

After the launch of Coin98 on Binance Launchpad, It pumped up to A$1.75 having +1850% gains in just a few minutes and the initial opening price of C98 was A$0.0958 at Binance Exchange with many different trading pairs like C98/BTC, C98/USDT, and C98/BUSD.

Currently, C98 is trading at A$1.45 price levels after breaking out the squeeze resistance in its sideways trend & now heading towards its all-time high price.

What do the technical indicators say?

The Coin98 TradingView indicators (on the 1 day) mainly indicate C98 as a strong buy, except the Oscillators which indicate C98 as a neutral.

So Why did Coin98 Breakout?

After the C98 opening at Binance Launchpad, mostly ICO’s pumps after going live on exchange for trade and, General market sentiment seems to suggest cryptos are hopefully turning back bull run season after recent massive price corrections. and then the suggested start of the Altcoins season could have contributed to the recent breakout. It could also be contributed to some recent news of Binance Listing.

Where to Buy or Trade Coin98?

Coin98 has the highest liquidity on Binance Exchange so that would help for trading C98/BTC, C98/BUSD, or C98/USDT pairs. However, you can also buy C98 from different exchanges listed on Coinmarketcap.

Categories
Crypto News Initial Coin Offering Market Analysis Trading

LIT Pumps +146% Amid listing on Binance Launchpad – Litentry Breakout Analysis

After the launch of Litentry on Binance Launchpad today, LIT took a strong Breakout with +146% gains in a single day. Let’s take a quick look at LIT, price analysis, and possible reasons for the recent breakout.

What is Litentry?

Decentralized identity authentication and user activity data management Infrastructure. Build on Substrate, Ready for Polkadot. Litentry is helping support change that is in favor of a user-centric network with the blockchain. Litentry includes an identity-based network and related tools, features an identity matching and identity staking mechanism, as a whole it consists of decentralized identity and user activity data management infrastructure.

Litentry Quick Stats

SYMBOL:LIT
Global rank:240
Market cap:$168,710,752 AUD
Current price:$11.41 AUD
All-time high price:$12.25 AUD
1 day:+146.26%
7 day:+160.70%
1 year:+160.74%

Litentry Price Analysis

At the time of writing, LIT is ranked 240th cryptocurrency globally and the current price is $11.41 AUD. This is a +160% increase since the launch of its ICO at Binance Launchpad on (4th February 2021). Have a look at the chart below for price analysis.

Source: TradingView

After the launch of Litentry on Binance Launchpad, It pumped up to $12.41 AUD having +394% gains in just a few minutes and the initial opening price of LIT was $2.85 AUD at Binance Exchange with many different trading pairs like LIT/BTC, LITL/USDT, and LIT/BUSD.

Currently, LIT is trading at $11.50 AUD price levels after breaking out the squeeze resistance in its sideways trend & now heading towards its all-time high price.

What do the technical indicators say?

The Litentry TradingView indicators (on the 1 day) mainly indicate LIT as a strong buy, except the Oscillators which indicate LIT as a neutral.

So Why did Litentry Breakout?

After the opening at Binance Launchpad, mostly ICO’s pumps after going live on exchange for trade and, the recent rise in Bitcoin over +300% since the halving in May and then the suggested start of the Altcoin season could have contributed to the recent breakout. It could also be contributed to some recent news of Exchange Listings.

Where to Buy or Trade Litentry?

Litentry has the highest liquidity on Binance Exchange so that would help for trading LIT/BTC or LIT/USDT pairs. However, you can also buy LIT from different exchanges listed on Coinmarketcap.
Categories
Crypto News Initial Coin Offering Market Analysis Trading

Frontier Breakout Analysis – FRONT Pumps +49% in a Single Day with Active Uptrend

Frontier FRONT is trading in uptrend here like many other altcoins. The Cryptocurrency FRONT just went up +49% in a single day by breaking a Falling wedge pattern with strong buying volume and surges over +60% in a week.

What is Frontier?

Frontier is a Chain Agnostic DeFi Aggregation layer. Using Frontier, Users can Track and Manage DeFi positions, Stake Assets, Swap or Exchange Assets and explore more DeFi Applications in one single place. Frontier is also building Frontier chain, which is a Decentralised Key Management blockchain based on Cosmos SDK.

Frontier Quick Stats

SYMBOL:FRONT
Global rank:563
Market cap:$13,882,001 AUD
Current price:$0.5937 AUD
All time high price:$1.11 AUD
1 day:+49.38%
7 day:+60.96%
1 year:+105.73%

FRONT Price Analysis

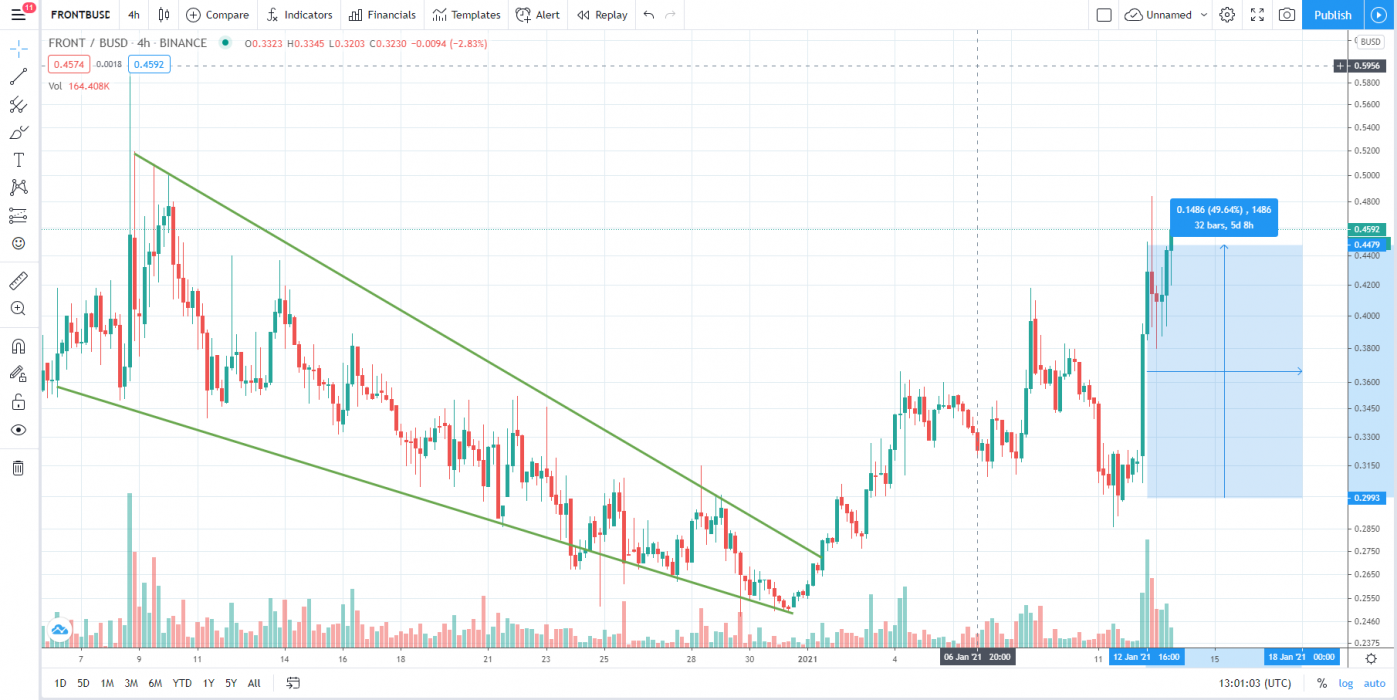
At the time of writing, FRONT is ranked 563rd cryptocurrency globally and the current price is $0.5937 AUD. This is a +60.96% increase since 7th January 2021 (7 days ago) as shown in the chart below.

Source: TradingView

After looking at the above 4-hour candle chart, we can clearly see that FRONT was trading inside the falling wedge pattern on the FRONT/BUSD pair. The first resistance was on the $0.3874 AUD price levels which FRONT broke with a strong bullish trend buying volume and is now heading towards the next monthly high prices. Seeing that many altcoins are waking up bullish this week, FRONT is likely to continue to increase in the uptrend.

“The Falling Wedge is a bullish pattern that begins wide at the top and contracts as prices move lower. This price action forms a cone that slopes down as the reaction highs and reaction lows converge.”

What do the Technical indicators say?

The FRONT TradingView indicators (on the 1 day) mainly indicate FRONT as a strong buy, except the Oscillators which indicate FRONT as a buy.

So Why did FRONT Breakout?

The recent rise in Bitcoin over +300% since the halving in May and then the suggested start of the Altcoin season could have contributed to the recent breakout. Another reason for this sudden pump in price could be the whales secretly buying FRONT for the next Altcoins rally & it could also be contributed to some of the recent news of Frontier Prize Pool.

Recent FRONT News & Events:

Where to Buy or Trade FRONT?

The Frontier FRONT has the highest liquidity on Binance Exchange so that would help for trading FRONT/ETH or FRONT/BUSD pairs. However, you can also buy FRONT from different exchanges listed on Coinmarketcap.

Categories
Crypto News Initial Coin Offering Market Analysis Trading

Paris Saint Germain Fan Token Breakout Analysis – PSG Pumps +216% in a Single Day on Binance

After the launch of Fan Token on Binance Launchpad today, PSG took a strong Breakout with +216% gains in a single day. Let’s take a quick look at PSG, price analysis, and possible reasons for the recent breakout.

What is Fan Token?

Tokens are generally assets that can represent proof of ownership or even membership. As tokens are already being used for a wide range of purposes, many specialized blockchains have been developed with native intent to support tokens, the most common of which is currently Ethereum and their ERC standard tokens. Socios.com is an app for football (soccer) fans, where users acquire voting rights to influence the clubs they support by acquiring club-specific Fan tokens.

Fan Token Quick Stats

SYMBOL:PSG
Global rank:268
Market cap:$72,764,396 AUD
Current price:$49.78 AUD
All-time high price:$57.12 AUD
1 day:+216.26%
7 day:+399.70%
1 year:+399.70%

Fan Token Analysis

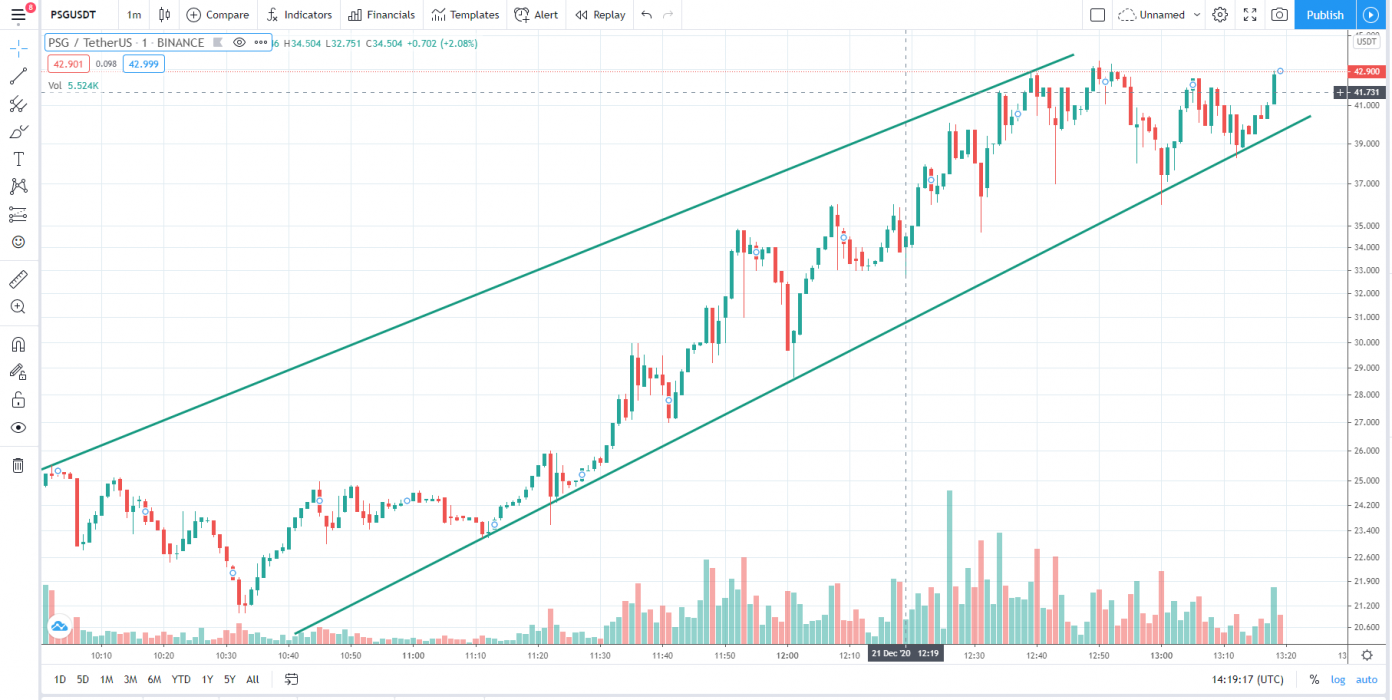
At the time of writing, PSG is ranked 268th cryptocurrency globally and the current price is $49.78 AUD. This is a +399.70% increase since the launch of its ICO at Binance Launchpad today (21st December 2020). Have a look at the chart below for price analysis.

Source: TradingView

After the launch of PSG on Binance Launchpad, It pumped up to $57.12 AUD having +399% gains in just a few hours and the initial opening price of PSG was $15.46 AUD at Binance Exchange with many different trading pairs like PSG/BTC, PSG/USDT, and PSG/BUSD.

Currently, PSG is trading at $49.78 AUD price levels after breaking out the squeeze resistance in its sideways trend & now heading towards its all-time high price.

What do the technical indicators say?

The PSG TradingView indicators (on the 1 day) mainly indicate PSG as a strong buy, except the Oscillators which indicate PSG as a neutral.

So Why did PSG Breakout?

After the opening at Binance Launchpad, mostly ICO’s pumps after going live on exchange for trade and, the recent rise in Bitcoin over 100% since the halving in May and then the suggested start of the Altcoin season could have contributed to the recent breakout. It could also be contributed to some recent news of the PSG Token on Binance Listings.

Recent PSG News & Events:

Where to Buy or Trade Graph?

The Fan Token has the highest liquidity on Binance Exchange so that would help for trading PSG/BTC, PSG/USDT, or PSG/BUSD pairs. However, you can also buy PSG from different exchanges listed on Coinmarketcap.

Categories
Crypto News Initial Coin Offering Market Analysis Trading

Graph Breakout Analysis – GRT Pumps +502% on Binance Launchpad

After the launch of Graph on Binance Launchpad today, GRT took a strong Breakout with +502% gains in a single day. Let’s take a quick look at GRT, price analysis, and possible reasons for the recent breakout.

What is Graph?

The Graph is an indexing protocol and global API for organizing blockchain data and making it easily accessible with GraphQL. Developers can use Graph Explorer to search, find, and publish all the public data they need to build decentralized applications. The Graph Network makes it possible to build serverless Decentralized Apps that run entirely on public infrastructure.

Graph Quick Stats

SYMBOL:GRT
Global rank:71
Market cap:$296,431,814 AUD
Current price:$0.3519 AUD 
All-time high price:$0.4670 AUD
1 day:+502.26%
7 day:+527.70%
1 year:+527.70%

Graph Price Analysis

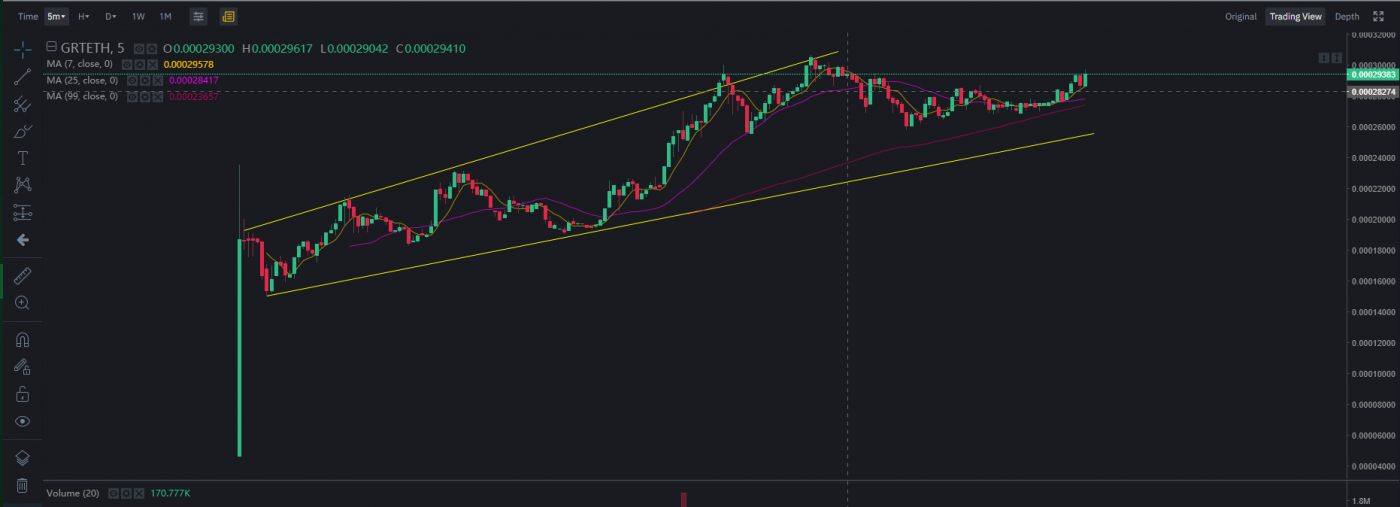
At the time of writing, GRT is ranked 71st cryptocurrency globally and the current price is $0.3519 AUD. This is a +502.26% increase since the launch of its ICO at Binance Launchpad today (18th December 2020). Have a look at the chart below for price analysis.

Source: Binance TradingView

After the launch of Graph on Binance Launchpad, It pumped up to $0.4670 AUD having +502% gains in just a few hours and the initial opening price of GRT was $0.0813 AUD at Binance Exchange with many different trading pairs like GRT/BTC, GRT/USDT, and GRT/ETH.

Currently, GRT is trading at $0.3519 AUD price levels after breaking out the squeeze resistance in its sideways trend & now heading towards its all-time high price.

What do the technical indicators say?

The Graph TradingView indicators (on the 1 day) mainly indicate GRT as a strong buy, except the Oscillators which indicate GRT as a neutral.

So Why did Graph Breakout?

After the opening at Binance Launchpad, mostly ICO’s pumps after going live on exchange for trade and, the recent rise in Bitcoin over 100% since the halving in May and then the suggested start of the Altcoin season could have contributed to the recent breakout. It could also be contributed to some recent news of The Graph Mainnet Launch.

Recent Graph News & Events:

Where to Buy or Trade Graph?

The graph has the highest liquidity on Binance Exchange so that would help for trading GRT/BTC, GRT/ETH, or GRT/USDT pairs. However, you can also buy GRT from different exchanges listed on Coinmarketcap.

Categories
Crypto News Initial Coin Offering Market Analysis Trading

Hard Protocol Breakout Analysis – HARD Gains +21% in a Day on Binance Launchpad

After the launch of Hard Protocol on Binance Launchpad, HARD was trading sideways with strong buying volume and took a breakout today with +21% gains. Let’s take a quick look at HARD, price analysis, and possible reasons for the recent breakout.

What is Hard Protocol?

HARD Protocol is a decentralized money market built on Kava, enabling the lending and borrowing of cross-chain assets. HARD Protocol supports supply-side deposits for BTC, XRP, BNB, BUSD, and USDX. The platform will allow overcollateralized borrowing for supported assets.

HARD Quick Stats

SYMBOL:HARD
Global rank:289
Market cap:$43,643,209 AUD
Current price:$1.23 AUD
All-time high price:$1.59 AUD
1 day:+21.2%
7 day:+56.7%
1 year:+78.3%

HARD Price Analysis

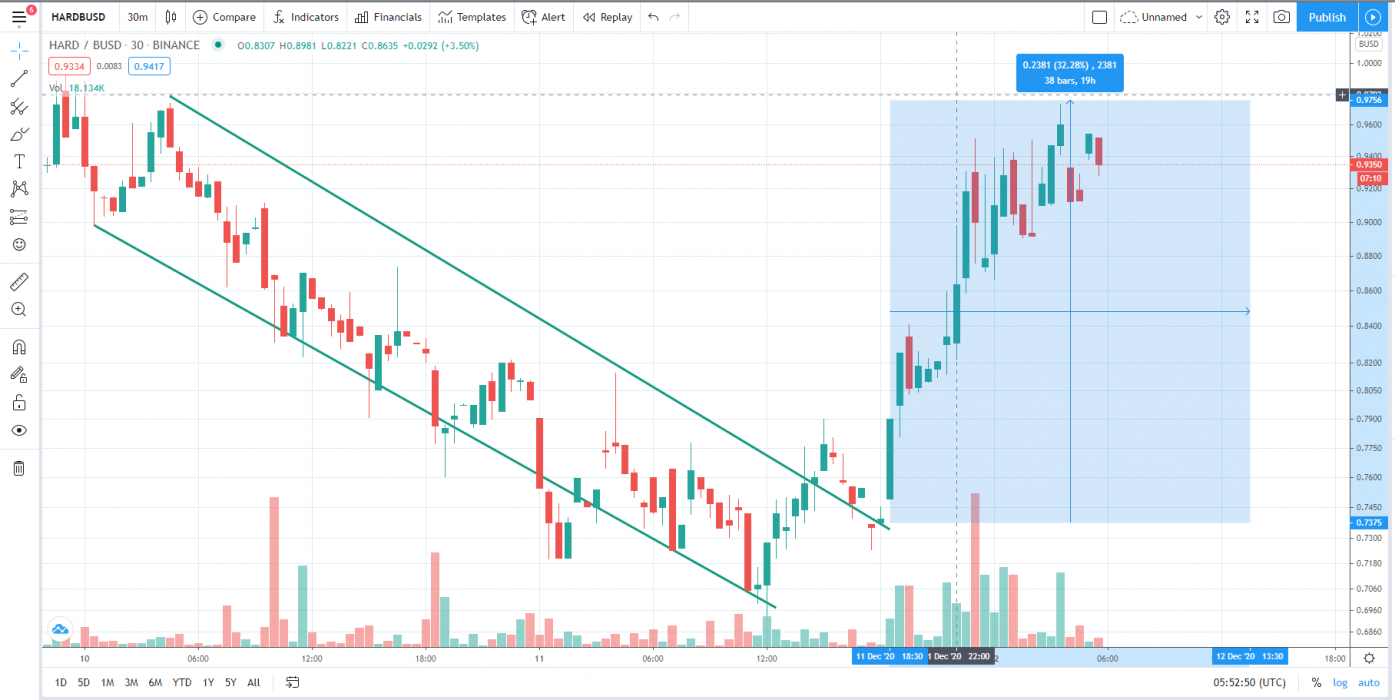
At the time of writing, HARD is ranked 289th cryptocurrency globally and the current price is $1.23 AUD with an All-time +78.3% increase since the launch of its ICO at Binance Launchpad. Have a look at the chart below for price analysis.

Source: TradingView

After the launch of HARD on Binance Launchpad, It pumped up to $3.95 AUD having +296% gains in just a few hours and the initial opening price of HARD was $0.83 AUD at Binance Exchange with many different trading pairs like HARD/BTC, HARD/BUSD, and HARD/USDT.

Currently, HARD is trading at $1.23 AUD price levels after breaking out the falling wedge pattern in its sideways trend & now HARD is heading towards its all-time high price facing some previous weekly resistances.

What do the technical indicators say?

The HARD TradingView indicators (on the 1 day) mainly indicate HARD as a strong buy, except the Oscillators which indicate HARD as a buy.

So Why did HARD Breakout?

After the opening at Binance Launchpad, mostly ICO’s pumps after going live on exchange for trade and, the recent rise in Bitcoin over 100% since the halving in May and then the suggested start of the Altcoin season could have contributed to the recent breakout. It could also be contributed to some recent news of Hard Margin Trading on Binance.

Recent HARD News & Events:

Where to Buy or Trade HARD?

Hard Protocol has the highest liquidity on Binance Exchange so that would help for trading HARD/USDT or HARD/BTC pairs. However, you can also buy from other different exchanges listed in Coinmarketcap.

Categories
Crypto News Initial Coin Offering Market Analysis Trading

Venus XVS Breakout Analysis – XVS Performing Active Uptrend with +50% Gains in a Day

Venus is trading in active uptrend here like many other altcoins are. The Cryptocurrency Venus XVS just went up +50% in a single day and surges over +76% in a week.

What is Venus?

Venus is an algorithmic money market and synthetic stablecoin protocol launched exclusively on Binance Smart Chain BSC. The protocol introduces simple-to-use crypto-asset lending and borrowing solution to the decentralized finance DeFi ecosystem, enabling users to directly borrow against collateral at high speed while losing less to transaction fees. In addition, Venus allows users to mint VAI stablecoins on-demand within seconds by posting at least 200% collateral to the Venus smart contract.

Venus Quick Stats

SYMBOL:XVS
Global rank:195
Market cap:$42,887,723 AUD
Current price:$5.80 AUD
All time high price:$7.22 AUD
1 day:+50.5%
7 day:+76.6%
1 year:+83.74%

Venus Price Analysis

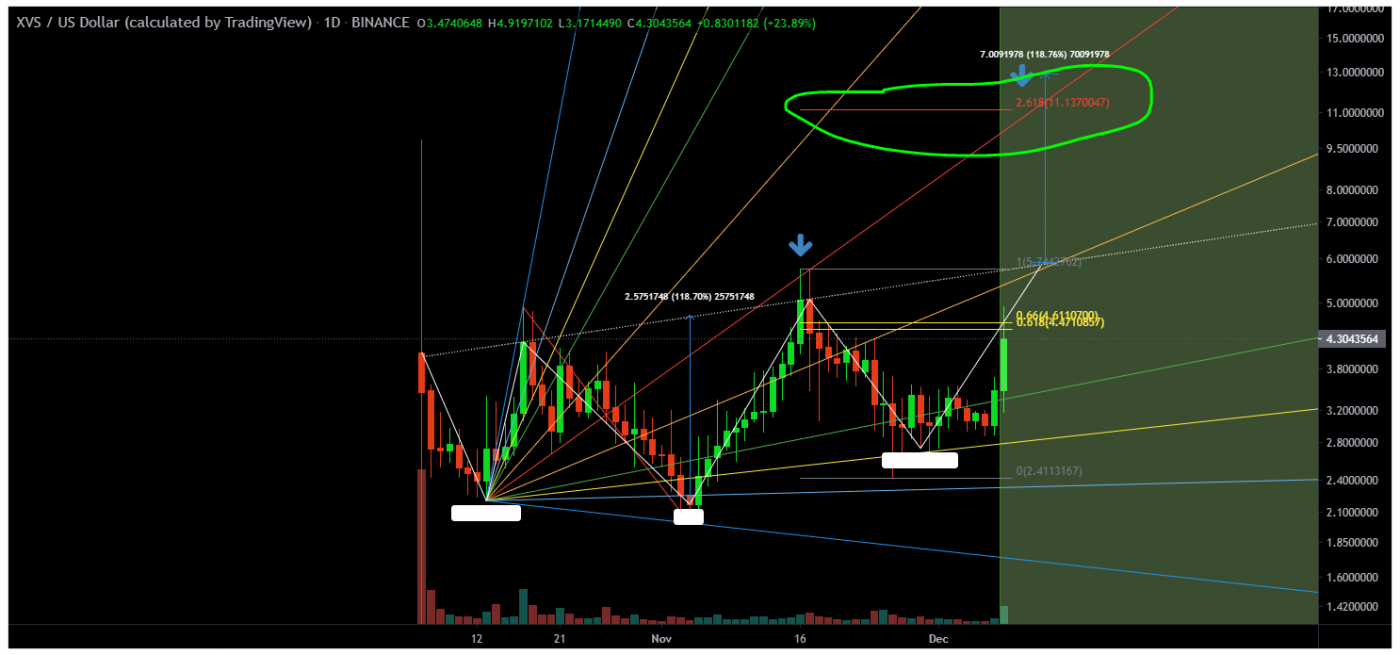
At the time of writing, Venus is ranked 195th cryptocurrency globally and the current price is $5.80 AUD. This is a +76.6% increase since 2nd December 2020 (7 days ago) as shown in the chart below.

Source: TradingView

Price already increased a little bit after the Venus announcement yesterday, and then XVS did an awesome breakout from this bearish rectangle by breaking all previous resistances & is now currently trading at $5.80 AUD price levels.

“The bearish rectangle is a continuation pattern that occurs when a price pauses during a strong downtrend and temporarily bounces between two parallel levels before the trend continues.”

What do the technical indicators say?

The Venus TradingView indicators (on the 1 day) mainly indicate XVS as a buy, except the Moving Averages which indicate XVS as a strong buy.

So Why did XVS Breakout?

The recent rise in Bitcoin over 100% since the halving in May and then the suggested start of the Altcoin season could have contributed to the recent breakout. Another reason could be the whales, secretly stacking up XVS to their portfolio for the upcoming Altcoins rally. It could also be contributed to some of the recent news where they announced adding Top 3 Cryptos to VenusProtocol.

Recent Venus News & Events:

Where to Buy or Trade Venus?

Venus has the highest liquidity on Binance Exchange so that would help for trading XVS/USDT or XVS/BTC pairs. However, if you’re just looking at buying some quick and hodling then Swyftx Exchange is a popular choice in Australia.

Categories
Crypto News Initial Coin Offering Market Analysis Trading

UNIFI Protocol DAO Breakout Analysis – UNFI Pumps +85% in a Single Day

After the launch of UNFI Protocol DAO on Binance Launchpool. UNFI was flipping on a 4-hour candle chart & took a strong Breakout again with +85% gains in a single day. Let’s take a quick look at UNFI, price analysis, and possible reasons for the recent breakout.

What is Unifi?

Unifi Protocol DAO is a group of non-custodial, interoperable, decentralized, multi-chain smart contracts providing the building blocks for DeFi development. The project provides a bridge to connect the economy of Ethereum-based DeFi products to the growing DeFi markets on other blockchains. uTrade, a decentralized Automated Market Maker (AMM) and token exchange, is the first product built on the Unifi Protocol DAO smart contracts.

Unifi Quick Stats

SYMBOL:UNFI
Global rank:303
Market cap:$36,421,511 AUD
Current price:$18.03 AUD
All-time high price:$19.10 AUD
1 day:+85.4%
7 day:+203.70%
1 year:+305.74%

Unifi Price Analysis

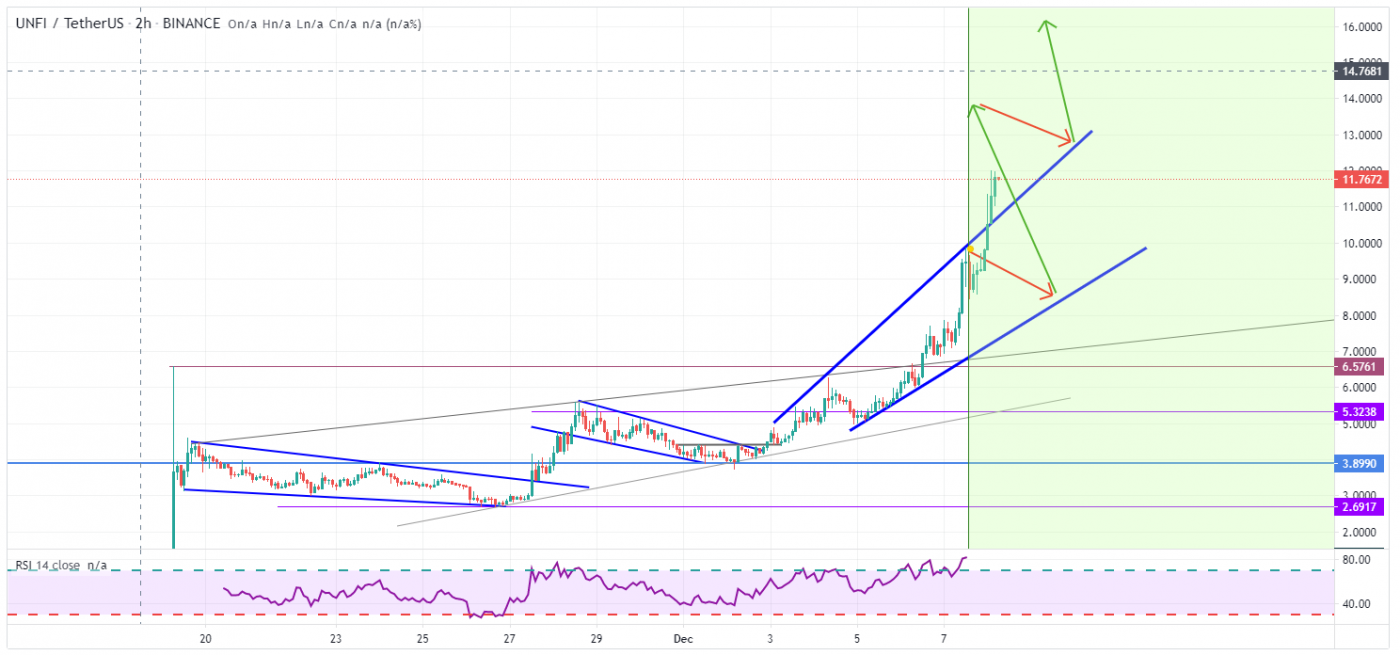
At the time of writing, UNFI is ranked 303rd cryptocurrency globally and the current price is $18.03 AUD. This is a +305.74% increase since the launch of its ICO at Binance Launchpool on 19 November 2020 as shown in the chart below.

Source: TradingView

After the launch of Unifi on Binance Launchpool, It pumped up to $8.12 AUD having +300% gains in few hours and the initial opening price of UNFI was $2.1 AUD at Binance Exchange with many different trading pairs like UNFI/BTC, UNFI/USDT, and UNFI/BUSD.

Currently, UNFI is trading at $18.03 AUD price levels after breaking out the squeeze resistance in its sideways trend & now heading towards its all-time high price with a strong bullish trend.

Source: TradingView

What do the technical indicators say?

The Unifi TradingView indicators (on the 1 day) mainly indicate UNFI as a buy, except the Oscillators which indicate UNFI as a strong sell.

So Why did UNFI Breakout?

The recent rise in Bitcoin over 100% since the halving in May and then the suggested start of the Altcoin season could have contributed to the recent breakout. It could also be contributed to some recent news where UNFI Protocol was Live on Ethereum

Recent UNFI News & Events:

Where to Buy or Trade UNFI?

UNFI has the highest liquidity on Binance Exchange so that would help for trading UNFI/USDT or UNFI/BTC pairs. However, if you’re just looking at buying some quick and hodling then Swyftx Exchange is a popular choice in Australia.

Categories
Crypto News Initial Coin Offering Market Analysis Trading

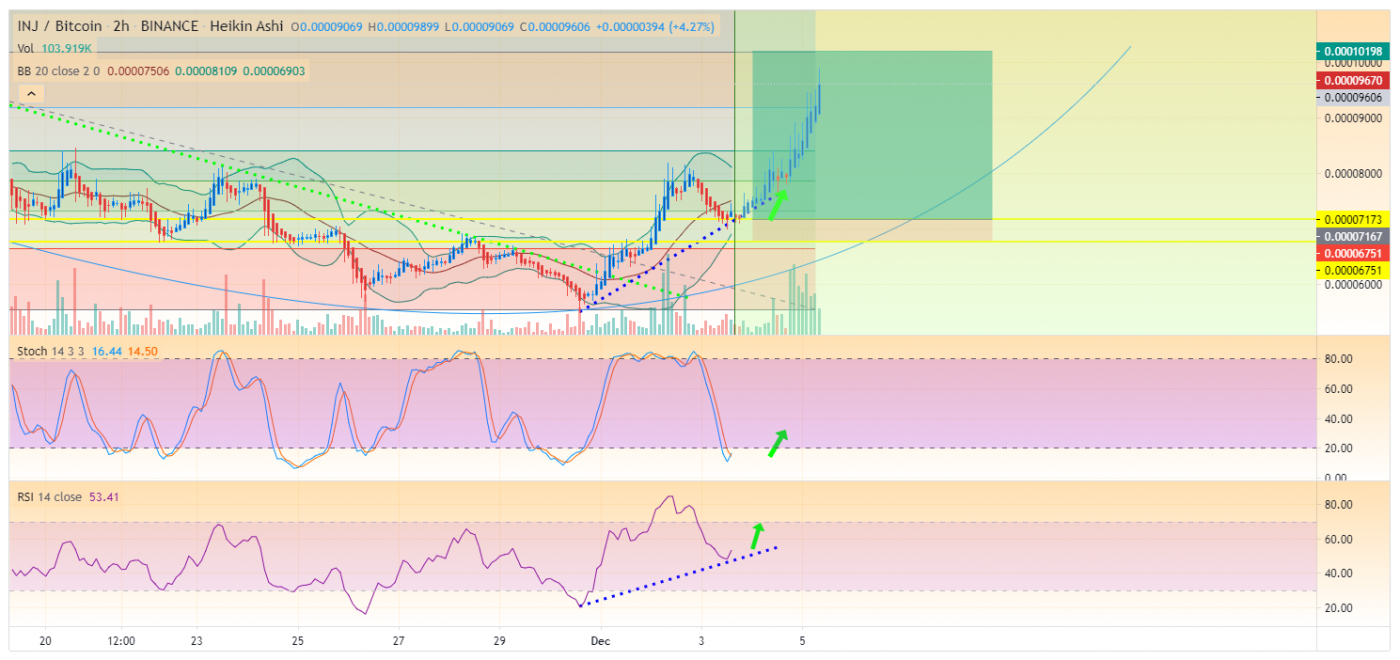
Injective Protocol Breakout Analysis–INJ Pumps +70% in a Week on Binance Launchpad

After the launch of Injective Protocol on Binance Launchpad, INJ took a strong Breakout with +70% gains in a week. Let’s take a quick look at INJ, price analysis, and possible reasons for the recent breakout.

What is Injective Protocol?

Injective is the first front-running resistant, layer-2 exchange protocol that unlocks the full potential of borderless finance by supporting margin trading, derivatives, and futures.

INJ Quick Stats

SYMBOL:INJ
Global rank:318
Market cap:$36,295,556 AUD
Current price:$2.41 AUD
All-time high price:$2.60 AUD
1 day:+18.2%
7 day:+70.7%
1 year:+161.3%

INJ Price Analysis

At the time of writing, INJ is ranked 318th cryptocurrency globally and the current price is $2.41 AUD. This is a +161.3% increase since the launch of its ICO at Binance Launchpad. Have a look at the chart below for price analysis.

Source: TradingView

After the launch of INJ on Binance Launchpad, It pumped up to $2.60 AUD having +385% gains in just a few hours and the initial opening price of INJ was $0.73 AUD at Binance Exchange with many different trading pairs like INJ/BTC, INJ/BNB, and INJ/ETH.

Currently, INJ is trading at $2.41 AUD price levels after breaking out the squeeze resistance in its sideways trend & now INJ is heading towards making a new all-time high price.

Source: TradingView

What do the technical indicators say?

The INJ TradingView indicators (on the 1 day) mainly indicate INJ as a strong buy, except the Oscillators which indicate INJ as a buy.

So Why did INJ Breakout?

After the opening at Binance Launchpad, mostly ICO’s pumps after going live on exchange for trade and, the recent rise in Bitcoin over 100% since the halving in May and then the suggested start of the Altcoin season could have contributed to the recent breakout. It could also be contributed to some recent news of Solstice Testnet Launch.

Recent INJ News & Events:

Where to Buy or Trade INJ?

INJ has the highest liquidity on Binance Exchange so that would help for trading INJ/USDT or INJ/BTC pairs. However, if you’re just looking at buying some quick and hodling then Swyftx Exchange is a popular choice in Australia.

Categories
Crypto News Initial Coin Offering Market Analysis Trading

SKALE Network Breakout Analysis – SKL Pumps +173% on Binance Launchpad

After the launch of Skale Network on Binance Launchpad today, SKL took a strong Breakout with +173% gains in a single day. Let’s take a quick look at SKL, price analysis, and possible reasons for the recent breakout.

What is Skale?

SKALE Network’s modular protocol is one of the first of its kind to allow developers to easily provision highly configurable blockchains, which provide the benefits of decentralization without compromising on computation, storage, or security.

Skale Quick Stats

SYMBOL:SKL
Global rank:269
Market cap:$62,644,180 AUD
Current price:$0.1138 AUD
All-time high price:$0.1969 AUD
1 day:+173.26%
7 day:+255.70%
1 year:+256.74%

Skale Price Analysis

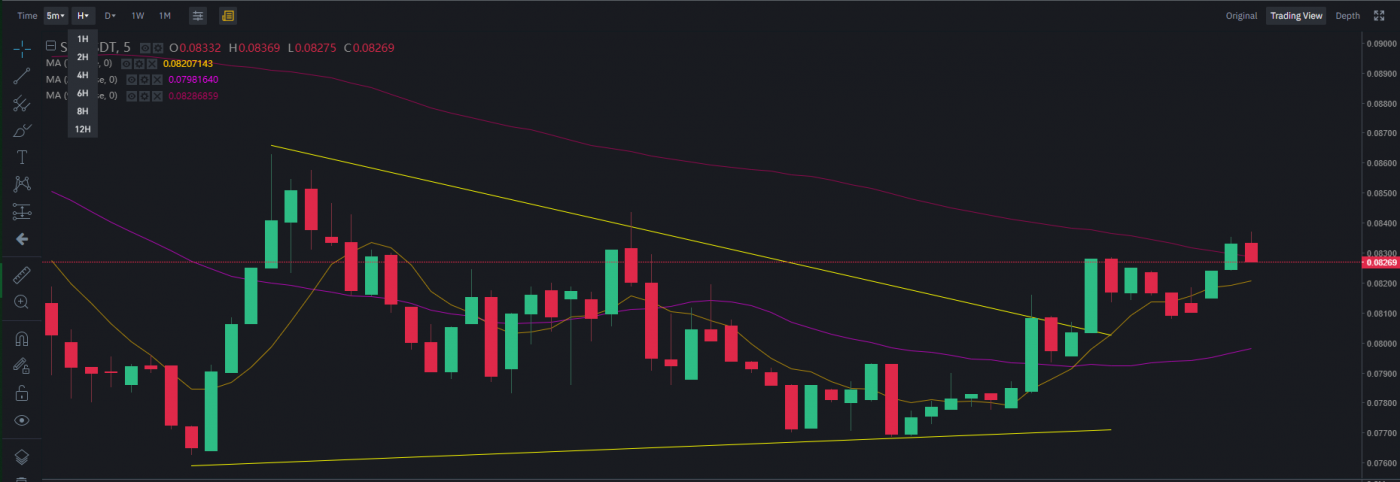
At the time of writing, SKL is ranked 269th cryptocurrency globally and the current price is $0.1138 AUD. This is a +173.26% increase since the launch of its ICO at Binance Launchpad today (1 December 2020). Have a look at the chart below for price analysis.

Source: Binance-TradingView

After the launch of Skale on Binance Launchpad, It pumped up to $0.1912 AUD having +385% gains in just a few minutes and the initial opening price of SKL was $0.0413 AUD at Binance Exchange with many different trading pairs like SKL/BTC, SKL/USDT, and SKL/BUSD.

Currently, SKL is trading at $0.1138 AUD price levels after breaking out the squeeze resistance in its sideways trend & now heading towards its all-time high price.

What do the technical indicators say?

The Skale TradingView indicators (on the 1 day) mainly indicate SKL as a strong buy, except the Oscillators which indicate SKL as a neutral.

So Why did Skale Breakout?

After the opening at Binance Launchpad, mostly ICO’s pumps after going live on exchange for trade and, the recent rise in Bitcoin over 100% since the halving in May and then the suggested start of the Altcoin season could have contributed to the recent breakout. It could also be contributed to some recent news where Skale gets listed on more exchanges.

Recent Skale News & Events:

Where to Buy or Trade Skale?

Skale has the highest liquidity on Binance Exchange so that would help for trading SKL/USDT or SKL/BTC pairs. However, if you’re just looking at buying some quick and hodling then Swyftx Exchange is a popular choice in Australia.