Categories
Crypto News IOST Market Analysis Polkadot Stellar Trading

Top 3 Coins to Watch Today: XLM, IOST, DOT – June 29 Trading Analysis

Let’s take a closer look at today’s altcoins showing breakout signals. We’ll explain what the coin is, then dive into the trading charts and provide some analysis to help you decide.

1. Stellar (XLM)

Stellar XLM is an open network that allows money to be moved and stored. When it was released, the goal was boosting financial inclusion by reaching the world’s unbanked – but soon after, its priorities shifted to helping financial firms connect with one another via blockchain technology. The network’s native token, lumens, serves as a bridge that makes it less expensive to trade assets across borders. All of this aims to challenge existing payment providers who often charge high fees for a similar service.

XLM Price Analysis

At the time of writing, XLM is ranked the 24th cryptocurrency globally and the current price is US$0.1164. Let’s take a look at the chart below for price analysis:

Source: TradingView

XLM set a high near $0.2357 in Q2 before retracing nearly 70% to find a low near $0.1058. The price consolidated around this level before the strong bullish impulse over the past several days.

Probable resistance near $0.1370 is slowing the bullish advance down. However, another leg might target the last swing high at $0.1424 and relatively equal highs at $0.1550. Resistance near $0.1759 could cap the move before the second swing high. Beyond these levels, little stands in the bulls’ way before reaching the swing high near $0.1856.

A retracement before a move higher might find support in the daily gap near $0.1104, just above the weekly open. Relatively equal lows near $0.1035 could also provide support. Run-on stops at $0.0984 and $0.09174 might find support in the gap beginning near $0.08312.

2. Iost (IOST)

IOST‘s blockchain infrastructure is open-source and designed to be secure and scalable, all in the hope it will serve as the backbone for online services in the future. One of the biggest challenges IOST aims to resolve centres on how big companies may not be able to embrace blockchains in a customer-facing environment unless they are scalable. The Internet of Services Token is put forward as a way of tackling this problem.

IOST Price Analysis

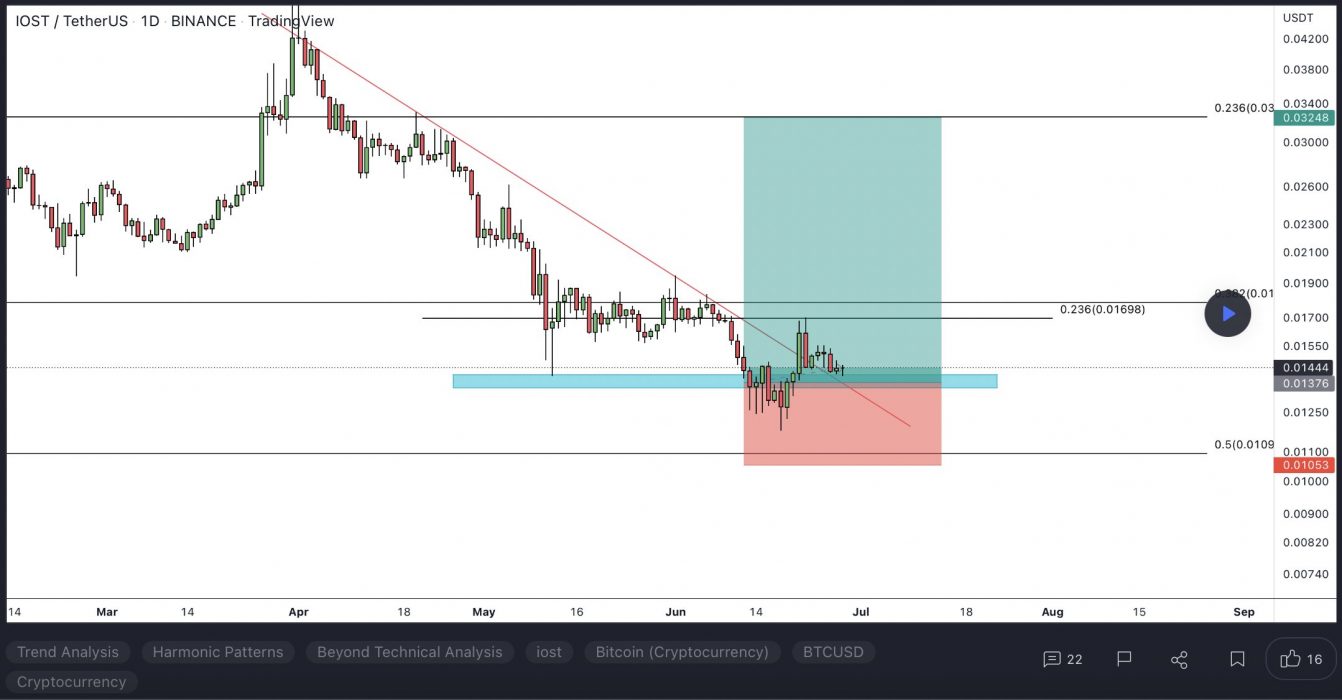
At the time of writing, IOST is ranked the 109th cryptocurrency globally and the current price is US$0.01418. Let’s take a look at the chart below for price analysis:
Source: TradingView

IOST rallied 95% during late March and almost set new monthly highs before selling off 45% into its weekly low.

A retest of the monthly open, near $0.02625, started a new wave of selling in early May. The subsequent break of the weekly open created a new area of resistance between $0.01959 and $0.01863 – an area that is also inefficiently traded and has confluence with the 9 and 18 EMAs.

If this resistance breaks, a move toward the monthly highs might find resistance between $0.02174 and $0.02270. Any potential move through this resistance will likely find a ceiling near an inefficient higher-timeframe level at $0.02730.

Old support near $0.01389 created a sharp bullish reaction in late June. This region, down to $0.01274, could provide support again. 

However, a longer-term bottom is more likely to be found between $0.01027 and $0.00963, where higher-timeframe charts show an inefficiently traded area.

3. Polkadot (DOT)

Polkadot DOT is an open-source sharding multichain protocol that facilitates the cross-chain transfer of any data or asset types, not just tokens, thereby making a wide range of blockchains interoperable with each other. Polkadot’s native DOT token serves three clear purposes: providing network governance and operations, and creating parachains by bonding. The Polkadot protocol connects public and private chains, permissionless networks, oracles and future technologies, allowing these independent blockchains to trustlessly share information and transactions through the Polkadot relay chain.

DOT Price Analysis

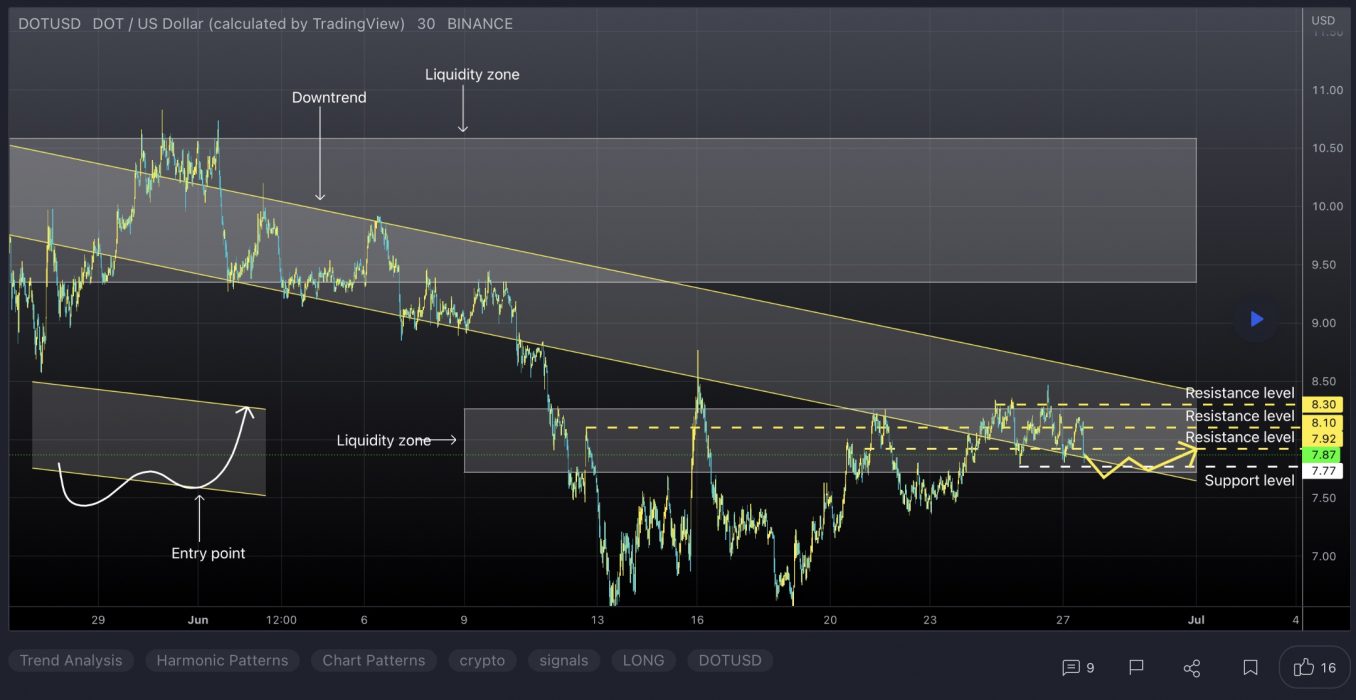
At the time of writing, DOT is ranked the 11th cryptocurrency globally and the current price is US$7.61. Let’s take a look at the chart below for price analysis:
Source: TradingView

DOT has retraced nearly 70% after Q2, showing little sign of interest from buyers.

June’s consolidation at possible support from $9.85 to $7.10 broke down with the rest of the market last month, turning this into likely resistance on future retests. This area now has confluence with the 9 and 18 EMAs.

If market conditions turn and this resistance breaks, an area near the midpoint of Q2 consolidation range, near $8.70, and the monthly high near $10.58 may see profit-taking from bulls.

The first test of possible support near $7.10 has showed some sensitivity. Still, continued bearishness in the market will likely cause a break of this level.

A break of this support might continue to drop to the next possible support near $6.80, running stops under the Q3 2021 swing low. If this level gives support and begins a consolidation forming a bottom, bulls might wait for a wick below to possible support from $6.15 to $5.70.

Learn How to Trade Live!

Join Dave and The Crypto Den Crew and they’ll show you live on a webinar how to take your crypto trading to the next level.

Where to Buy or Trade Altcoins?

These coins have high liquidity on Binance Exchange, so that could help with trading on AUD/USDT/BTC pairs. And if you’re looking at buying and HODLing cryptos, then Swyftx Exchange is an easy-to-use popular choice in Australia.

Categories
Axie Infinity Crypto News IOST Market Analysis Ren Trading

Top 3 Coins to Watch Today: AXS, REN, IOST – April 6 Trading Analysis

Let’s take a closer look at today’s altcoins showing breakout signals. We’ll explain what the coin is, then dive into the trading charts and provide some analysis to help you decide.

1. Axie Infinity (AXS)

Axie Infinity AXS is a blockchain-based trading and battling game that is partially owned and operated by its players. The Axie Infinity ecosystem has its own unique governance token, known as Axie Infinity Shards AXS. These are used to participate in key governance votes and give holders a say in how funds in the Axie Community Treasury are spent.

AXS Price Analysis

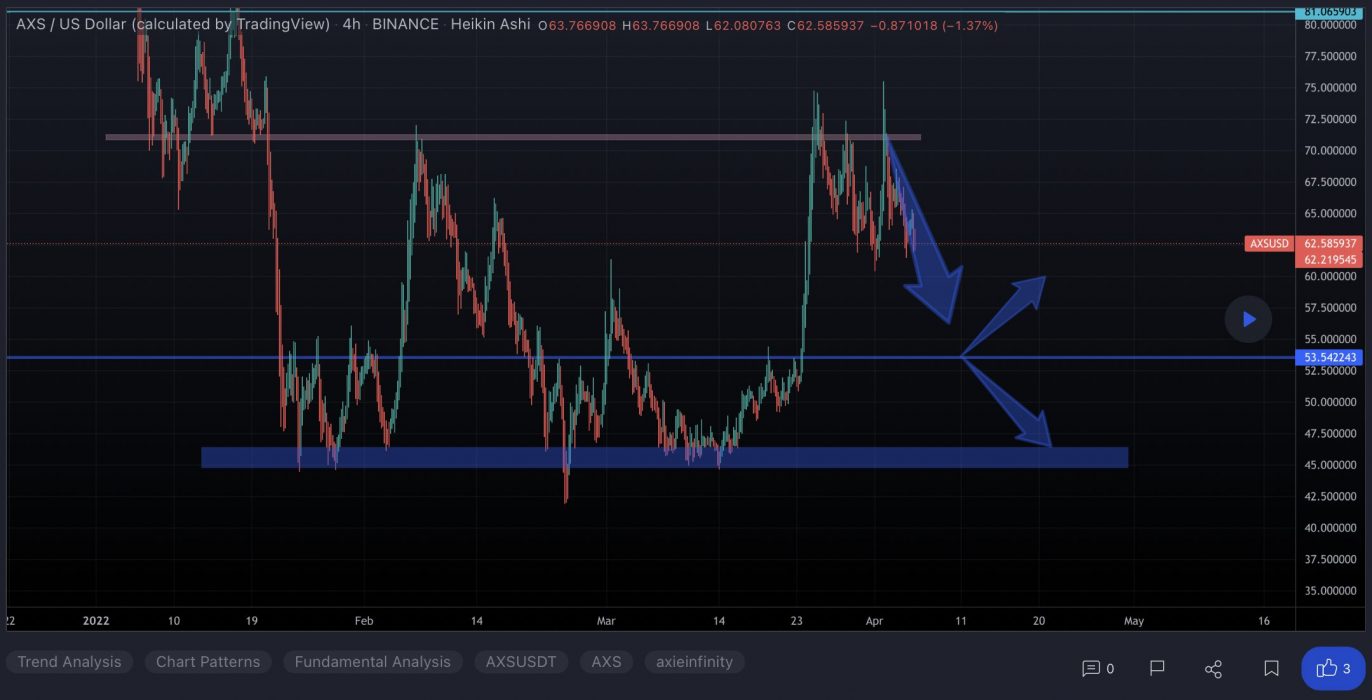
At the time of writing, AXS is ranked the 40th cryptocurrency globally and the current price is US$62.28. Let’s take a look at the chart below for price analysis:

Source: TradingView

AXS‘s relatively small 30% range could suggest that a larger move is setting up in April.

Aggressive bulls could look for entries at the most recent area of support formed near $60.22. However, equal lows near $56.12 make a tempting target for a stop run into this support. This move could reach support near $53.67. 

A decisive move to the downside could run stops below the second set of relatively equal lows near $50.23, possibly reaching support at an old swing high and a daily gap near $47.58.

A recent level near $69.84 provided resistance and caused a swing high to form near $75.88, offering first targets. A move through this high may arrive at new monthly high levels near $80.31 and $86.30.

2. Ren (REN)

REN is an open protocol built to provide interoperability and liquidity between different blockchain platforms. The protocol’s native token, REN, functions as a bond for those running nodes that power RenVM, known as Darknodes. REN aims to expand the interoperability, and hence accessibility, of decentralised finance (DeFi) by removing hurdles involved in liquidity between blockchains.

REN Price Analysis

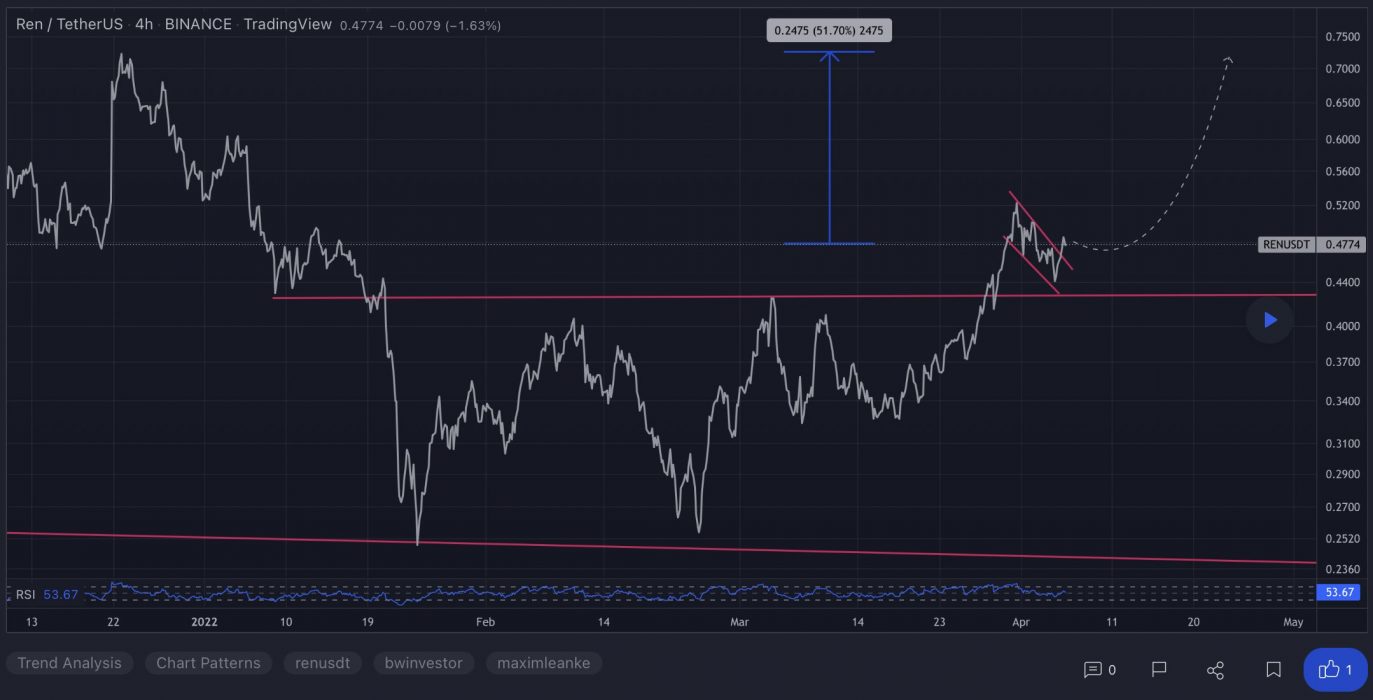
At the time of writing, REN is ranked the 146th cryptocurrency globally and the current price is US$0.4801. Let’s take a look at the chart below for price analysis:

Source: TradingView

REN bulls have enjoyed over 80% returns since Q1 2022, with little resistance above to end the current price discovery.

The price may find support near $0.4256. Still, aggressive bulls should be wary of a potential stop run under the monthly open into support near $0.4013. The area around $0.3750 should provide strong support if the price reaches this low.

The air above the current price is thin, but the level near $0.5326 could potentially provide some resistance in the short term. Extensions reaching near $0.5977 and $0.6492 make reasonable take-profit zones if the bullish trend continues.

3. Iost (IOST)

IOST‘s blockchain infrastructure is open-source and designed to be secure and scalable, all in the hope that it will serve as the backbone for online services in the future. One of the biggest challenges that IOST aims to resolve centres on how big companies may not be able to embrace blockchains in a customer-facing environment unless they are scalable. The Internet of Services Token is put forward as a way of tackling this problem.

IOST Price Analysis

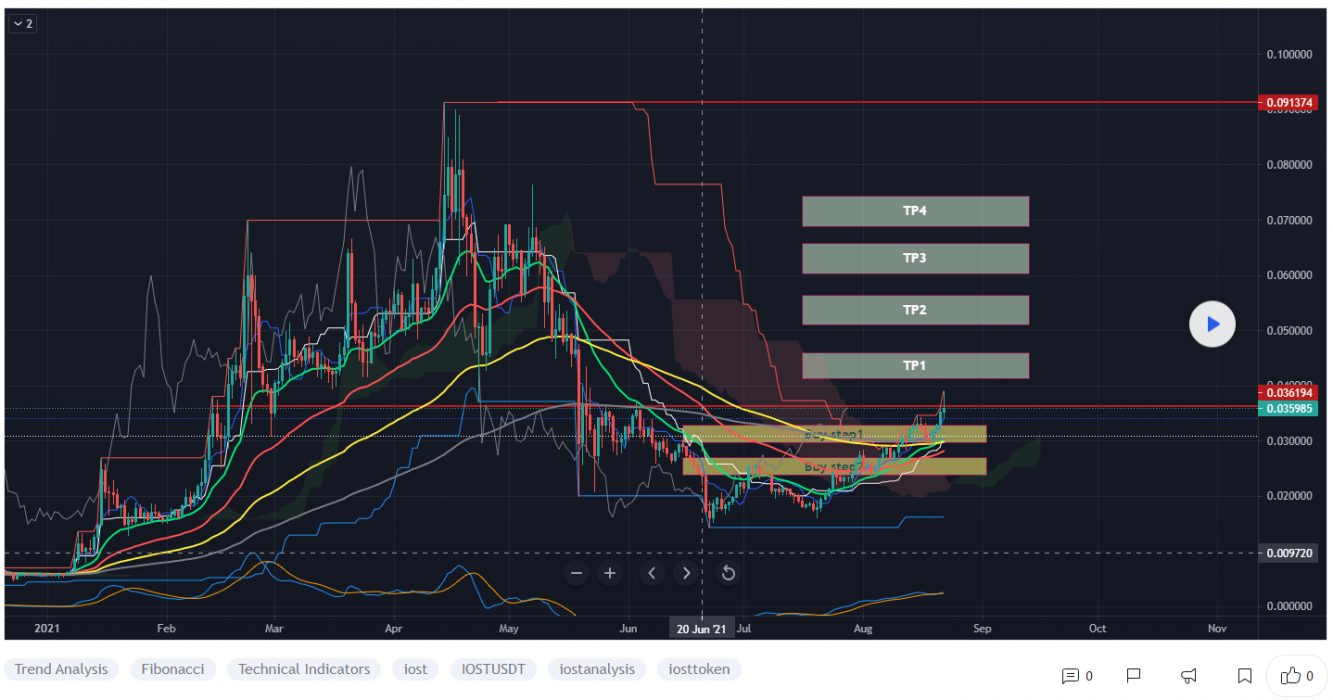
At the time of writing, IOST is ranked the 118th cryptocurrency globally and the current price is US$0.0355. Let’s take a look at the chart below for price analysis:

Source: TradingView

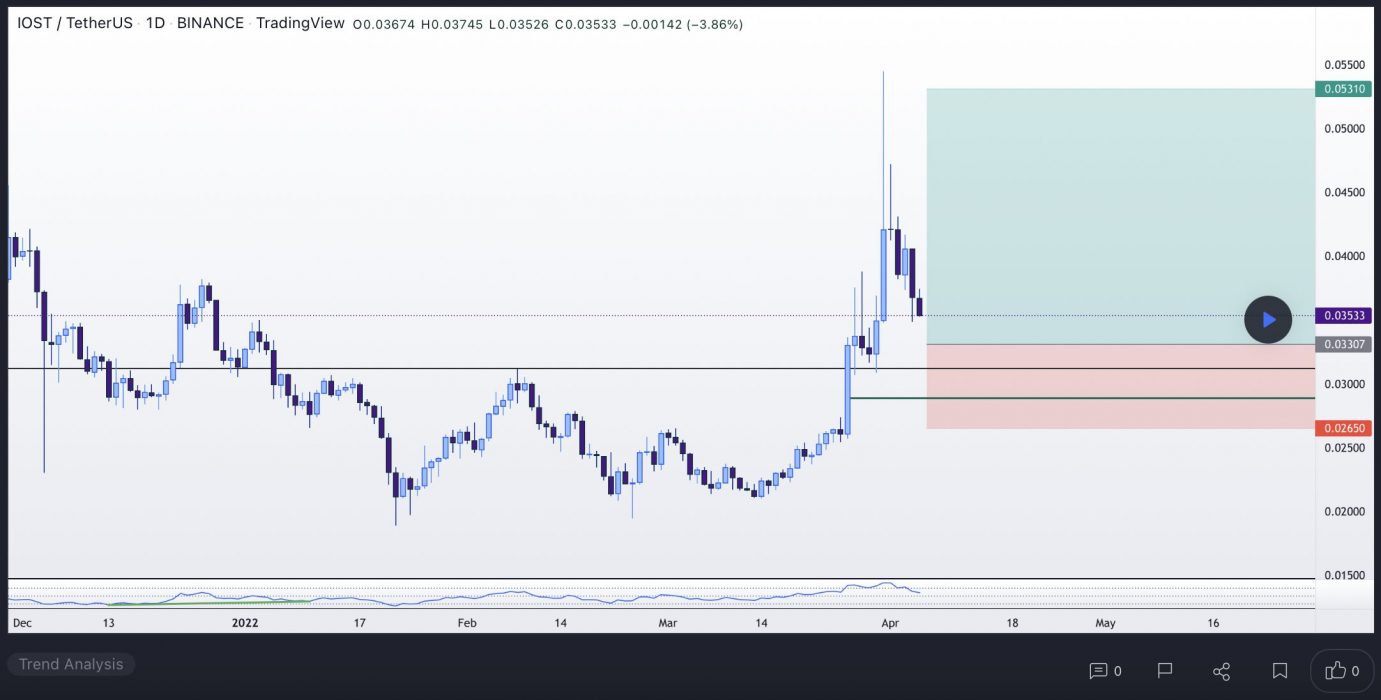
IOST rallied 95% during March and almost set new monthly highs before selling off 30% into its weekly low.

A retest of the monthly open, near $0.03625, started a new wave of selling in early April. The subsequent break of the weekly open created a new area of resistance between $0.04159 and $0.04363 – an area that is also inefficiently traded and has confluence with the 9 and 18 EMAs.

If this resistance breaks, a move toward the monthly highs might find resistance between $0.04074 and $0.04570. Any potential move through this resistance will likely find a ceiling near an inefficient higher-timeframe level at $0.04930.

Old support near $0.03289 created a sharp bullish reaction in late March. This region, down to $0.03074, could provide support again. 

However, a longer-term bottom is more likely to be found between $0.02827 and $0.02690, where higher-timeframe charts show an inefficiently traded area.

Learn How to Trade Live!

Join Dave and The Crypto Den Crew and they’ll show you live on a webinar how to take your crypto trading to the next level.

Where to Buy or Trade Altcoins?

These coins have high liquidity on Binance Exchange, so that could help with trading on AUD/USDT/BTC pairs. And if you’re looking at buying and HODLing cryptos, then Swyftx Exchange is an easy-to-use popular choice in Australia.

Categories
BitTorrent Crypto News IOST Market Analysis Swipe Trading

Top 3 Coins to Watch Today: BTT, IOST, SXP – February 22 Trading Analysis

Let’s take a closer look at today’s altcoins showing breakout signals. We’ll explain what the coin is, then dive into the trading charts and provide some analysis to help you decide.

1. BitTorrent (BTT)

BitTorrent BTT is a popular peer-to-peer (P2P) file-sharing and torrent platform which has become increasingly decentralised in recent years. Since its acquisition, BitTorrent has added various new tools, with a dedicated native cryptocurrency token, BTT, released in February 2019. BTT was launched on TRON’s own blockchain, using its TRC-10 standard. According to its official literature, BitTorrent is currently the world’s “largest decentralised P2P communications protocol”.

BTT Price Analysis

At the time of writing, BTT is ranked the 50th cryptocurrency globally and the current price is US$0.00000201. Let’s take a look at the chart below for price analysis:

Source: TradingView

BTT has been in a higher-timeframe downtrend since its 4,790% pump during Q1 2021. From late June 2021, the price has ranged between approximately $0.000004598 and $0.000002677.

Old swing lows near the current price recently broke. This approximate area, near the higher-timeframe range low, could offer support again on higher-timeframes. 

However, the current macro market conditions suggest further downside. Multiple retests of a level – in this case, the fourth retest – and traders “selling the news” of February 22’s Mainnet launch increase the probability of this region turning to resistance. 

The daily chart suggests that a zone around the February open, from $0.0000020300 to $0.0000021078, may offer resistance – although the price might reach as high as $0.0000021799.

A break of this resistance could run short stops into higher-timeframe resistance around $0.000002557 – near the 2022 yearly open. If the price does reach this far, volatile price action in this area hints at resistance between $0.000002557 and $0.000003382. 

Short-term rallies may occur, but the price is more likely to find a long-term bottom in an inefficient area above 2020’s accumulation range. This area reaches from $0.000001042 to $0.0000005337, with $0.0000009500 starting higher-probability support.

2. Iost (IOST)

IOST‘s blockchain infrastructure is open-source and designed to be secure and scalable, all in the hope that it will serve as the backbone for online services in the future. One of the biggest challenges that IOST aims to resolve centres on how big companies may not be able to embrace blockchains in a customer-facing environment unless they are scalable. The Internet of Services Token is put forward as a way of tackling this problem.

IOST Price Analysis

At the time of writing, IOST is ranked the 134th cryptocurrency globally and the current price is US$0.02334. Let’s take a look at the chart below for price analysis:

Source: TradingView

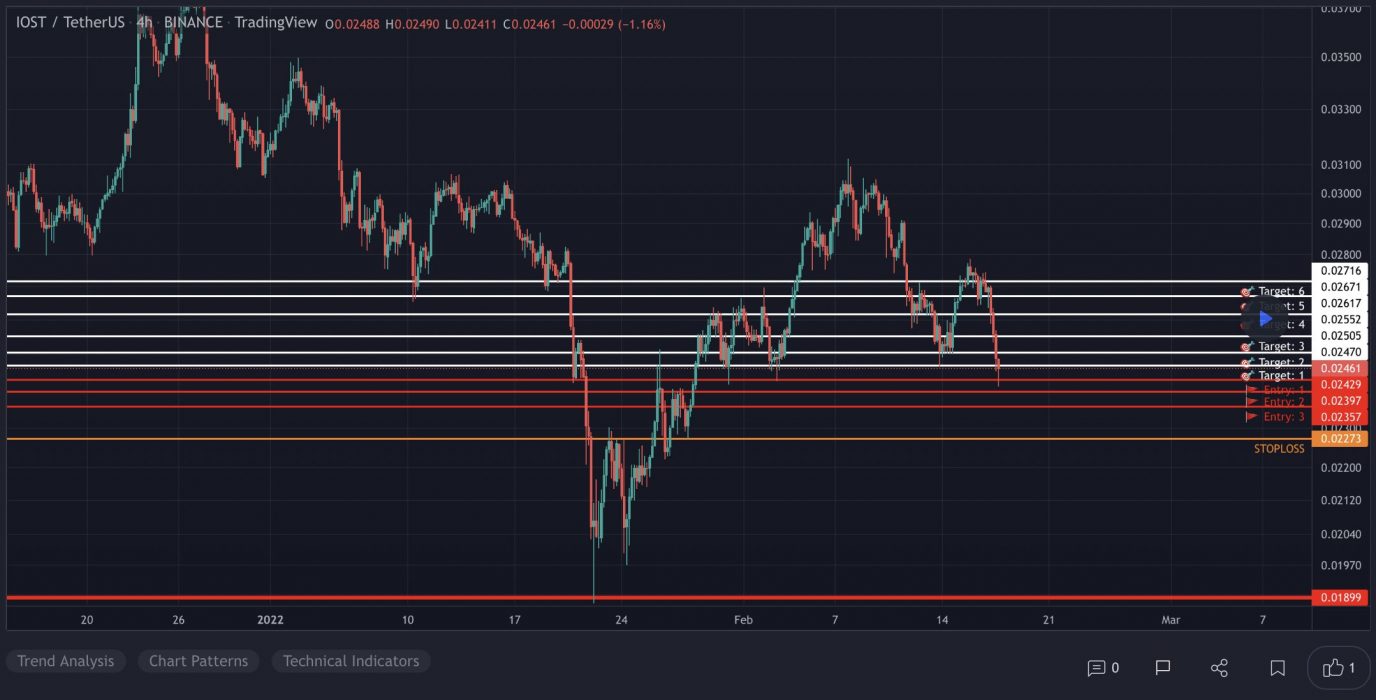
IOST rallied 436% during Q3 2021 and almost set new all-time highs before selling off 78% into its January 2022 low.

A retest of the 2022 yearly open, near $0.03125, started a new wave of selling in early February. The subsequent break of the February monthly open created a new area of resistance between $0.02459 and $0.02643 – an area that is also inefficiently traded and has confluence with the 9 and 18 EMAs.

If this resistance breaks, a move toward the 2021 yearly open might find resistance between $0.02874 and $0.03200. Any potential move through this resistance will likely find a ceiling near an inefficient higher-timeframe level at $0.03499.

Old support near $0.01889 created a sharp bullish reaction in late January. This region, down to $0.01774, could provide support again. 

However, a longer-term bottom is more likely to be found between $0.01427 and $0.00696, perhaps after Q1’s releases finalise, where higher-timeframe charts show an inefficiently traded area.

3. Swipe (SXP)

Swipe SXP is a platform that looks to form a bridge between the fiat and cryptocurrency worlds with its API that is designed to create global payment cards powered by its native SXP token. Swipe also has an on-chain product called Swipe Swap, an Automated Market Maker which is forked by Uniswap, SushiSwap and THORchain, and is powered by Swipechain. This ecosystem is powered by the Swipe Token SXP, which functions as the fuel for the Swipe Network, and is used for paying transaction fees and securing Swipechain through bonding and governance.

SXP Price Analysis

At the time of writing, SXP is ranked the 178th cryptocurrency globally and the current price is US$1.28. Let’s take a look at the chart below for price analysis:

Source: TradingView

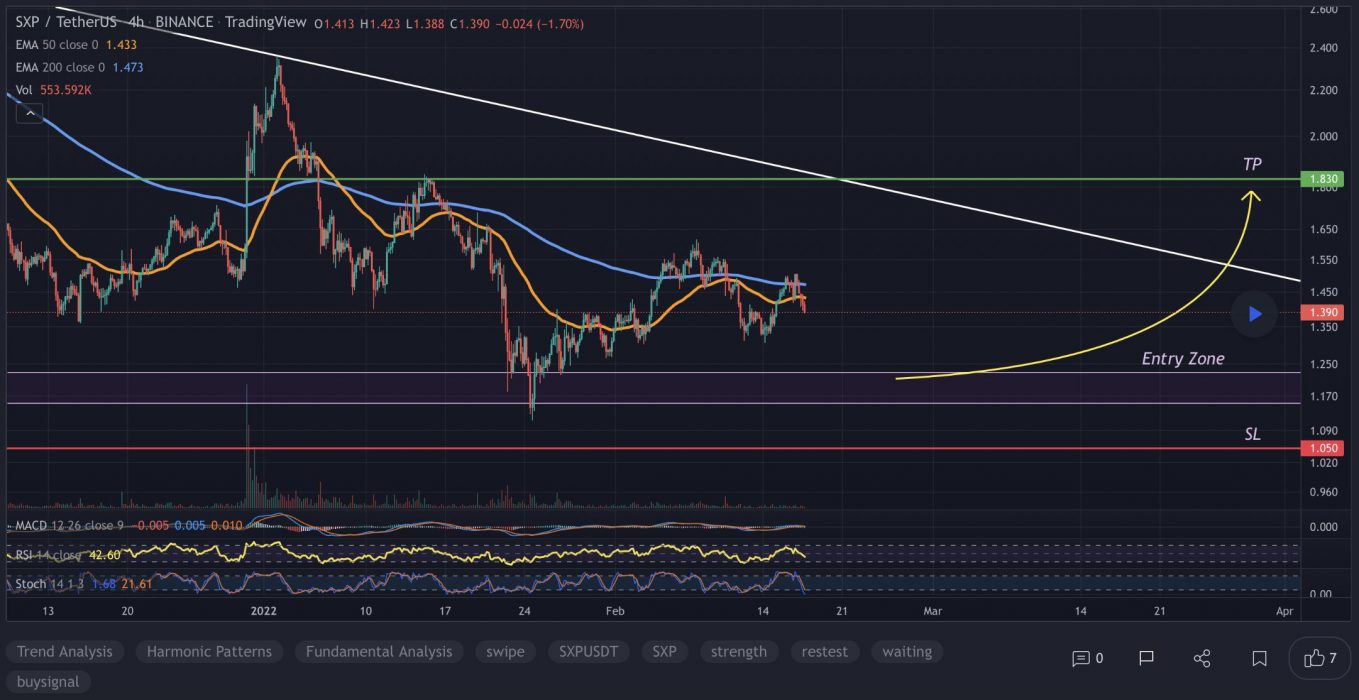
SXP retraced 81% from its May 2021 all-time high and is entering an area of possible higher-timeframe support.

Multiple resistance areas on the daily chart converge between $1.303 and $1.418, with the February monthly open and the 9 and 18 EMAs marking the middle of this zone. 

However, an inefficient area on higher timeframes that could offer support starts nearby at $1.244, although $1.203 and below may be a more sensitive area. This proximity of resistance and support might trigger consolidation in the short term.

This higher-timeframe possible support covers a wide area and could fill down to $0.742, where January 2021’s bullrun began. Bears may be taking profits in this area. Meanwhile, bulls might wait for signs of genuine demand (not just mild rallies from short-covering) to begin more significant accumulation.

A break of the current resistance might reach overlapping old consolidation ranges between $1.532 and $1.641. If this potential resistance breaks, the 2022 yearly open near $2.025 might mark the next possible resistance level. A move to this level could signify the start of a more extensive accumulation range or trend reversal.

Learn How to Trade Live!

Join Dave and The Crypto Den Crew and they’ll show you live on a webinar how to take your crypto trading to the next level.

Where to Buy or Trade Altcoins?

These coins have high liquidity on Binance Exchange, so that could help with trading on AUD/USDT/BTC pairs. And if you’re looking at buying and HODLing cryptos, then Swyftx Exchange is an easy-to-use popular choice in Australia.
Categories
Binance Crypto News IOST Market Analysis Swyftx Trading

Top 3 Coins To Watch Today: MATIC, IOST, BURGER – August 23 Trading Analysis

Let’s take a closer look at today’s altcoins showing breakout signals. We’ll explain what the coin is, then dive into the trading charts and provide some analysis to help you decide.

1. Polygon (MATIC)

Polygon MATIC is the first well-structured, easy-to-use platform for Ethereum scaling and infrastructure development. Its core component is Polygon SDK, a modular, flexible framework that supports building multiple types of applications. Polygon effectively transforms Ethereum into a full-fledged multi-chain system (aka Internet of Blockchains). This multi-chain system is akin to other ones such as Polkadot, Cosmos, Avalanche, etc, with the advantages of Ethereum’s security, vibrant ecosystem and openness.

MATIC Price Analysis

At the time of writing, MATIC is ranked the 17th cryptocurrency globally and the current price is A$2.25. Let’s take a look at the chart below for price analysis:

Source: TradingView

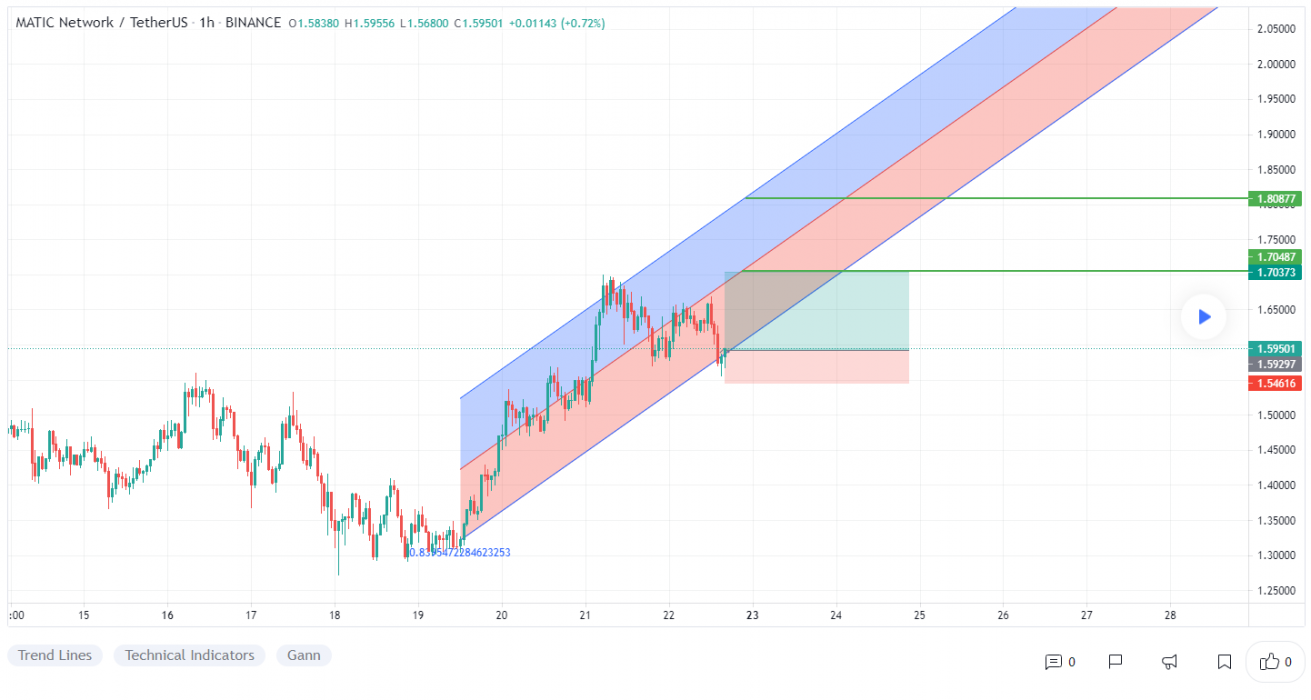
MATIC‘s stunning – nearly 315% – climb in Q2 has since retraced 75%, finding some support near A$1.80.

Retracements toward the monthly open, possibly running stops near A$1.74 and A$1.70, are likely to be capped between A$1.65 and A$1.77. A break through this level may find another area of resistance near the gap and old swing lows near A$1.63, possibly spiking up to A$1.55.

The price appears to be struggling to maintain resistance between A$2.30 and A$2.49, making the swing highs near A$2.56, A$2.61 and A$2.70 likely shorter-term targets. 

A run on these highs could find another area of resistance near A$2.74. If this area fails to break, a drop to the lower end of the monthly gap of around A$2.50 may be on the cards, with A$2.44 offering some hope of support.

2. Iost (IOST)

IOST‘s blockchain infrastructure is open-source and designed to be secure and scalable, all in the hope that it will serve as the backbone for online services in the future. One of the biggest challenges that IOST aims to resolve centres on how big companies may not be able to embrace blockchains in a customer-facing environment unless they are scalable. The Internet of Services Token is put forward as a way of tackling this problem.

IOST Price Analysis

At the time of writing, IOST is ranked the 120th cryptocurrency globally and the current price is A$0.05076. Let’s take a look at the chart below for price analysis:

Source: TradingView

IOST has continued its steady downtrend. Meanwhile, the chart offers bulls no strong support for long entries.

The recent low at A$0.02587 is likely to be swept – a region that offers a glimmer of hope for support based on some methods of measuring moves. However, bulls are likely to wait for more signs of support and a market structure shift before entering long positions.

Resistance rests just overhead between A$0.06355 and A$0.06957. The gap at A$0.07015 offers a high probability target for any potential down-trend retracements. 

A more substantial bullish shift in the markets could help the price run the stops near A$0.07344 into resistance beginning near A$0.07562. Any move upward is likely to find a cap near A$0.08149, although the current chart offers no hints that a movement this large should occur anytime soon.

3. Burger Swap (BURGER)

BurgerSwap BURGER is one of the first democratised, decentralised automated market makers (AMMs) on the Binance Smart Chain (BSC). It was built without the control of any centralised authorities through the use of smart contracts. BURGER token staking allows any user to create proposals and influence the adjustment of transaction fees, block rewards and other system parameters of the Burger Swap exchange via voting.

BURGER Price Analysis

At the time of writing, BURGER is ranked the 411th cryptocurrency globally and the current price is A$8.19. Let’s take a look at the chart below for price analysis:

Source: TradingView

After an 85% retracement from its May highs, BURGER found a temporary low near A$4.82. A recent move above A$9.40 could be the first sign of a bullish shift but could also be a stop run before the next drop lower. 

If the market adopts a more bullish tone, the price could run through the most recent swing high. If this bounce occurs, it would likely find some resistance near A$10.23, possibly reaching up to A$12.74.

However, a move below the closest support near A$6.45 makes stop runs on the swing lows near A$5.65 and A$4.82 likely. A confluence of several levels near A$4.20 could provide a temporary bounce. Still, a sustained bearish market will likely target A$3.90 and even A$3.28.

Where to Buy or Trade Altcoins?

These coins have high liquidity on Binance Exchange, so that could help with trading on AUD/USDT/BTC pairs. And if you’re looking at buying and HODLing cryptos, then Swyftx Exchange is an easy-to-use popular choice in Australia.
Categories
Crypto News IOST Market Analysis Trading

IOST Breakout Analysis – Parabolic Breakout on IOST with +106% Gains in a Week

IOST is trading in uptrend here like many other altcoins. The Cryptocurrency IOST just went up +47% in a single day by breaking a Falling wedge pattern with strong buying volume and surges over +106% in a week.

What is IOST?

IOST describes itself as an “ultra-fast,” fully-fledged and decentralized blockchain network and ecosystem with its own nodes, wallets and based on the “next-generation” consensus protocol dubbed “proof-of-believability.” IOST’s blockchain infrastructure is open-source and designed to be secure and scalable — all in the hope that it will serve as the backbone for online services in the future.

IOST Quick Stats

SYMBOL:IOST
Global rank:67
Market cap:$498,737,502 AUD
Current price:$0.0305 AUD
All time high price:$0.1772 AUD
1 day:+47.35%
7 day:+106.94%
1 year:+295.7%

IOST Price Analysis

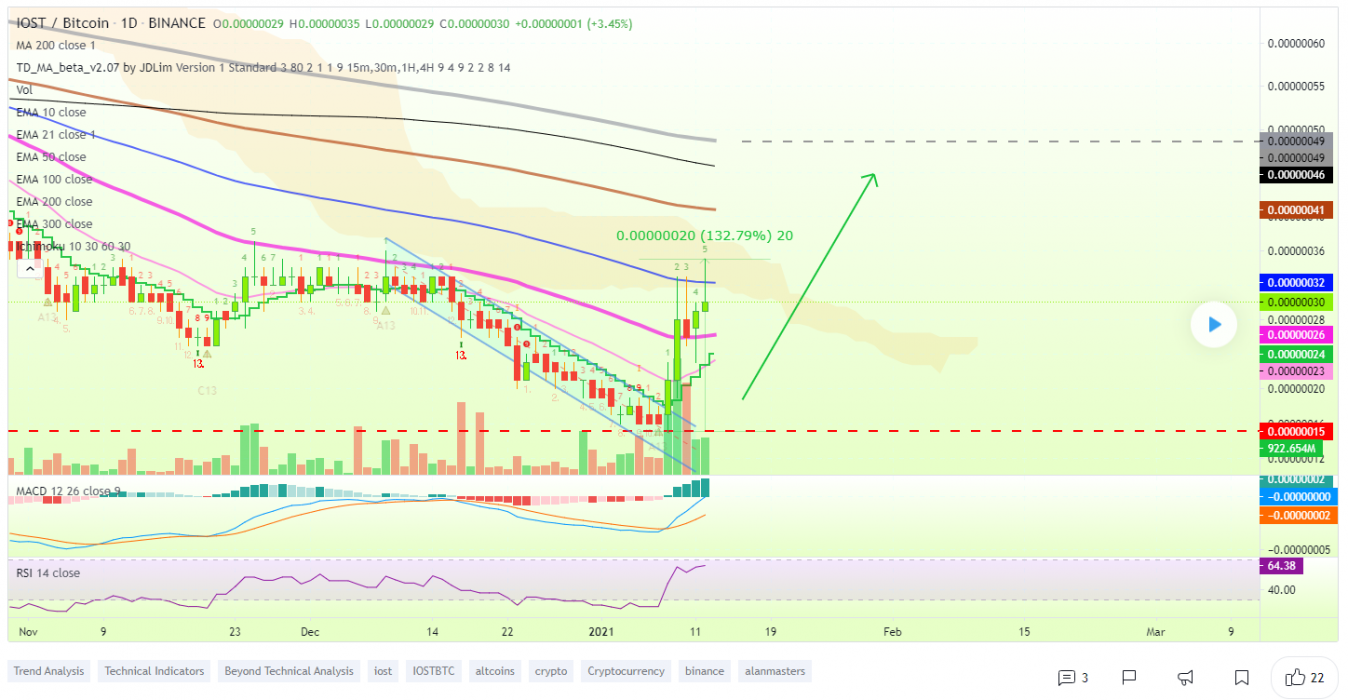
At the time of writing, IOST is ranked 67th cryptocurrency globally and the current price is $0.0305 AUD. This is a +106.94% increase since 10th January 2021 (7 days ago) as shown in the chart below.

Source: TradingView

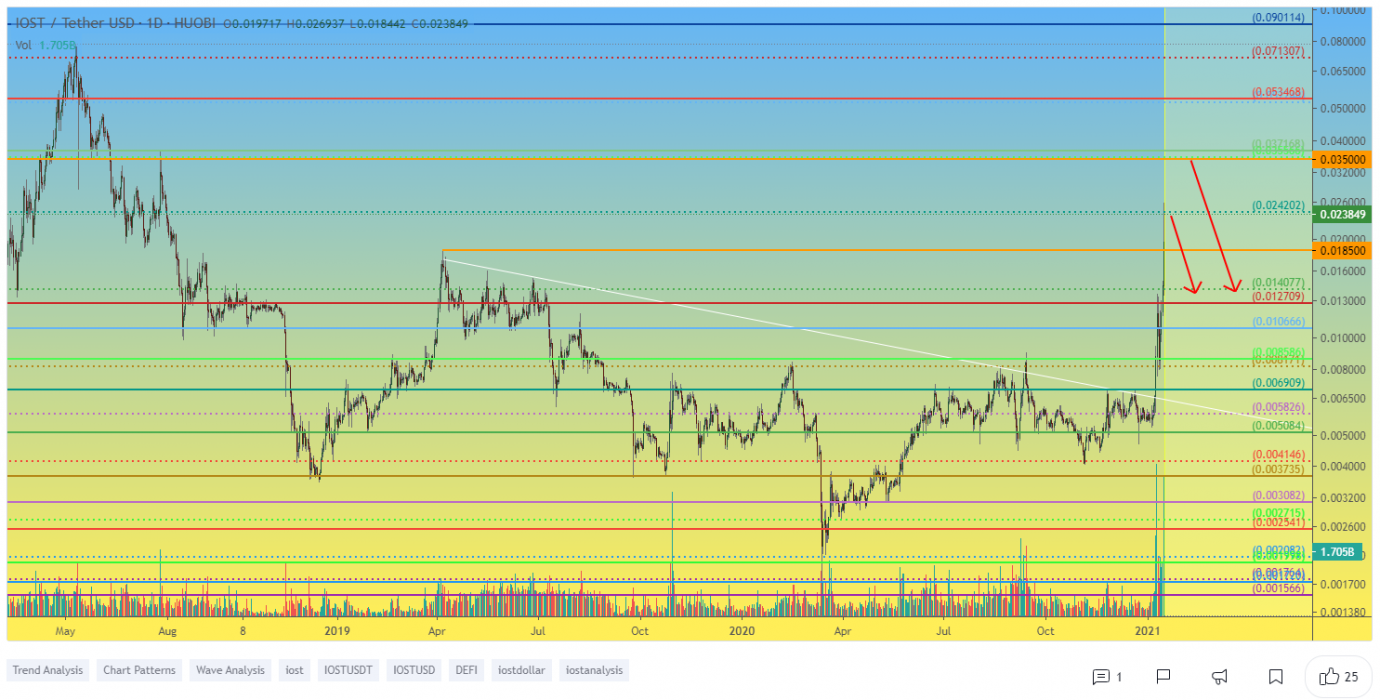
If we see the above 1-day candle chart, IOST did a strong breakout from the falling wedge pattern while trading sideways from the last few days around $0.02471 AUD price levels & is now heading towards its major resistance of the month. After BTC made a new all-time high in its price recently and Altcoins are also rising in a bullish trend, IOST looks well-positioned to hit the next high price levels.

“The Falling Wedge is a bullish pattern that begins wide at the top and contracts as prices move lower. This price action forms a cone that slopes down as the reaction highs and reaction lows converge.”

Source: TradingView

What do the technical indicators say?

The IOST TradingView indicators (on the 1 day) mainly indicate IOST as a strong buy, except the Oscillators which indicate IOST as a buy.

So Why did IOST Breakout?

The recent rise in Bitcoin over +300% since the halving in May and then the suggested start of the Altcoin season could have contributed to the recent breakout. Another reason for this sudden pump in price could be the whales secretly buying IOST for the next Altcoins rally & it could also be contributed to some of the recent news of IOST Staking Rewards.

Recent IOST News & Events:

Where to Buy or Trade IOST?

IOST has the highest liquidity on Binance Exchange so that would help for trading IOST/BTC or IOST/USDT pairs. However, if you’re just looking at buying some quick and hodling then Swyftx Exchange is a popular choice in Australia.