Categories
Binance Crypto News Market Analysis Swyftx Trading

Top 3 Coins To Watch This Week: CELR, FET, SXP – Trading Analysis

Let’s take a closer look at this week’s altcoins showing breakout signals. We’ll dive into the trading charts and provide some analysis to help you.

1. Celer Network (CELR)

The Celer Network (CELR) is a smartly designed layer-2 scaling solution that provides off-chain transactions handling. The Celer platform offers fast, simple and secure off-chain transactions for both payments and smart contracts. The project was among the first to be developed using the Substrate framework and is part of the Polkadot ecosystem. As to the overall goal of the network, its founders envisioned unleashing the full potential of blockchain and revolutionising Dapps with more efficient and productive outputs.

CELR Price Analysis

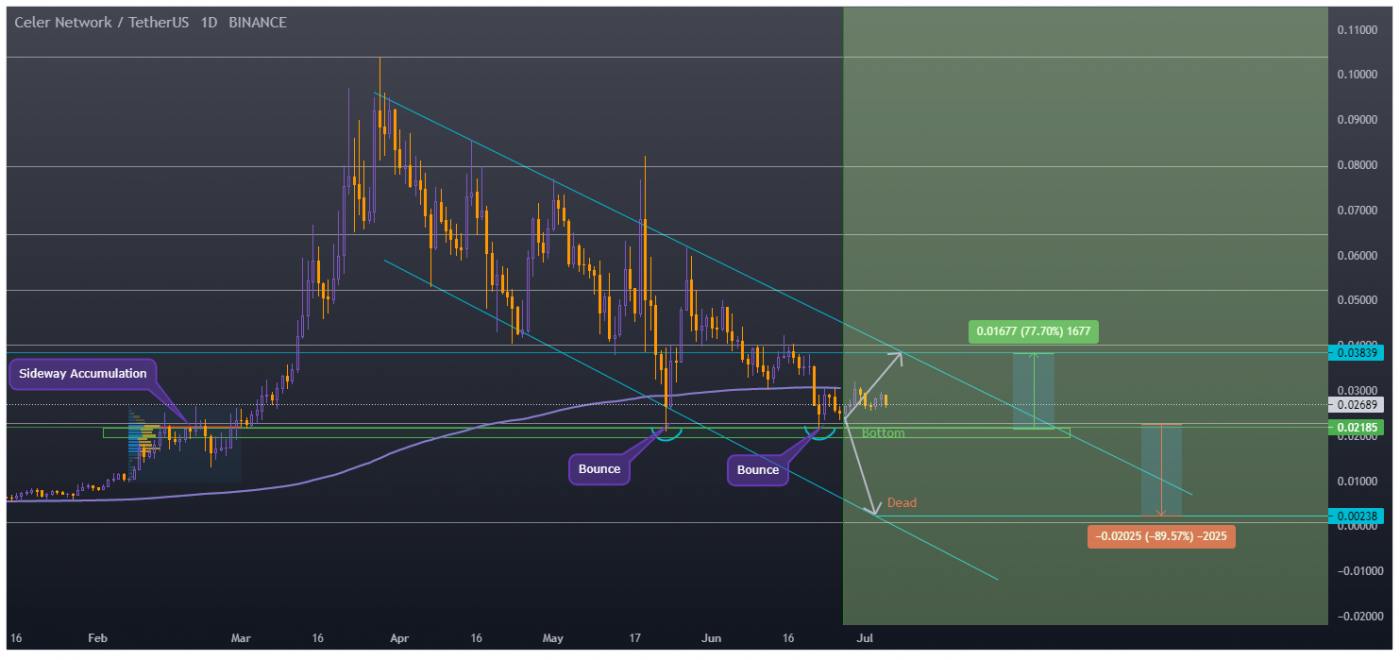
At the time of writing, CELR is ranked the 174th cryptocurrency globally and the current price is A$0.03565. Let’s take a look at the chart below for price analysis:
Source: TradingView

After retracing nearly 80 percent from its highs, CELR wicked into the monthly gap beginning near A$0.02814. This wick formed the bottom of the current range.

The price shows no apparent signs of a longer-term reversal, which may mean that the closest resistance near A$0.04012 will continue to suppress the price. However, some support could be found near the monthly open, possibly giving bulls footing for a stop run through the swing high at A$0.04296. 

This move could continue into resistance near A$0.04731 and spike through the relatively equal highs near A$0.05047. A break of the next swing high near A$0.05631 is likely to find resistance once it reaches A$0.05733. If this move occurs, it may suggest a longer-term reversal.

A retest of possible support near A$0.03142 could provide an entry for a short-term trade. However, there is a higher probability for more substantial support near A$00.01715 after a run on the lows at A$0.02810 and A$0.01715.

2. Fetch.ai (FET)

Fetch.ai is a platform that aims to connect Internet of Things (IoT) devices and algorithms to enable collective learning. It was launched in 2017 by a team based in Cambridge, UK. Fetch.ai is built on a high-throughput sharded ledger and offers smart contract capabilities to deploy machine learning and artificial intelligence solutions for decentralised problem-solving.

These open-source tools are designed to help users create ecosystem infrastructure and deploy commercial models.

FET Price Analysis

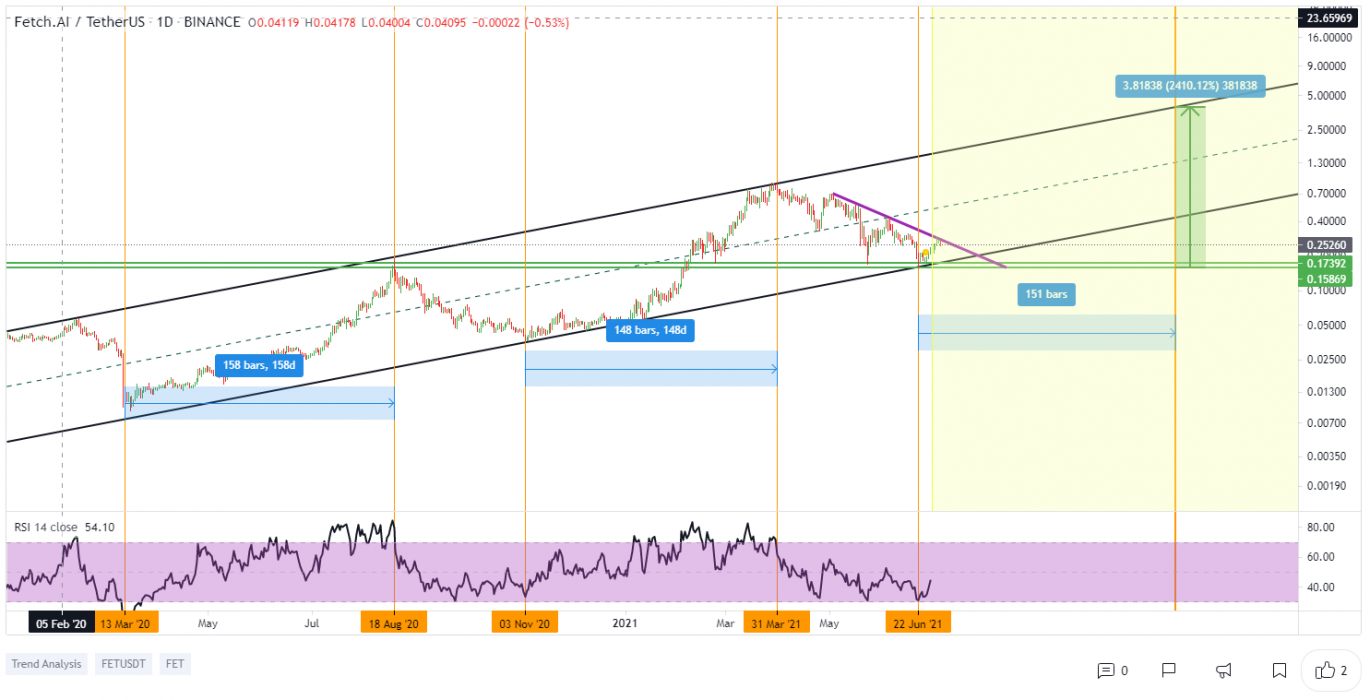
At the time of writing, FET is ranked the 156th cryptocurrency globally and the current price is A$0.3367. Let’s take a look at the chart below for price analysis:
Source: TradingView

FET has dropped nearly 82 percent from its highs, with the current low’s wick on June 22 taking stops below two major swing lows.

The resulting bounce found resistance near A$0.3764, which could continue to cap upward movement. If the price finds support in the current region near A$0.3536, it could continue to resistance near A$0.4183. A more substantial move might run stops above the swing high near A$0.4536 into resistance near A$0.4718.

A break below the monthly open is likely to target buy stops near A$0.2710, an area that could provide some support. A move below this level could target below the swing low at A$0.2169, possibly reaching the gap beginning near A$0.1700.

3. Swipe (SXP)

Swipe is a platform that looks to form a bridge between the fiat and cryptocurrency worlds with its three main existing products: the Swipe multi-asset mobile wallet, the Swipe cryptocurrency-funded debit card, and the Swipe Token (SXP).

This ecosystem is powered by the Swipe Token (SXP), which functions as the fuel for the Swipe Network, and is used for paying transaction fees. Holders of SXP tokens are eligible for exclusive discounts on the Swipe app and the token can be used for making fiat payments with the Swipe debit card.

SXP Price Analysis

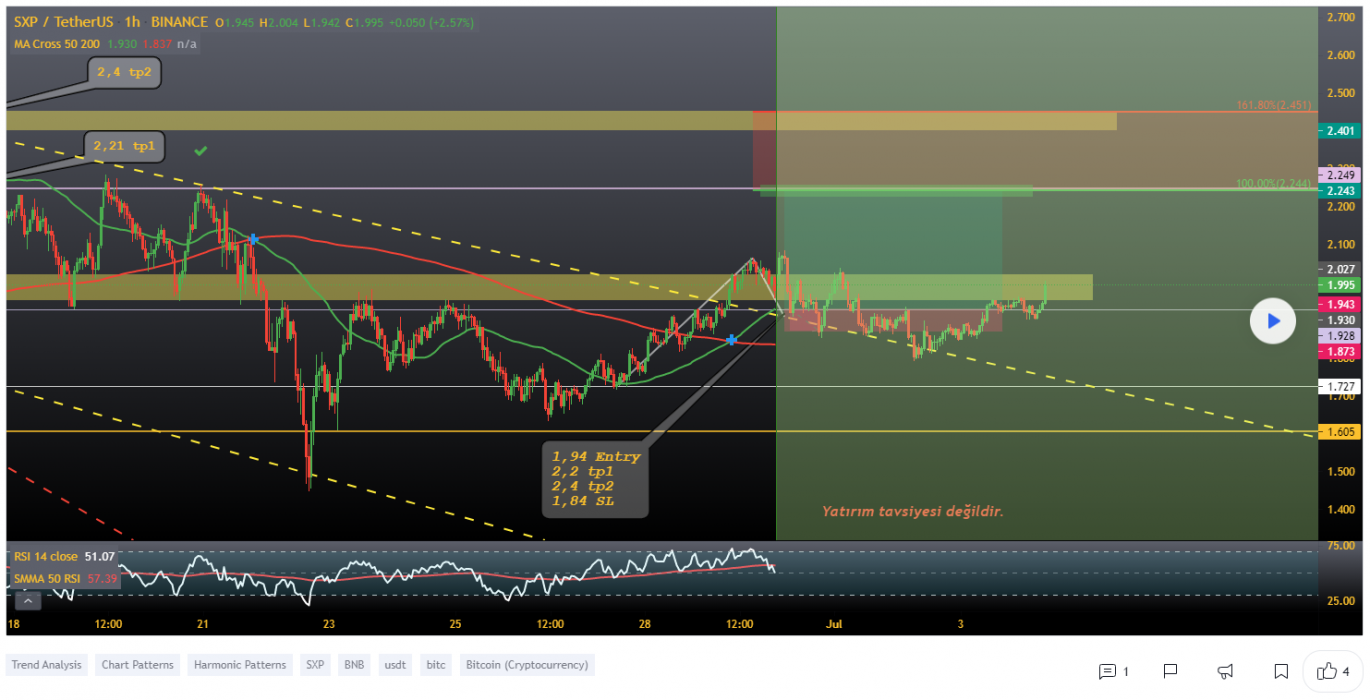
At the time of writing, SXP is ranked the 158th cryptocurrency globally and the current price is A$2.59. Let’s take a look at the chart below for price analysis:
Source: TradingView

SXP’s 77 percent drop has filled the February monthly gap twice as the price consolidates between A$1.78 and A$3.31.

Price’s current region, between A$2.69 and A$2.50 and just under the monthly open, could continue to give support. If this area continues to hold, the cluster of relatively equal range highs up to A$3.31 is a likely target. 

An animated move through these highs could reach up to the daily gap beginning at A$3.69. The area between A$4.26 and A$4.07 provides a likely cap for a move into this zone.

A drop lower could be a run-on stop under A$2.38 and find support near A$2.24. If this level is lost, the swing low at A$1.78 is a likely target, with A$1.60 possibly giving support.

Where to Buy or Trade Altcoins?

These three Altcoins have the high liquidity on Binance Exchange, so that could help with trading on USDT or BTC pairs. And if you’re looking at buying and HODLing cryptos, then Swyftx Exchange is an easy-to-use popular choice in Australia.

Categories
Bitcoin Crypto News Investing Market Analysis

Experts Predict Bitcoin Will Fall to $25,000 When Grayscale BTC Trust Unlocks In Two Weeks

In a newsletter sent out to clients, US bank JPMorgan has predicted that Bitcoin could fall to US$25,000. The situation could be brought on by the expiry of 16,000 GBTC held in a six-month lock-up period by the world’s largest cryptocurrency fund.

How Can the Grayscale Fund Impact the Price of Bitcoin?

On 18 July, the lock-up period for a total of 16,000 Bitcoin (BTC) is set to expire. This could encourage investors who entered six months ago at a lower Bitcoin price and are now sitting on some potential profits to sell their BTC instead of continuing to hold it.

Some analysts, including strategists at JPMorgan, believe that accredited investors will sell at least a portion of their GBTC holdings after the unlocking period, thus weighing further on the ongoing Bitcoin market downtrend. A selloff of 16,000 BTC, worth roughly US$540 million, could create even more pressure on the downside.

While weak flows and price momentum resulting from last month’s selloff have fuelled Bitcoin’s recent declines, potential sales of shares in the Grayscale Bitcoin Trust following the expiration of a six-month lock-up period could be an additional headwind.

Nikolaos Panigirtzoglou, a Managing Director at JP Morgan

According to JPMorgan, the trust saw record inflows of US$2 billion in December 2020, followed by $1.7 billion in January. Globally, trust funds have billions locked up in Bitcoin.

How Does It Work?

In arbitrage trade, institutional investors (like hedge funds) borrow Bitcoin to purchase GBTC shares. Then, after the lock-up expires, these investors sell GBTC shares to secondary markets (retail investors), typically for a premium. Then they return the borrowed Bitcoin to their lenders and pocket the difference.

Each share represents 0.00094716 BTC, with the share tracking Bitcoin’s market price. It has a minimum holding period of six months and a minimum investment requirement of $50,000.

Rising GBTC premium shows a higher inflow of Bitcoin into the trust, while a decreasing premium indicates a declining BTC inflow and a transition into discounted premiums. If premiums are discounted, the seller would take a financial loss because the above-mentioned difference is gone.

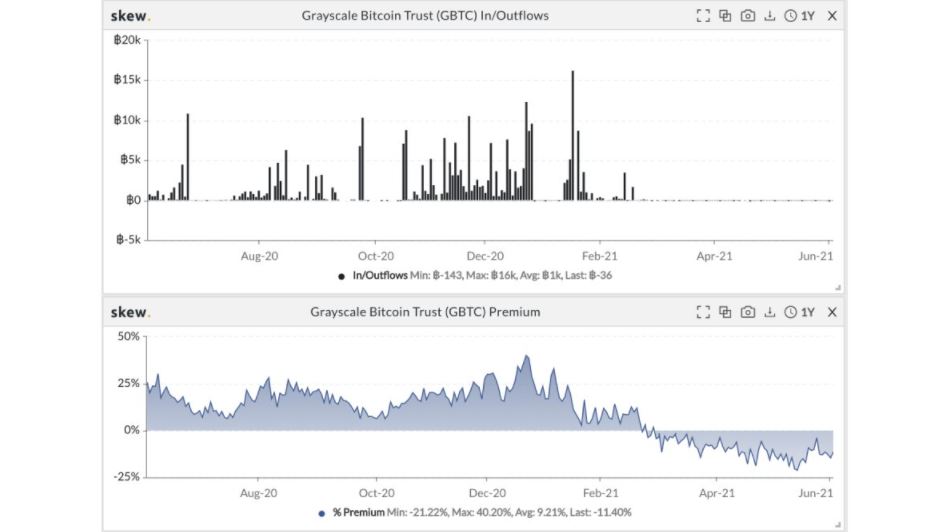
GBTC shares traded at a premium of 40 percent or more to the spot Bitcoin price (current price in the market). So for the big investors it looked like a sure-fire way to profit, especially with such bullish market sentiment. There was little fear of the premium falling sharply.

Money flowing into Grayscale Bitcoin Trust as its premium flips negative.
Source: Skew

However, in the second quarter the Bitcoin market has been in a backslide, and in February the GBTC premium flipped to a discount, leaving little motivation for new investors to attempt the once-popular trade. As of early July, GBTC shares traded at a discount of 10.5 percent, according to data provided by Skew. 

Others Have a More Positive Narrative

Some think it is premature to consider the potential consequences of this event. Nevertheless, other analysts believe it will flush sellers from the market in July, possibly creating bullish potential.

In contrast with what JPMorgan is saying, some digital-asset analysts and investors claim it’s possible some of these investors might need to enter the market to buy Bitcoin again to repay cryptocurrency loans they used to finance their original purchases of the GBTC shares. The negative impact of the GBTC selloff may be balanced by the repurchases of Bitcoin in the spot market.

Additionally, those who deposit their Bitcoin holdings need to buy back coins to return to their base portfolio. 

Since the beginning of the year, analysts have been forecasting a Bitcoin price of $146,000 in the long run. This may also cause some investors to hold.

Categories
Bitcoin Crypto News Market Analysis Markets

Whales Bought 60,000 BTC Over the Weekend Worth $2.7 Billion

After recent record losses, Bitcoin (BTC) HODLers enjoyed gains over the weekend for the first time in weeks as the digital asset surged over 5 percent overnight. This was largely attributed to the influx of Bitcoin whales holding 100 to 10,000 Bitcoin accumulating over 60,000 coins in a single day, worth US$2.7 billion.

Bullish Signs as Bitcoin Whales Steadily Accumulate

On-chain analyst and trader Willy Woo had a humorous take on the aggressive whale accumulation, tweeting:

According to on-chain analysts Santiment, these addresses now hold 9.12 million coins combined, up over 100,000 from only six weeks ago.

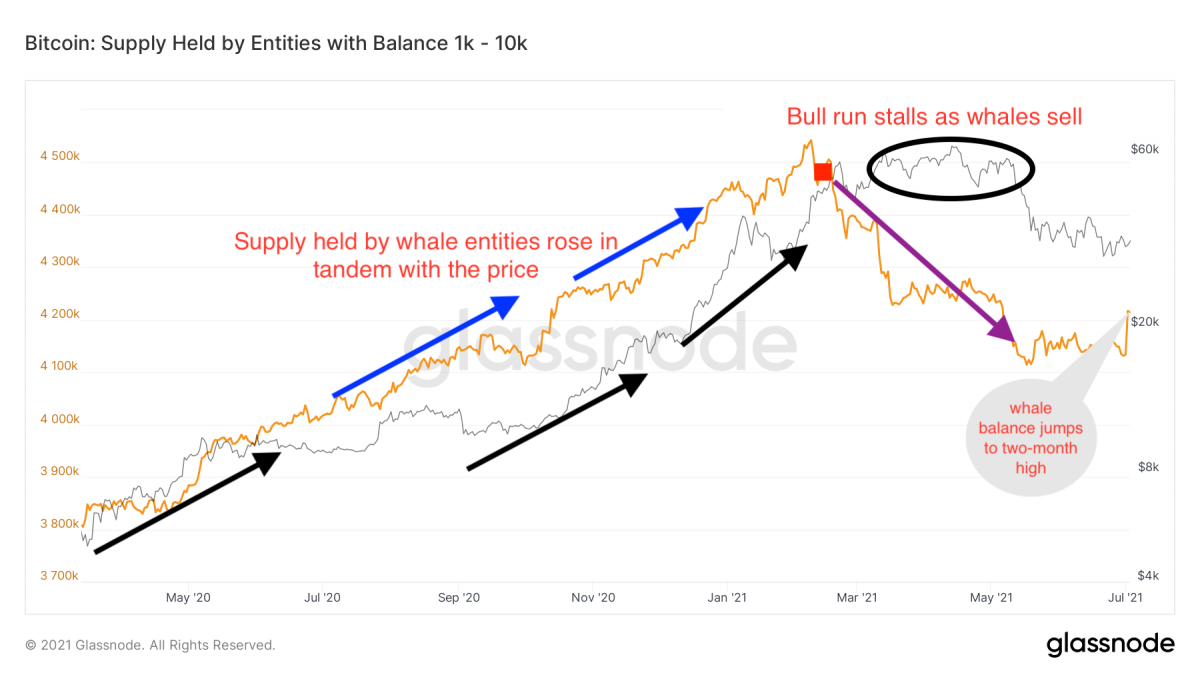
The total number of coins held by whale entities – addresses controlled by a single network participant holding 1,000 to 10,000 Bitcoin – rose by over 80,000 to 4.216 million Bitcoin on 2 July, hitting the highest level since May. For context, this remains some way below the record high of 4.542 million reached in February.

Source: Glassnode

The number of whale entities has now jumped to a three-week high of 1,922, which read together with signs that Bitcoin may have bottomed out, offers bullish support.

Whale Accumulation Coincided with Largest Downward Bitcoin Mining Difficulty Adjustment in History

Source: Glassnode

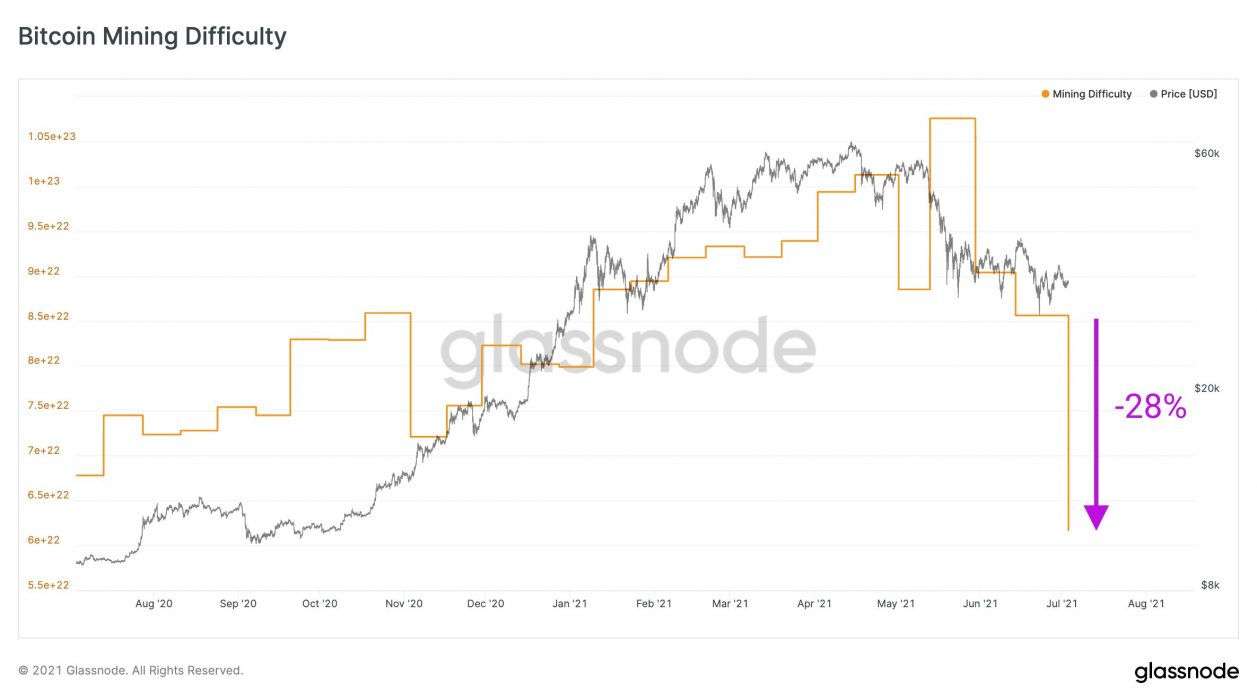
Interestingly, this recent whale accumulation coincided perfectly with the largest negative difficulty adjustment (-28 percent) in the history of the Bitcoin network.

In short, the difficulty adjustment refers to the difficulty of mining Bitcoin and is linked to the hashpower. As hashpower is removed, the difficulty decreases and where hashpower increases, difficulty is increased. The record 28 percent reduction in the difficulty adjustment was a direct consequence of China banning Bitcoin mining.

Most, however, view the mining ban in a positive light. As hashrate migrates out of China, the network becomes more decentralised and given the network’s response to the recent negative difficulty adjustment, it appears as resilient as ever.

At the moment, whales appear bullish. Historically, this tends to provide evidence of a broader shift in sentiment. It remains to be seen whether this trend will continue in the coming months.

Categories
Bitcoin Crypto News Market Analysis Markets

Amid Unprecedented FUD, Strong Signals Emerge that Bitcoin May Have Bottomed

Despite Bitcoin’s breakout performance in 2020, much of the gains have been erased over the past three months as Bitcoin slid 43 percent amid a barrage of relentless FUD relating to China and environmental concerns.

While the grounds for such concerns can be challenged, there is mounting evidence that Bitcoin may be turning the corner.

A Difficult Bull Market for HODLers

Based on Bitcoin’s halving cycle and subsequent price movements, we ought to be somewhere near the middle of a bull market. Given that Q2 2021’s performance was the worst in eight years, even the most bullish of HODLers have had their conviction tested in the face of persistent, and seemingly coordinated, FUD.

Four Reasons for HODLers to be Optimistic

Throughout this latest round of FUD, Bitcoin has been enormously volatile, with ongoing support seemingly around the US$30,000 mark. However, a number of indicators suggest this may indeed be the bottom and that there is cause for optimism in the near term.

#1 Puell Multiple Signals Only 5th Buying Opportunity in Bitcoin’s History

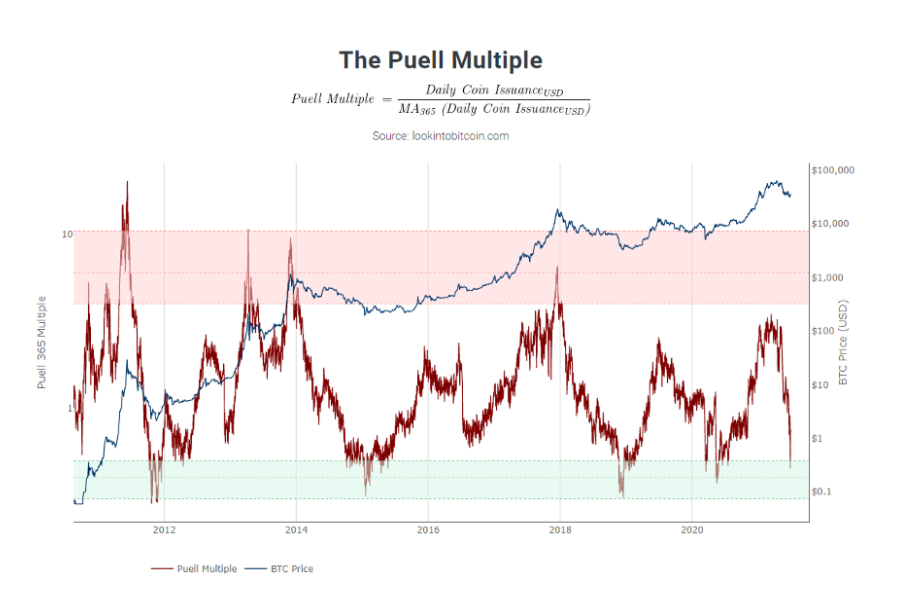
This metric explores market cycles from a mining revenue perspective by looking at the supply side of Bitcoin’s economy – Bitcoin miners and their revenue. Miners are considered sellers by necessity since their operating costs tend to be fixed in fiat terms. When the value of Bitcoin mined and entering the ecosystem is too large or too small by historical standards, it can provide an opportunity for investors.

Notice below how the indicator has slipped into the green, last seen in March 2020. For long-term HODLers, now seems to be the time to accumulate.

The Puell Multiple, Source: lookintobitcoin.com

#2 Long-Term HODLers Continue to Accumulate

As Crypto News Australia reported earlier this year, long-term HODLers tend to be sellers when a market top is near and buyers when there are material price dips. Over long periods, this has proven to be a solid investment strategy.

As short-term HODLers capitulated in droves during May and June, long-term HODLers continued to accumulate, as highlighted in the chart below.

Source: Glassnode

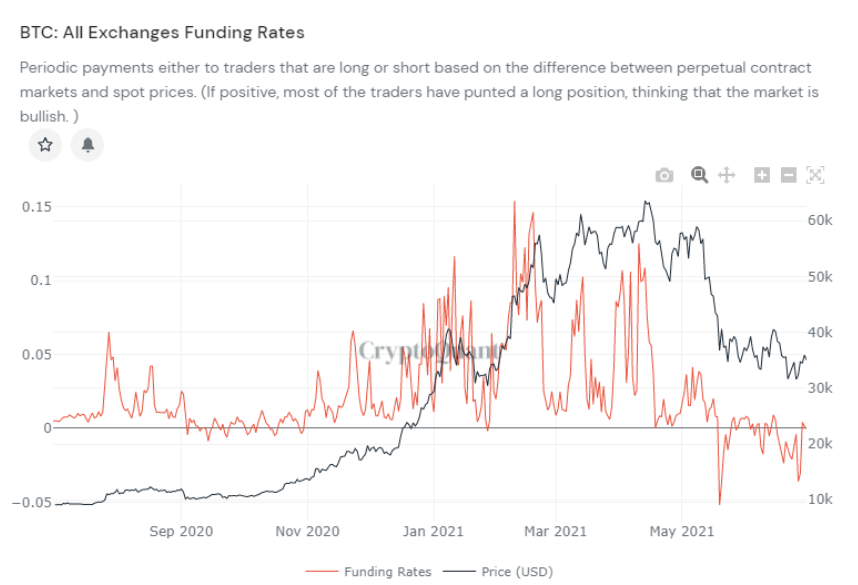
#3 Funding Rates Shifting Away from Negative Territory

Funding rates are payments between traders to make the perpetual futures contract price close to the index price, representing the sentiment of traders on the positions they take in the perpetual swaps market. In the simplest of terms, positive funding rates are indicative of bullish sentiment whereas negative funding rates imply many traders are bearish.

Based on the chart below, funding is gradually moving into positive territory, a historically optimistic indicator for short- to medium-term price movements.

Source: CryptoQuant

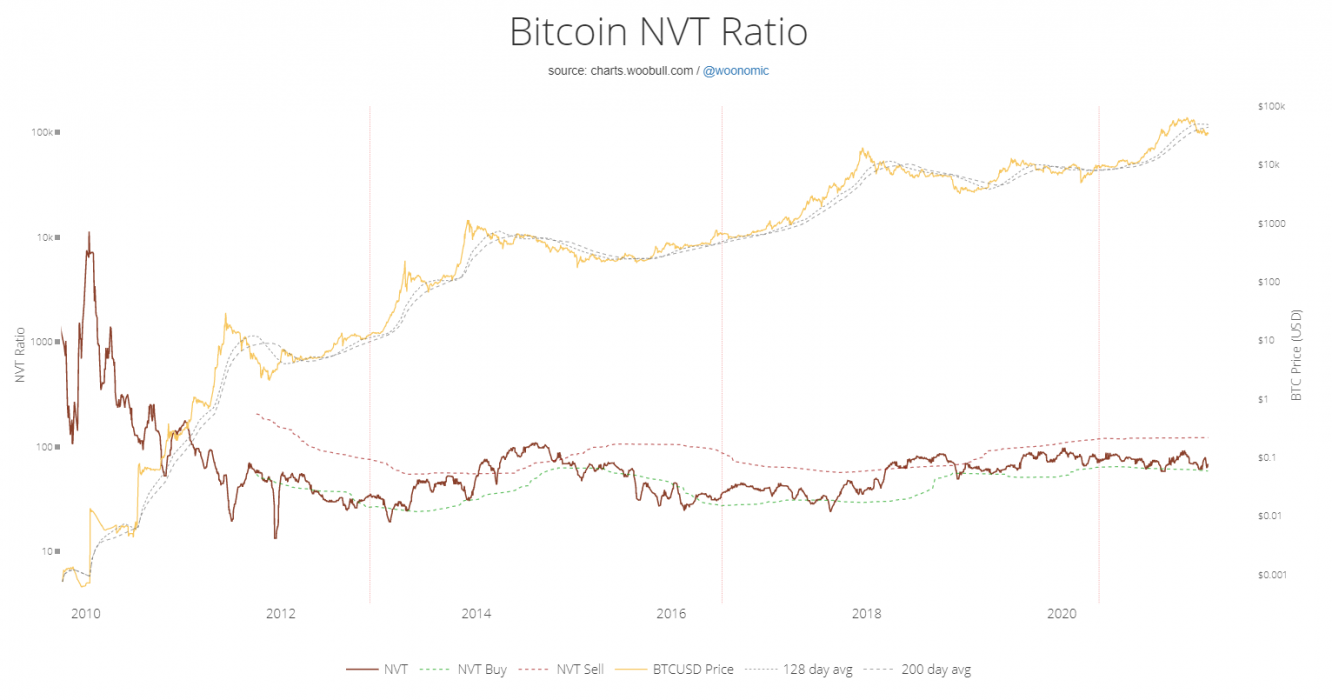
#4 Bitcoin NVT Ratio Shows Bitcoin is Undervalued

The Bitcoin NVT ratio is equivalent to a traditional price-to-earnings ratio used to assess whether a stock is under- or overvalued.

Based on the chart below by respected Bitcoin analyst Willy Woo, the current price of Bitcoin is operating along the lower bounds of undervalued (marked by the green dotted line). The upper bounds (i.e a strong sell indicator) is the red dotted line, indicating Bitcoin would be overvalued at around US$121,000.


Source: woobull.com

When in Doubt, Zoom Out

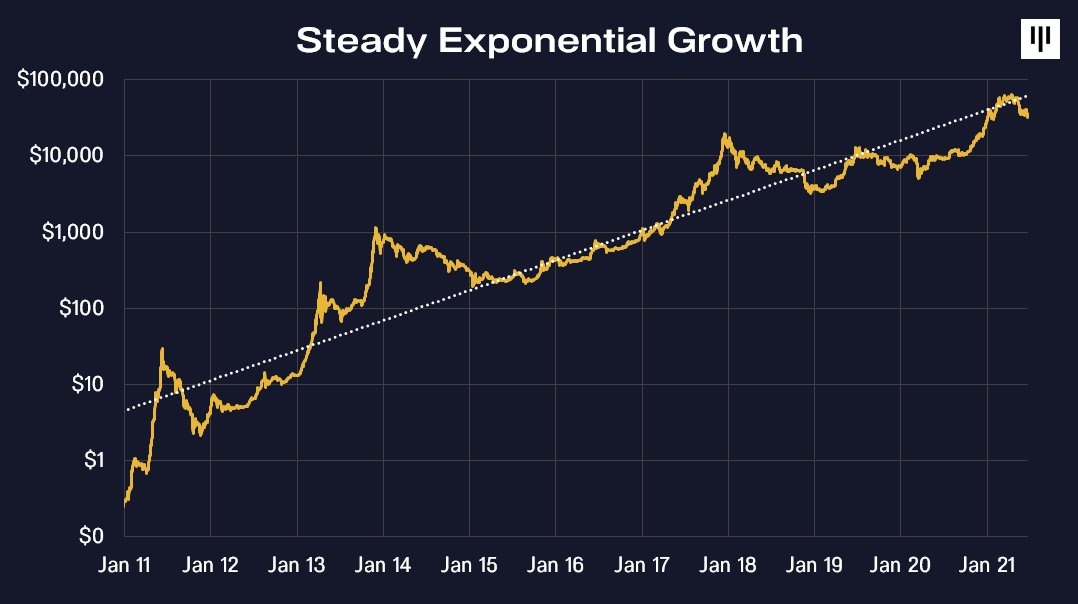
If you entered the Bitcoin market for the first time in the past six months, this most recent correction would undoubtedly have been difficult to stomach. That said, it is worth remembering that anyone who has invested in Bitcoin for a period of greater than 3.25 years has made money.

The strategy employed by successful accumulators has been remarkably simple – don’t use leverage, dollar-cost average, and have a long-term horizon of four or more years.

Bitcoin’s logarithmic price chart clearly demonstrates that long-term holders tend to be rewarded. Short-term price volatility, however, is the price they have to pay to enjoy exceptional long-term returns.

Categories
Bitcoin Crypto News Market Analysis Stablecoins

Stablecoins Held on Exchanges Hit All-Time High – Are They Getting Ready?

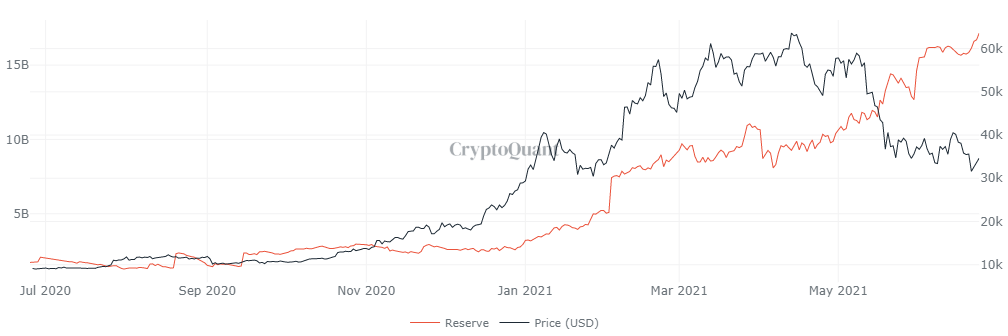
The number of stablecoins on all crypto exchanges has reached a record peak, which signals a likelihood of incoming buying pressure on the market again.

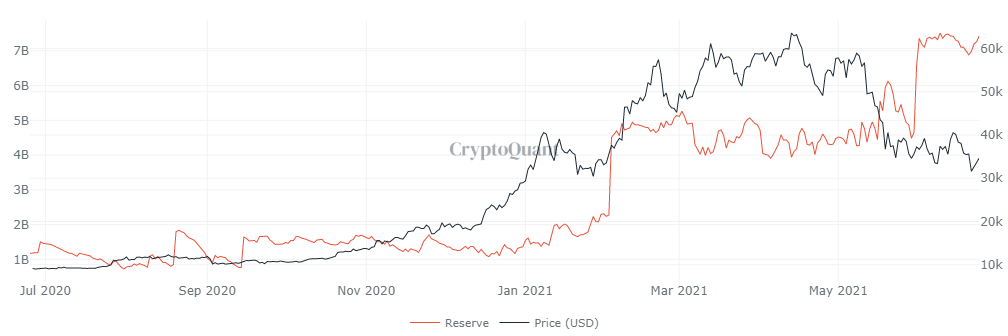
Stablecoin Reserve on Exchanges. Source: CryptoQuant

All Exchange Stablecoin Reserve Exceeds $16 Billion

Following the on-chain data from CryptoQuant, there is currently more than US$16 billion worth of stablecoin held in all cryptocurrency exchanges. 

Although USDC supply has been growing faster than Tether (USDT) since the beginning of this year, there’s a much higher number of USDT in exchange reserves than USDC. Over US$7 billion worth of Tether (USDT) is held in crypto exchanges. 

USDT Reserve on Exchanges. Source: CryptoQuant

At the same time, over US$6 billion BUSD and US$2 billion USDC are held in exchanges’ reserves, according to CryptoQuant.

Stablecoin reserves often serve as an indication for some analysts and traders to position themselves for market pumps. Thus, this latest massive increase in stablecoin reserve suggests the bulls are prepping for a comeback if these coins are being stored for buys. 

Bitcoin Liquid Supply is Declining

Bitcoin has been trading below US$35,000 over the past few days due to the bearish state of the market. However, Bitcoin’s liquid supply has been dropping for quite some time, which serves as another indicator that BTC is likely to resume an upward curve, especially in the presence of demand. 

Bitcoin’s liquid supply simply refers to the availability of Bitcoin on exchanges for easy buying and selling. A decrease in Bitcoin liquidity indicates that people are starting to move their coins off exchanges. This can result in a scarcity of BTC, which is probably bullish provided the demand increases. 

Categories
Crypto News Dogecoin Market Analysis

Cryptos Are Plummeting and DOGE Bulls are Being Hit the Hardest

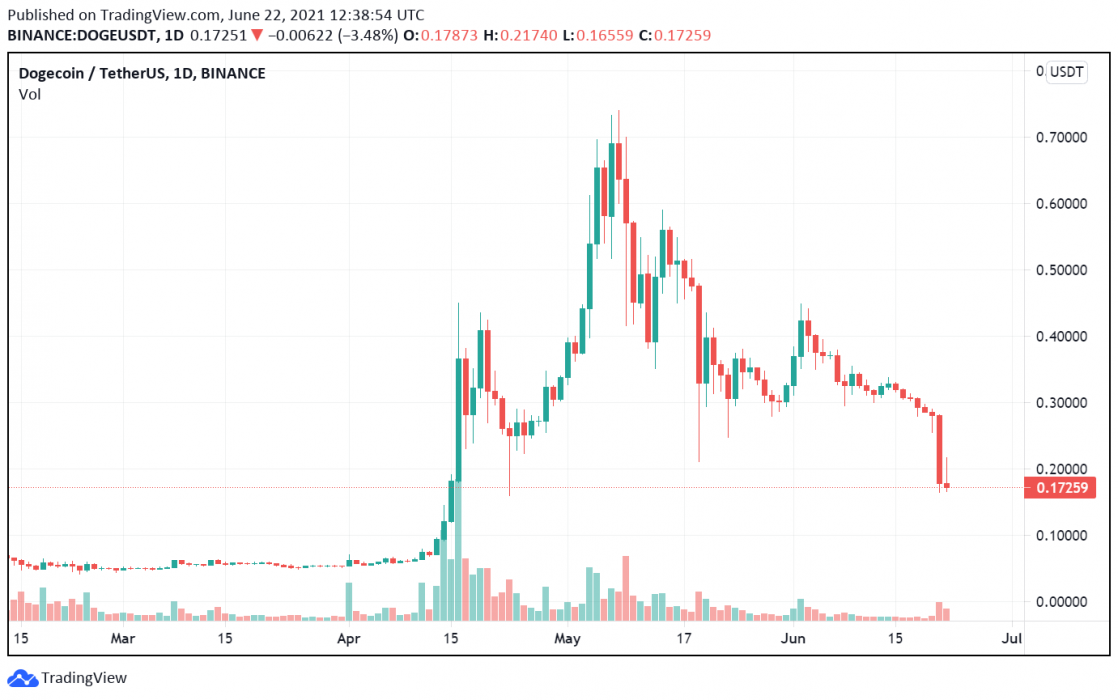
The crypto market is plummeting once again and Doge bulls are among those suffering the most. Dogecoin has crashed all the way to US$0.16, down from an all-time high of US$0.74 on May 8.

The most recent drop in the crypto market seems to be in response to China’s most recent crackdown on trading and mining. Of course, this is not the first time China has tried to “ban Bitcoin”, but because an enormous amount of Bitcoin mining has been based there, news of regulations and restrictions always has a big impact on the market.

The Big Short

However, some analysts – such as ‘Big Short’ investor Michael Burry, who famously bet against the housing market before the Global Financial Crisis – argue that the crypto market has been due for a crash for a while.

All hype/speculation is doing is drawing in retail before the mother of all crashes … When crypto falls from trillions, or meme stocks fall from tens of billions, #MainStreet losses will approach the size of countries. History ain’t changed.

Michael Burry

Doge Bulls Among the Hardest Hit in Recent Crash

Dogecoin crashes to 16 US cents, its lowest point since April 23

It seems that the recent NASCAR Dogecar crash foreshadowed the losses that were to come for the Dogecoin Army. Dogecoin, one of the “meme stocks” that Burry refers to, plunged to 16 US cents, the lowest it has traded since April 23. Dogecoin peaked at 74 US cents on May 8, the same day Elon Musk went on Saturday Night Live to spruik the coin.

Since then, Dogecoin has steadily dropped, losing a huge portion of its former market cap.

Traders Are Frustrated

During this most recent crash, many traders have been taking their frustration out on Reddit and Twitter, where there are large and active crypto communities.

The Dogecoin community has largely remained positive (or blindly optimistic, depending on how you look at it), arguing that this drop in price is a fantastic opportunity to buy more of their favourite coin.

Praying to the Dogefather

It seems though that many within the Dogecoin domain believe that one tweet from Elon Musk is going to reverse the trend and pump Doge to the moon. The problem with “to the moon” narratives is that the price target is ambiguous and ever-changing, based on greed. Something the Dogecoin Army might soon have to consider is that perhaps the 20,000% gains Dogecoin has seen in the past six months was the moon shot they had been calling for.

Categories
Bitcoin Crypto News Market Analysis

Bitcoin Returns in Q2 2021 – Worst in Eight Years

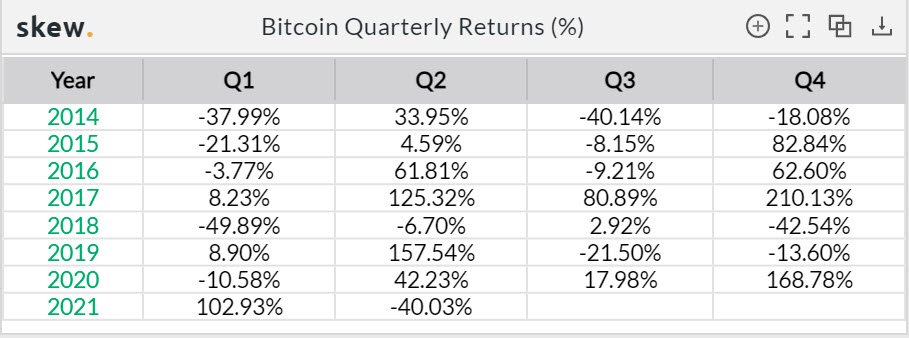
Bitcoin’s performance in 2021 has thus far been a tale of two quarters. In Q1, Bitcoin enjoyed the best start to a year in eight years, outperforming traditional asset classes with returns of over 100%. Of late, however, much of the wind has been knocked from Bitcoin’s sails as Q2 has been the worst on record in eight years.

How Does Bitcoin’s Performance Compare to Previous Years?

Relative to past performance, Q2 appears to be somewhat of an anomaly. Over the past eight years, there have only been two quarters that have recorded negative returns. Bitcoin’s returns of -40.03% in Q2 2021 are by far the worst in eight years, the next closest being -6.7% in 2018.

Ethereum Has Outperformed Bitcoin in 2021

It is often stated that other cryptocurrencies, relative to Bitcoin, tend to outperform on both the upside (during bull markets) and downside (during bear markets). Thus far, 2021 doesn’t appear to be following that pattern, particularly when it comes to Ethereum.

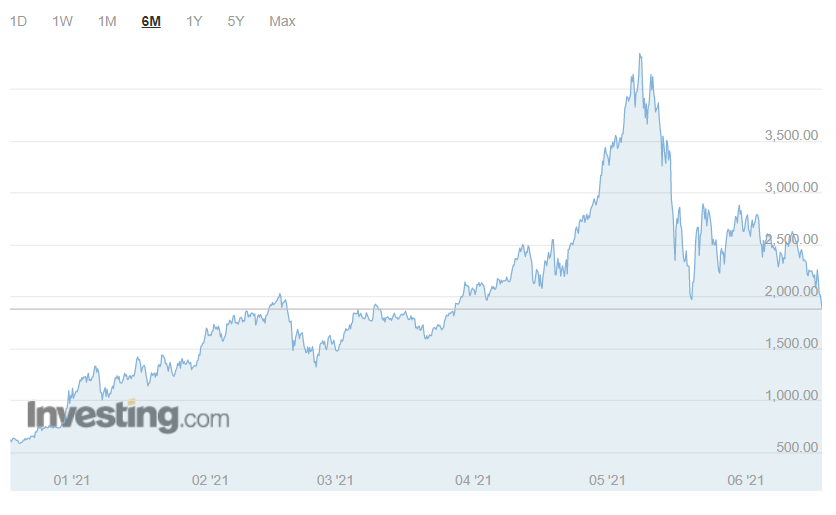
Compared to Bitcoin, Ethereum has enjoyed a better year to date with returns of 162% in Q1 and just under -5% in Q2.

https://au.investing.com/crypto/ethereum

Bitcoin Markets Remain Uncertain

For the time being, the market appears to be on edge, despite bullish announcements such as MicroStrategy moving to acquire up to an additional US$1.5 billion in Bitcoin.

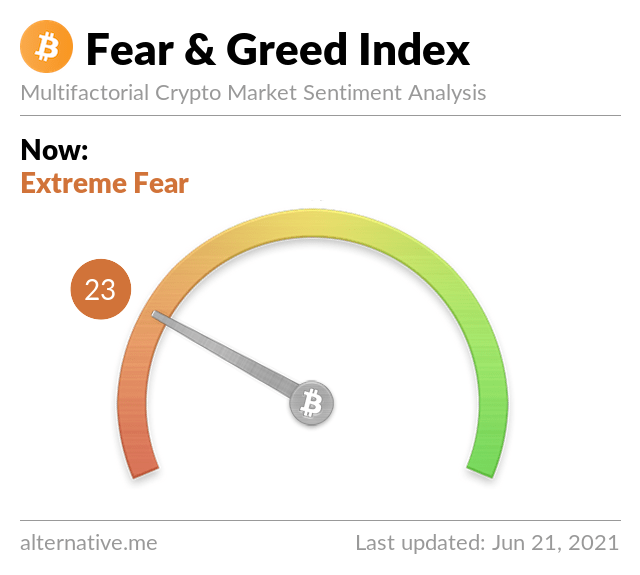
While not an exact science by any measure, the Fear & Greed Index below suggests we have a way to go before sentiment can be said to have shifted in a positive direction.

While the short-term downward moves are cause for concern among long traders, particularly those using leverage, many Bitcoiners remain undeterred.

Volatility, in their eyes, is to be expected of an emergent store of value on a price discovery path towards global adoption. In the interim, they simply #stacksats, HODL and repeat the mantra, BTFD.

There are top analysts however, that are predicting BTC will hit $160k by the end of 2021.

Categories
Binance Crypto News Market Analysis Swyftx Trading

Top 3 Coins To Watch This Week: EGLD, MINA, ORN – Trading Analysis

Let’s take a closer look at this week’s altcoins showing breakout signals. We’ll dive into the trading charts and provide some analysis to help you.

1. Elrond (EGLD)

Elrond is a blockchain protocol that seeks to offer extremely fast transaction speeds by using sharding. The project describes itself as a technology ecosystem for the new internet, which includes fintech, decentralised finance and the Internet of Things. Its smart contracts execution platform is reportedly capable of 15,000 transactions per second, six-second latency and a $0.001 transaction cost.

EGLD Price Analysis

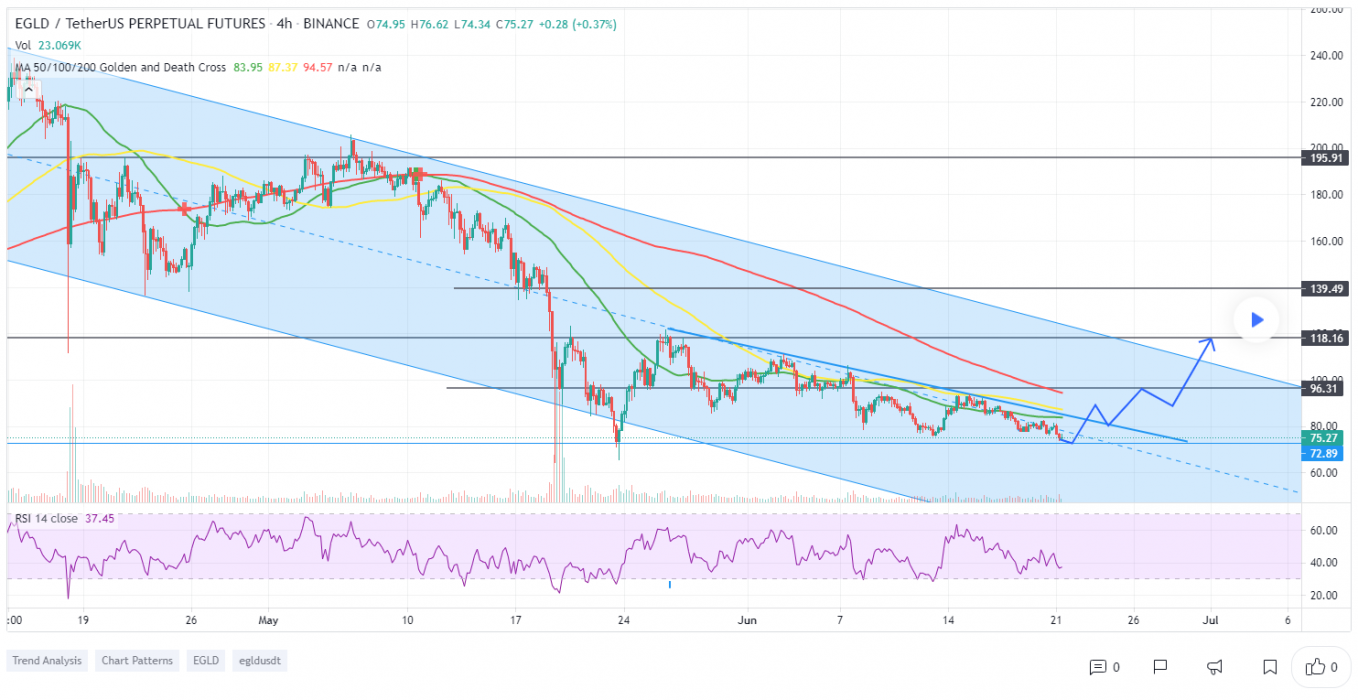
At the time of writing, EGLD is ranked the 63rd cryptocurrency globally and the current price is A$94. Let’s take a look at the chart below for price analysis:

Source: Tradingview

EGLD‘s stunning – nearly 4,000% – climb since Q4 2020 has since retraced 73%, finding some support near A$87.05.

Retracements toward the monthly open, possibly running stops near $141.15 and $147.60, are likely to be capped between $145.25 and $153.64. A break through this level may find another area of resistance near the gap and old swing lows near $161.62 – possibly spiking up to $177.82.

The price appears to be struggling to maintain support between $113.23 and $98.69, making the swing lows near $100.85, $87.05, and $76.99 likely shorter-term targets. 

A run on these lows could find another area of support near $73.95. If this area fails to hold, a drop to the lower end of the monthly gap around $39.54 may be on the cards, with $34.02 offering some hope of support.

2. Mina Protocol (MINA)

Mina Protocol is a minimal “succinct blockchain” built to curtail computational requirements in order to run DApps more efficiently. Mina has been described as the world’s lightest blockchain, since its size is designed to remain constant despite growth in usage. Furthermore, it remains balanced in terms of security and decentralisation. Mina is working on achieving an efficient distributed payment system that enables users to natively verify the platform right from the genesis block. Its technical whitepaper calls this a “succinct blockchain”.

Mina Price Analysis

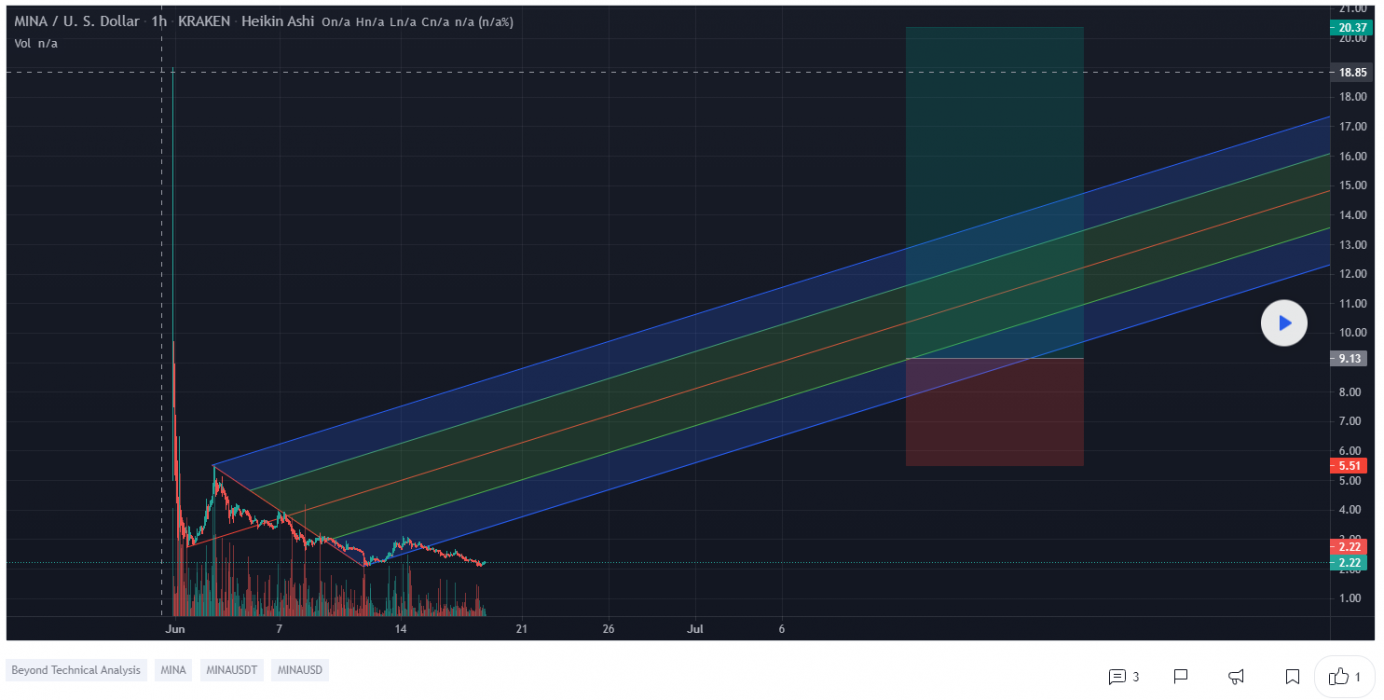
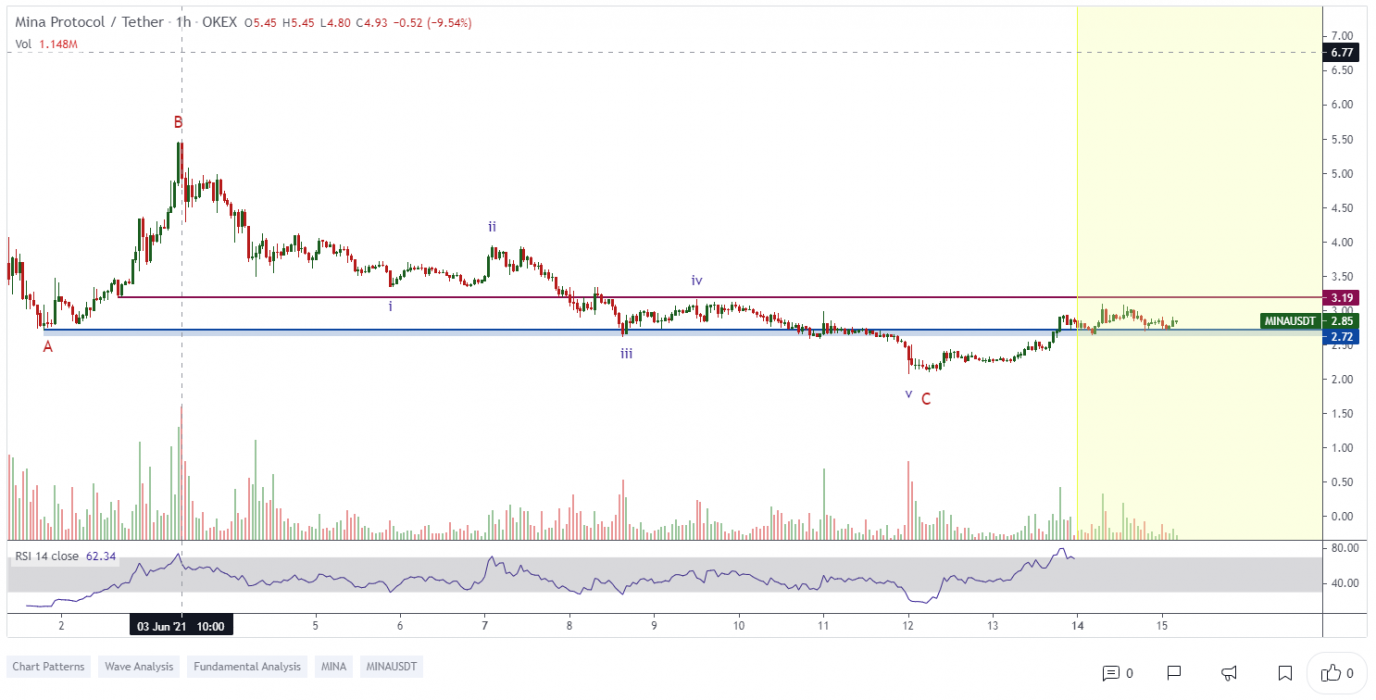
At the time of writing, MINA is ranked the 233rd cryptocurrency globally and the current price is A$2.08. Let’s take a look at the chart below for price analysis:

Source: Tradingview

MINA has continued its steady downtrend. Meanwhile, the chart offers bulls no strong support for long entries.

The recent low at A$2.39 is likely to be swept – a region that offers a glimmer of hope for support based on some methods of measuring moves. However, bulls are likely to wait for more signs of support and a market structure shift before entering long positions.

Resistance rests just overhead between $2.77 and $3.26. The gap at $3.04 offers a high probability target for any potential downtrend retracements. 

A more substantial bullish shift in the markets could help the price run the stops near $4.11 into resistance, beginning near $4.19. Any move upward is likely to find a cap near $5.51, although the current chart offers no hints that a movement this large should occur anytime soon.

3. Orion Protocol (ORN)

Orion aims to solve the difficulties in performing profitable transactions associated with the lack of liquidity on the majority of crypto exchanges. This is the case for both centralised and decentralised exchanges. Orion’s solution to this is to aggregate exchanges’ order books into one simple-to-use-and-understand terminal.

The Orion Protocol’s goal is to help users get the best returns out of their investments while also lowering the risks associated with using multiple exchanges.

ORN Price Analysis

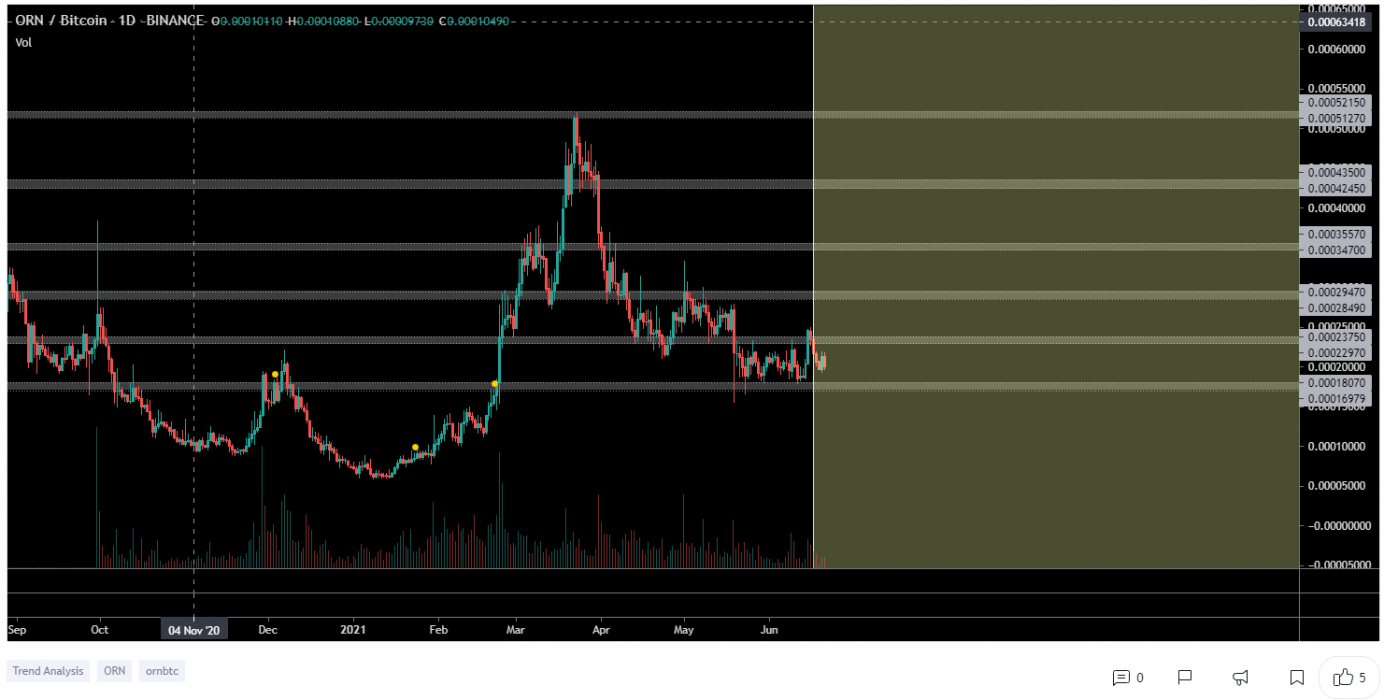
At the time of writing, ORN is ranked the 236th cryptocurrency globally and the current price is A$8.54. Let’s take a look at the chart below for price analysis:

Source: Tradingview

After an 83% retracement from its March highs, ORN found a temporary low near A$6.53. A recent move above $12.61 could be the first sign of a bullish shift – but could also signal a stop run before the next drop lower. 

If the market adopts a more bullish tone, the price could run through the most recent swing high. If this bounce occurs, it would likely find some resistance near $13.85, possibly reaching up to $16.51.

However, a move below the closest support near $6.558 makes stop runs on the swing lows near $7.63 and $6.53 likely. A confluence of several levels near $5.71 could provide a temporary bounce. Still, a sustained bearish market will likely target $5.18 and even $2.39.

Where to Buy or Trade Altcoins?

These three Altcoins have the high liquidity on Binance Exchange, so that could help with trading on USDT or BTC pairs. And if you’re looking at buying and HODLing cryptos, then Swyftx Exchange is an easy-to-use popular choice in Australia.

Categories
Binance Crypto News Market Analysis Swyftx Trading

Top 3 Coins To Watch This Week: MINA, MTS, XVS – Trading Analysis

Let’s take a closer look at this week’s altcoins showing breakout signals. We’ll dive into the trading charts and provide some analysis to help you.

1. Mina Protocol (MINA)

Mina Protocol is a minimal “succinct blockchain” built to curtail computational requirements in order to run DApps more efficiently. Mina has been described as the world’s lightest blockchain since its size is designed to remain constant despite growth in usage. Furthermore, it remains balanced in terms of security and decentralisation. Mina is working on achieving an efficient distributed payment system that enables users to natively verify the platform right from the genesis block. Its technical whitepaper calls this a “succinct blockchain”.

Mina Price Analysis

At the time of writing, MINA is ranked the 223rd cryptocurrency globally and the current price is A$3.68. Let’s take a look at the chart below for price analysis.

Source: TradingView

Since the beginning of June, MINA has been in a gentle downtrend. The future likely holds more stop runs and erratic volatility until the chart forms more substantial high-timeframe levels.

A retracement might uncover support near A$3.50, which is the daily high of the last swing low. The high of the wick beginning near $3.02 may also provide support. However, bulls will likely remain wary of the current downtrend, making the low at $2.71 the likely next bearish target.

Just above, the daily gap beginning near $4.10 may provide resistance to bulls, possibly marking a future range high. A push through this level is likely to target the swing high near $5.12 – perhaps running to probable resistance near $5.38. Strength above this level might signal the start of a bullish trend, encouraging bulls to “buy the dip”.

2. Metal (MTL)

Metal (MTL) is the native currency of Metal products and an essential part of the Metal ecosystem. Sending and receiving any crypto to friends on Metal Pay is, according to the team, instant, and feeless. Designed to make cryptocurrency payments fast and easy, users pay zero fees when sending, receiving, buying or selling MTL.

MTL Price Analysis

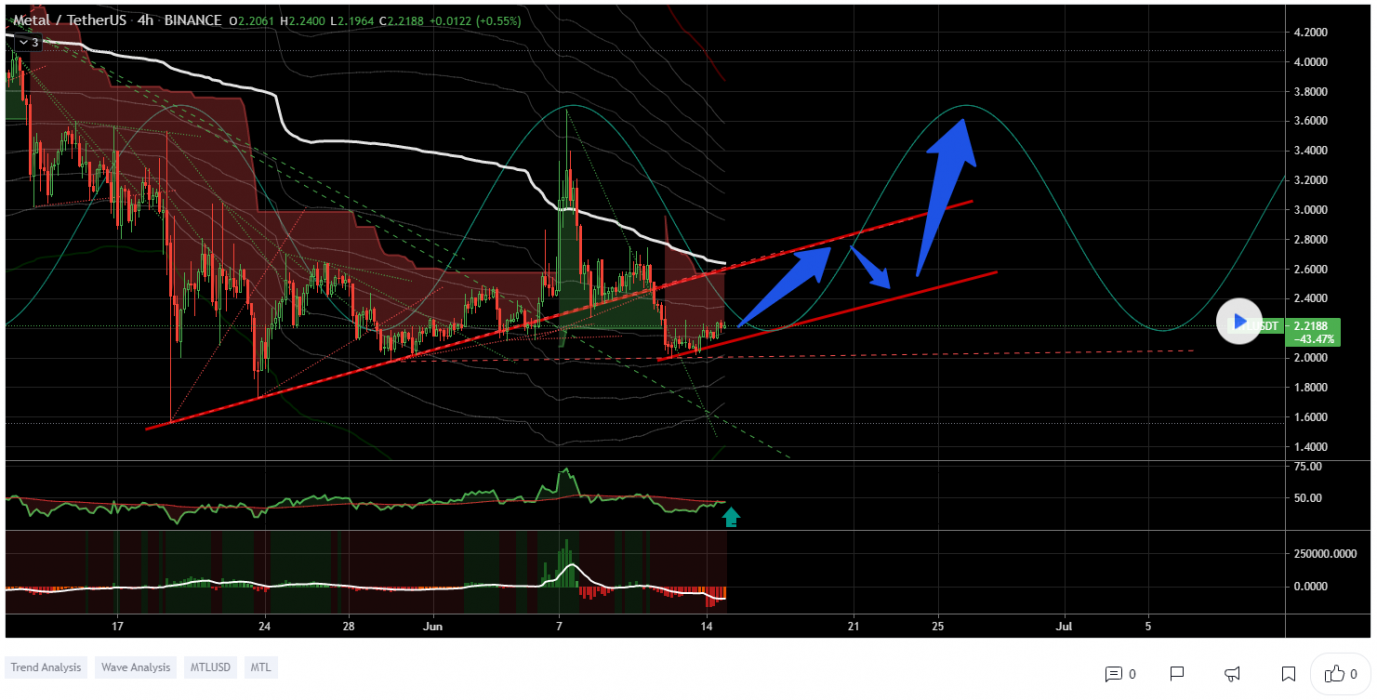
At the time of writing, MTL is ranked the 190th cryptocurrency globally and the current price is A$2.91. Let’s take a look at the chart below for price analysis.

Source: TradingView

March 29’s 450% bullish daily candle has since bled near 85%, with the MTL finding a low near $2.02 in mid-May.

Bulls are buying each drop into support near $2.74, with higher lows forming each time. However, the equal lows near $2.56 create an attractive target for a stop run. Still, bulls might buy this dip near possible support beginning at $2.44.

Just over the June monthly open, $3.18 marks the beginning of a probable resistance zone. A breakthrough in this area might target the equal highs near $3.57 before running into possible resistance near $3.75.

A sustained move upward – perhaps from a market-wide bullish shift – could reach the swing high near $4.77 before encountering probable resistance near $4.87.

3. Venus (XVS)

Venus is an algorithmic money market and synthetic stablecoin protocol launched exclusively on Binance Smart Chain (BSC). The protocol introduces simple-to-use crypto-asset lending and borrowing solution to the decentralised finance (DeFi) ecosystem, enabling users to directly borrow against collateral at high speed while losing less to transaction fees. In addition, Venus allows users to mint VAI stablecoins on-demand within seconds by posting at least 200% collateral to the Venus smart contract.

XVS Price Analysis

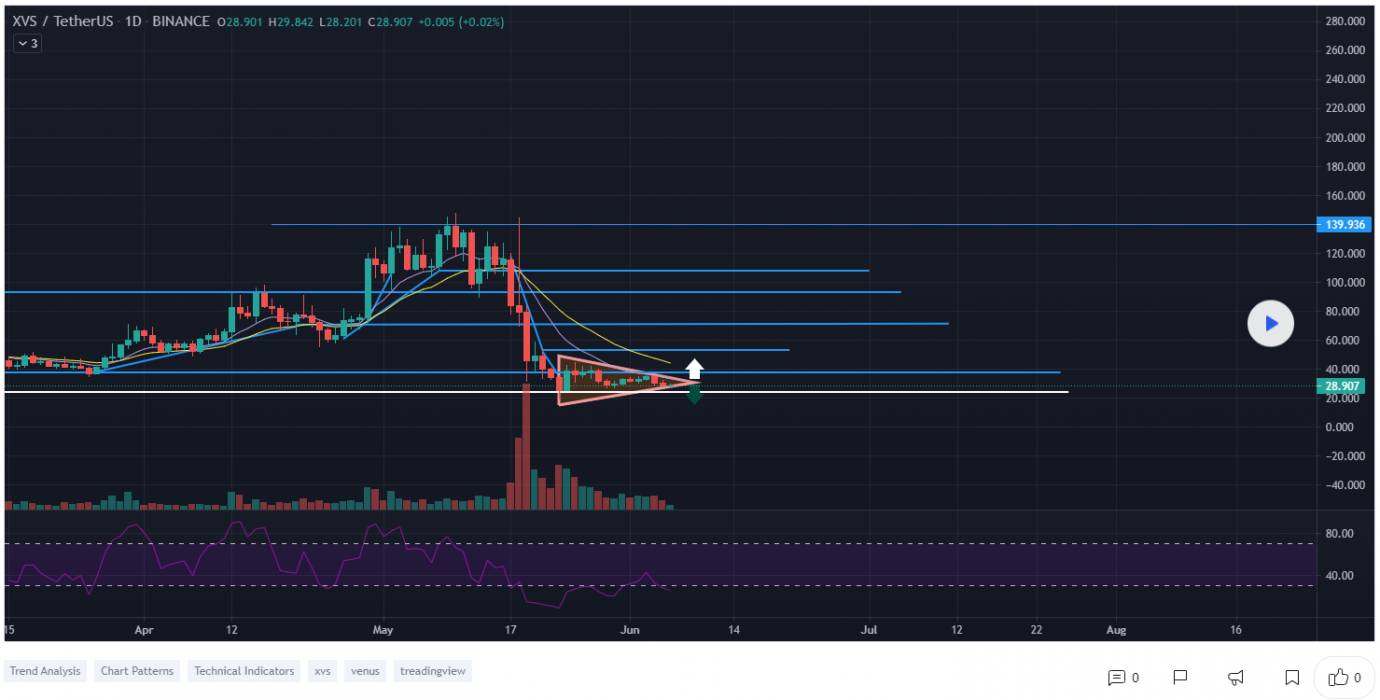
At the time of writing, XVS is ranked the 144th cryptocurrency globally and the current price is A$33.02. Let’s take a look at the chart below for price analysis.

Source: TradingView

During five days in May, XVS dumped over 86% before finding support near $25.67. Consolidation above this level has created a series of relatively equal lows, which are likely to be swept before any longer-term bullish trend begins. 

In the shorter term, the price might establish support near $32.72 before running the swing high at $37.28. If this bullish move occurs, the price could reach resistance near the June monthly open around $42.94 – and even sweep the swing high near $46.42.

Some support might exist at the daily gap near $20.11. A move this low would also fill the February monthly gap and set the stage for a possible bullish reversal.

If this level fails to hold, the price will likely explore the next monthly gap between $12.30 and $6.21. In this zone, the daily swing low at $8.66 makes a likely target.

Where to Buy or Trade Altcoins?

These three Altcoins have the high liquidity on Binance Exchange, so that could help for trading on USDT or BTC pairs. And if you’re looking at buying and HODLing cryptos, then Swyftx Exchange is an easy-to-use popular choice in Australia.
Categories
Bitcoin Crypto News Market Analysis

On-Chain HODL Waves Provide Bullish Signals for Bitcoin

On-chain analytics provide a unique data-driven glimpse into the innumerable dynamics at play within the free market for digital monetary technology. According to a recent article by on-chain Bitcoin analytics firm Glassnode, there are several indicators suggesting that this bull run is far from over.

Key points:

  • Long-term BTC HODLers continue to accumulate during bear markets
  • A new bear market BTC accumulation phase has started
  • Current bull cycle top has not yet been reached

Long-Term HODLers Continue to Accumulate

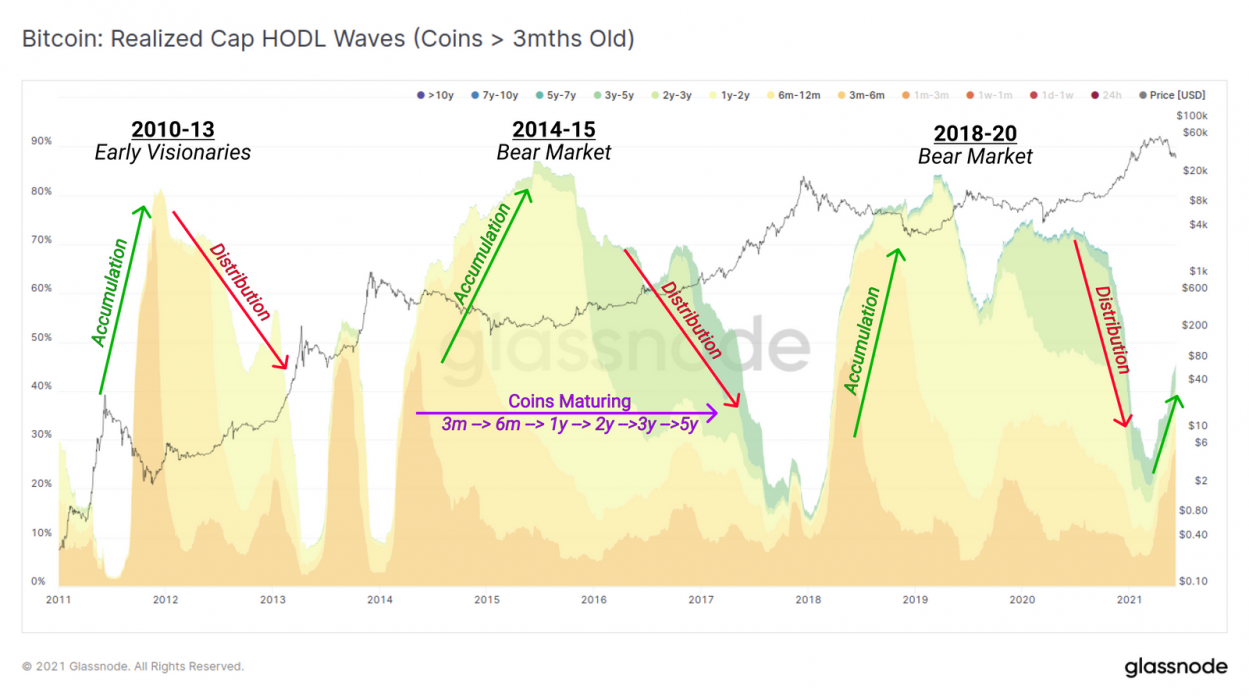
To illustrate, the chart below shows supply accumulation by long-term HODLers and how it consistently peaks during the bear markets.

Based on historical patterns, it would appear that a market top remains some way away.

Glassnode, 2021

Long-Term HODL Conviction Continues to Grow

To elaborate on an earlier point, Bitcoiners and smart money generally implement a simple strategy: accumulate Sats as cheaply as possible and then realise profits (if at all) late in the bull cycle. On-chain data reflects this as long-term HODLers increase holdings during bear markets and withdraw into cold storage.

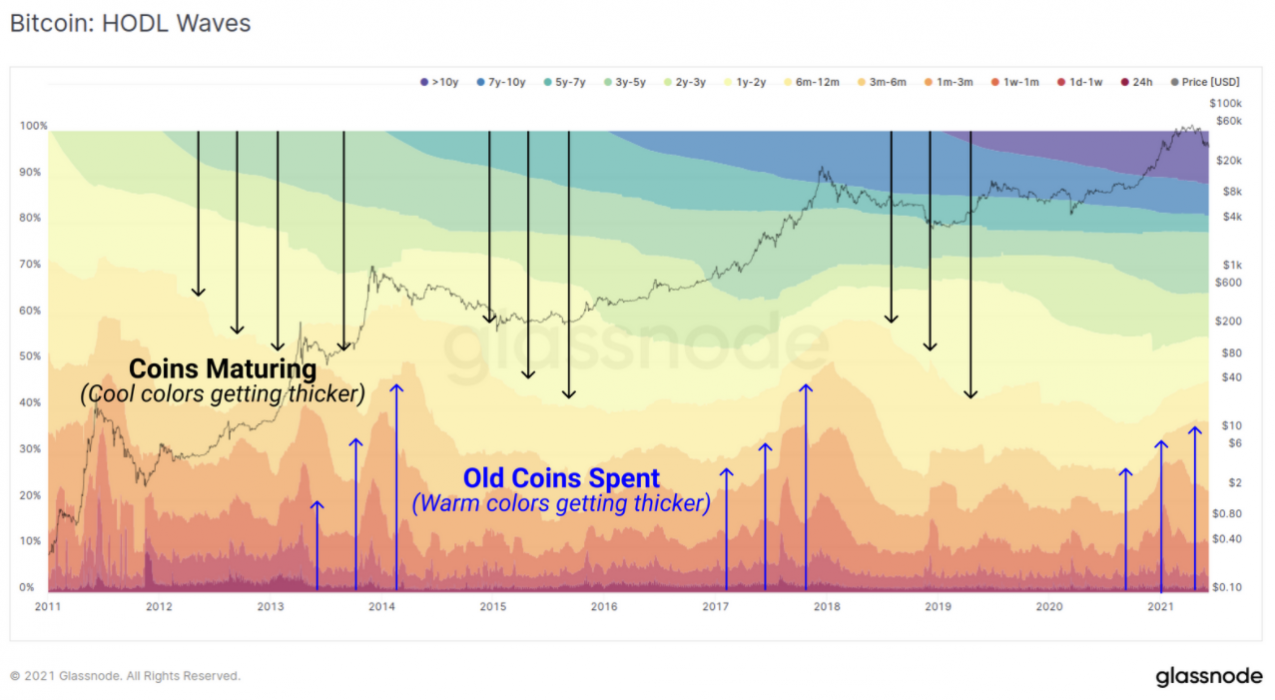
This is outlined in the HODL waves chart below where it can be seen that older age bands (cool colours) are increasing in thickness, suggesting that coins are maturing and are held by strong hands. The thicker these cool bands become, the more supply is owned by long-term HODLers. As old coins are spent, they become reclassified as young coins (warm colours) with a corresponding increase to young HODL wave thickness.

Since Bitcoiners usually only spend their coins late in the bull cycle, one of the ways to identify a shift in macro sentiment is if there is a noticeable swelling in the young age bands.

Comparing the thickness of young age bands relative to previous market tops, it is evident that if history were to repeat itself, then this bull cycle is likely to accelerate further for some time.

Glassnode, 2021

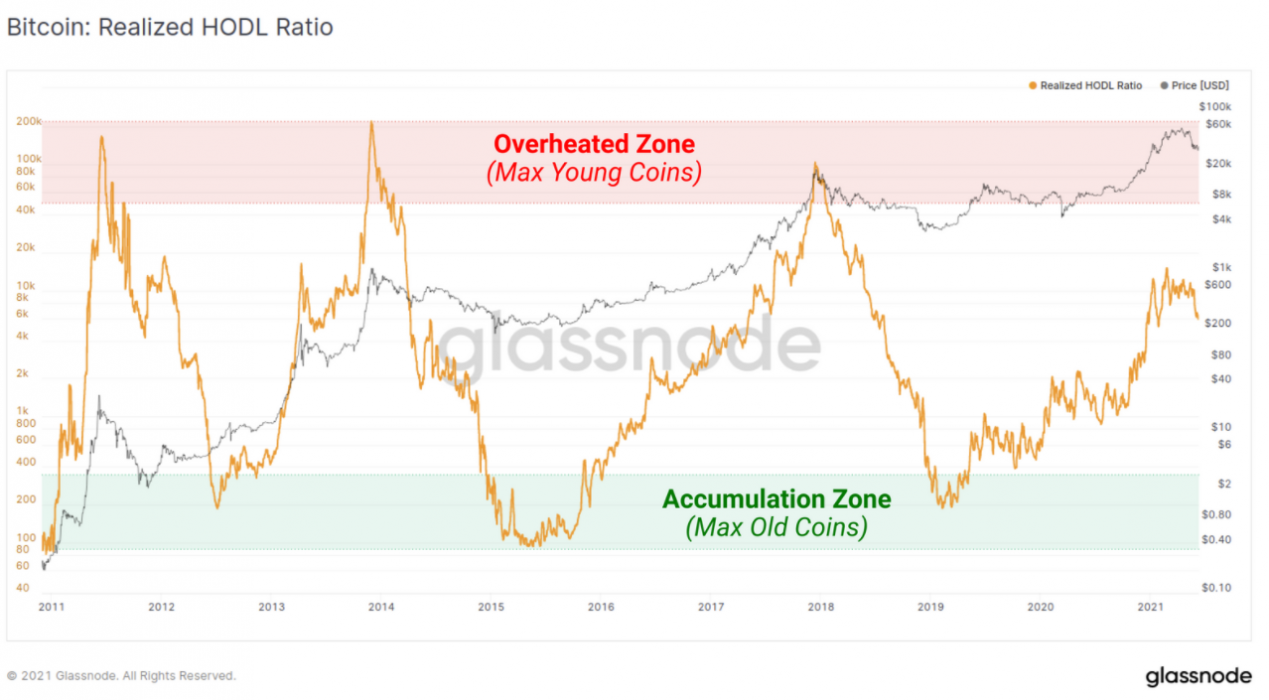
This sentiment is also reflected in the Realised HODL ratio, which describes the cyclical nature of wealth transfer from weak hands to strong hands.

Importantly, bull market tops have been characterised by long-term HODLers transferring a portion of their wealth to new investors. This results in an increased liquid supply and creates a new maximum number of new holders.

Based on historical patterns illustrated in the chart below, it could be argued that a market top in this bull cycle remains out of sight, at least for the time being.

Glassnode, 2021

On-Chain Analytics: Best Viewed in the Broader Context

Despite these positive metrics, analysts often caution investors against relying entirely on on-chain analytics. In an emergent space with an array of diverse participants, each with their own incentives, it is important to always consider the broader context, including technical and fundamental analysis.

Interested in On-Chain Data? Read Further …

In March this year, we reported that a data metric called NRPL (Net Realised Profit/Loss) showed that people were taking profits – with the metric dropping negative for the first time since September 2020.