Categories
Binance Crypto News Ethereum Market Analysis Swyftx Trading

Top 3 Coins To Watch This Week: ETH, ELA, OGN – Trading Analysis

Let’s take a closer look at this week’s altcoins showing breakout signals. We’ll dive into the trading charts and provide some analysis to help you.

1. Ethereum (ETH)

Ethereum is a decentralized open-source blockchain system that features its own cryptocurrency, Ether. ETH works as a platform for numerous other cryptocurrencies, as well as for the execution of decentralized smart contracts.

Ethereum’s own purported goal is to become a global platform for decentralized applications, allowing users from all over the world to write and run software that is resistant to censorship, downtime, and fraud.

Ethereum Price Analysis

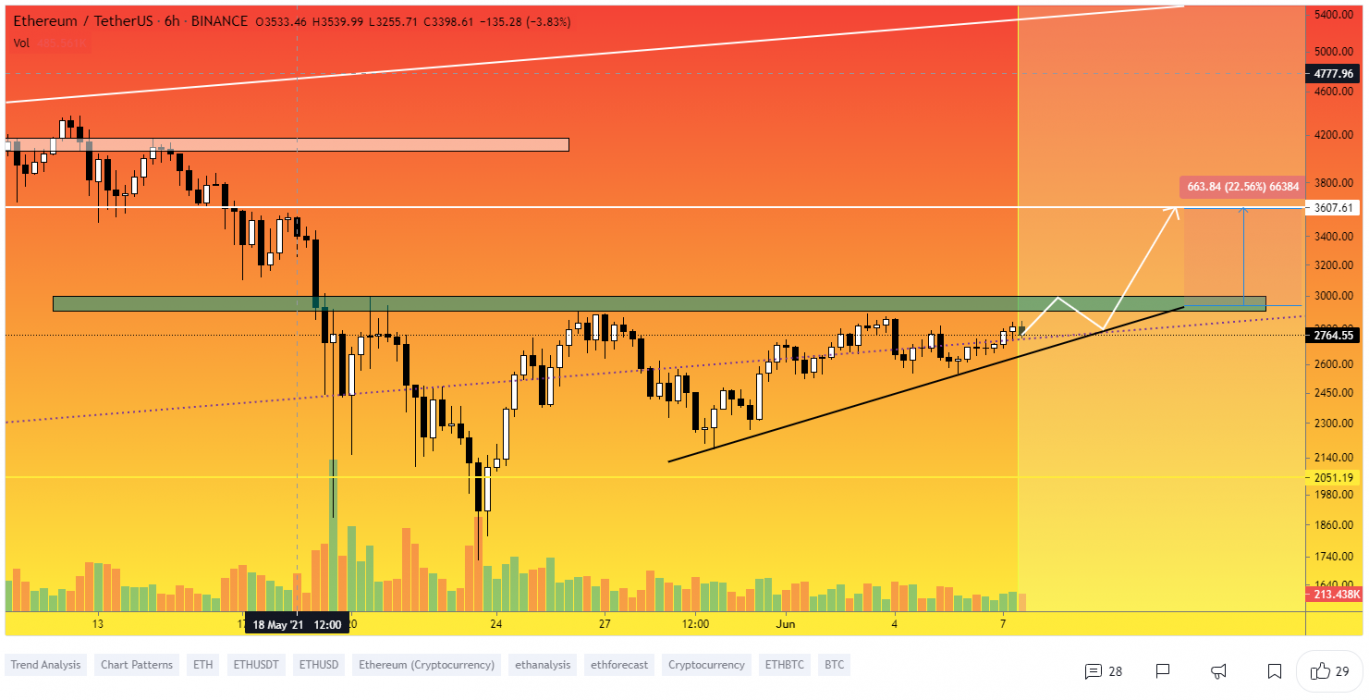
At the time of writing, ETH is ranked 2nd cryptocurrency globally and the current price is A$3571. Let’s take a look at the chart below for price analysis.
Source: TradingView

ETH‘s stunning rally to $5647 plummeted over 60 percent during May to sweep consolidation lows at $2576. This sweep of the lows could set the stage for a new bullish cycle to begin. 

The price is currently balancing around the June monthly open. A quick stop runs into support beginning near $2527 could set the stage for a move into the daily gap beginning near $3255 – potentially reaching resistance near $4624.

A sweep of the highs near $3752, followed by a sharp sell-off, could hint that bears are preparing to run the swing low near $2810 AUD. This drop could find support around $2479 in the candle wick that created the May low. If the market remains bearish, the price will likely sweep May’s low into possible support near $2192.

2. Elastos (ELA)

Elastos aims to be a blockchain-powered version of the internet. The project originates all the way back to the year 2000; however, the current version that is based on blockchain technology and has been in active development by Elastos was founded in June 2017.

The team behind the project genuinely believes that Ethereum, as well as DApp platforms, faces limitations in scaling. While they are great for smart contracts, they are slow, not flexible at all, and inconvenient for full applications, according to Elastos. Elastos is a platform for decentralized apps (DApps for short) that claims to solve many of these limitations.

ELA Price Analysis

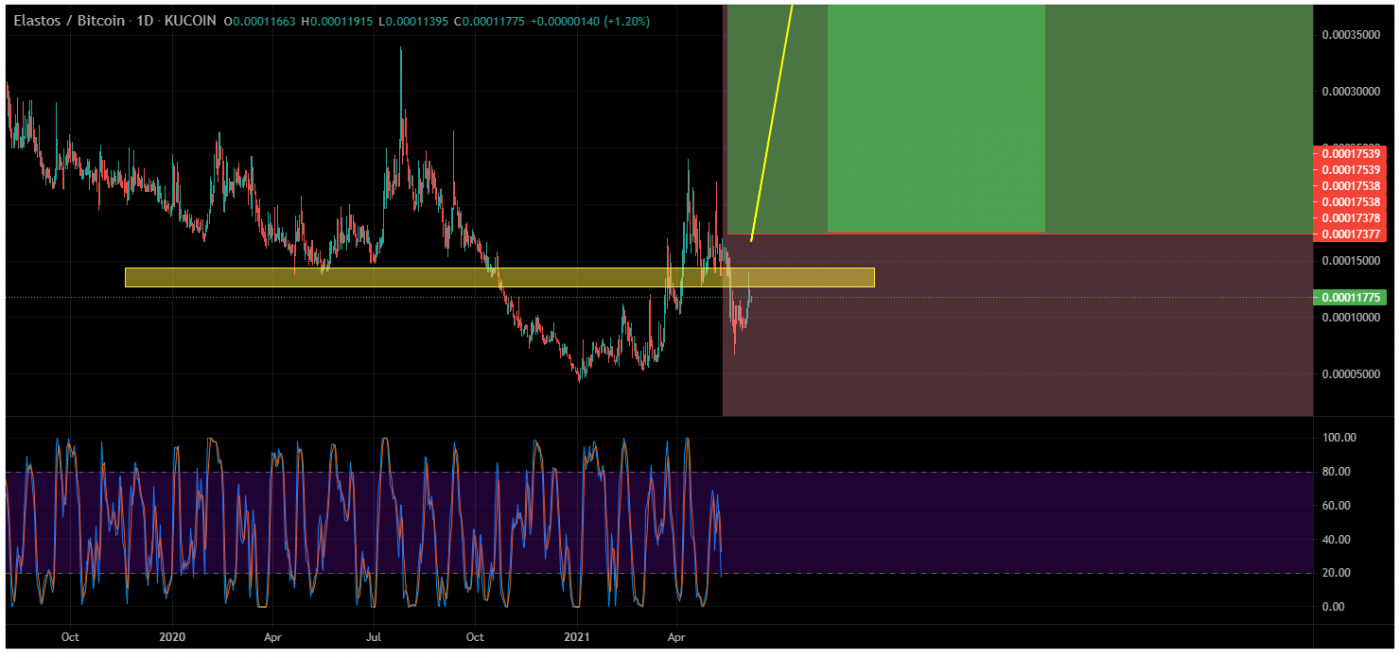
At the time of writing, ELA is ranked the 366th cryptocurrency globally and the current price is A$5.44. Let’s take a look at the chart below for price analysis.
Source: TradingView

ELA formed relatively equal lows near A$3 after dropping over 81 percent during May. These lows could provide the target for another leg down, possibly finding support in the monthly gap of around $2.63. 

If this sweep of the $3.90 swing lows occurs, more aggressive bulls might begin bidding the weekly level near the swing low around $3.37. Should the market take a more bullish turn, the level just below near $5.08 could provide some short-term support.

The steep drop left large areas of inefficient price action, making the daily gap up to $7.60 likely to be touched or filled. A sustained move through this resistance could visit a significant area on the monthly and weekly chart near $9.55.

3. Origin Protocol (OGN)

Origin Protocol is a network that allows market participants to share goods and services through peer-to-peer (P2P) networks. The platform aims to create an extensive online marketplace leveraging the Ethereum (ETH) blockchain and Interplanetary File System (IPFS) in order to eliminate the need for middlemen.

The protocol allows for the creation of a decentralized setting where both buyers and sellers can connect, check for available listings, write reviews, and perform many other actions. With this, fractional usage of assets can be traded more easily.

OGN Price Analysis

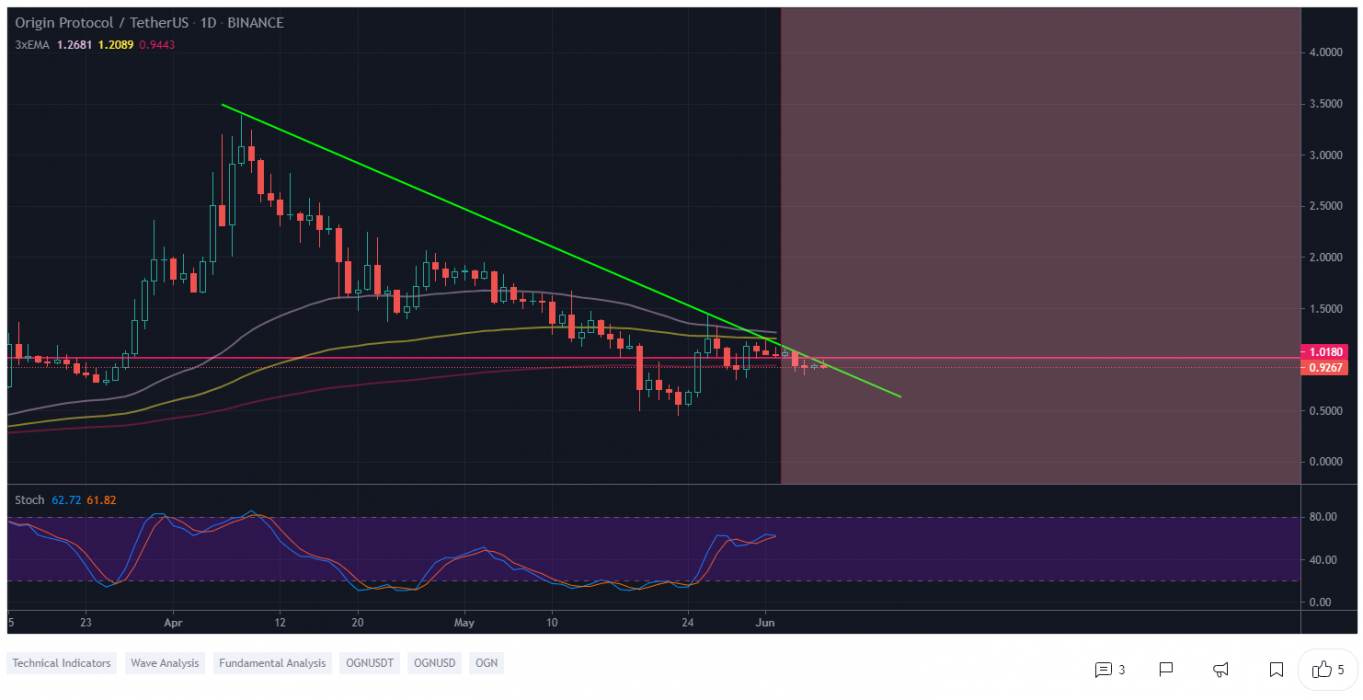
At the time of writing, OGN is ranked the 139th cryptocurrency globally and the current price is A$1.19. Let’s take a look at the chart below for price analysis.
Source: TradingView

April started a gradual 87 percent decline in OGN‘s price. The move into February’s swing high saw a sharp jump in price, showing that some support exists near $0.59.

A sweep of the most recent swing lows into possible support beginning near $1.04 could lead to a rally over the June monthly open. This rally would likely sweep the swing high into the resistance near $1.55. 

This potential bullish move could continue through the relatively equal swing highs near $1.89 – but is likely to find some resistance in the weekly level around $2.

Continued bearishness in the crypto markets might push the price to fill the weekly gap down to $0.54. This drop would sweep the stops under May’s low and potentially mark a new accumulation zone for the next bullish cycle.

Where to Buy or Trade Altcoins?

These 3 Altcoins have the highest liquidity on , so that could help for trading on USDT or BTC pairs. Instead, if you’re looking at buying and HODLing cryptos, then  is a popular choice in Australia.

Categories
Binance Cardano Crypto News Market Analysis Swyftx Trading

Top 3 Coins To Watch This Week: ADA, CLO, VRA – Trading Analysis

Let’s take a closer look at this week’s altcoins showing breakout signals. We’ll dive into the trading charts and provide some analysis to help you.

1. Cardano (ADA)

Cardano is a proof-of-stake blockchain platform that says its goal is to allow “changemakers, innovators, and visionaries” to bring about positive global change. The open-source project also aims to “redistribute power from unaccountable structures to the margins to individuals” — helping to create a society that is more secure, transparent, and fair.

ADA Price Analysis

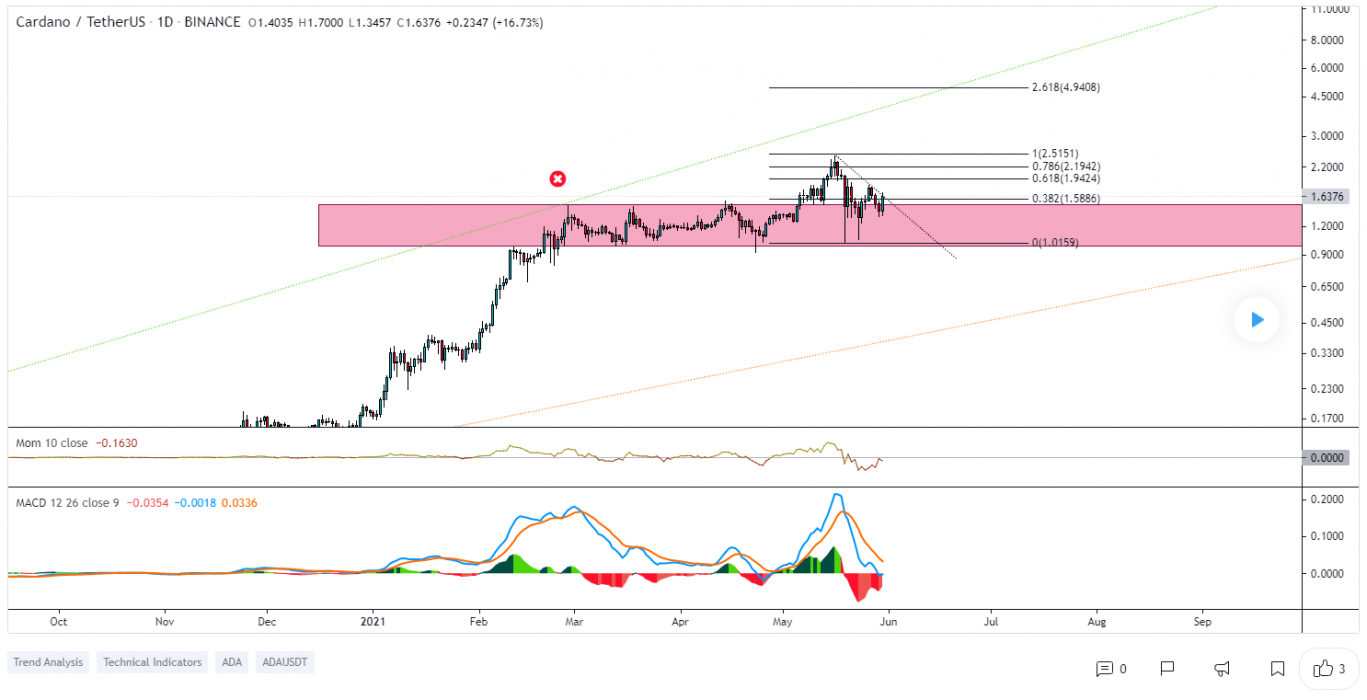
At the time of writing, ADA is ranked 4th cryptocurrency globally and the current price is $2.14 AUD. Let’s take a look at the chart below for price analysis.

Source: TradingView

ADA‘s 97% climb during early May returned to the monthly open, sweeping lows several times down to $1.32 AUD.

Last week, the price bounced from the monthly open near $1.78 AUD again, creating possible support near $2.02 AUD. A quick sweep of this recent swing low could reach into a support area near $1.70 AUD, while a sharp downturn in the market is likely to run for the relatively equal lows near $1.40 AUD.

If the price breaks through the closest significant resistance near $2.30 AUD, the swing high at $2.45 AUD is a likely target. This move could reach a daily gap near $2.60 AUD.

Strong bullish momentum could propel the price to resistance near $2.81 AUD. If this move occurs, the significant swing high near $3.15 AUD provides a reasonable goal.

2. Callisto Network (CLO)

Callisto Enterprise, a branch company focusing on enterprise applications of blockchain technology. Several major public transport companies from central and eastern Europe have joined in this initiative.

Callisto has built a scalable blockchain ecosystem featuring a staking mechanism, a full DeFi protocol, and a stablecoin. Callisto Network is a self-sustaining and self-funded blockchain ecosystem, not financed by pre-mined coins or an ICO.

CLO Price Analysis

At the time of writing, CLO is ranked 513th cryptocurrency globally and the current price is $0.02086 AUD. Let’s take a look at the chart below for price analysis.

Source: TradingView

CLO spent the month of May ranging across the monthly open, reaching 26.5% over and 45% below.

The price is currently consolidating between adjacent resistance and support at $0.01675 AUD with no clear higher-timeframe trend. A strong move over the monthly open could signal a run to resistance beginning near $0.02275 AUD. 

This move would likely target the swing high at $0.02541 AUD and relatively equal highs near $0.02761 AUD. A sustained bullish trend could reach up to the April high near $0.03500 AUD.

Bulls might see a sweep of the relatively equal lows near $0.01142 AUD as a chance to buy at a discount. If this level fails to hold, the next significant area for the price to find buyers is likely near the consolidation around $0.00724 AUD that began March’s bullish trend.

3. Verasity (VRA)

Verasity is a Protocol and Product Layer Platform for Esports and Video Entertainment. Verasity’s mission is to significantly increase advertising revenues for video publishers on any video platform through its rewarded player and ad stack utilizing its patented protocol layer on the blockchain – Proof of View. PoV is the only Protocol Layer patented technology for the blockchain USA Patent.

VRA Price Analysis

At the time of writing, VRA is ranked 394th cryptocurrency globally and the current price is $0.02433 AUD. Let’s take a look at the chart below for price analysis.

Source: TradingView

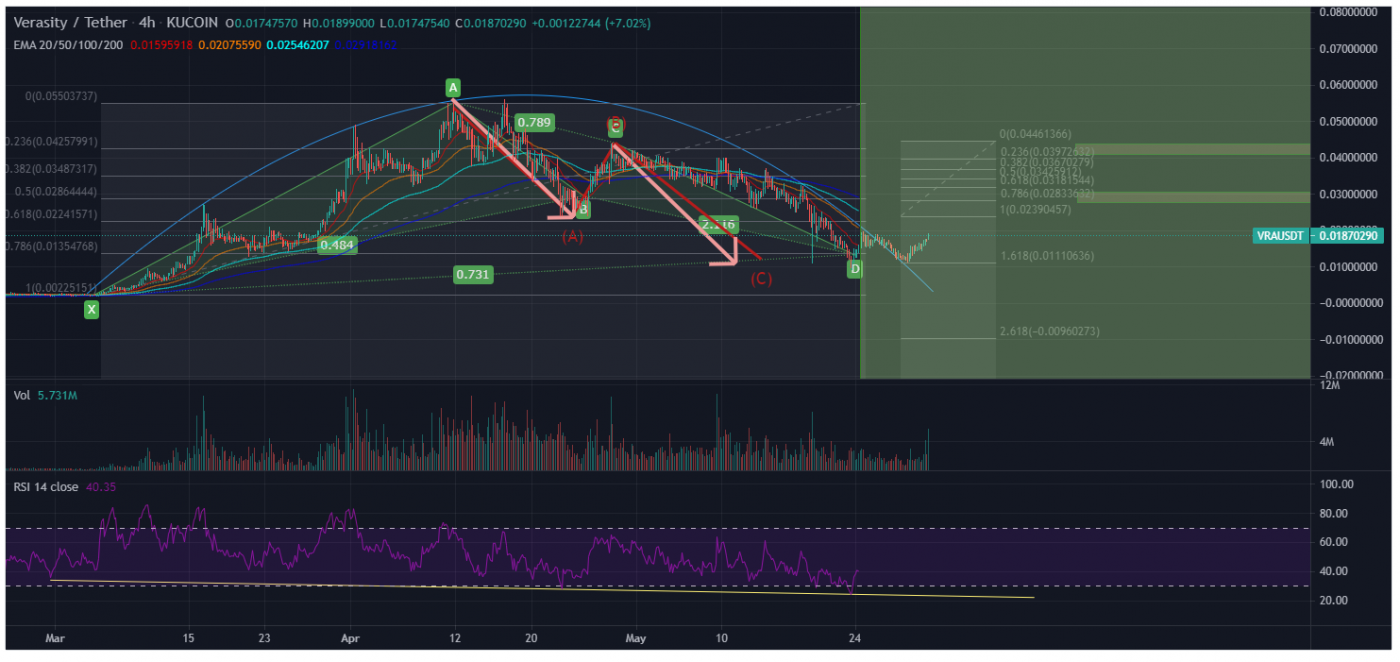
VRA‘s strong downtrend that began in mid-April has retraced most of its Q1 move, recently sweeping lows near $0.0168 AUD but struggling to find strong support.

A sweep of the relatively equal lows near $0.0128 AUD into possible support around $0.00122 AUD, combined with bullish market conditions, could be the catalyst that begins to form a bottom. If this level fails, bulls might buy the monthly gap’s low near $0.0098 AUD.

The swing low near $0.0326 AUD may form resistance to any sudden pumps as holders unload some of their position. A more substantial move might sweep relatively swing highs into probable resistance near $0.0438 AUD, potentially reaching up to the May monthly open near $0.0521 AUD.

Where to Buy or Trade Altcoins?

These 3 Altcoins have high liquidity on Binance Exchange so that could help with trading. Instead, if you’re looking at buying and HODLing cryptos, then Swyftx Exchange is a popular choice in Australia.

Categories
Bitcoin Crypto News Market Analysis

Bitcoin’s Historical Corrections And Why They Happened

Bitcoin (BTC) has shown a tremendous increase in value since its inception and even been considered one of the best performance institutional digital assets.

However, its price history has not been a smooth one. In fact, the leading cryptocurrency has suffered a number of significant drops (not less than 20 percent) since January 2012, as shown in an infographic by Visual Capitalist Datastream.

Bitcoin’s Massive Drops

2012

After Bitcoin recovered from the first massive drop of  42.9 percent ($7 – $4 USD) in January 2012, the price further declined by 56.3 percent ($16 – $7 USD) in August the same year, following the exit of Bitcoin Savings and Trust Ponzi scheme with about 150,000 BTC belonging to clients.

2013 – 2016

The biggest BTC drop was noted between November 2013 – January 2016, when Bitcoin price declined from $1,163 – $152 USD, which accounted for about $86.9 percent price change. This happened after the news of Mt. Gox hack, China’s ban on Bitcoin, and regulatory challenges.

2017 – 2018

In 2017, the largest cryptocurrency also dropped by over 40 percent following the breaching of Coincheck, one of the leading Japanese exchanges. The attack resulted in the loss of over $530 million worth of cryptocurrencies. Bitcoin also took a significant drop of over 83 percent ($19,666 – $3,220 USD) from December 2017 to December 2018. This had many people referring to Bitcoin as a “burst bubble.”

2019 – 2021

Bitcoin also dropped by over 60 percent between June 2019 and March 2020, which was partly induced by the coronavirus outbreak. This leads up to the recent market crash in March 2021, which was triggered by Tesla’s news that they stopped accepting Bitcoin for payment and China’s call to crack down on Bitcoin mining and trading. Bitcoin is down by about 33 percent when compared to its current price of around $38,000 USD at the time of writing.

Following these historical corrections of Bitcoin, many people are optimistic that the cryptocurrency will rebound from the current dip.

Categories
Binance Crypto News Market Analysis Swyftx Trading

Polygon (MATIC) Just Surged +118% in a day as Dotmoovs is scaling with Polygon

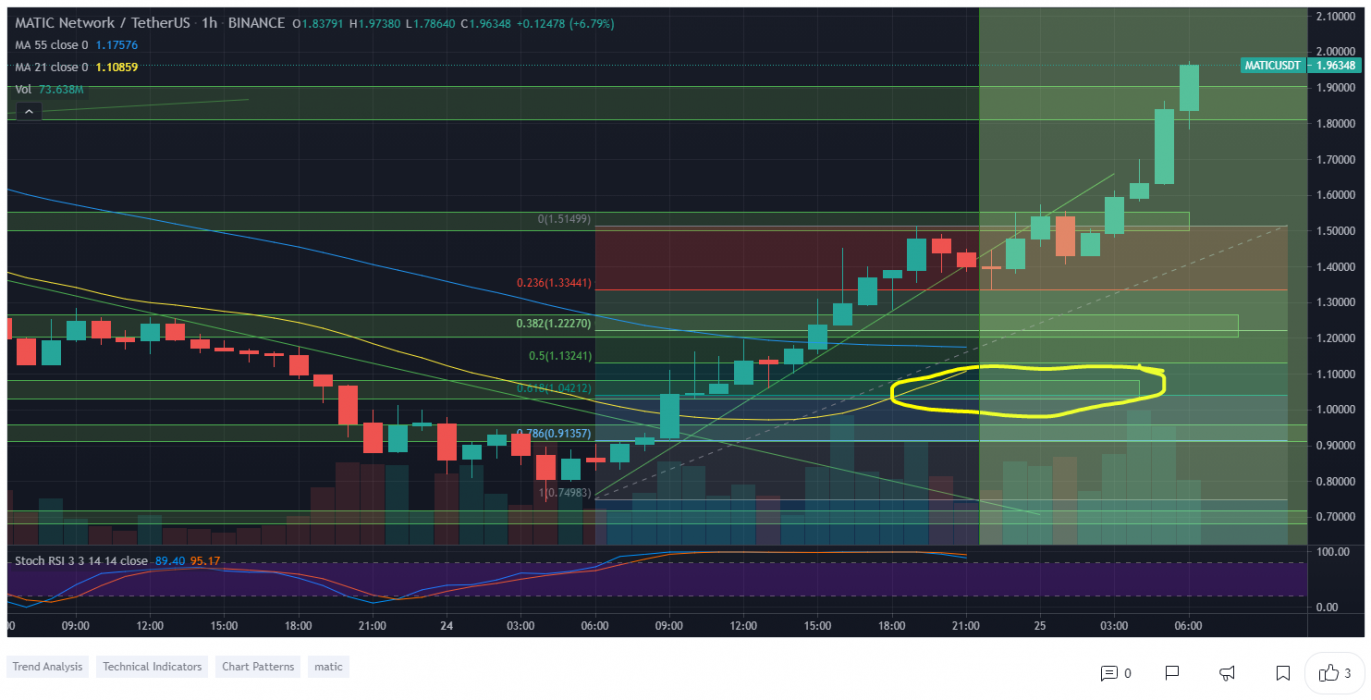
Polygon (MATIC) is trading in an uptrend, like many other altcoins. The cryptocurrency MATIC just went up +118% in a single day by breaking a falling wedge pattern with strong buying volume and surges over +145.23% in a week.

What is MATIC?

Polygon (previously Matic Network) is one of the first well-structured, easy-to-use platform for Ethereum scaling and infrastructure development. Its core component is Polygon SDK, a modular, flexible framework that supports building multiple types of applications.

Polygon effectively transforms Ethereum into a full-fledged multi-chain system (aka Internet of Blockchains). This multi-chain system is akin to other ones such as Polkadot, Cosmos, Avalanche, etc. with the advantages of Ethereum’s security, vibrant ecosystem, and openness.

MATIC Price Analysis

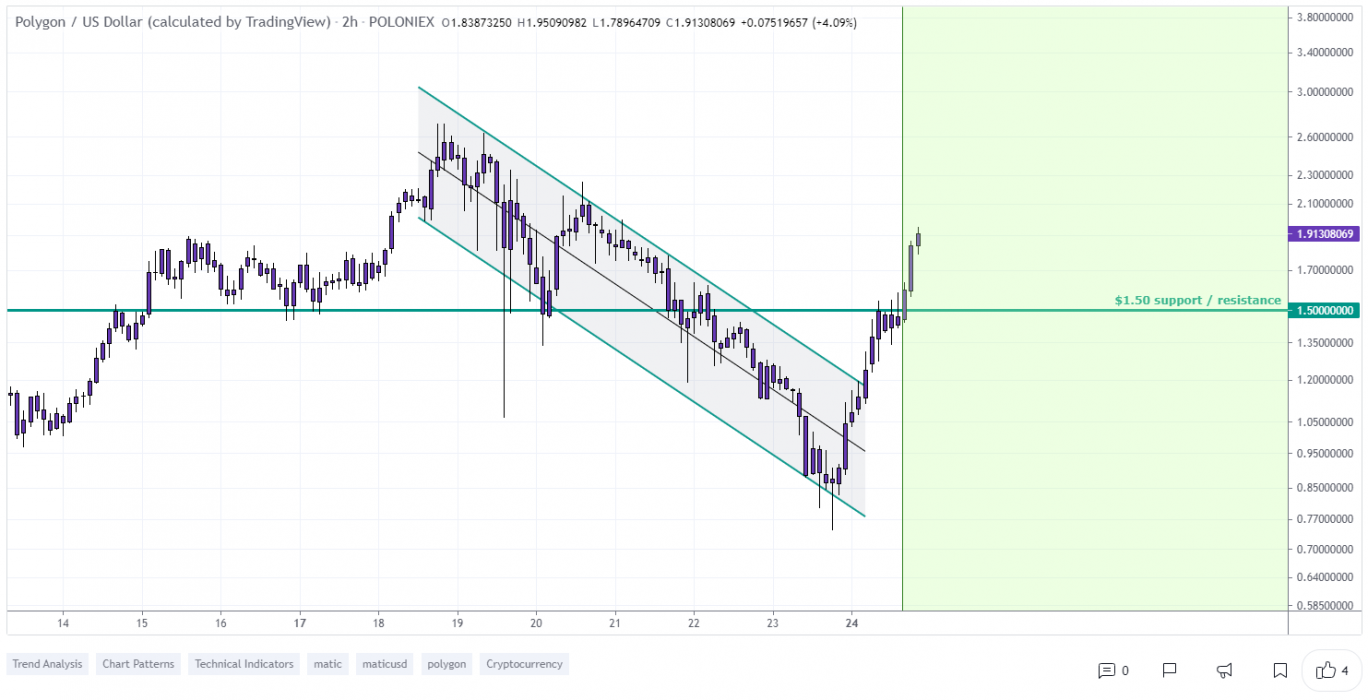
At the time of writing, MATIC is ranked 13th cryptocurrency globally and the current price is $2.41 AUD. This is a +145.23% increase since 18th May 2021 (7 days ago) as shown in the chart below.

Source: TradingView

After looking at the above 2-hour candle chart, we can clearly see that Matic was trading inside the falling wedge pattern on the MATIC/USDT pair. The first resistance was on the $1.90 AUD price levels which MATIC broke with a strong bullish trend buying volume and is now heading towards the all-time high price in AUD. Seeing that many altcoins are holding a strong position this week after the recent bitcoin crash recovery, MATIC might continue to increase in the uptrend if the traders keep buying with high volume.

“The Falling Wedge is a bullish pattern that begins wide at the top and contracts as prices move lower. This price action forms a cone that slopes down as the reaction highs and reaction lows converge.”

Source: TradingView

What Do The Technical Indicators Say?

TradingView indicators for MATIC

TradingView indicators (on the 1 day window) mainly suggest MATIC as a strong buy, except the Oscillators which indicate MATIC as a neutral.

So Why Did Matic Breakout?

General market sentiment seems to suggest cryptos are hopefully turning back bull run season after recent massive price corrections. Another reason for this sudden pump in price could be whales secretly buying MATIC for the next Altcoins rally. Recent news also announced exciting development involving Polygon.

Investors are taking a deep interest into Polygon. Its unique model, success in drawing users from larger blockchains, and high-and-growing market capitalization make it a safer bet for buyers. Growth seems very likely. But, at what rate the token will grow is a point of contention among analysts.

Where to Buy or Trade Matic?

MATIC has high liquidity on the Binance exchange which could help for trading MATIC/BTC or MATIC/USDT pairs. Instead, if you’re looking at buying and HODLing cryptos, then Swyftx Exchange is a popular choice in Australia.

Categories
Bitcoin Cryptocurrencies Investing Market Analysis Trading

The 5 Biggest Problems In The Crypto Space Right Now

As the crypto market continues its biggest correction of 2021, while future investments are hedged and day traders rush to cash out, more experienced investors resign themselves to jumping yet another HODL hurdle.

Although steep corrections are just business-as-usual in the crypto world, there are a number of factors setting this particular correction apart from previous ones and pointing to broader issues in the crypto sphere.

There is a prevalence of shitcoins

The term “altcoin” looks definitely outdated – many new cryptocurrencies really do bring something unique to the table and are backed by plenty of research and development.

Everyone is looking to get a piece of the crypto pie – and for every Chainlink (LINK) or Cardano (ADA), there is an army of cryptocurrencies that either have arguably no real use case, like Safemoon, or were explicitly created as a joke. Not only do investors stand to lose a lot by investing in dodgy cryptos – the rugpulls many of these coins do lower the level of trust in cryptocurrencies overall.

New crypto traders are entering the crypto space without training and buying at All-Time Highs (ATH)

In a market where DYOR (Do Your Own Research) raises from common sense to paramount importance, many investors hop right in and buy the latest crypto they heard about on Twitter. There often seems to be a lack of understanding of the project behind a certain coin, let alone the planning of an investment or trading strategy.

Combined with the excitement of being involved in the crypto space, the desire of quick gains and maybe the fear of missing out on that, some people end up buying at the ATH of a certain cryptocurrency. A quick look at a price chart would have indicated that a correction could be imminent.

Thankfully, resources like Binance Academy are doing a great job of breaking down the basics and turning new investors into more seasoned veterans.

Certain individuals are able to cause 25% price swings with a single tweet

The popularity of some “cool billionaires” has definitely contributed a lot in terms of public awareness of cryptocurrencies. However, the veneration bestowed upon them can also lead the same fans to take sharp turns with their own crypto positions, based on their celebrities activity on social platforms like Twitter.

Such influence results in certain coins getting pumped (or dumped) in price just because they are mentioned by a popular supporter. Case in point, Dogecoin (DOGE) – which may be funny, but at the end of the day, it was created as a joke.

Two consequences stand out: on one side, uneducated retail investors may end up making poor decisions with their cryptos just by following the hype and social media noise. On the other, the control a given influencer seems to have on the price volatility of specific cryptos makes them, if not the overall market, less attractive for institutional investors.

Over 60% of Bitcoin mining power is still controlled by China

Bitcoin is now mainly mined in huge facilities, as the difficulty has gone up making the process not financially viable for small mining rigs. Many Chinese entrepreneurs have made their fortune by sprawling complexes pumping out digital gold. Unfortunately for them though, the Chinese government doesn’t seem to be too happy with cryptocurrencies outside of their tentative CBDC. Bans or policies on cryptocurrency issued by the country where 60% of BTC is mined can have tragic consequences for the corresponding markets.

Furthermore, some regions of China have decided to crack down on crypto miners due to the amount of electricity used in the process. A dramatic shortage in BTC mining not only cuts the supply but also hinders the overall network.

Bitcoin’s Proof-of-Work blockchain consumes an excessive amount of energy

Bitcoin has changed the world of digital payments. Unfortunately, given its current scale and rate of adoption, the Proof-of-Work (PoW) component of the the most popular cryptocurrency’s blockchain is now causing huge amounts of energy consumption globally.

Transaction fees and mining power have seen such a steep increase that some companies have stopped accepting BTC payments. It’s also no surprise that a lot of attention is being turned towards “greener” cryptocurrencies and technologies built to make Bitcoin work in ways that do not harm the environment as much.

As the bull market that lasted for over half a year seems to be fading, it’s important to remember that this has happened plenty of times before. The market will hopefully emerge from this temporary hurdle stronger and more mature than it previously was.

Categories
Binance Crypto News Market Analysis Swyftx Trading

3 Coins that Might Breakout this Week: REEF, SFUND, SOL – Altcoins Trading Analysis

In today’s trading news, we’re looking at three Altcoins that might breakout this week by showing bullish trends in the charts.

1. Reef Finance (REEF)

Reef is a DeFi platform built on Polkadot that aims to deliver cross-chain trading. A yield engine and a smart liquidity aggregator are among the project’s offerings. Reef aggregates liquidity and provides automation. It also aims to address the drawbacks associated with existing trading platforms. While centralized exchanges are prone to security breaches, decentralized rivals can lack liquidity and are often difficult to use.

REEF Price Analysis

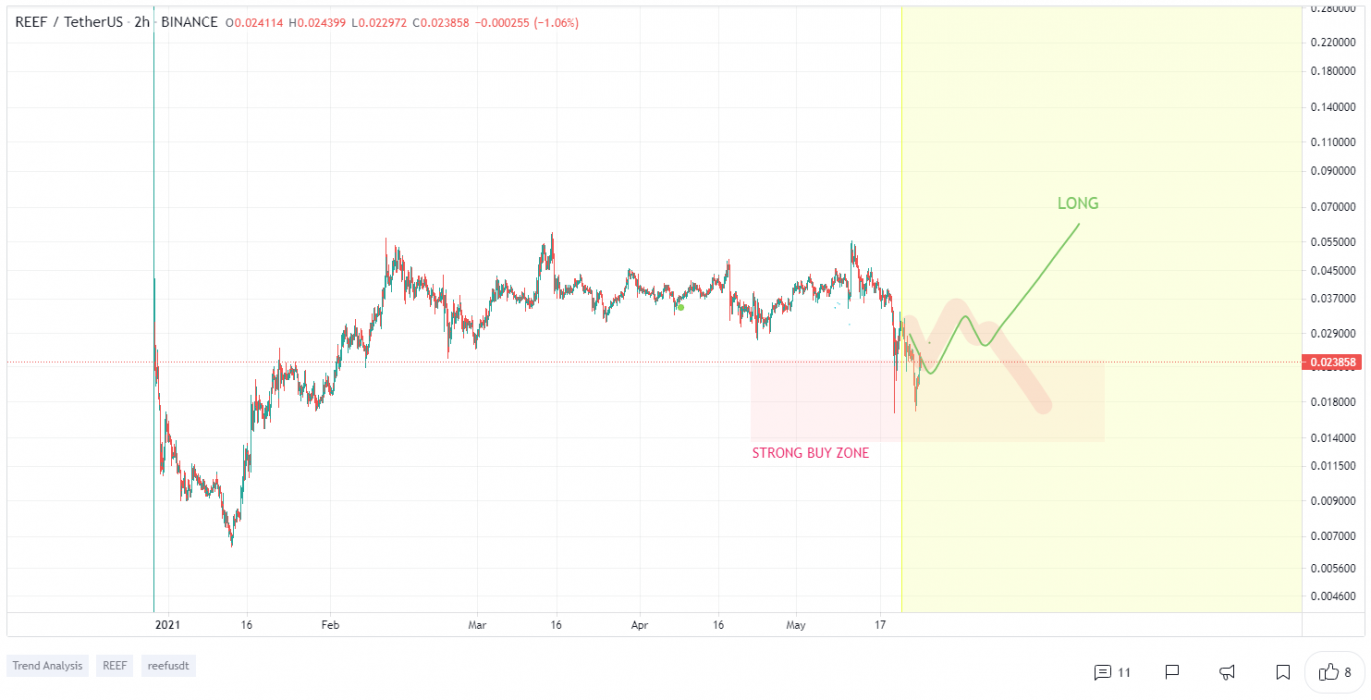
At the time of writing, REEF is ranked 128th cryptocurrency globally and the current price is $0.03093 AUD. Let’s take a look at the chart below for price analysis.

Source: TradingView

After a nearly three-month period of distribution, REEF has dropped to the 79% retracement of its candle-bodied range. With the price at a steep discount relative to its trading range, buyers hunting for a deal could see an opportunity.

The consolidation low near $0.02538 AUD has provided support. However, the multiple equal lows may attract a stop run before any significant break to the upside.

If the price sweeps these lows, the daily gap beginning near $0.02165 AUD could cap its downward movement. Strong bearish momentum may propel the price into the consolidation near $0.01870 AUD.

Layered resistance rests overhead, with $0.03525 AUD possibly providing a ceiling to the first bullish impulses. A move through this level may find some resistance near $0.03918 AUD, while $0.04478 AUD could form the roof until a new bullish trend emerges.

2. Seedify.fund (SFUND)

Seedify.fund is a blockchain innovation ecosystem, with a community-driven Seed Stage Fund, Decentralized Incubator, and Launchpad. Seedify.fund cross-bridges a community-driven DAO with an incubator/seed fund to provide seed investments to projects selected by community votings.

SFUND Price Analysis

At the time of writing, SFUND is ranked 877th cryptocurrency globally and the current price is $2.76 AUD. Let’s take a look at the chart below for price analysis. Note: this chart is on the pair SFUND-BNB.

Source: TradingView

SFUND‘s five days of glory culminated in eleven days of bullish despair as the price plummeted nearly 75% from its highs.

The explosive pump left little bullish support below, with $1.95 AUD providing an area to look for buying on the daily chart. A test of this level could reach possible support near $1.80 AUD, which marks the approximate midpoint of the four-hour chart’s consolidation that preceded the pump.

However, the final bottom may emerge below $1.52 AUD, where a nine-day consolidation suggests the bulk of the buying took place.

The lower half of the upcandle at $2.80 AUD may provide resistance, with a pump through this level possibly letting trapped buyers out near $3.25 AUD.

A burst of bullish energy could reach as high as the daily gap near $4.75 AUD. However, this doesn’t seem likely to occur unless market conditions become more bullish.

3. Solana (SOL)

Solana is a highly-functional open source project that banks on blockchain technology’s permissionless nature to provide decentralized finance (DeFi) solutions. The Solana protocol is designed to facilitate decentralized app (DApp) creation. It aims to improve scalability by introducing a proof-of-history (PoH) consensus combined with the underlying proof-of-stake (PoS) consensus of the blockchain.

SOL Price Analysis

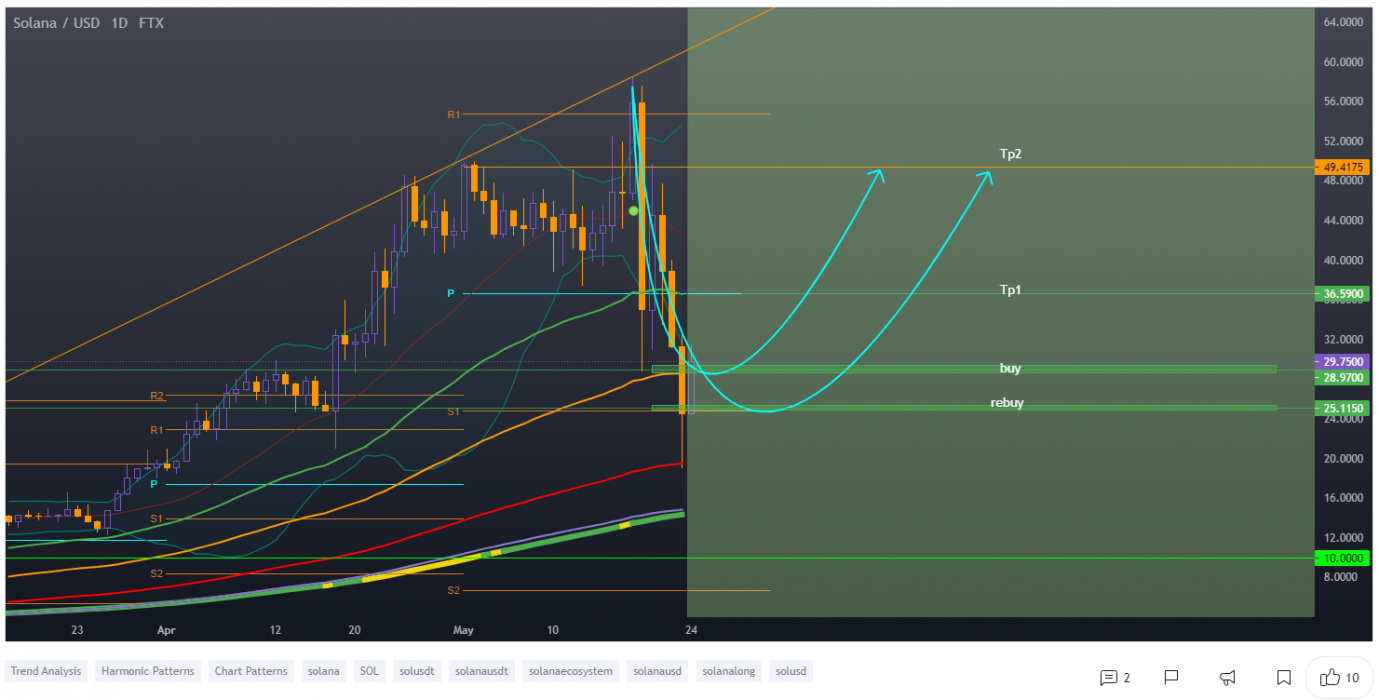
At the time of writing, SOL is ranked 18th cryptocurrency globally and the current price is $38.51 AUD. Let’s take a look at the chart below for price analysis.

Source: TradingView

The -67% finale to SOL‘s nearly month-long distribution calls “Solana Summer” into question. However, the coin has often shown strength during the crypto market’s bearish microcycles.

The recent sweep of the $28.03 AUD low into support starting near $29.50 AUD could be all bulls require before some upward movement.

Just below, a monthly gap at $26.55 AUD might provide support on a sweep of last week’s low, although the price may pierce through this gap. If the crypto market stays bearish, the price might visit the consolidation lows and support near $16.44 AUD.

Trapped bulls looking for hedges or exits could be selling near the swing low and daily gap starting near $41.25 AUD. A higher bounce might find more resistance around $48.91 AUD, near the midpoint of an upcandle and the distribution range’s swing low. Beyond these two resistances, the zone near $55.36 AUD might mark the top until a new bull cycle.

Where to Buy or Trade Altcoins?

These 3 Altcoins have high liquidity on Binance Exchange so that could help with trading. Instead, if you’re looking at buying and HODLing cryptos, then Swyftx Exchange is a popular choice in Australia.
Categories
Bitcoin Crypto News Market Analysis

Bitcoin Has Crashed, But is it Time to Buy?

Over a 50% ShakeOut

Don’t panic. This is normal. Even though it has been hailed as the best performing asset ever, Bitcoin’s infamously known for its wild volatility. As more and more money has poured into the cryptocurrency market and Bitcoin, from new retail investors and also large institutional deep pockets; the volatility is crazier than ever.

Market Correction or Huge Dump?

Call it what you will, there is no denying that there is a mixture of panic and excitement in the air: for those more experienced investors who are not deterred by the sea of red, who have weathered many a Bitcoin storm and have a bag of cash set aside, exactly for these ‘rainy days’, can only smell opportunity.

Is it time to buy?

Was this huge ‘correction’ inevitable? Bitcoin had been experiencing an impressive state of steady growth, however, the usual 20% and 30% dips we are used to seeing, were getting bought up faster than ever before, causing the price to rise too quickly for it to be sustained. Those that are unshaken by this last correction hope that Bitcoin will now continue to the upside, but at a more slow-and-steady healthy pace.

Reasons to stay bullish

There are some key levels of support and resistance around the low $30,000 range that Bitcoin needs to either break or sustain before we can know if this is the start of the bear market or just the bull market being prolonged. If so, we might see a second rally to the upside. Either way, the market will likely be very choppy for the next few weeks or even months.

When in doubt, zoom out

While it now seems extremely unlikely that Bitcoin will hit a target of $300,000 anytime soon, we do have some fundamentally good news still to come later this year. Parachains such as Polkadot and Kusama are coming, we have Ethereum’s EIP 1559 and Smart Contracts being announced for Cardano. If Bitcoin can keep its head up, it might just carry the Bullrun into 2022.

Youtuber Sheldon Evans breaks it down.

Categories
Crypto News Market Analysis Trading

Bitcoin Fear and Greed Index Showing Extreme Fear

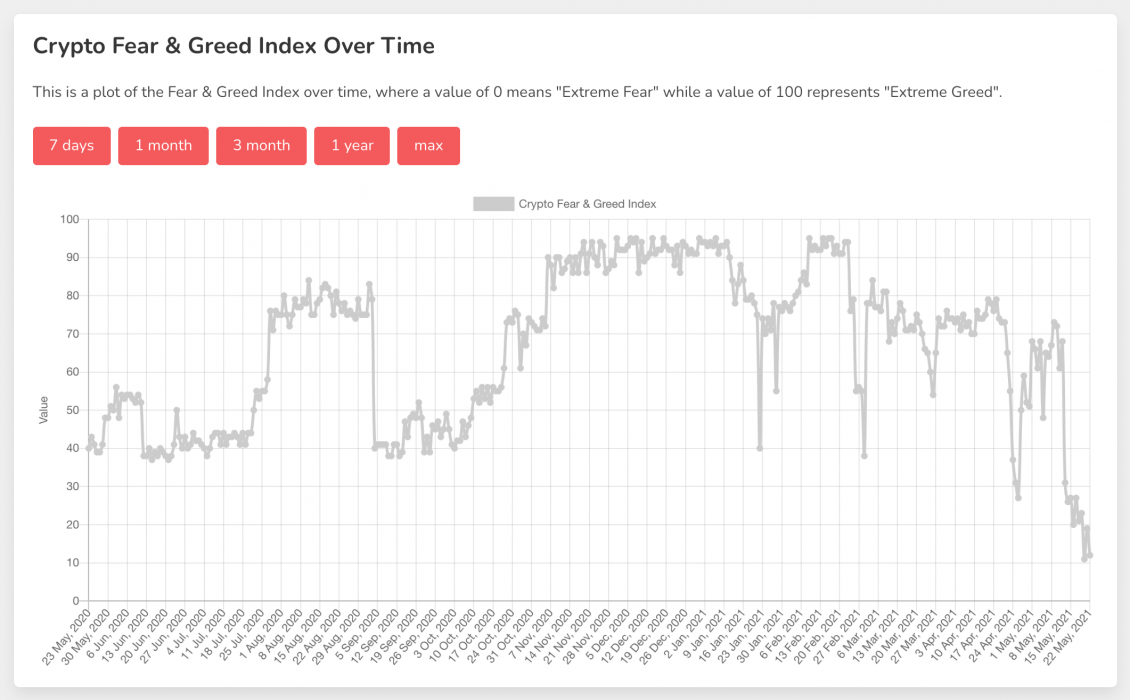
The Bitcoin Fear and Greed Index is the lowest that it has been for the past year – reaching a point of 10 indicating extreme fear in the market.

This indicator shows the current sentiment of the Bitcoin market into a simple meter from 0 to 100. Zero means ‘Extreme Fear’, while 100 means ‘Extreme Greed’.

From Greed To Fear

The lowest it has ever been was back in August 2019, hitting a point of 5. Just earlier this month however, it was at 73, indicating a rating of greed, coming down slightly from extreme greed highs of 95/100 earlier this year.

Tools like the Fear and Greed Index can help traders gauge market sentiment and react to ever-changing patterns and trends.

Triggering Trading Emotions

GREED – People tend to get greedy when the market is rising which results in huge FOMO (Fear Of Missing Out). The general pattern emerges as more and more buyers come into the market, it eventually tops out and a correction follows after a period of too much greed.

FEAR – When the market turns and more and more traders sell, FUD (Fear Uncertainty and Doubt) sets in and this cascades downwards. When this bottoms out, some traders then see this as a buying opportunity and the cycle changes and repeats.

Warren Buffet’s Famous Saying

The investment godfather Warren Buffet was famous for the following quote.

We simply attempt to be fearful when others are greedy and to be greedy only when others are fearful.

Warren Buffet

This advice from Warren Buffet suggests that we could use the Fear and Greed Index indicator as a tool to assist us when we are trading and investing cryptocurrencies.

Categories
Binance Crypto News Market Analysis Ontology Swyftx Trading

ONG Surges +500% In a Week as Ontology Introducing ONT staking with 90% APY

Ontology (ONG) has been trending upwards recently, unlike most of the other coins which have been going downwards. The Cryptocurrency ONG just went up +500% in a week by breaking a Rising wedge pattern with strong buying volume and surges over +800% in 30 days.

What is Ontology?

Ontology is a high-performance, open-source blockchain specializing in digital identity and data. Ontology’s infrastructure supports robust cross-chain collaboration and Layer 2 scalability, offering businesses the flexibility to design a blockchain that suits their needs. Ontology adopts a dual-token model, with both ONT and ONG as utility tokens. Ontology decouples ONT and ONG to alleviate the risk of turbulent fluctuations of the native “asset” value on the gas fee.

ONG Price Analysis

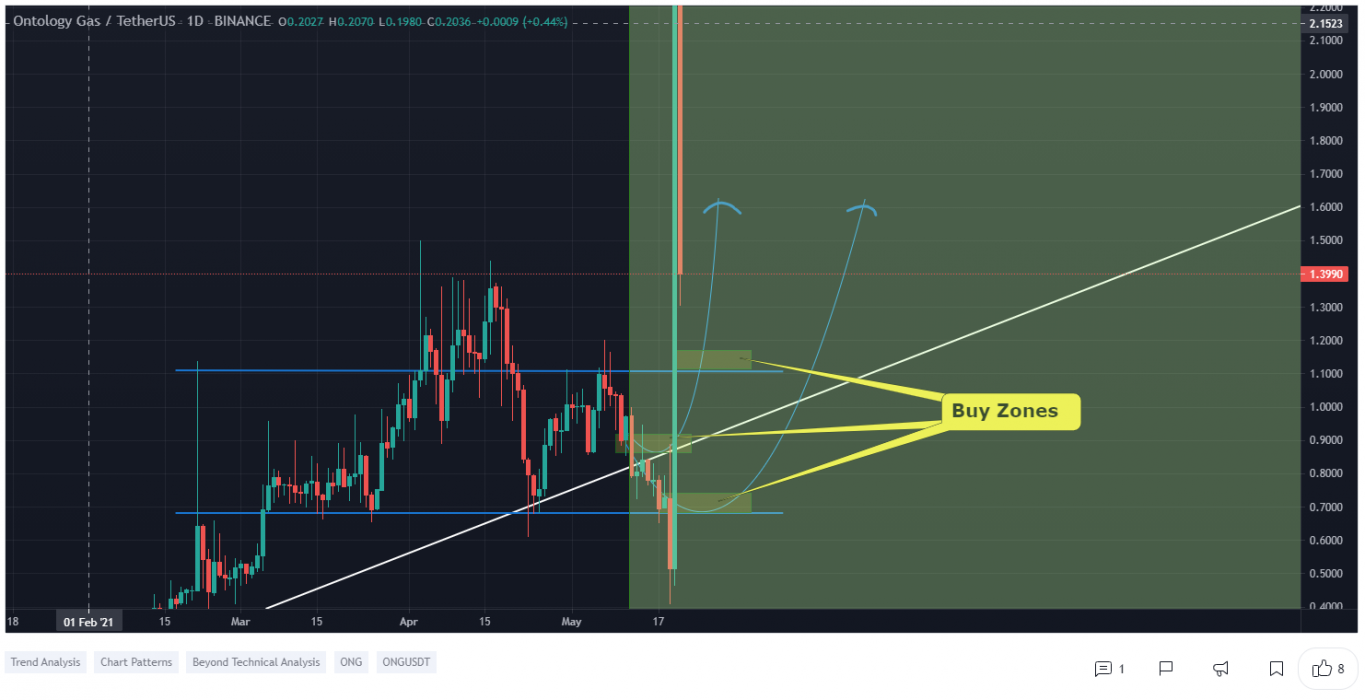
At the time of writing, ONG is ranked 126th cryptocurrency globally and the current price is $1.80 AUD. This is a +500% increase since 15th May 2021 (7 days ago) as shown in the chart below.

Source: TradingView

After looking at the above 1-day candle chart, we can clearly see that ONG broke out from the rising wedge pattern on the ONG/USDT pair. The first resistance was on the $1.10 AUD price levels which ONG broke with a strong bullish trend & buying volume and is now heading towards the next resistance. ONG could continue the uptrend whereas many other altcoins are bearish this week due to Bitcoin’s recent crash.

“A rising wedge is a technical indicator, suggesting a reversal pattern frequently seen in bear markets. This pattern shows up in charts when the price moves upward with pivot highs and lows converging toward a single point known as the apex. […] This pattern has a familiar look to a bear flag.” – Larry Swing on Investopedia [source]

What do the Technical Indicators say?

The ONG TradingView indicators (on the 1-day window) mainly indicate ONG as a buy, except the Oscillators which indicate ONG as a sell.

Why did ONG Breakout?

General market sentiment seems to suggest cryptos are in the middle of the bull run season, which could have contributed to the recent breakout. Another reason for this sudden pump in price could be whales secretly buying ONG for the next Altcoins rally. It could also have contributed to some of the recent news from Ontology introducing $ONT staking with >90% APY.

While ONT is the network’s “primary token,” ONG is used for on-chain services like transactions or paying for the deployment of smart contracts.
ONG tokens are also released to ONT token holders in amounts relative to their holding ratio to encourage ONT staking.

Where to Buy or Trade ONG?

Ontology ONG has high liquidity on Binance exchange so that would help for trading ONG/BTC or ONG/USDT pairs. However, if you’re just looking at buying some quick and HODLing then Swyftx exchange is a popular choice in Australia.
Categories
Bitcoin Cryptocurrencies Investing Market Analysis Trading

Biggest Bitcoin Selloff Since Black Thursday

After more than a week of Bitcoin losing value, a report by Glassnode shows that Monday saw the biggest sell-off since March 2020.

That was when panic selling occurred due to fears about the market brought on by the COVID-19 pandemic. Such event subsequently became known as Black Thursday in the crypto scene.

Retail Investors Sell vs. Institutions Buy

Despite the massive sell-off, prices haven’t tanked as much as one would expect. In total, 30,749.89 BTC were sold on Monday. But as retail investors sold their BTC, companies and institutions have taken the opportunity to buy it.

As a result, Binance – a popular exchange especially between private traders – registered an inflow of around 26,000 BTC. Coinbase, on the other hand – one of the exchanges preferred by institutional investors – registered a net outflow of 146 BTC.

Although 146 BTC isn’t an enormous amount, it shows that, overall, more BTC is being bought than sold on the exchange often preferred by institutional investors. At current daily transactional volumes, Coinbase is still seeing more BTC being bought than sold.

Coinbase has seen almost entirely net outflows of BTC since breaking last cycles $20,000 USD all-time high, a trend that has continued this week. Coinbase is the preferred venue for U.S. institutional accumulation and given the scale of typical daily withdrawals (10,000 to 20,000 BTC per day), it suggests that larger buyers remain in active accumulation during this correction.

Glassnode “The Week On-chain (Week 20, 2021)”

The effect on the overall crypto market

This is not the first time Bitcoin has tanked in price. Indeed massive corrections like this one happened before and BTC has always recovered.

It’s also worth mentioning that the sale of BTC to Binance and other exchanges does not necessarily mean that people are looking at getting rid of their cryptocurrency. Many of the Bitcoins sold may simply be exchanged for other cryptos, given the gains Ethereum (ETH) and other cryptocurrencies have also made recently.

This provides further indication that the recent inflows are likely to be driven by both new market entrants (panic sellers) and potentially due to capital rotation into other crypto assets.

Glassnode “The Week On-chain (Week 20, 2021)”

Overall, more Bitcoin is being sold across all exchanges – This data seems to suggest that the market may start recovering sooner rather than later, possibly thanks to institutional support.