Categories
Crypto News Gala Market Analysis MyNeighborAlice Oasis Network Trading

Top 3 Coins to Watch Today: ALICE, ROSE, GALA – August 1 Trading Analysis

Let’s take a closer look at today’s altcoins showing breakout signals. We’ll explain what the coin is, then dive into the trading charts and provide some analysis to help you decide.

1. MyNeighborAlice (ALICE)

ALICE is a multiplayer builder game where anyone can buy and own virtual islands, collect and build exciting items, and meet new friends. Inspired by successful games such as Animal Crossing, the game combines the best of the two worlds – a fun narrative for regular players who want to enjoy the gameplay experience, as well as an ecosystem for players who want to collect and trade non-fungible tokens (NFTs).

ALICE Price Analysis

At the time of writing, ALICE is ranked the 279th cryptocurrency globally and the current price is US$3.00. Let’s take a look at the chart below for price analysis:

Source: TradingView

ALICE dropped almost 80% from its Q2 highs. Since this drop, the price has consolidated in a tight range between approximately $3.40 and $2.38.

Support might have formed near $2.87. This area shows inefficient trading on the daily chart. It also overlaps June 15’s swing high and contains the 9 and 18 EMAs.

If this level breaks, the price might also find support at a small distance below, near $2.69. Here, the weekly chart shows that bulls rejected bears.

The 40 EMA is currently providing some resistance. Yet the price may be seeking the next resistance near $3.20. This level is near the top of the range, contains relative equal highs, and is just below the June monthly open. 

A break through this level might reach the next resistance near $3.36. This level is just above relative equal highs and the June monthly open. It also shows inefficient trading on the weekly chart and overlaps with the June 2021 swing low’s wick.

If the rally continues, $3.70 could provide the next resistance. This level shows inefficient trading on the weekly and monthly charts. It also overlaps with June 2021’s weekly and monthly swing low candle body boundaries.

The overall market is still bearish, so bulls should be cautious. There is no historical price action to suggest support below the current price. The local range’s 50% extension suggests that $2.25 to $2.00 could be the next longer-term downside target.

2. Oasis Network (ROSE)

The Oasis Network ROSE is the first privacy-enabled blockchain platform for open finance and a responsible data economy. Combined with its high throughput and secure architecture, the Oasis Network is able to power private, scalable DeFi, revolutionising Open Finance and expanding it beyond traders and early adopters to a mass market. Its unique privacy features can not only redefine DeFi but also create a new type of digital asset called Tokenised Data that can enable users to take control of the data they generate and earn rewards for staking it with applications – creating the first-ever responsible data economy.

ROSE Price Analysis

At the time of writing, ROSE is ranked the 89th cryptocurrency globally and the current price is US$0.08846. Let’s take a look at the chart below for price analysis:

Source: TradingView

ROSE climbed 42% from its Q1 low, then dropped nearly 73% into support last month.

The price is currently testing this resistance, near $0.09230. It may also provide support again and has confluence with the 61.8% and 78.6% retracements.

Resistance begins just above, at $0.09837. This inefficiently traded area, which reaches slightly beyond $0.1146, contains the previous monthly highs, a bearish market structure break on the daily chart, and the 9, 18 and 40 EMAs. 

These confluences often provide strong resistance. Since this resistance is close to the $0.1230 support, the price may enter consolidation before breaking out to the next move.

If the price breaks this resistance, bulls could eye an area of old rejection, near $0.1310, as their next target. Continuation through this level may target another area of bearish rejection on the weekly chart, near the 27% extension from $0.1329 to $0.1357.

A more significant bearish turn in the market may reach for bulls’ stops under the Q2 lows, down to an area of old support in an inefficiently traded area between $0.08341 and $0.07217.

3. Gala (GALA)

GALA aims to take the gaming industry in a different direction by giving players back control over their games. Gala Games’ mission is to make “blockchain games you’ll actually want to play”. The project wants to change how players can spend hundreds of dollars on in-game assets and countless hours playing the game, all of which could be taken away from them with the click of a button. It plans to reintroduce creative thinking by giving players control of their games and in-game assets with the help of blockchain technology.

GALA Price Analysis

At the time of writing, GALA is ranked the 94th cryptocurrency globally and the current price is US$0.05995. Let’s take a look at the chart below for price analysis:

Source: TradingView

After setting a low last week, GALA turned into a recovery trend to make the new monthly highs.

The following 75% plummet found support near $0.05029, sweeping under the 40 EMA into the 60.8% retracement level before bouncing to resistance beginning at $0.06420.

This area could continue to provide resistance, possibly causing a retracement to the 9 EMA and 18 EMA near $0.06812, where aggressive bulls might begin bidding. The level near $0.07325, which has confluence with the 40 EMA, may see more interest from bulls loading up for an attempt on probable resistance beginning near $0.08475. 

However, if Bitcoin continues its sideways trend, much lower prices could be seen. The old support near $0.04720 could provide at least a short-term bounce. If this level fails, the old highs near $0.03835 might also give support and see the start of a new bullish cycle after retesting these support levels.

Learn How to Trade Live!

Join Dave and The Crypto Den Crew and they’ll show you live on a webinar how to take your crypto trading to the next level.

Where to Buy or Trade Altcoins?

These coins have high liquidity on Binance Exchange, so that could help with trading on AUD/USDT/BTC pairs. And if you’re looking at buying and HODLing cryptos, then Swyftx Exchange is an easy-to-use popular choice in Australia.

Categories
Crypto News Ergo Market Analysis MyNeighborAlice Trading Waves

Top 3 Coins to Watch Today: ALICE, ERG, WAVES – June 28 Trading Analysis

Let’s take a closer look at today’s altcoins showing breakout signals. We’ll explain what the coin is, then dive into the trading charts and provide some analysis to help you decide.

1. MyNeighborAlice (ALICE)

ALICE is a multiplayer builder game where anyone can buy and own virtual islands, collect and build exciting items, and meet new friends. Inspired by successful games such as Animal Crossing, the game combines the best of the two worlds – a fun narrative for regular players who want to enjoy the gameplay experience, as well as an ecosystem for players who want to collect and trade non-fungible tokens (NFTs).

ALICE Price Analysis

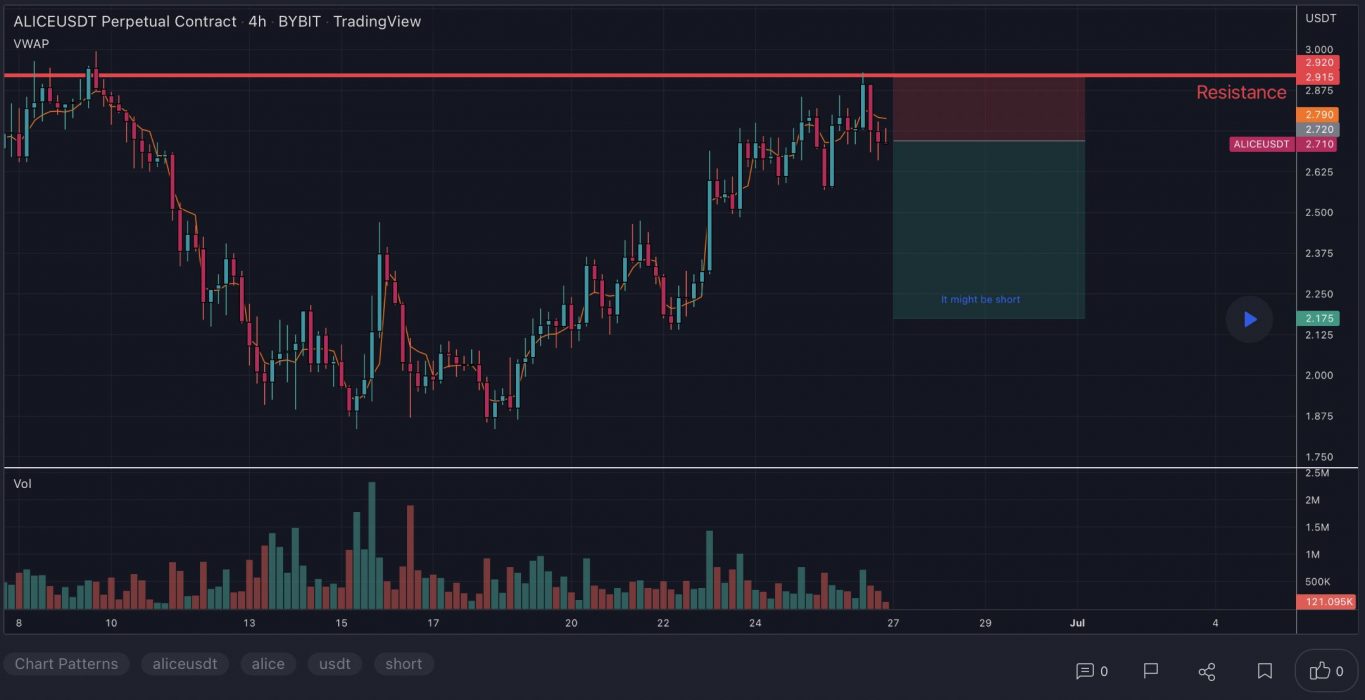
At the time of writing, ALICE is ranked the 280th cryptocurrency globally and the current price is US$2.570. Let’s take a look at the chart below for price analysis:

Source: TradingView

ALICE dropped almost 79% from its April high to a mid-May low. Since this drop, the price has consolidated in a tight range between approximately $3.330 and $1.845.

Support may have formed near $2.571. This area shows inefficient trading on the daily chart. It also overlaps June 15’s swing high and contains the 9 and 18 EMAs.

If this level breaks, the price might also find support at a small distance below, near $2.169. Here, the weekly chart shows that bulls rejected bears.

The 40 EMA is currently providing some resistance. Yet the price may be seeking the next resistance near $3.00. This level is near the top of the range, contains relative equal highs, and is just below the June monthly open.

A break through this level might reach the next resistance near $3.330. This level is just above relative equal highs and the June monthly open. It also shows inefficient trading on the weekly chart and overlaps with the June 2021 swing low’s wick.

If the rally continues, $3.804 could provide the next resistance. This level shows inefficient trading on the weekly and monthly charts. It also overlaps with June 2021’s weekly and monthly swing low candle body boundaries.

The overall market is still bearish, so bulls should be cautious. There is no historical price action to suggest support below the current price. The local range’s 50% extension suggests that $1.250 to $1.00 could be the next longer-term downside target.

2. Ergo (ERG)

The Ergo ERG platform aims to provide an efficient, secure and easy way to implement financial contracts that will be useful and survivable in the long term. Ergo describes itself as a self-amendable protocol that reportedly allows it to absorb new ideas and improve itself in a decentralised manner. It is a project that boasts a programmable blockchain with an energy-efficient and stable mining protocol.

ERG Price Analysis

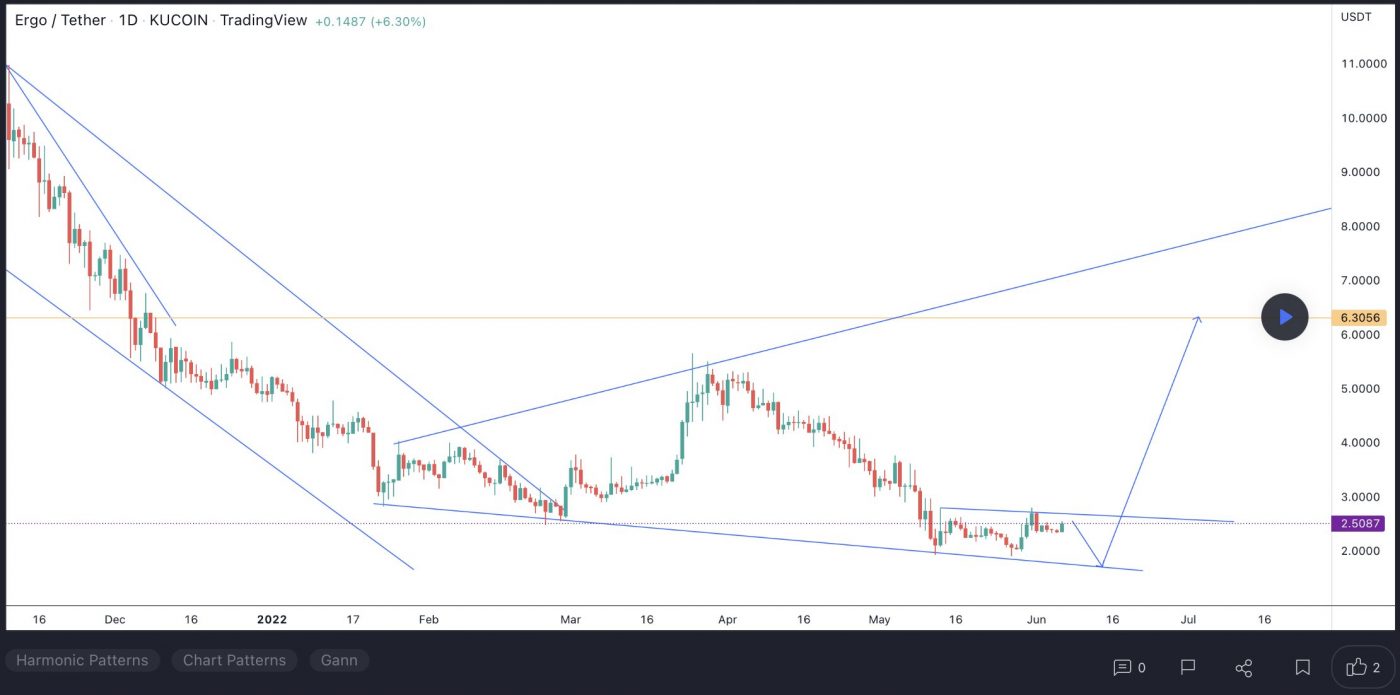
At the time of writing, ERG is ranked the 315th cryptocurrency globally and the current price is US$1.97. Let’s take a look at the chart below for price analysis:

Source: TradingView

ERG‘s price has dropped almost 67% from its late-March high to its mid-June low, and has been consolidating in a tight range since.

The price is now testing possible support near $2.050. This level is at the May swing lows and in the upper half of the local consolidation range. It also contains the 9 and 18 EMAs.

If the price does rally, the next resistance may be at $2.2657. This level contains the 40 EMA. It also shows inefficient trading and is at the bottom of early June’s consolidation on the daily chart. A rally this high would fill a pocket of inefficient trading on the weekly chart.

A more substantial rally could reach up to $2.7272. This move would run bears’ stops above late May and early June’s swing highs. In this area, the monthly and weekly charts show inefficient trading. It also overlaps with a swing low from February 2022.

Bulls should be careful since market conditions are still bearish. If the price breaks the closest support, it might reach the next possible support between $1.680 and $1.4950.

A move this low would run bulls’ stops under a mid-March 2021 weekly swing low. Under this low, bears might take profits in the area of inefficient trading on the monthly chart.

3. Waves (WAVES)

WAVES is a multi-purpose blockchain platform that supports various use cases, including decentralised applications (DApps) and smart contracts. The platform has undergone various changes and added new spin-off features to build on its original design. Waves’ native token is WAVES, an uncapped supply token used for standard payments such as block rewards. Waves initially set out to improve on the first blockchain platforms by increasing speed, utility, and user-friendliness.

WAVES Price Analysis

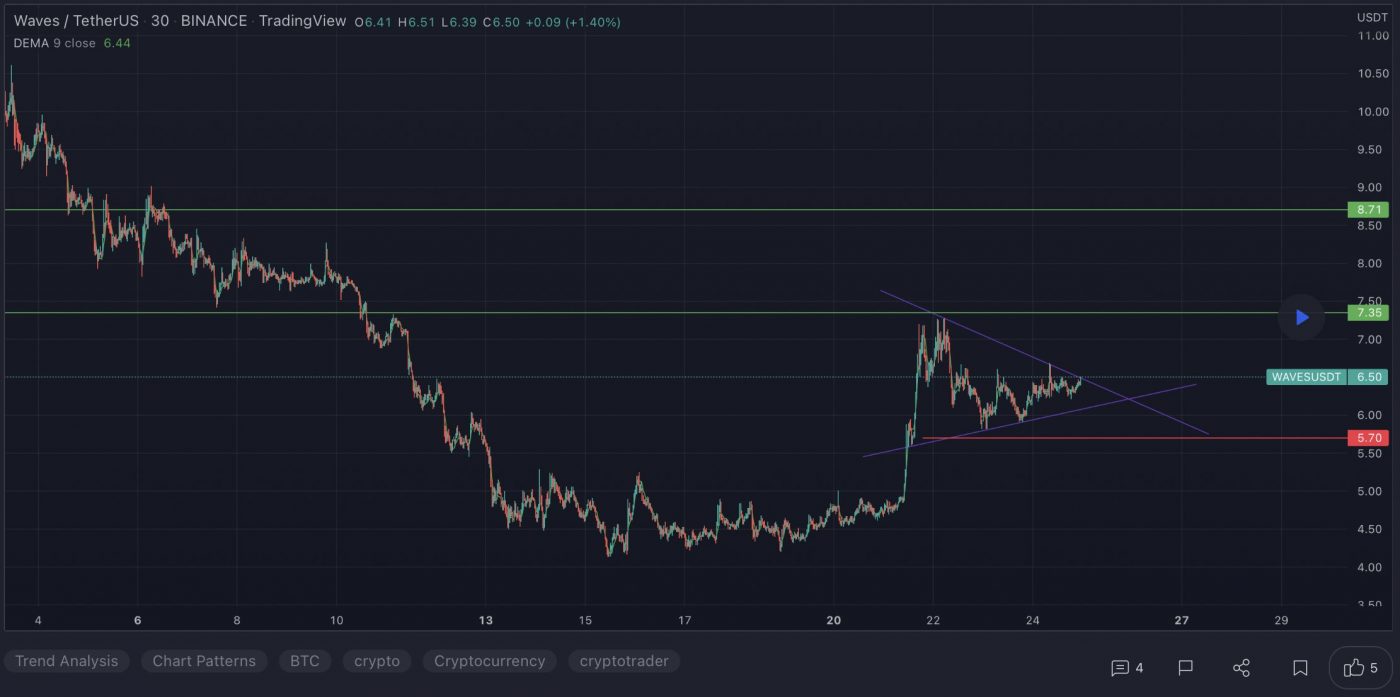
At the time of writing, WAVES is ranked the 66th cryptocurrency globally and the current price is US$5.92. Let’s take a look at the chart below for price analysis:

Source: TradingView

WAVES has dropped almost 96% from its late-March high and over 64% from its early June high. The price is now rallying toward the middle of its local range.

Bulls might find their first support between $5.82 and $5.01. This area shows inefficient trading on the daily chart inside June 21’s strong bullish impulse. It’s also just below the 9 and 18 EMAs.

The price may be seeking probable resistance near $7.97. This level shows consolidation on the daily chart over the current range’s midpoint. Weekly candle bodies also show that bears rejected bulls near January’s swing lows around this area.

This potential rally could continue over the June monthly open to $9.12. Candle bodies on the weekly and monthly charts show that bulls rejected bears at this level in late January. This area also shows inefficient trading on the weekly chart, which may need a revisit.

Yet relative equal lows near $4.13 offer a very tempting target for bears. The price could find some support under these lows, down to $3.75. This area shows inefficient trading on the weekly and monthly charts. It’s also near the high of September 2020’s consolidation.

A longer bearish move may continue through these possible supports to a zone from $2.57 to $1.80. If the price moves this low, it might be targeting bulls’ stops below weekly swing lows near $2.00. The bottom of this zone also shows inefficient trading on the monthly chart.

Learn How to Trade Live!

Join Dave and The Crypto Den Crew and they’ll show you live on a webinar how to take your crypto trading to the next level.

Where to Buy or Trade Altcoins?

These coins have high liquidity on Binance Exchange, so that could help with trading on AUD/USDT/BTC pairs. And if you’re looking at buying and HODLing cryptos, then Swyftx Exchange is an easy-to-use popular choice in Australia.

Categories
ChainLink Crypto News Market Analysis MyNeighborAlice Reserve Rights Trading

Top 3 Coins to Watch Today: ALICE, LINK, RSR – April 1 Trading Analysis

Let’s take a closer look at today’s altcoins showing breakout signals. We’ll explain what the coin is, then dive into the trading charts and provide some analysis to help you decide.

1. MyNeighborAlice (ALICE)

ALICE is a multiplayer builder game where anyone can buy and own virtual islands, collect and build exciting items, and meet new friends. Inspired by successful games such as Animal Crossing, the game combines the best of the two worlds – a fun narrative for regular players who want to enjoy the gameplay experience, as well as an ecosystem for players who want to collect and trade non-fungible tokens (NFTs).

ALICE Price Analysis

At the time of writing, ALICE  is ranked the 258th cryptocurrency globally and the current price is US$7.59. Let’s take a look at the chart below for price analysis:

Source: TradingView

After accumulating under the November monthly open, ALICE rallied 90% in a week before retracing to support near $6.55. Buyers continue to snatch up dips under the weekly open, suggesting that accumulation is still taking place. 

Bulls could look for entries in this region while being conscious of a potential stop run below the cluster of lows at $7.37. Two areas of support, beginning near $7.26 and $7.00, provide probable buys if the price dips this low.

The equal highs near $8.63 provide a first reasonable bullish target. If the price takes this target and penetrates the surrounding resistance, the next probable resistance begins near $9.30. Possible targets include the old highs just above this resistance near $10.43, $10.86, and $11.59.

The Chainlink Network LINK is driven by a large open-source community of data providers, node operators, smart contract developers, researchers, security auditors and more. The company focuses on ensuring that decentralised participation is guaranteed for all node operators and users looking to contribute to the network. Chainlink allows blockchains to securely interact with external data feeds, events and payment methods, providing the critical off-chain information needed by complex smart contracts to become the dominant form of digital agreement.

At the time of writing, LINK is ranked the 24th cryptocurrency globally and the current price is US$16.85. Let’s take a look at the chart below for price analysis:

Source: TradingView

LINK‘s early January spike retraced near $13.08 into the consolidation that began the impulse before bouncing to $17.30. 

This consolidation could provide support again, although bears would first have to push the price through possible support near $14.00. The market’s structure may be shifting bearish, with $13.62 likely to provide some resistance if this is the case. A sustained bearish move could reach the swing low near $12.63 before finding support near $11.71.

However, the bullish higher-timeframe trend might prevail, with relatively equal highs near $18.78 potentially giving an attractive target to lure the price over the monthly open. If so, the price could reach for the midpoint of the December wick near $21.58.

3. Reserve Rights (RSR)

Reserve Rights RSR is a dual-token stablecoin platform that was launched in May 2019 following a successful initial exchange offering (IEO) on the Huobi Prime platform. Reserve Rights’ dual token setup includes a stablecoin known as the Reserve stablecoin (RSV), which is backed by a basket of assets managed by smart contracts. The second token is the Reserve Rights token (RSR), which is used to keep the RSV stable at its $1.00 price target through a system of arbitrage opportunities.

RSR Price Analysis

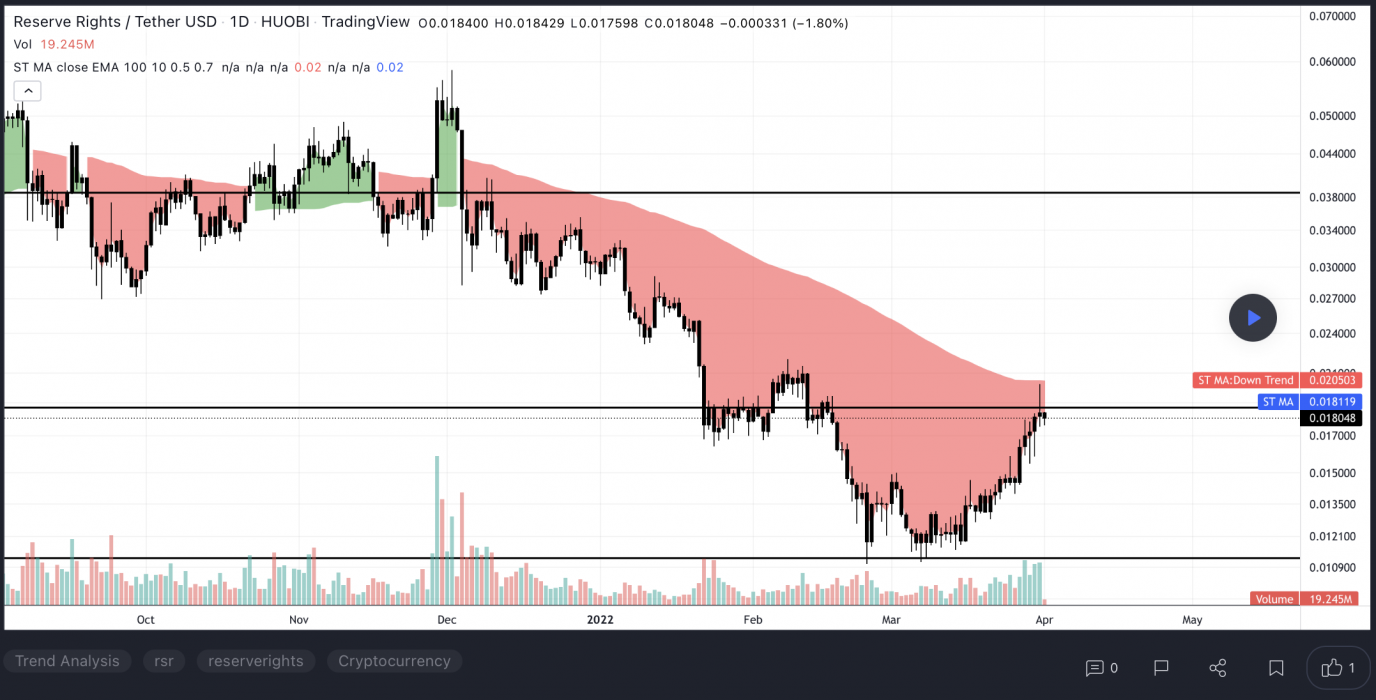
At the time of writing, RSR is ranked the 190th cryptocurrency globally and the current price is US$0.01802. Let’s take a look at the chart below for price analysis:

Source: TradingView

RSR has retraced approximately 52% as the price hovers over possible support beginning near $0.01608.

The significant number of lows in this area will likely see a stop run before any potential move higher. The gap at $0.01570 could provide support for a shallow stop run. 

However, lows near $0.01489 also provide a tempting downside target if bitcoin begins a bearish trend. Under these lows, bulls might find support near $0.01412 – or as low as $0.01365 if the market sees a sustained bearish move.

The confluence of levels near $0.01934 that surround the monthly open may provide some resistance, particularly if reached before a run of the highs near $0.02065. 

If the bullish trend resumes, $0.02269 may provide some resistance before running the swing highs at $0.02319 and $0.02410.

Learn How to Trade Live!

Join Dave and The Crypto Den Crew and they’ll show you live on a webinar how to take your crypto trading to the next level.

Where to Buy or Trade Altcoins?

These coins have high liquidity on Binance Exchange, so that could help with trading on AUD/USDT/BTC pairs. And if you’re looking at buying and HODLing cryptos, then Swyftx Exchange is an easy-to-use popular choice in Australia.