Let’s take a closer look at today’s altcoins showing breakout signals. We’ll explain what the coin is, then dive into the trading charts and provide some analysis to help you decide.
1. Polkadot (DOT)
Polkadot DOT is an open-source sharding multichain protocol that facilitates the cross-chain transfer of any data or asset types, not just tokens, thereby making a wide range of blockchains interoperable with each other. Polkadot’s native DOT token serves three clear purposes: providing network governance and operations, and creating parachains by bonding. The Polkadot protocol connects public and private chains, permissionless networks, oracles and future technologies, allowing these independent blockchains to trustlessly share information and transactions through the Polkadot relay chain.
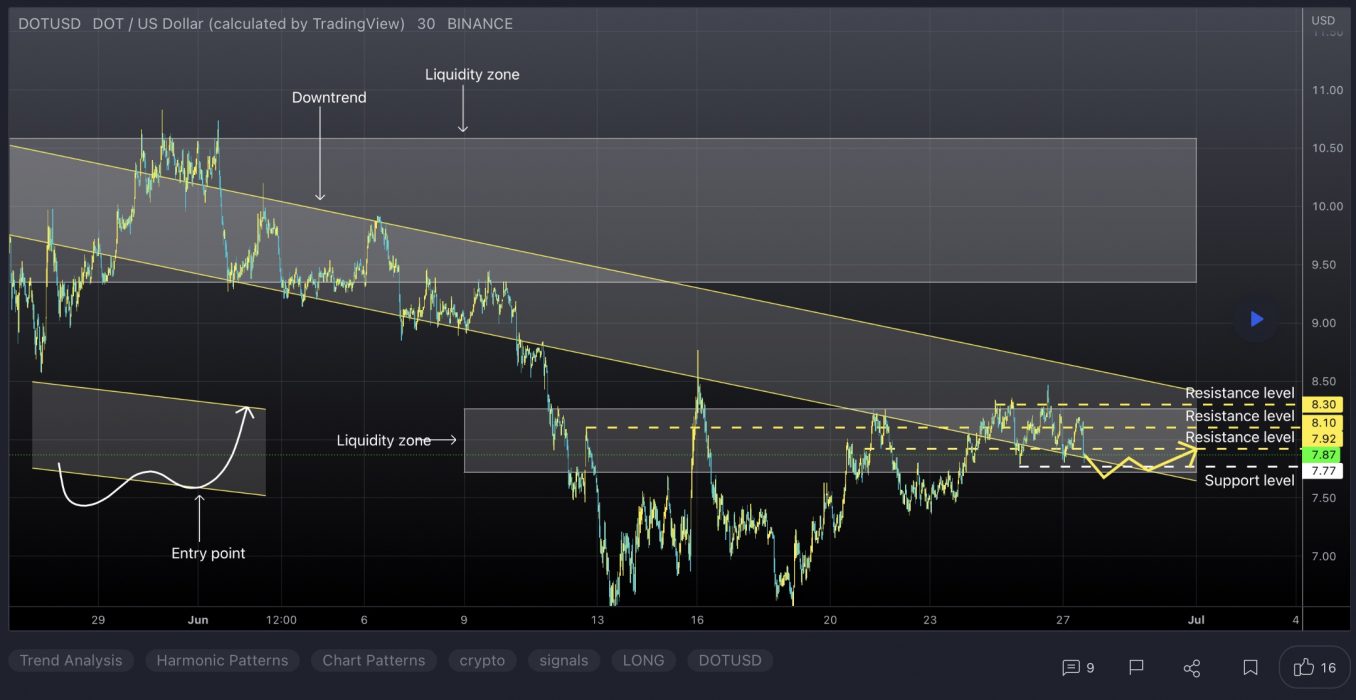
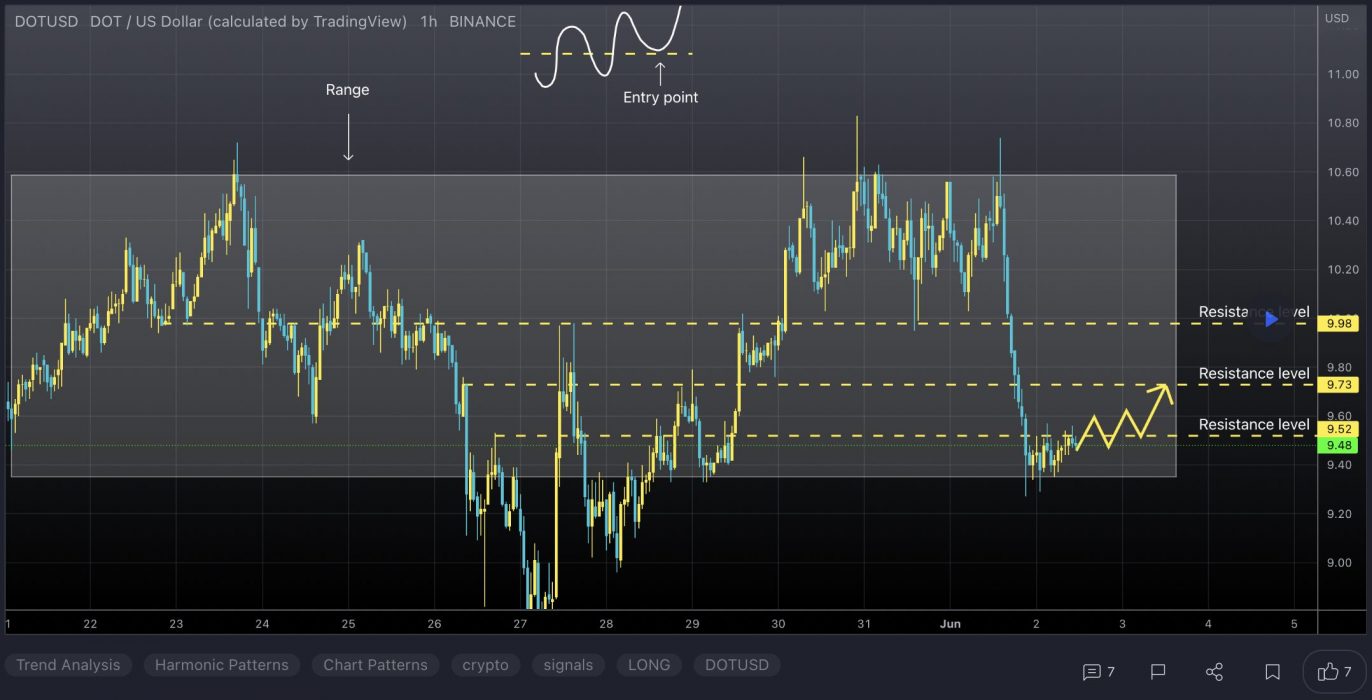
DOT Price Analysis
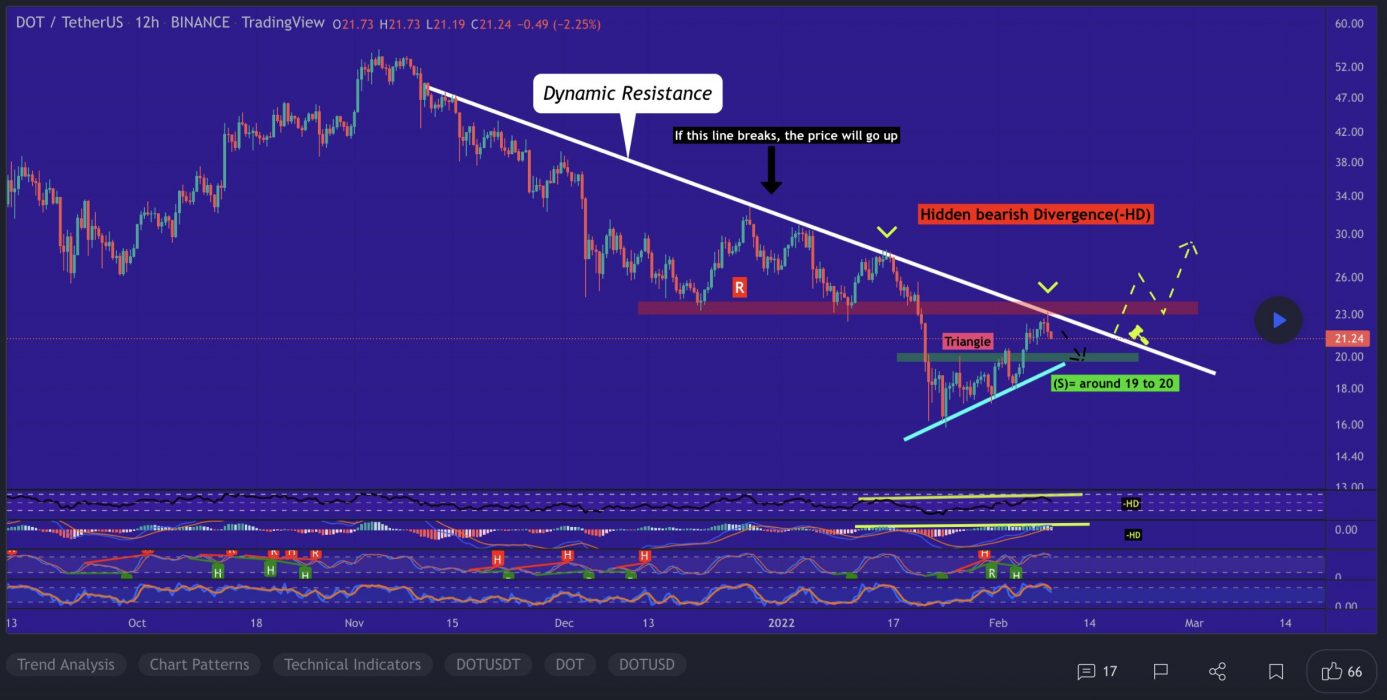
At the time of writing, DOT is ranked the 11th cryptocurrency globally and the current price is US$7.72. Let’s take a look at the chart below for price analysis:
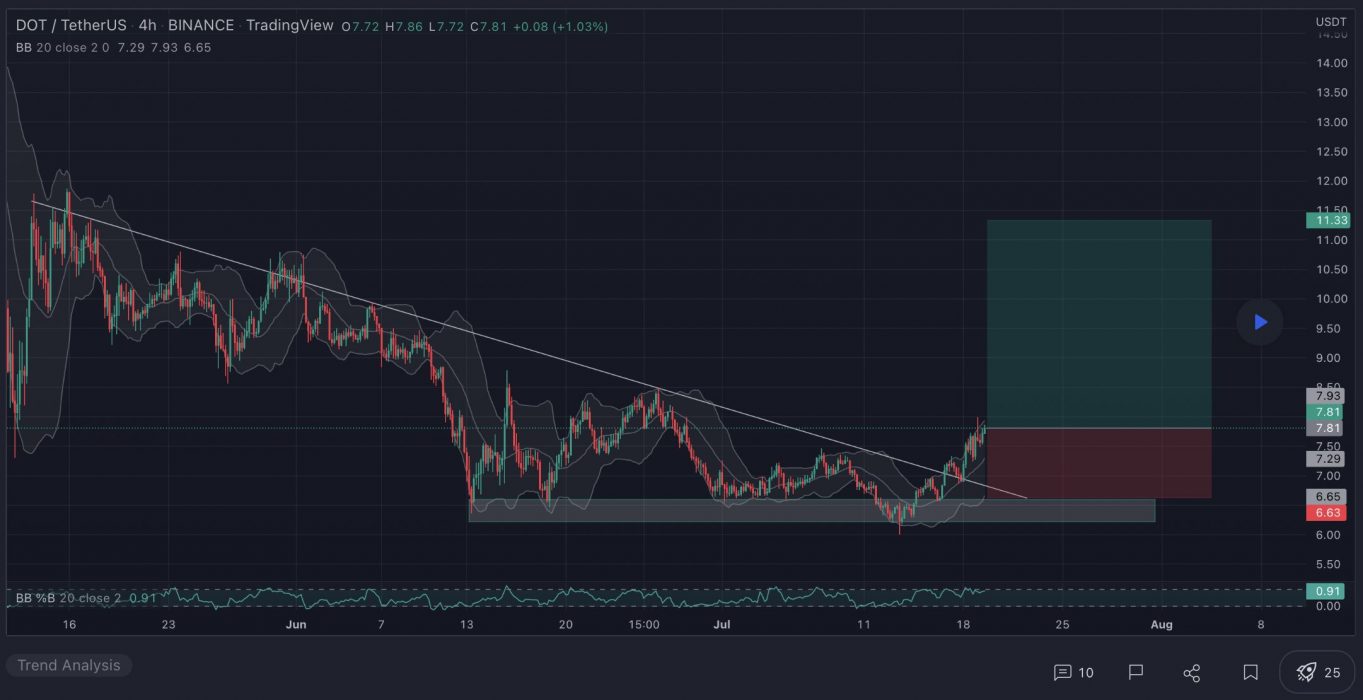
DOT has retraced nearly 75% after Q2, showing little sign of interest from buyers.
June’s consolidation at possible support from $9.65 to $7.12 broke down with the rest of the market last month, turning this into likely resistance on future retests. This area now has confluence with the 9 and 18 EMAs.
If market conditions turn and this resistance breaks, an area near the midpoint of Q2 consolidation range, near $8.70, and the monthly high near $10.18 may see profit-taking from bulls.
The first test of possible support near $7.04 has showed some sensitivity. Still, continued bearishness in the market will likely cause a break of this level.
A break of this support might continue to drop to the next possible support near $6.85, running stops under the Q3 2021 swing low. If this level gives support and begins a consolidation forming a bottom, bulls might wait for a wick below to possible support from $6.35 to $6.00.
2. The Graph (GRT)
The Graph GRT is an indexing protocol for querying data for networks like Ethereum and IPFS, powering many applications in both DeFi and the broader Web3 ecosystem. Anyone can build and publish open APIs, called subgraphs, that applications can query using GraphQL to retrieve blockchain data. GRT is a work token that is locked up by Indexers, Curators and Delegators in order to provide indexing and curating services to the network.
GRT Price Analysis
At the time of writing, GRT is ranked the 60th cryptocurrency globally and the current price is US$0.1109. Let’s take a look at the chart below for price analysis:
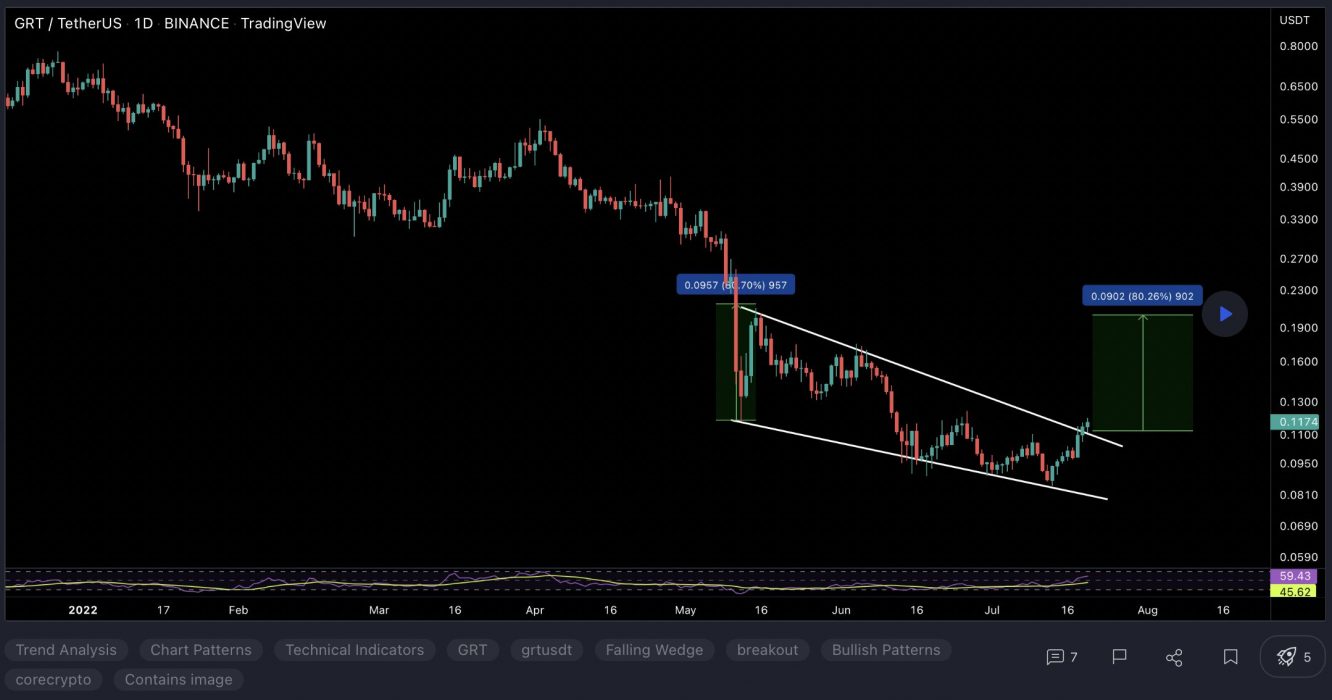
GRT‘s 80% retracement during Q2 set a low near $0.08747 during its consolidation that began in early June.
Relatively equal highs near $0.1435 could be the current target if the price breaks through resistance beginning near $0.1658. Bullish continuation may reach through the next significant swing high near $0.1838 into the daily gap near $0.2173.
If bullish strength continues, the zones just below the previous monthly highs near $0.2343 and $0.2512 could halt any retracement.
A bearish shift in the market might seek the relatively equal lows near $0.1036 into possible support near $0.09872. If this down move occurs, the swing low near $0.09042 and possible support near $0.08624 may be the primary objective.
3. Eos (EOS)
EOS is a platform designed to allow developers to build decentralised apps. The project’s goal is relatively simple: to make it as straightforward as possible for programmers to embrace blockchain technology and ensure the network is easier to use than rivals. As a result, tools and a range of educational resources are provided to support developers who want to build functional apps quickly. EOS also aims to improve the experience for users and businesses. While the project tries to deliver greater security and less friction for consumers, it also vies to unlock flexibility and compliance for enterprises.
EOS Price Analysis
At the time of writing, EOS is ranked the 48th cryptocurrency globally and the current price is US$1.07. Let’s take a look at the chart below for price analysis:
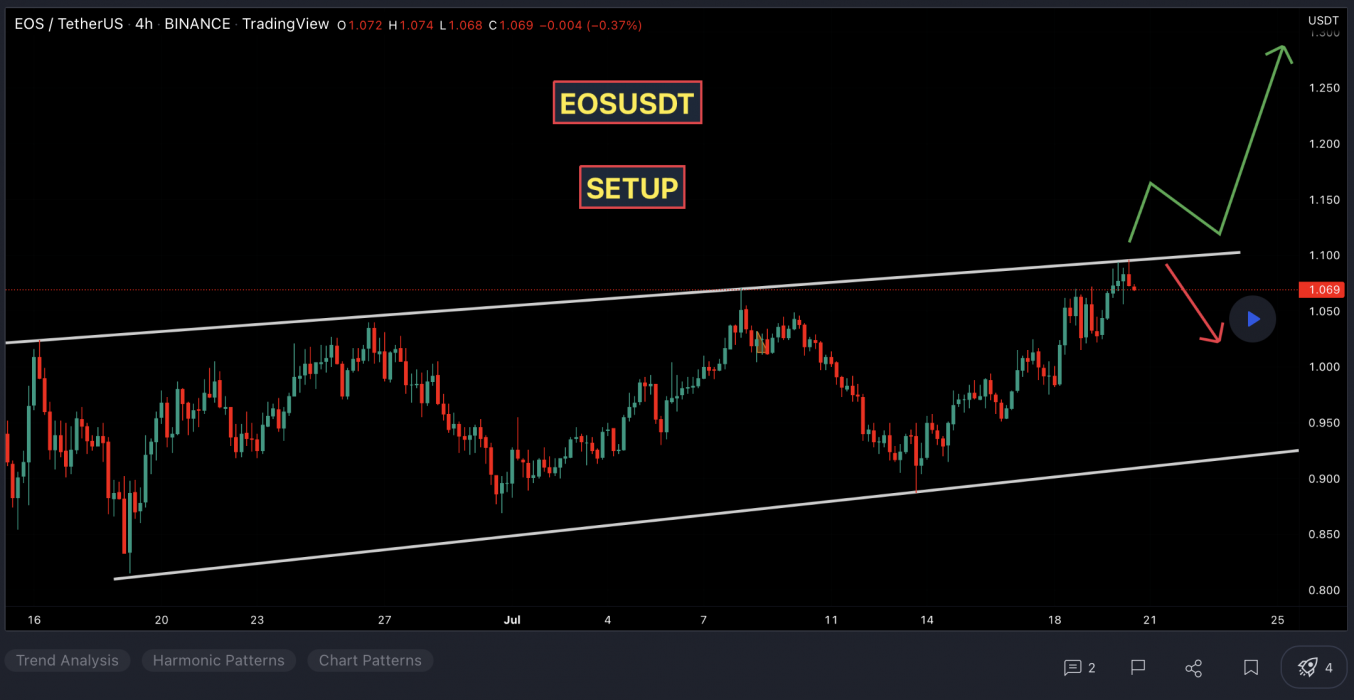
EOS has plummeted nearly 70% from its April 2022 highs and almost 95% from its May 2021 all-time high.
The closest resistance overlaps with the 8 EMA near $1.25, where the daily chart shows inefficient trading. This level rejected the price’s first retest on May 13.
Slightly higher, $1.41 offers the next noteworthy resistance. This area was inefficiently traded and overlaps with the last significant swing low in mid-March.
Last week, the price bounced from support near $1.00, which could provide support again. This level shows inefficient trading on the monthly chart and is near the midpoint of September 2017’s accumulation.
If this support breaks, bulls could find support near $0.8239. This level is at the bottom of an inefficiently traded area on the monthly and weekly charts. It’s also the high point of October 2017’s accumulation range. However, eager bidders should be cautious as a move this low may be targeting bulls’ stops under the swing low at $0.7430.
Learn How to Trade Live!
Join Dave and The Crypto Den Crew and they’ll show you live on a webinar how to take your crypto trading to the next level.

Where to Buy or Trade Altcoins?
These coins have high liquidity on Binance Exchange, so that could help with trading on AUD/USDT/BTC pairs. And if you’re looking at buying and HODLing cryptos, then Swyftx Exchange is an easy-to-use popular choice in Australia.


