Categories
Binance Crypto News Market Analysis Swyftx Theta Trading

Top 3 Coins To Watch Today: CLV, THETA, CAKE August 16 Trading Analysis

Let’s take a closer look at today’s altcoins showing breakout signals. We’ll explain what the coin is, then dive into the trading charts and provide some analysis to help you decide.

1. Clover Finance (CLV)

Clover CLV is a Polkadot parachain, committed to providing easy-to-use blockchain infrastructure and creating a one-stop EVM compatible framework for substrate-based applications. The CLV token is used to pay for Clover transactions and to vote for network upgrades. Clover also aims to enable interoperability between Bitcoin and other blockchains.

CLV Price Analysis

At the time of writing, CLV is ranked the 256th cryptocurrency globally and the current price is A$2.06. Let’s take a look at the chart below for price analysis:

Source: TradingView

After climbing nearly 65% since the August monthly open, a 15% range has trapped CLV between A$1.80 and A$2.25.

A consolidation near A$1.95, visible on the chart, provided support on the last touch. This level could provide support again on a stop run under A$1.87. 

A deeper run-on stop at A$2.07 might reach the top of a higher-timeframe gap at the same level. However, a push this low reduces the chance of a new all-time high soon. Below, little significant support exists until A$2.00.

Higher-timeframe levels overlapping with a daily gap beginning at A$2.16 are likely to provide resistance, perhaps on a sweep of the equal highs near A$2.24. Breaking this resistance makes the relatively equal highs near A$2.30 and the all-time high at A$2.37 the next probable targets.

2. Theta Network (THETA)

Theta Network THETA is a blockchain-powered network purpose-built for video streaming. Launched in March 2019, the Theta mainnet operates as a decentralised network in which users share bandwidth and computing resources on a peer-to-peer (P2P) basis. Theta features its own native cryptocurrency token, THETA, which performs various governance tasks within the network, and counts Google, Binance, Blockchain ventures, Gumi, Sony Europe and Samsung as Enterprise validators, along with a Guardian network of thousands of community-run guardian nodes.

THETA Price Analysis

At the time of writing, THETA is ranked the 22nd cryptocurrency globally and the current price is A$9.55. Let’s take a look at the chart below for price analysis:
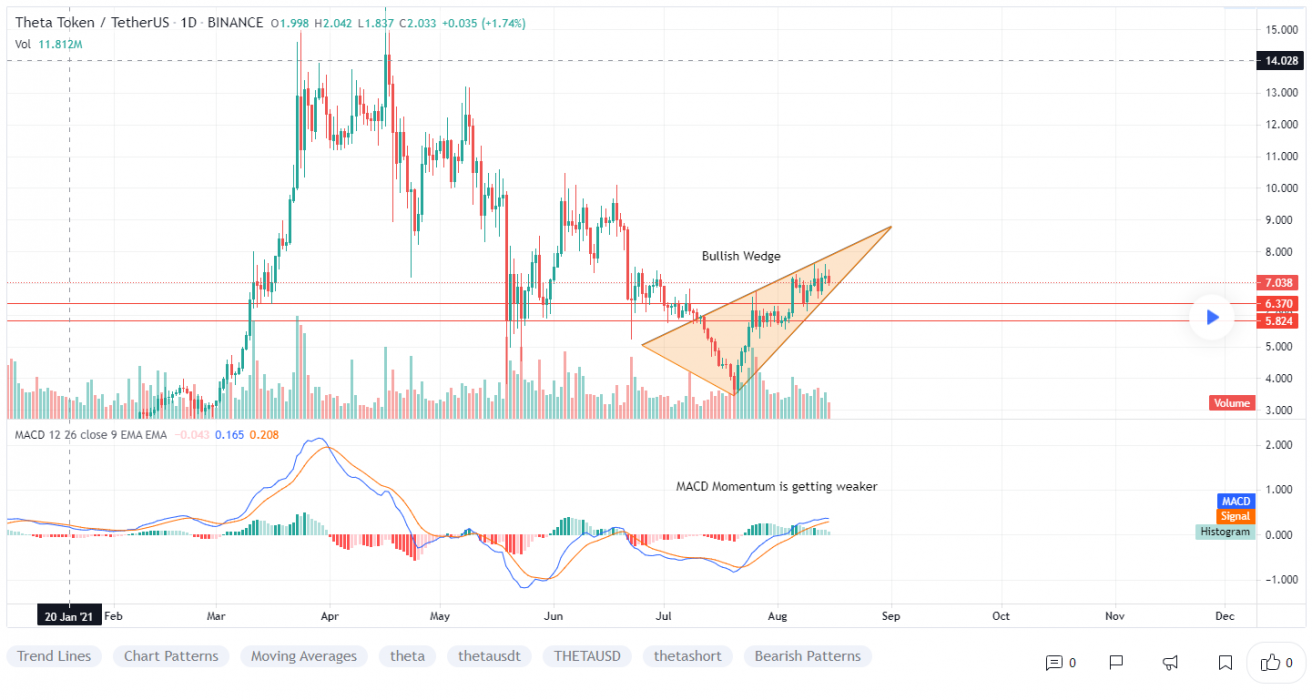
Source: TradingView

THETA’s euphoric early-June pump turned into a late-July dump, with little higher-timeframe support for bulls to justify entries.

Currently, the price is distributing at the 52% retracement level. A small consolidation near A$9.12 is visible on the daily chart. This area does have some confluence with the retracement level and could offer some support in the future. 

The daily gap’s midpoint near A$9.85 has suppressed the price, although a push through this level could fill the daily gap up to A$12.76. A lack of sensitivity at this resistance could suggest a minor retracement before a possible move to new monthly highs.

3. PancakeSwap (CAKE)

PancakeSwap CAKE is an automated market maker AMM – a decentralised finance (DeFi) application that allows users to exchange tokens, providing liquidity via farming and earning fees in return. It launched in September 2020 and is a decentralised exchange for swapping BEP20 tokens on Binance Smart Chain. PancakeSwap uses an automated market maker model where users trade against a liquidity pool. These pools are filled by users who deposit their funds into the pool and receive liquidity provider (LP) tokens in return.

CAKE Price Analysis

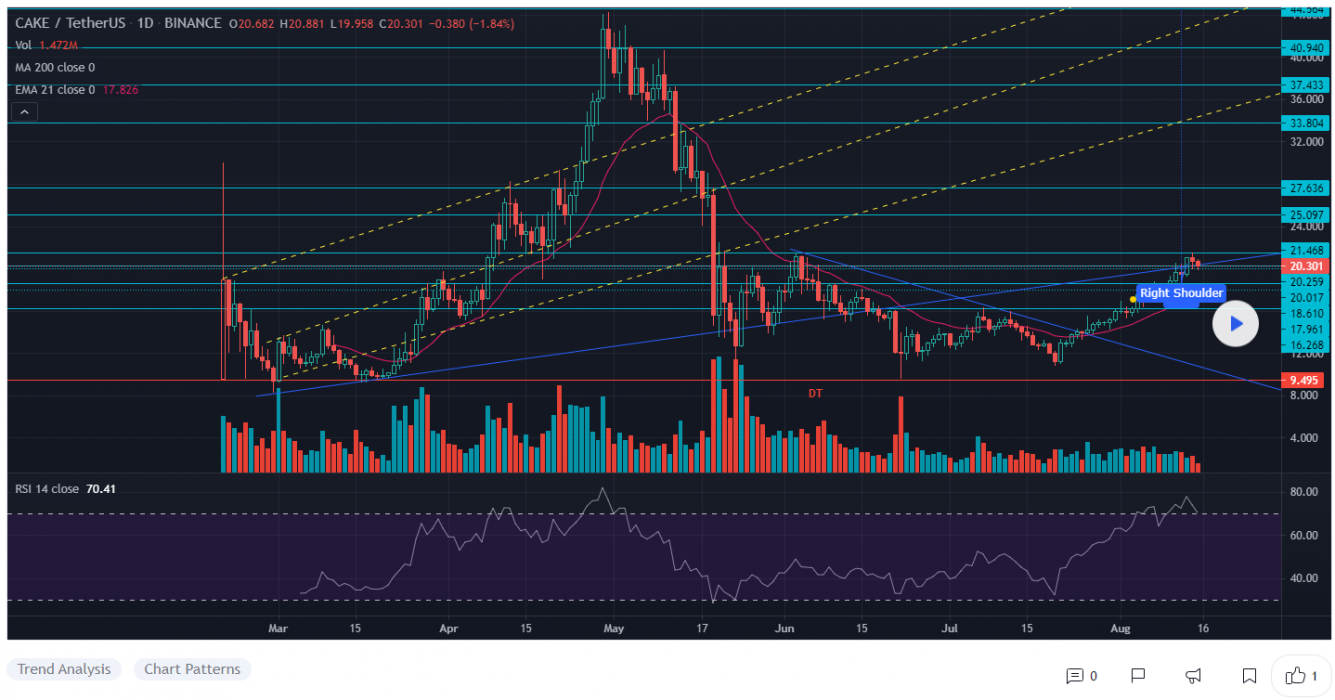
At the time of writing, CAKE is ranked the 34th cryptocurrency globally and the current price is A$27.71. Let’s take a look at the chart below for price analysis:
Source: TradingView

CAKE’s 315% pump during Q2 ran into resistance near A$22.36 on June 10. Since then, the price has been consolidating in a 120% range between A$16.21 and $25.14.

Just below the August open, A$19.58 is the first level likely to provide substantial support. If the price breaks down through this level, overlapping levels near A$18.00 might cap a run on the lows near A$17.66 and $16.98.

The higher-timeframe analysis points to the area near A$31.79 as the next substantial resistance. Significant selling has been occurring here on the daily chart. If this level breaks, the swing highs near A$36.44 and A$40.37 may be the next targets.

Where to Buy or Trade Altcoins?

These coins have high liquidity on Binance Exchange, so that could help with trading on AUD/USDT/BTC pairs. And if you’re looking at buying and HODLing cryptos, then Swyftx Exchange is an easy-to-use popular choice in Australia. However, you can also buy these coins from different exchanges listed on Coinmarketcap.

Categories
Binance Cardano Crypto News Market Analysis Ripple Swyftx Trading Verge

Top 3 Coins To Watch Today: XVG, XRP, ADA August 13 Trading Analysis

Let’s take a closer look at today’s altcoins showing breakout signals. We’ll explain what the coin is, then dive into the trading charts and provide some analysis to help you decide.

1. Verge (XVG)

Verge XVG is a privacy-focused cryptocurrency and blockchain that seeks to offer a fast, efficient, decentralised payments network that improves upon the original Bitcoin blockchain. It includes additional privacy features including integrating the anonymity network Tor into its wallet, called Verge Pay, and providing the option of sending transactions to stealth addresses. The project describes itself as community-driven, relying on volunteers and priding itself on being open-source.

XVG Price Analysis

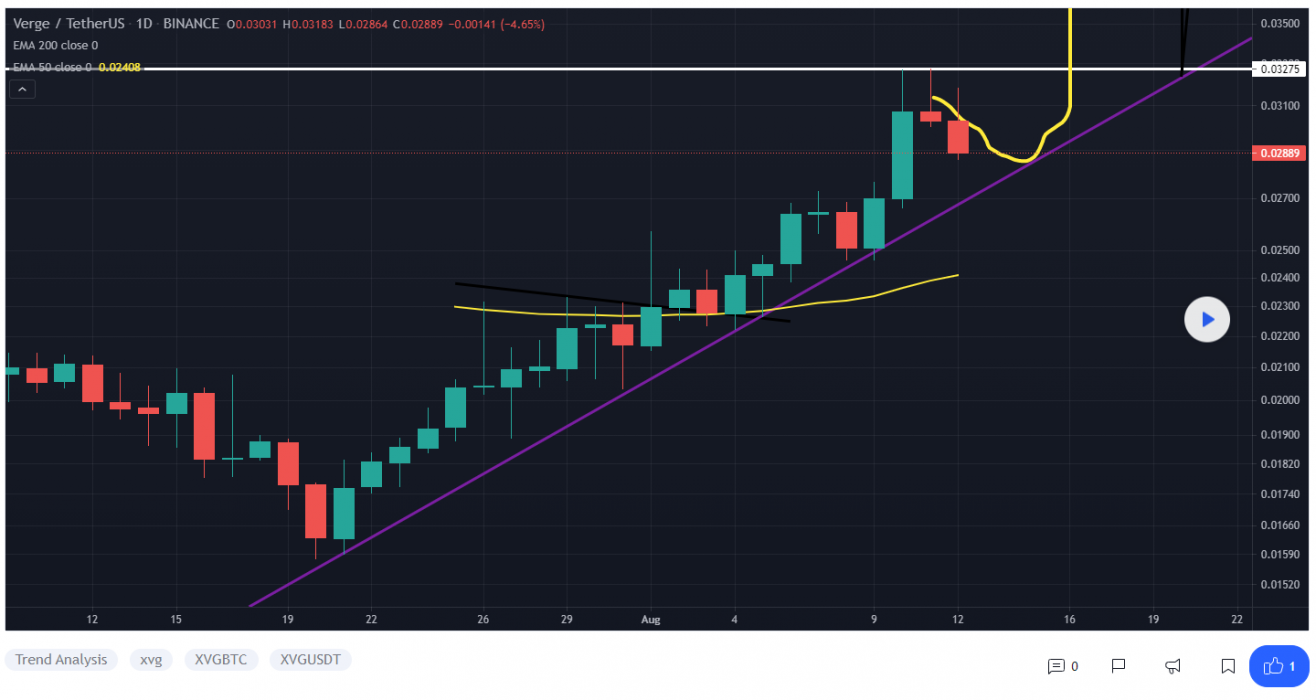
At the time of writing, XVG is ranked the 117th cryptocurrency globally and the current price is A$0.03935. Let’s take a look at the chart below for price analysis:

Source: TradingView

XVG retraced 48% during July before finding support near A$0.02944. The following bounce encountered resistance at the daily gap near A$0.03215.

Bulls might wait for a sweep of the local lows into support near A$0.02778 before stepping in. A move to this level could reach into the higher timeframe gap down to A$0.02459. 

In the most bearish scenario, a significant turn in the market could push the price down to the consolidation near A$0.02214.

The local resistance near A$0.04487 and the relatively equal swing highs provide a reasonable first target. Just above, layered resistance near A$0.04952 and A$0.05311 could slow bulls down as they push the price towards the significant swing high at A$0.05641.

2. Ripple (XRP)

Ripple XRP is the catch-all name for the cryptocurrency platform, the transactional protocol for which is actually XRP, in the same fashion as Ethereum is the name for the platform that facilitates trades in Ether. Like other cryptocurrencies, Ripple is built atop the idea of a distributed ledger network that requires various parties to participate in validating transactions, rather than any singular centralised authority. That facilitates transactions all over the world, and transfer fees are far cheaper than the likes of bitcoin. Unlike other cryptocurrencies, XRP transfers are effectively immediate, requiring no typical confirmation time. 

XRP Price Analysis

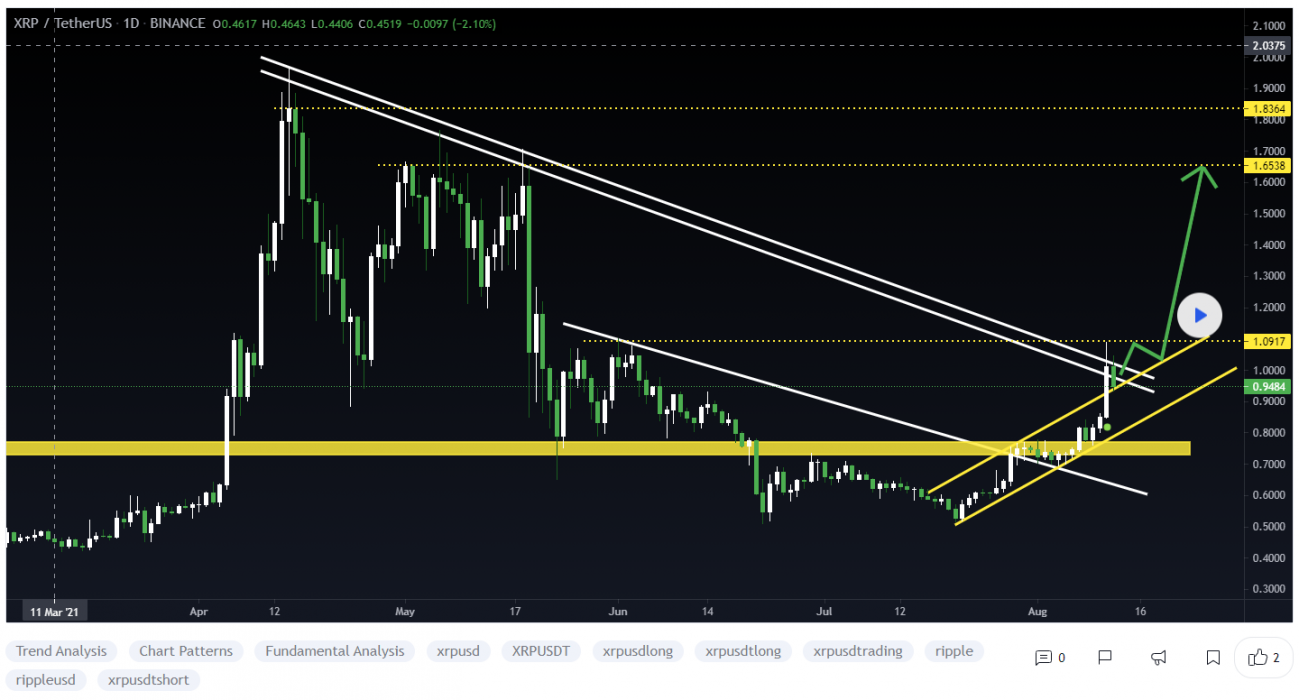
At the time of writing, XRP is ranked the 6th cryptocurrency globally and the current price is A$1.29. Let’s take a look at the chart below for price analysis:

Source: TradingView

XRP marines continue pushing the price higher, printing nearly 35% gains during the second week of August.

The consolidation near A$1.20 is likely to provide support as the price continues exploring new highs. However, a set of relatively equal lows near A$1.12 provides a tempting target for a stop run into probable support near A$1.00.

A decidedly bearish shift in the market could reach probable support near A$0.9455, near August’s monthly open.

Almost no resistance lies overhead, although low-timeframe traders can use the resistance below recent highs near A$1.38 as a first target. Beyond this level, extensions near A$1.47, A$1.55 and A$1.62 give reasonable higher-timeframe targets.

3. Cardano (ADA)

Cardano ADA is a proof-of-stake blockchain platform that says its goal is to allow “changemakers, innovators and visionaries” to bring about positive global change. Cardano is used by agricultural companies to track fresh produce from field to fork, while other products built on the platform allow educational credentials to be stored in a tamper-proof way, and retailers to clamp down on counterfeit goods. The team behind the layered blockchain says that there have already been some compelling use cases for its technology, which aims to allow decentralised apps and smart contracts to be developed with modularity.

ADA Price Analysis

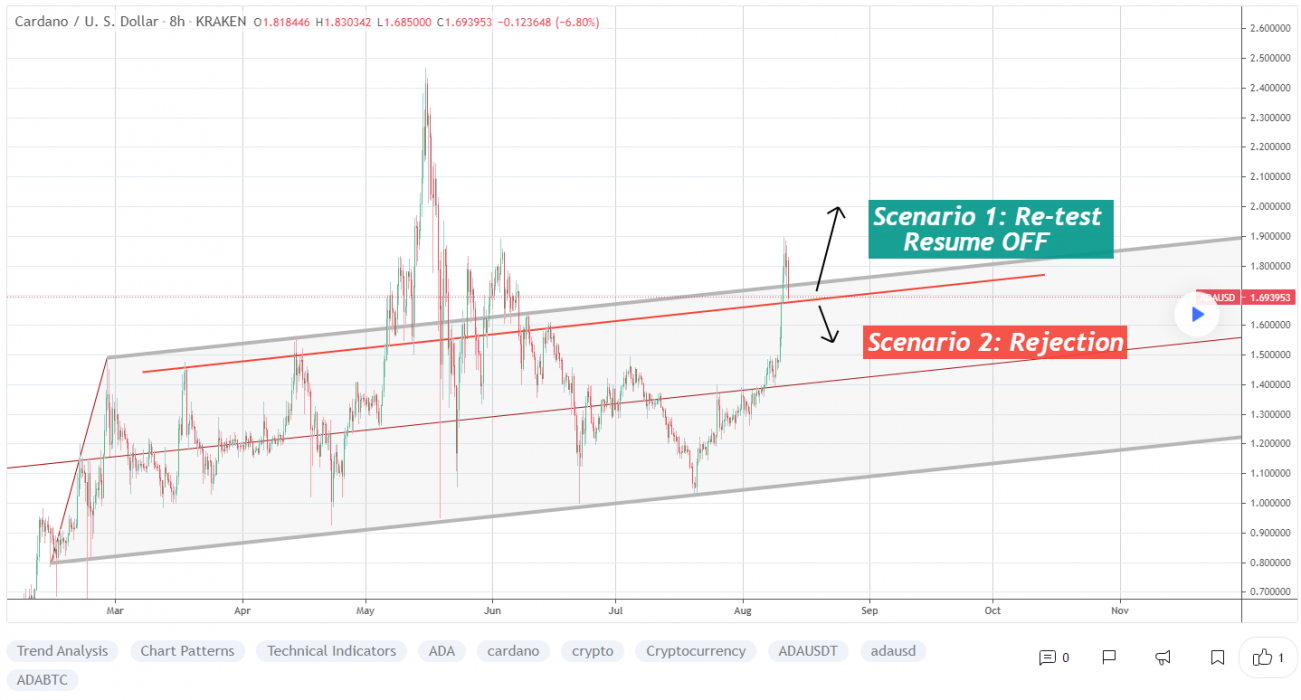
At the time of writing, ADA is ranked the 5th cryptocurrency globally and the current price is A$2.34. Let’s take a look at the chart below for price analysis:

Source: TradingView

ADA bulls have enjoyed over 95% returns since the July lows, with little resistance above to end the current price discovery.

The price may find support near A$2.11. Still, aggressive bulls should be wary of a potential stop run under the monthly open into support near A$0.9544. The area around A$0.8291 should provide strong support if the price reaches this low.

The air above the current price is thin, but the level near A$2.47 could potentially provide some resistance in the short term. Extensions reaching near A$2.59 and A$2.71 make reasonable take-profit zones if the bullish trend continues.

Where to Buy or Trade Altcoins?

These coins have high liquidity on Binance Exchange, so that could help with trading on AUD/USDT/BTC pairs. And if you’re looking at buying and HODLing cryptos, then Swyftx Exchange is an easy-to-use popular choice in Australia. However, you can also buy these coins from different exchanges listed on Coinmarketcap.

Categories
Binance Crypto News Market Analysis Swyftx Trading

Top 3 Coins To Watch Today: SAND, STMX, OMG August 12 Trading Analysis

Let’s take a closer look at today’s altcoins showing breakout signals. We’ll explain what the coin is, then dive into the trading charts and provide some analysis to help you decide.

1. The Sandbox (SAND)

The Sandbox SAND is a blockchain-based virtual world allowing users to create, build, buy and sell digital assets in the form of a game. By combining the powers of decentralised autonomous organisations (DAO) and non-fungible tokens (NFTs), The Sandbox creates a decentralised platform for a thriving gaming community. The Sandbox platform’s main mission is to successfully introduce blockchain technology in mainstream gaming.

SAND Price Analysis

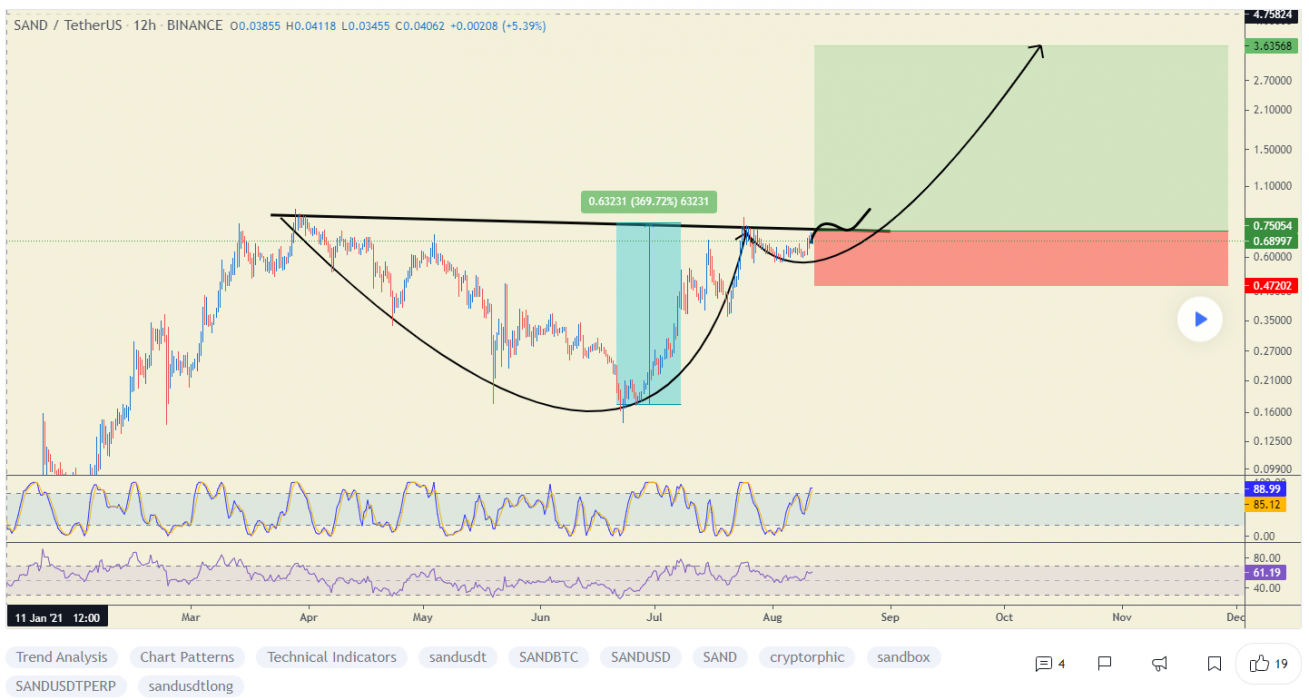
At the time of writing, SAND is ranked the 124th cryptocurrency globally and the current price is A$0.9314. Let’s take a look at the chart below for price analysis:

Source: TradingView

SAND’s 89% decline during July created relatively equal lows near A$0.3155 before bouncing over the local range’s midpoint near A$0.4812. A bullish altcoin market could help SAND bulls regain a stronger bullish trend.

Aggressive bulls could look for entries in the daily gap starting near A$0.8135. The May monthly open aligns with more probable support near A$0.7344. 

A stop run below the monthly open near A$0.7122 might allow a more favourable entry. A more substantial bearish move – perhaps from a sharp drop in bitcoin’s price – could challenge support near A$0.6711, just above the equal lows.

Resistance rests just above, with the zone from A$0.9945 to A$1.08 likely to provide a short-term ceiling. A break through this level might target resistance just under the cluster of relatively equal highs near A$1.12. 

Beyond these highs, resistance near A$1.22 provides a final challenge before attacking a new swing high near A$1.35.

2. StormX (STMX)

StormX STMX is one of the first global cryptocurrency-based solutions to reach worldwide markets. As a mobile app and browser extension, StormX aims to bring users cashback in crypto for most of their online purchases. With enterprise partners like Samsung, Nike and Lego, StormX also allows users to stake the native STMX token to boost their rewards. The company has already attracted investments from Blockfolio, Litecoin Foundation and Kyber Network. StormX has successfully developed its product and has become an industry leader in the crypto cashback community. 

STMX Price Analysis

At the time of writing, STMX is ranked the 154th cryptocurrency globally and the current price is A$0.04069. Let’s take a look at the chart below for price analysis:

Source: TradingView

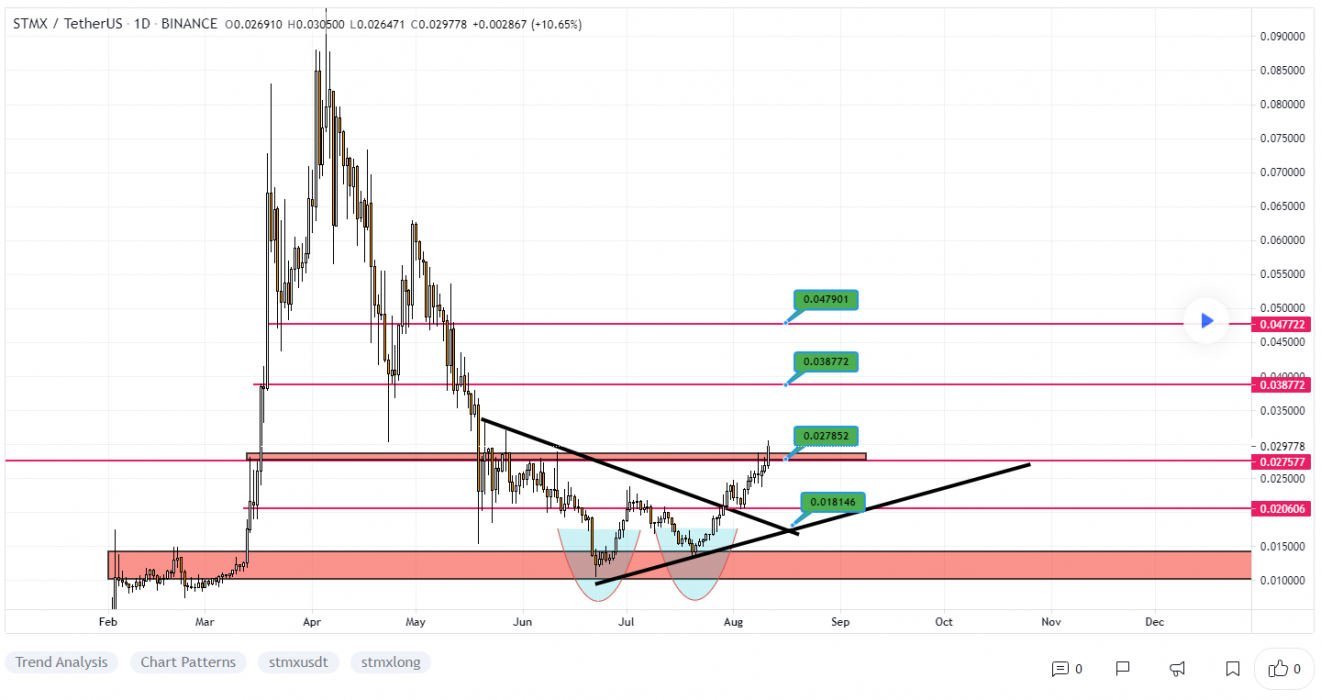
STMX continues to set new monthly highs in its chaotic upwards trend. Support might be found in the daily gap above the August monthly open near A$0.03555. A deeper retracement is likely to target the relatively equal lows into support near A$0.02968. 

The daily gap near A$0.02714 could also provide support. However, another gap inside the down candles, around A$0.02574, provides the highest chances of solid support while offering a high risk-reward entry.

There is currently no resistance overhead since the price is in discovery. Extensions hint at the areas around A$0.04925 and A$0.05586 as reasonable take-profit zones.

3. OMG Network (OMG)

OMG Network, formerly known as OmiseGo, is a non-custodial, layer-2 scaling solution built for the Ethereum blockchain. As an Ethereum scaling solution, OMG Network is designed to allow users to transfer ETH and ERC20 tokens significantly faster and cheaper than when transacting directly on the Ethereum network. The network is based on a novel scaling solution called MoreViable Plasma, which uses a sidechain architecture to group several transactions off-chain into a batch, which can then be verified as a single transaction on the Ethereum root chain.

OMG Price Analysis

At the time of writing, OMG is ranked the 104th cryptocurrency globally and the current price is A$7.36. Let’s take a look at the chart below for price analysis:

Source: TradingView

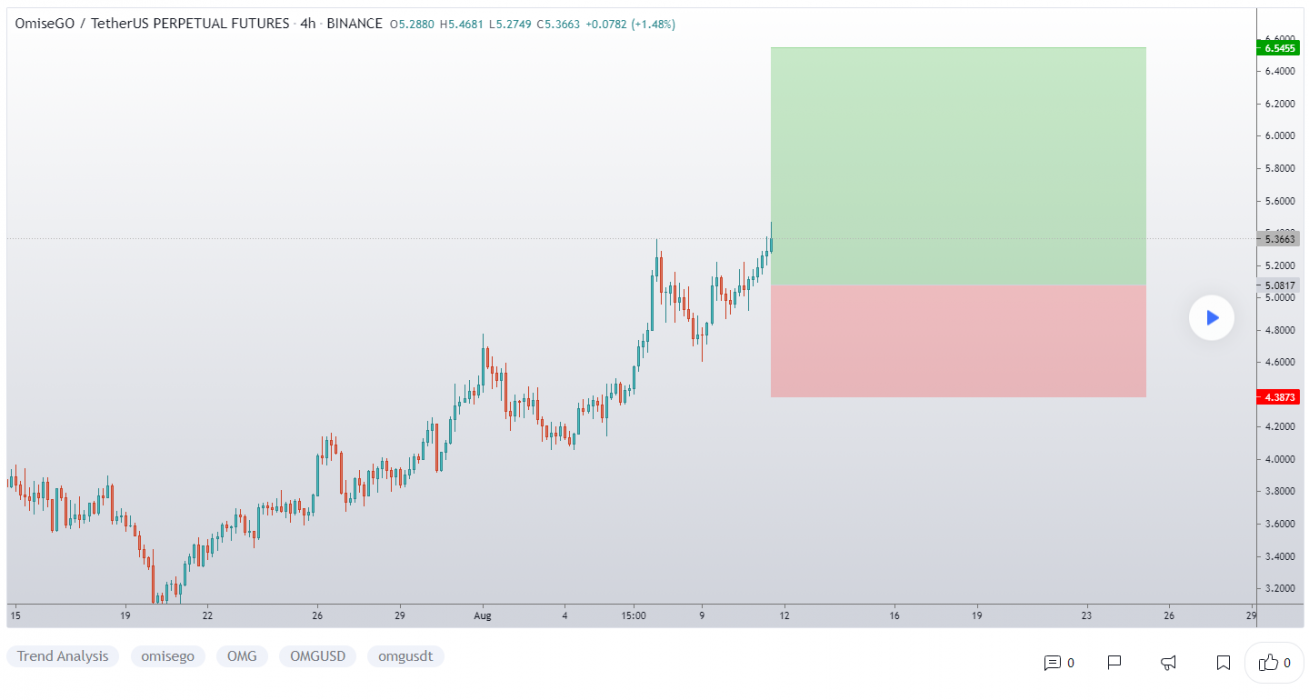
OMG holders endured a wild May as the price rallied over 118% before running the month’s lows. This stop run could set the stage for another rally. However, the recent volatility means bulls should be extra cautious with stop placement. 

Bulls might find support around the current price near A$6.88. The next high probability support rests near A$5.45, below the last two swing lows. A move this deep could sweep July’s low into an area near A$4.88.

The price is currently struggling with resistance near A$7.85 at the June monthly open. A strong move into this resistance is likely to target the swing high near A$8.15. 

Above this swing high, June’s monthly high at A$8.64 is the next likely target, which also marks another wide resistance zone. Volatility inside this resistance could tag an old monthly high at A$9.51.

Where to Buy or Trade Altcoins?

These coins have high liquidity on Binance Exchange, so that could help with trading on AUD/USDT/BTC pairs. And if you’re looking at buying and HODLing cryptos, then Swyftx Exchange is an easy-to-use popular choice in Australia. However, you can also buy these coins from different exchanges listed on Coinmarketcap.
Categories
Binance Crypto News Market Analysis Swyftx Trading

IOTX Surged +245% in a Single Day Amid Listing on Coinbase Pro – IOTX Breakout Analysis

IOTX is trading in an uptrend, like many other Altcoins. The cryptocurrency IOTX just went up +215% in a single day by breaking a rising wedge pattern with strong buying volume on multiple exchanges and surges over +395% in a week.

What is IOTX?

IoTeX IOTX has built a decentralised platform whose aim is to empower the open economics for machines in an open ecosystem where people and machines can interact with guaranteed trust, free will, and under properly designed economic incentives. With a global team of more than 40 research scientists and engineers, IoTeX has built its EVM-compatible blockchain from scratch using the innovative Roll-DPoS consensus.

IOTX Price Analysis

At the time of writing, IOTX is ranked the 96th cryptocurrency globally and the current price is A$0.1133. Let’s take a look at the chart below for price analysis:

Source: TradingView

After looking at the above 4-Hour candle chart, we can clearly see that IOTX was trading inside the rising wedge pattern on the IOTX/USDT pair. The first resistance was on the A$0.04957 price level, which IOTX broke with a strong bullish trend buying volume and is now heading towards the all-time high price at A$0.1285. Seeing that many Altcoins are holding a strong position this week after the recent bitcoin price recovery, IOTX may continue to increase in the uptrend if traders keep buying with high volume.

“The Rising Wedge is a bearish pattern that begins wide at the bottom and contracts as prices move higher and the trading range narrows. As a reversal pattern, the rising wedge will slope up and with the prevailing trend.”

What Do the Technical Indicators Say?

TradingView indicators (on the one-day window) mainly suggest IOTX as a Strong Buy, except the Oscillators, which indicate IOTX as a Neutral.

So Why Did IOTX Breakout?

General market sentiment seems to suggest cryptos are hopefully turning back bull run season after recent massive price corrections. Another reason for this sudden pump in price could be whales secretly buying IOTX for the next Altcoins rally. Recent news was also announced regarding Coinbase Pro listing IOTX on its exchange.

Where to Buy or Trade IOTX?

IOTX has high liquidity on the Binance exchange, which could help for trading IOTX/BTC or IOTX/USDT pairs. Instead, if you’re looking at buying and HODLing cryptos, then Swyftx Exchange is a popular choice in Australia. However, you can also buy this coin from different exchanges listed on Coinmarketcap.

Categories
Binance Crypto News IOTA Market Analysis Swyftx Tezos Trading

Top 3 Coins To Watch Today: DOT, XTZ, IOTA August 11 Trading Analysis

Let’s take a closer look at today’s altcoins showing breakout signals. We’ll explain what the coin is, then dive into the trading charts and provide some analysis to help you decide.

1. Polkadot (DOT)

Polkadot DOT is an open-source sharding multichain protocol that facilitates the cross-chain transfer of any data or asset types, not just tokens, thereby making a wide range of blockchains interoperable with each other. The Polkadot protocol connects public and private chains, permissionless networks, oracles and future technologies, allowing these independent blockchains to trustlessly share information and transactions through the Polkadot relay chain,

DOT Price Analysis

At the time of writing, DOT is ranked the 9th cryptocurrency globally and the current price is A$28.02. Let’s take a look at the chart below for price analysis:

Source: TradingView

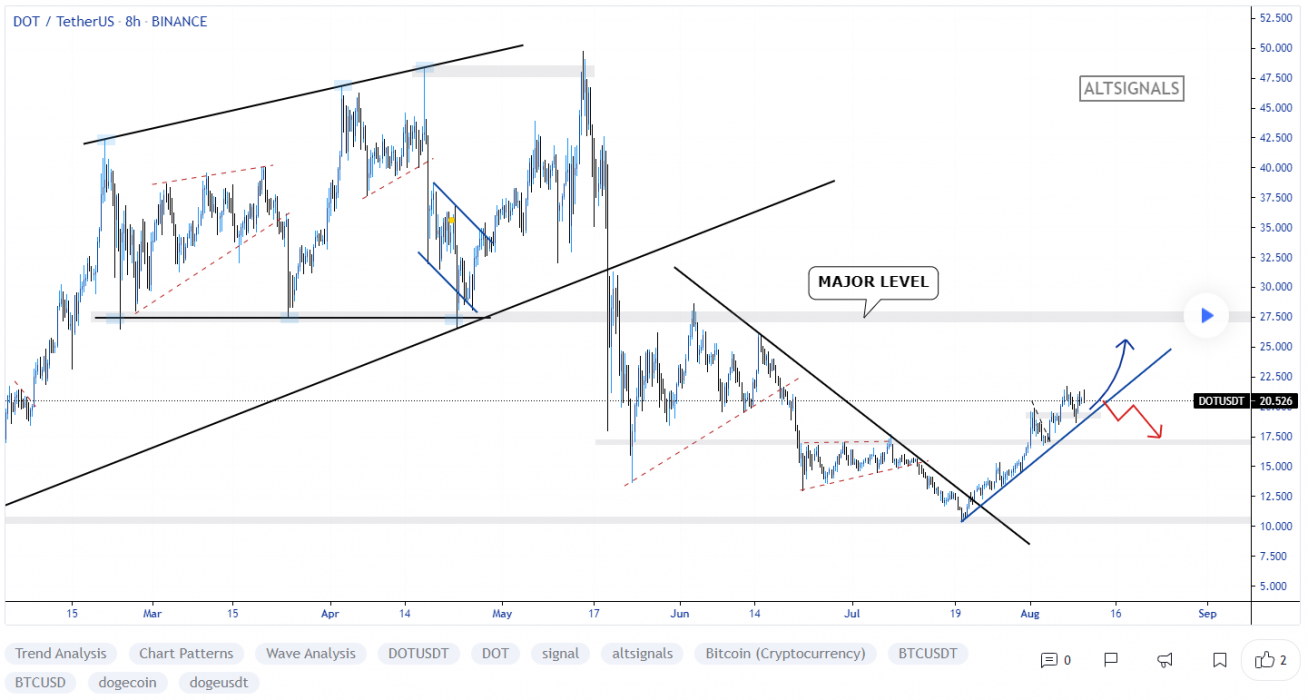
After its early Q2 bullrun, DOT has been ranging between approximately A$21.05 and A$32.45.

Last week’s sharp decline ran equal lows into a gap on the daily chart. This down move could set the stage for an attack on the relatively equal highs near A$29.34 if the price can break probable resistance near A$32.78 and A$34.21. 

Above these highs, resistance near A$39.54 could halt a bullish move, although reaching the monthly high at A$45.32 is possible.

Aggressive bulls might look for entries in possible support near A$25.86 and A$24.00, just below the current price. If the price sweeps last week’s low, the levels near A$23.59 and A$21.48 may also provide support.

2. Tezos (XTZ)

Tezos XTZ is a blockchain network that’s based on smart contracts, in a way that’s not too dissimilar to Ethereum. However, there’s a big difference: Tezos aims to offer infrastructure that is more advanced – meaning it can evolve and improve over time without there ever being a danger of a hard fork. This is something that both Bitcoin and Ethereum have suffered since they were created. People who hold XTZ can vote on proposals for protocol upgrades that have been put forward by Tezos developers.

XTZ Price Analysis

At the time of writing, XTZ is ranked the 45th cryptocurrency globally and the current price is A$4.35. Let’s take a look at the chart below for price analysis:

Source: TradingView

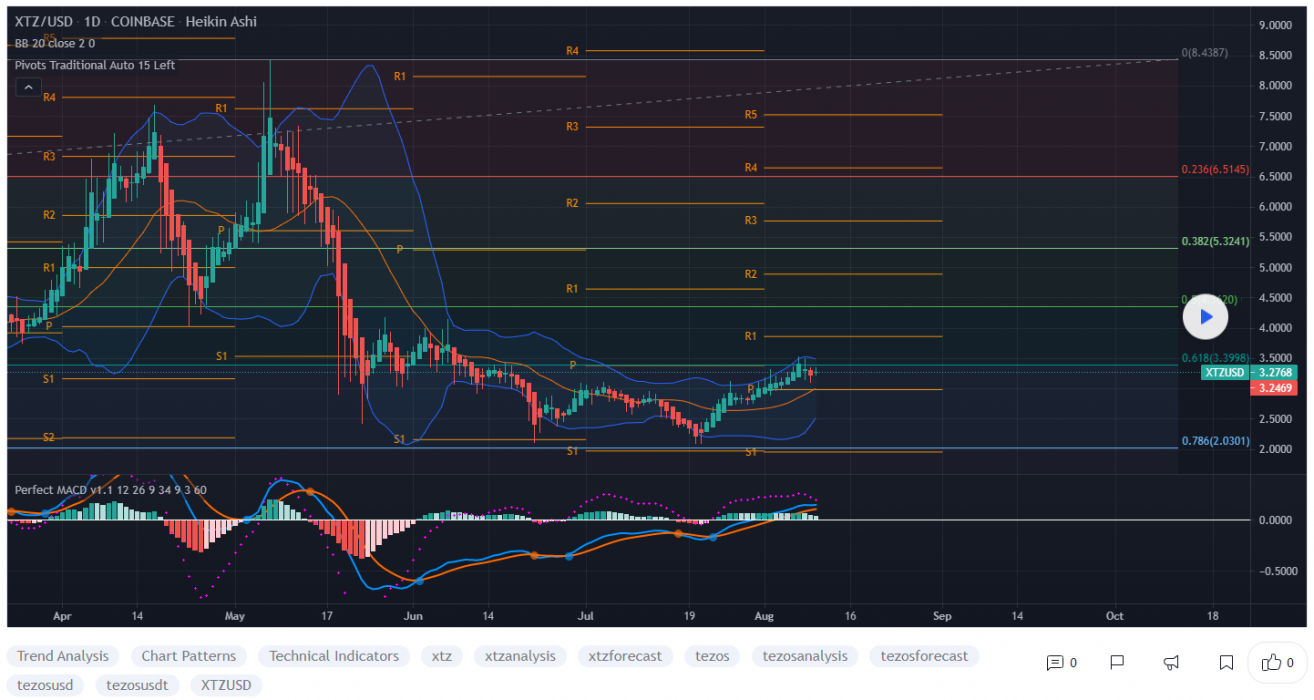
XTZ’s spectacular May pump has retraced most of its gains as it finds support near A$3.47.

Stops under the relatively equal lows near A$4.12 might be swept, along with the swing low near A$3.89. If this sweep happens, the price could find support near A$3.55. A move further down could find more support near A$3.27.

Spikes upward are likely to encounter resistance beginning near A$4.88. If the bullish trend resumes after re-accumulation, some traders might take profits as the price approaches probable resistance starting around A$5.13 and A$5.38.

The monthly peak near A$6.12 provides a clear first primary target. Any price moves beyond this level are challenging to predict from current price action for the short-term trade.

3. MIOTA (IOTA)

IOTA is a distributed ledger with one big difference: it isn’t actually a blockchain. Instead, its proprietary technology is known as Tangle, a system of nodes that confirm transactions. The foundation behind this platform says this offers far greater speeds than conventional blockchains and an ideal footprint for the ever-expanding Internet of Things ecosystem.

IOTA Price Analysis

At the time of writing, IOTA is ranked the 47th cryptocurrency globally and the current price is A$1.30. Let’s take a look at the chart below for price analysis:

Source: TradingView

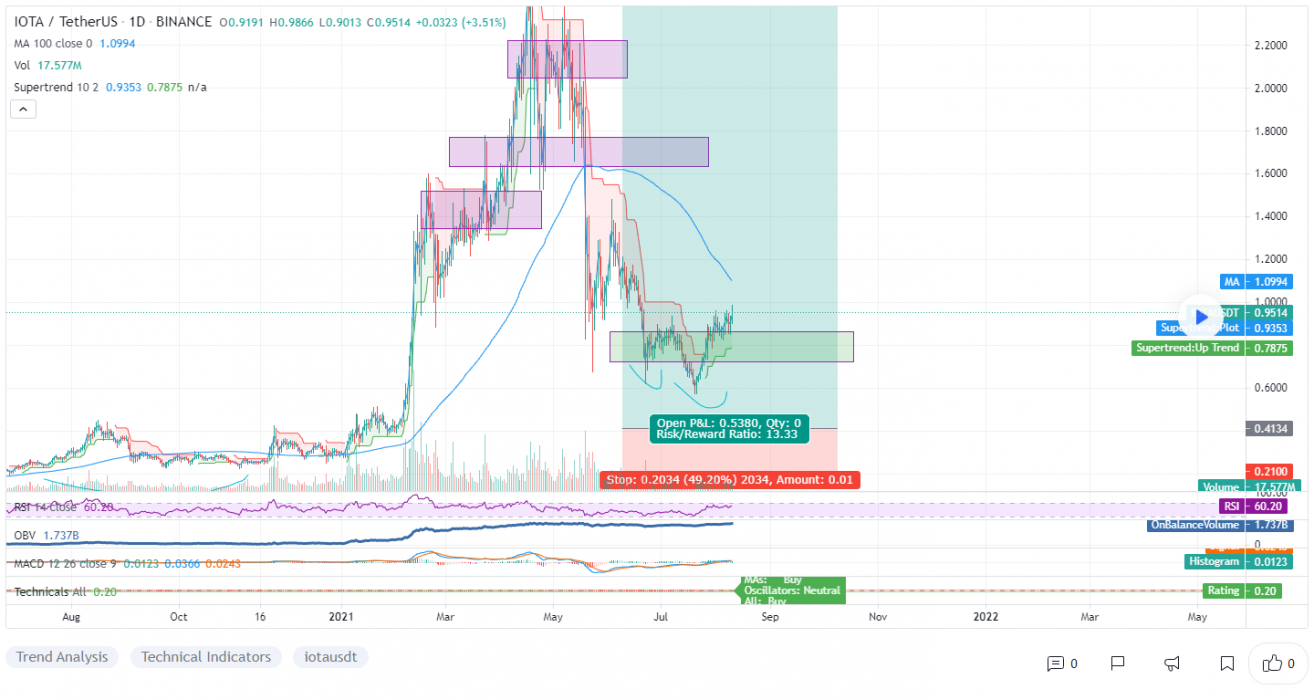
The second half of May punished IOTA bulls with a nearly 72% drop before the price found support near an old swing low around A$1.05.

Aggressive bulls might look for entries at possible support beginning near A$1.15. However, stops under the equal lows near A$0.9355 are likely to be swept.

The area near A$1.00 provides a possible target for this stop run if it occurs. A more sustained bearish trend could reach down to the broad zone of possible support between A$0.8945 and A$0.8236.

The price is currently challenging resistance at a gap beginning near A$1.49. If this level breaks, bulls could find more resistance near A$1.65 while targeting the highs up to A$1.77. 

A sweep of these highs is likely to find resistance by the time price reaches the area near A$1.96. The next reasonable targets would be the swing highs and resistance near A$2.31 and A$2.54.

Where to Buy or Trade Altcoins?

These coins have high liquidity on Binance Exchange, so that could help with trading on AUD/USDT/BTC pairs. And if you’re looking at buying and HODLing cryptos, then Swyftx Exchange is an easy-to-use popular choice in Australia. However, you can also buy these coins from different exchanges listed on Coinmarketcap.
Categories
Binance Crypto News Market Analysis Swyftx Trading

Top 3 Coins To Watch Today: BAND, DAG, VGX August 10 Trading Analysis

Let’s take a closer look at today’s altcoins showing breakout signals. We’ll explain what the coin is, then dive into the trading charts and provide some analysis to help you decide.

1. Band Protocol (BAND)

Band Protocol BAND is a cross-chain data oracle platform that is able to take real-world data and supply it to on-chain applications, while also connecting APIs to smart contracts to facilitate the exchange of information between on-chain and off-chain data sources. BAND is the native token of the Band Protocol ecosystem and is used as collateral by validators involved in fulfilling data requests, as well as the main medium of exchange on BandChain being used to pay for private data.

BAND Price Analysis

At the time of writing, BAND is ranked the 164th cryptocurrency globally and the current price is A$9.99. Let’s take a look at the chart below for price analysis:

Source: TradingView

BAND’s nearly 83% drop from its April highs found a low near A$5.54 in June before closing over a short-term high around A$9.77 last week.

This daily close over the high could signal a shift in market structure that might reach probable resistance near A$12.08. A sustained bullish move may target the swing high at A$13.62. If this stop run occurs, a run beyond the high into probable resistance near A$13.98 and A$15.27 is possible.

Bulls could buy a retracement to possible support near A$9.47, just above the August monthly open. A bearish turn in the marketplace may propel the price toward possible support near A$6.62. 

However, relatively equal lows near A$5.21 and A$4.00 provide an attractive target for bears if the market resumes its bearish trend. A run on these lows might find support between A$3.40 and A$4.00.

2. Constellation (DAG)

Constellation DAG technology is an alternative system that allows cryptocurrencies to function similarly to those that utilise blockchain technology without the need for blocks and miners. A DAG is very similar to this peer grading system. Instead of having large mining firms confirming transactions via proof of work, DAG employs the very transactions that users make in order to confirm each others’ transactions. DAG is essentially a distributed peer-confirming system at scale.

DAG Price Analysis

At the time of writing, DAG is ranked the 154th cryptocurrency globally and the current price is A$0.2962. Let’s take a look at the chart below for price analysis:

Source: TradingView

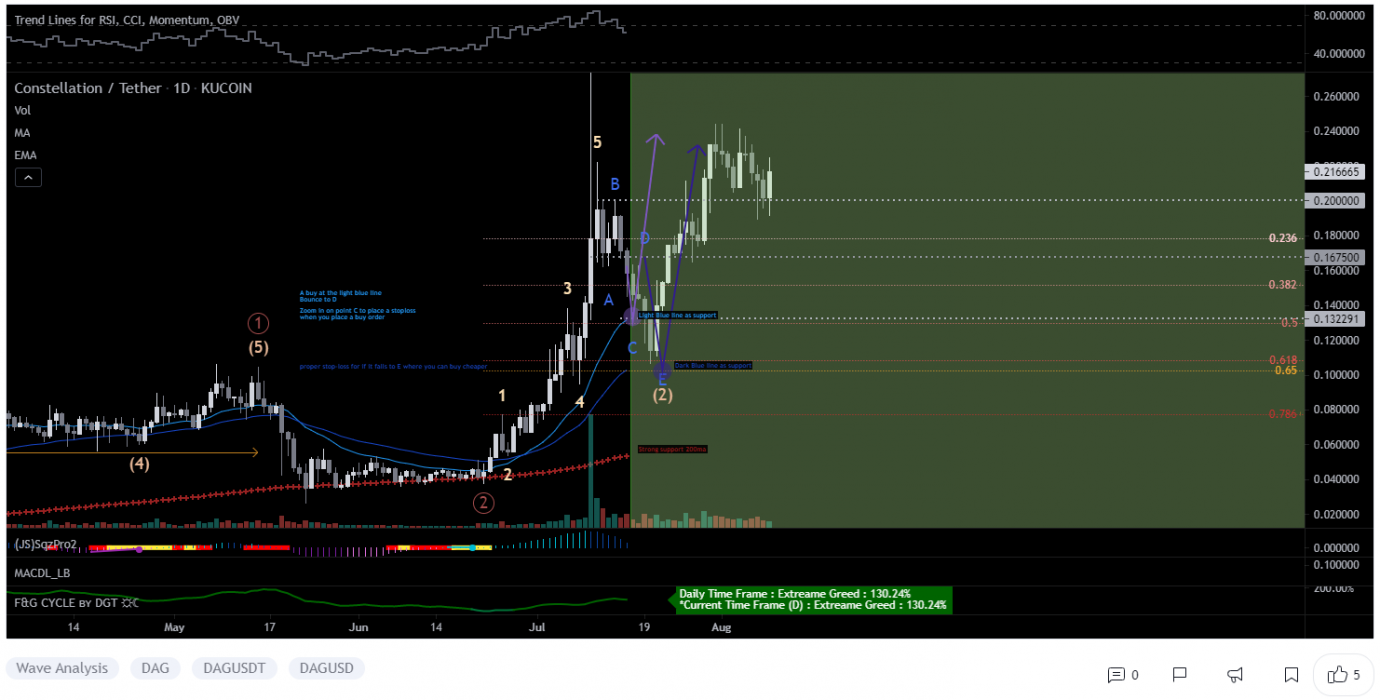
DAG’s massive July spike retraced near A$0.1730 into the consolidation that began the impulse before bouncing to A$0.3340. 

This consolidation could provide support again, although bears would first have to push the price through possible support near A$0.2679. The market’s structure may be shifting bearish, with A$0.2851 likely to provide some resistance if this is the case. A sustained bearish move could reach the swing low near A$0.1568 before finding support near A$0.1241.

However, the bullish higher-timeframe trend might prevail, with relatively equal highs near A$0.3341 potentially giving an attractive target to lure the price over the August monthly open. If so, the price could reach for the midpoint of the massive July wick near A$0.3864.

3. Voyager Token (VGX)

Voyager Token VGX is a cryptocurrency broker that provides investors with a trusted and secure access point to crypto asset trading. Voyager is built to serve both retail and institutional investors with a nigh-instant solution for trading crypto assets. The native token of the brokerage, Voyager Token VGX, is used to reward users within the Voyager ecosystem. VGX also generates interest when held in the Voyager app, and offers cashback rewards and other services exclusive to Voyager users.

VGX Price Analysis

At the time of writing, VGX is ranked the 90th cryptocurrency globally and the current price is A$5.04. Let’s take a look at the chart below for price analysis:

Source: TradingView

NOTE: VGX is listed as BQX on Binance

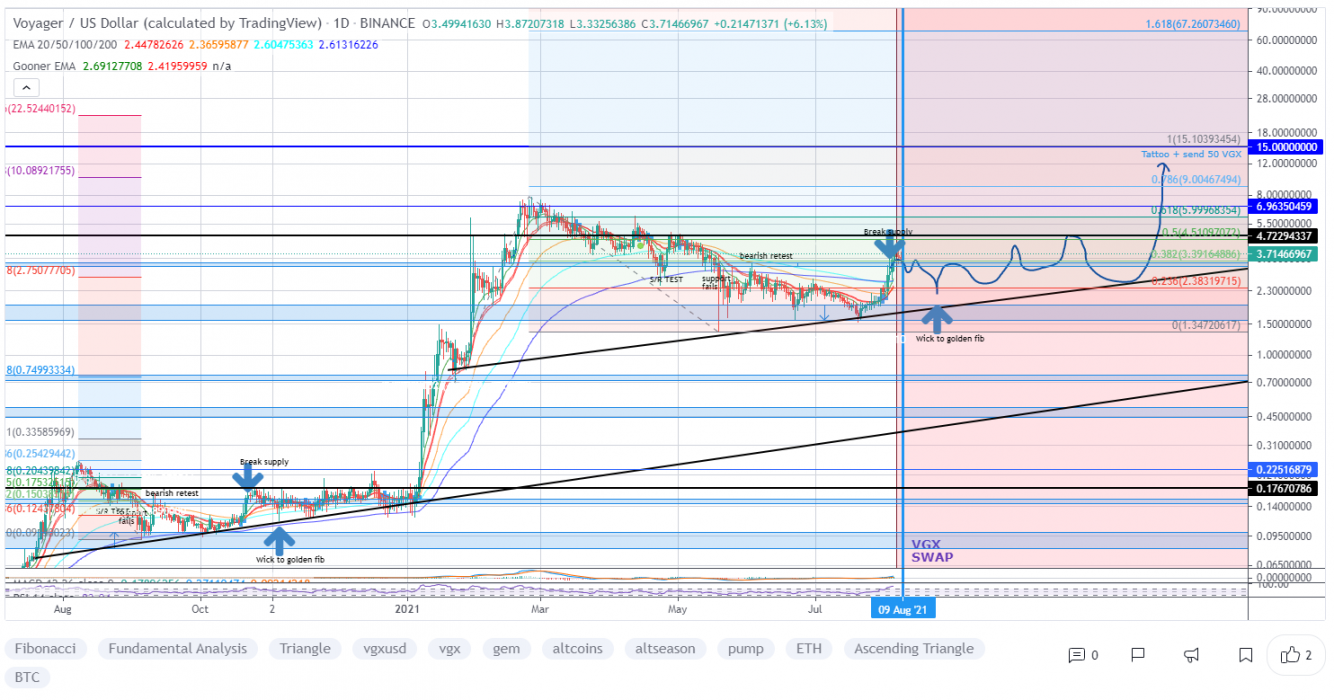
VGX set a high near A$10.65 in February before retracing nearly 83% to find a low near A$1.84. The price consolidated around this level before the strong bullish impulse during the past several weeks.

Probable resistance near A$4.71 is slowing the bullish advance down. However, another leg might target the last swing high at A$5.84 and relatively equal highs at A$6.73. Resistance near A$6.12 could cap the move before the second swing high. Beyond these levels, little stands in the bulls’ way before reaching the swing high near A$8.84.

A retracement before a move higher might find support in the daily gap near A$3.64, just above the August monthly open. Relatively equal lows near A$2.95 could also provide support. A run-on stop at A$2.09 and A$1.84 might find support in the gap beginning near A$1.59 or a high-timeframe level near A$1.15.

Where to Buy or Trade Altcoins?

These coins have high liquidity on Binance Exchange, so that could help with trading on AUD/USDT/BTC pairs. And if you’re looking at buying and HODLing cryptos, then Swyftx Exchange is an easy-to-use popular choice in Australia. However, you can also buy these coins from different exchanges listed on Coinmarketcap.
Categories
Binance Crypto News Market Analysis Swyftx Trading

Cartesi CTSI Surges +86% Amid listing on Kraken Exchange – CTSI Breakout Analysis

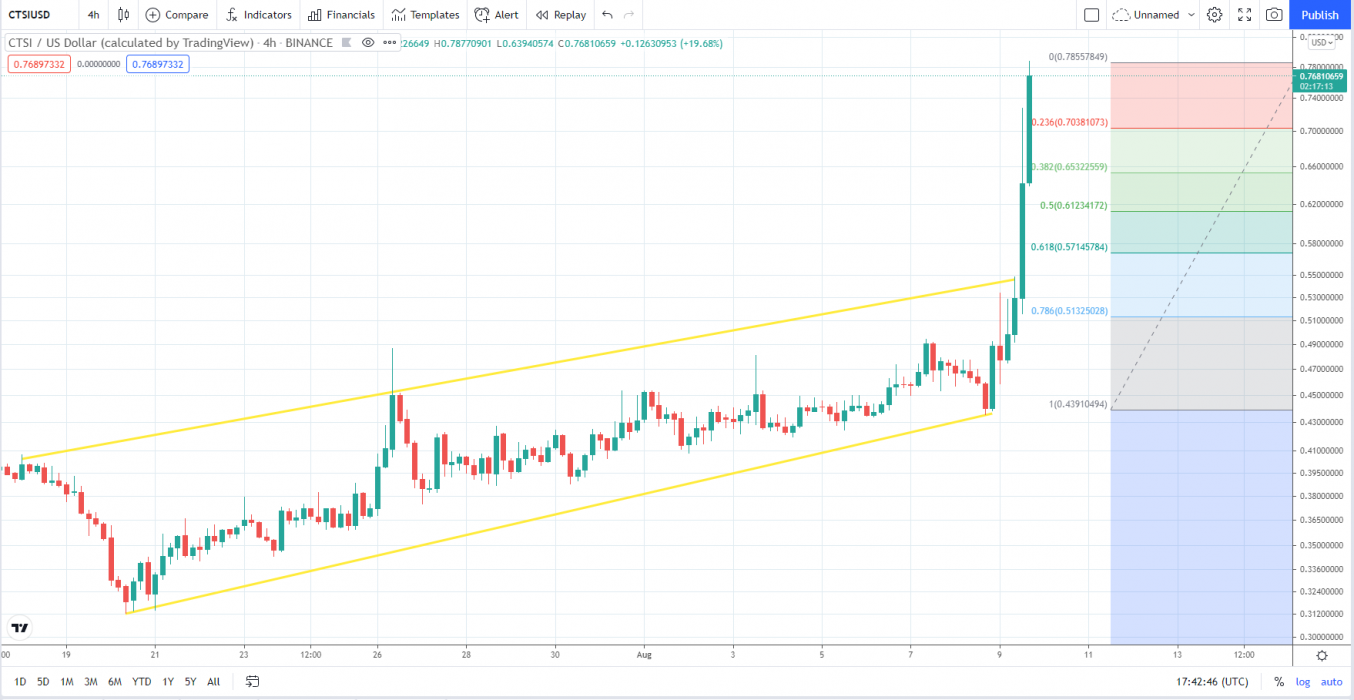
Cartesi CTSI is trading in an uptrend, like many other Altcoins. The cryptocurrency CTSI just went up +86% in a single day by breaking a rising wedge pattern with strong buying volume on multiple exchanges and surges over +105% in a week.

What is Cartesi?

Cartesi CTSI is taking smart contracts to the next level, solving the urgent problem of scalability and high fees on blockchains by implementing a variant of optimistic roll-ups. Most notably, Cartesi is revolutionising smart contract programming by allowing developers to code with mainstream software stacks. Noether is Cartesi’s side-chain that’s optimised for ephemeral data, providing low-cost data availability to DApps.

CTSI Price Analysis

At the time of writing, CTSI is ranked 145th cryptocurrency globally and the current price is A$1.12. This represents a +105% increase since August 2, 2021 (seven days ago), as shown in the chart below.

Source: TradingView

After looking at the above 4-Hour candle chart, we can clearly see that CTSI was trading inside the rising wedge pattern on the CTSI/USDT pair. The first resistance was on the A$0.6936 price level, which CTSI broke with a strong bullish trend buying volume and is now heading towards the previous monthly high price at A$1.35. Seeing that many Altcoins are holding a strong position this week after the recent bitcoin price recovery, CTSI may continue to increase in the uptrend if traders keep buying with high volume.

“The Rising Wedge is a bearish pattern that begins wide at the bottom and contracts as prices move higher and the trading range narrows. As a reversal pattern, the rising wedge will slope up and with the prevailing trend.”

What Do the Technical Indicators Say?

TradingView indicators (on the one-day window) mainly suggest CTSI as a Strong Buy, except the Oscillators, which indicate CTSI as a Buy.

So Why Did CTSI Breakout?

General market sentiment seems to suggest cryptos are hopefully turning back bull run season after recent massive price corrections. Another reason for this sudden pump in price could be whales secretly buying CTSI for the next Altcoins rally. Recent news was also announced regarding Kraken Exchange listing Cartesi CTSI with USD & EUR trading pairs.

Where to Buy or Trade CTSI?

CTSI has high liquidity on the Binance exchange, which could help for trading CTSI/BTC or CTSI/USDT pairs. Instead, if you’re looking at buying and HODLing cryptos, then Swyftx Exchange is a popular choice in Australia. However, you can also buy this coin from different exchanges listed on Coinmarketcap.

Categories
Binance Crypto News Litecoin Market Analysis Swyftx Trading

Top 3 Coins To Watch Today: LTC, UMA, SXP August 9 Trading Analysis

Let’s take a closer look at today’s altcoins showing breakout signals. We’ll explain what the coin is, then dive into the trading charts and provide some analysis to help you decide.

1. Litecoin (LTC)

Litecoin LTC is a cryptocurrency that was designed to provide fast, secure and low-cost payments by leveraging the unique properties of blockchain technology. Its main benefit comes from its speed and cost-effectiveness. Litecoin transactions are typically confirmed in just minutes, and transaction fees are nearly negligible. This makes it an attractive alternative to Bitcoin in developing countries, where transaction fees may be the deciding factor on which cryptocurrency to support.

Litecoin Price Analysis

At the time of writing, LTC is ranked the 15th cryptocurrency globally and the current price is A$205.31. Let’s take a look at the chart below for price analysis:

Source: TradingView

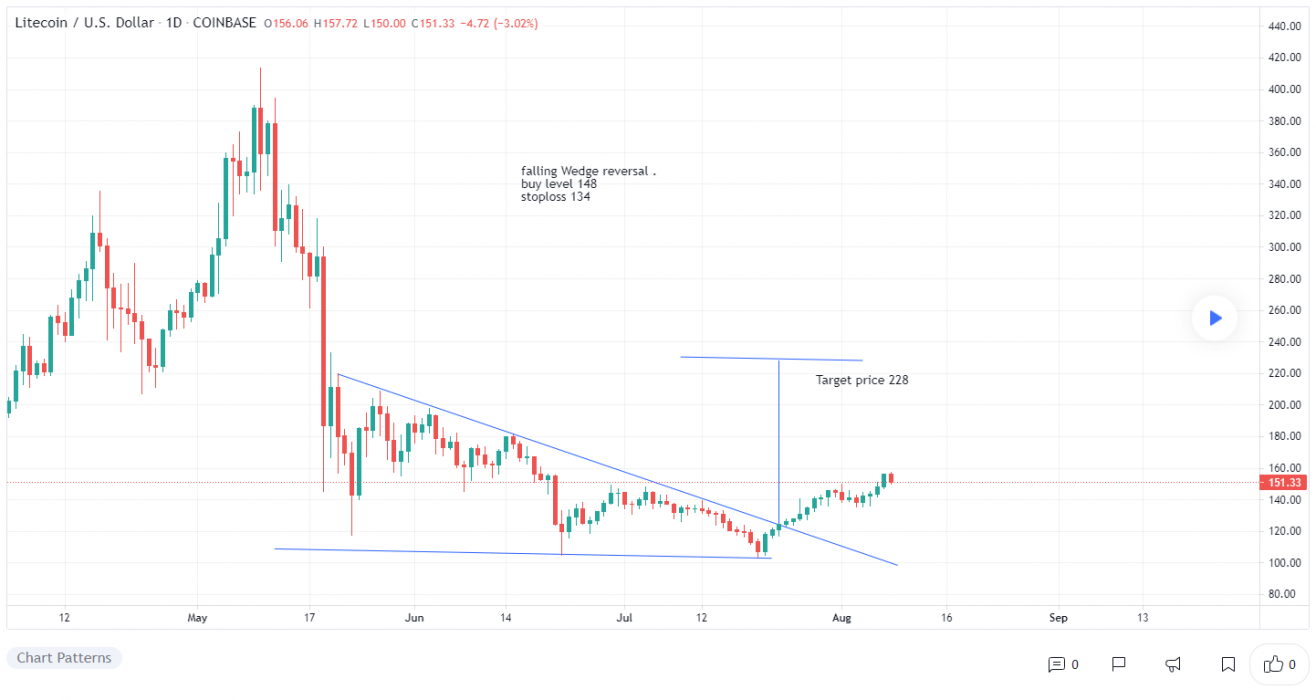
The weekend LTC run stops under swing lows down to A$195 as it tested support near A$190.

Aggressive traders expecting expansion to the upside could look for entries near possible support near A$192. Bids near A$189 may be able to capitalise on an attempt to run the stops below the weekend’s swing low. A stop run below this low may reach into possible support near A$183.

In the short term, A$235 may provide some resistance. The swing high near A$250 provides a reasonable first target, with the area just above up to A$268 likely to create resistance. 

A break of this zone makes the May high at A$329 a likely target, with further expansion possibly reaching near A$360.

2. Universal Market Access (UMA)

Universal Market Access UMA is a protocol for the creation of synthetic assets based on the Ethereum blockchain. Synthetic assets are a class of assets that represent different, underlying assets and have the same value. UMA specifically enables its users to design and create self-executing, self-enforcing financial contracts secured by economic incentives and run them on Ethereum’s blockchain.

UMA Price Analysis

At the time of writing, UMA is ranked the 105th cryptocurrency globally and the current price is A$13.34. Let’s take a look at the chart below for price analysis:

Source: TradingView

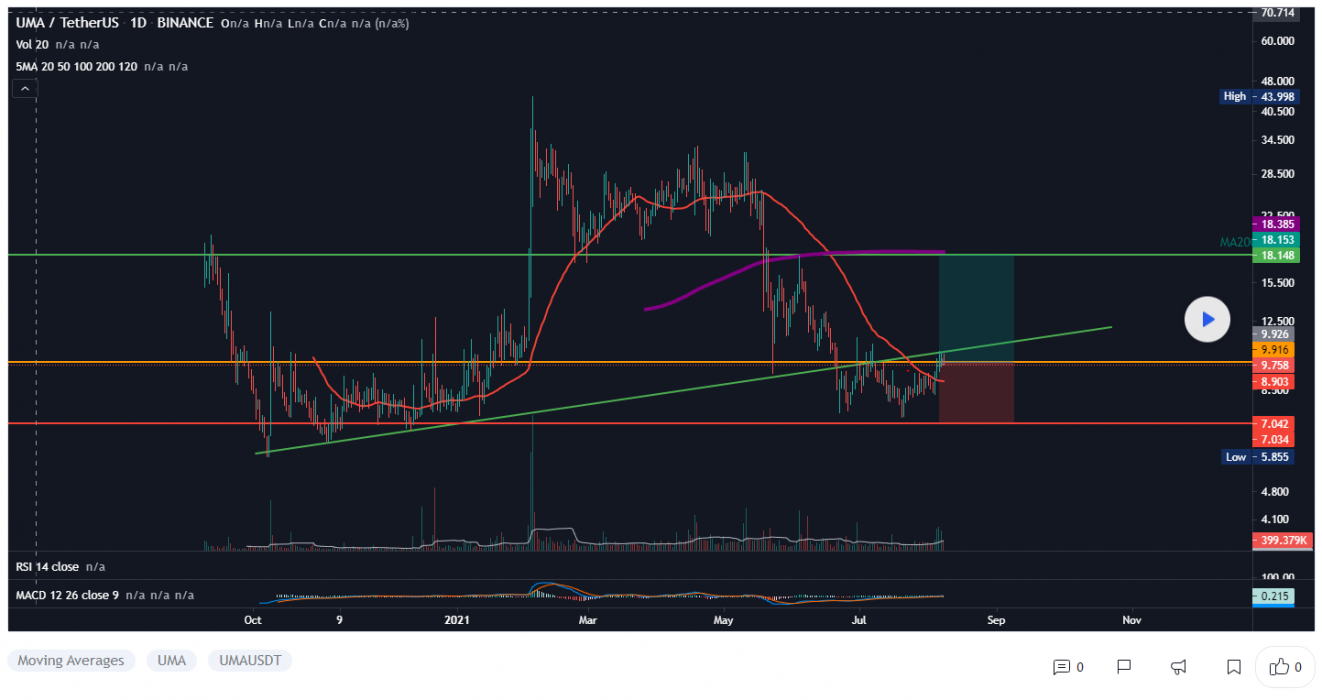
Last month’s 55% drop was immediately bought up and closed the weekly candle bullish, suggesting strength for UMA bulls.

Aggressive traders could look for support near A$11.78. Levels near A$10.35, A$9.43 and A$8.64 also provide reasonable areas for bids during a retracement.

Little resistance rests overhead, but the area between A$15.38 and the swing high at A$17.26 may cap an initial move upward. Extensions indicate A$18.67 and A$21.54 as reasonable take-profit zones.

3. Swipe (SXP)

Swipe SXP is a platform that looks to form a bridge between the fiat and cryptocurrency worlds with its API that is designed to create global payment cards powered by its native SXP token. Swipe also has an on-chain product called Swipe Swap, an Automated Market Maker which is forked by Uniswap, SushiSwap and THORchain, and is powered by Swipechain. This ecosystem is powered by the Swipe Token SXP, which functions as the fuel for the Swipe Network, and is used for paying transaction fees and securing Swipechain through bonding and governance.

SXP Price Analysis

At the time of writing, SXP is ranked the 149th cryptocurrency globally and the current price is A$3.37. Let’s take a look at the chart below for price analysis:

Source: TradingView

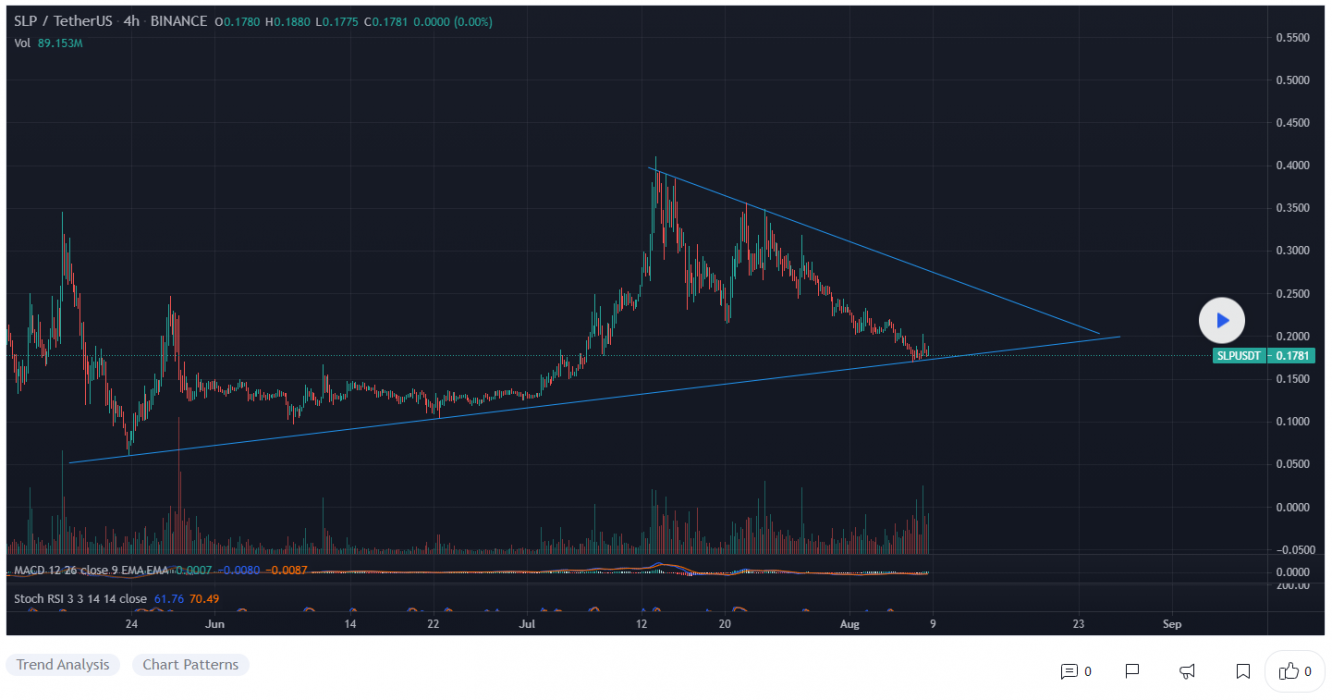
An impressive 215% month for SXP has retraced over 135% as the price consolidates near the weekly gap beginning near A$3.40.

The equal lows at this weekly gap are likely to see a stop run before any further move up. The area near A$3.31 at the top of a daily gap could provide support. 

More probable support begins at the bottom of the gap, ranging from approximately A$2.25 to the consolidation that started the massive move upward. If this level fails, traders could look for sensitivity near the middle of the monthly gap near A$1.95.

Impulses upward during retracement are likely, but the most substantial resistance is likely just below the May swing high near A$3.90. This swing high provides a clear first target, with extensions near A$4.18, A$4.29 and A$4.45.

Where to Buy or Trade Altcoins?

These coins have high liquidity on Binance Exchange, so that could help with trading on AUD/USDT/BTC pairs. And if you’re looking at buying and HODLing cryptos, then Swyftx Exchange is an easy-to-use popular choice in Australia. However, you can also buy these coins from different exchanges listed on Coinmarketcap.

Categories
Binance Crypto News Market Analysis Swyftx Trading

Badger Surged +75% in a Single Day after Migrating to the new CurveFinance Tricrypto2 Pool

BadgerDao BADGER is trading in an uptrend, like many other Altcoins. The cryptocurrency BADGER just went up +75% in a single day by breaking a rising wedge pattern with strong buying volume on multiple exchanges and surges over +135% in a week.

What is BadgerDao?

BadgerDao BADGER is an open-source, decentralised automated organisation that is dedicated to building products and infrastructure of simplifying the use of Bitcoin as collateral across many smart contract platforms. The platform is a shared space where the developers, known as Badge Builders, have the ability to collaborate and implement Bitcoin as collateral to as many blockchains as possible. A developer can earn a percentage of the fees and BADGER tokens from the developer mining pool for every implementation.

BADGER Price Analysis

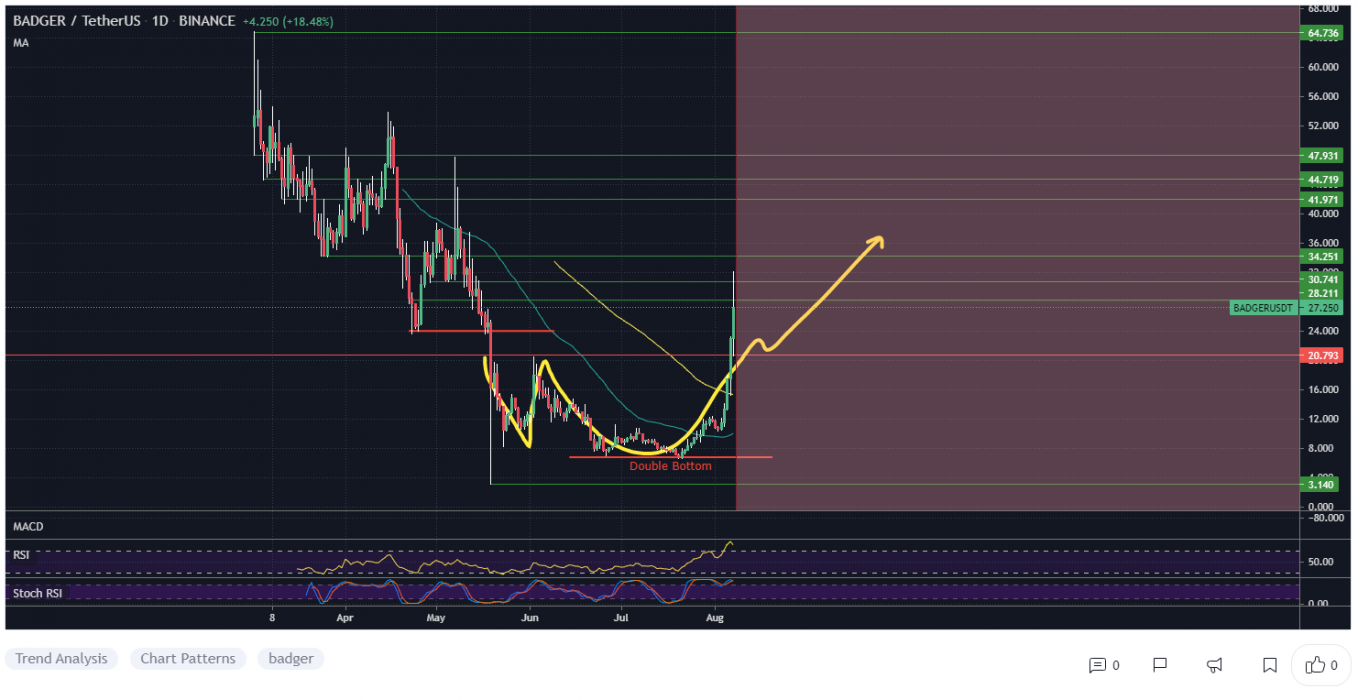
At the time of writing, BADGER is ranked 152nd cryptocurrency globally and the current price is A$37.05. This represents a +135% increase since August 1, 2021 (seven days ago), as shown in the chart below.

Source: TradingView

After looking at the above 1-Day candle chart, we can clearly see that BADGER was trading inside the rising wedge pattern on the BADGER/USDT pair. The first resistance was on the A$22.56 price level, which BADGER broke with a strong bullish trend buying volume and is now heading towards the previous high prices near A$45.27. Seeing that many Altcoins are holding a strong position this week after the recent bitcoin price recovery with a bullish trend, BADGER may continue to increase in the uptrend if traders keep buying with high volume.

“The Rising Wedge is a bearish pattern that begins wide at the bottom and contracts as prices move higher and the trading range narrows. As a reversal pattern, the rising wedge will slope up and with the prevailing trend.”

What Do the Technical Indicators Say?

TradingView indicators (on the one-day window) mainly suggest BADGER as a Buy, except the Oscillators, which indicate BADGER as a Neutral.

So Why Did BADGER Breakout?

General market sentiment seems to suggest cryptos are hopefully turning back bull run season after recent massive price corrections. Another reason for this sudden pump in price could be whales secretly buying BADGER for the next Altcoins rally. Recent news was also announced regarding BadgerDao Migrating to the new CurveFinance Tricrypto2 pool with a new corresponding vault.

Where to Buy or Trade BADGER?

Badger has high liquidity on the Binance exchange, which could help for trading BADGER/BTC or BADGER/USDT pairs. Instead, if you’re looking at buying and HODLing cryptos, then Swyftx Exchange is a popular choice in Australia. However, you can also buy this coin from different exchanges listed on Coinmarketcap.
Categories
Binance Crypto News Market Analysis Swyftx Trading

Stafi FIS Surged +285% in a Single Day after BSC Bridge integrated into the rToken app

Stafi Protocol FIS is trading in an uptrend, like many other Altcoins. The cryptocurrency FIS just went up +285% in a single day by breaking a rising wedge pattern with strong buying volume on multiple exchanges and surges over +315% in a week.

What is Stafi Protocol?

Stafi FIS (short for Staking Finance) is a DeFi protocol that aims to unlock the liquidity of staked assets. STAFI Protocol solves the contradiction between the token liquidity and Mainnet security by issuing ABT tokens, which provide the liquidity of your Staking Assets. ABT token increases the staking rate to a higher level 100%, theoretically, and it could be tradable, its security is guided by STAFI Protocol which ensures ABT token is the only collateral that can apply to redeem staking assets from the original staking blockchain Tezos, Cosmos, Polkadot, etc.

FIS Price Analysis

At the time of writing, FIS is ranked 613th cryptocurrency globally and the current price is A$3.19. This represents a +315% increase since July 31, 2021 (seven days ago), as shown in the chart below.

Source: TradingView

After looking at the above 1-Hour candle chart, we can clearly see that FIS was trading inside the rising wedge pattern on the FIS/USDT pair. The first resistance was on the A$1.42 price levels, which FIS broke with a strong bullish trend buying volume and is now heading towards the previous high price at A$3.26. Seeing that many Altcoins are holding a strong position this week after the recent bitcoin price recovery, FIS may continue to increase in the uptrend if traders keep buying with high volume.

“The Rising Wedge is a bearish pattern that begins wide at the bottom and contracts as prices move higher and the trading range narrows. As a reversal pattern, the rising wedge will slope up and with the prevailing trend.”

What Do the Technical Indicators Say?

TradingView indicators (on the one-day window) mainly suggest FIS as a Strong Buy, except the Oscillators, which indicate FIS as a Neutral.

So Why Did FIS Breakout?

General market sentiment seems to suggest cryptos are hopefully turning back bull run season after recent massive price corrections. Another reason for this sudden pump in price could be whales secretly buying FIS for the next Altcoins rally. Recent news was also announced regarding BSC Bridge integrated into the rToken app.

Where to Buy or Trade FIS?

Stafi FIS has high liquidity on the Binance exchange, which could help for trading FIS/BTC or FIS/USDT pairs. Instead, if you’re looking at buying and HODLing cryptos, then Swyftx Exchange is a popular choice in Australia. However, you can also buy this coin from different exchanges listed on Coinmarketcap.