Categories
Binance Crypto News Market Analysis Swyftx Trading

Top 3 Coins To Watch Today: REN, BAL, CRV August 6 Trading Analysis

Let’s take a closer look at today’s altcoins showing breakout signals. We’ll explain what the coin is, then dive into the trading charts and provide some analysis to help you decide.

1. Republic Protocol (REN)

Republic Protocol REN is an open protocol built to provide interoperability and liquidity between different blockchain platforms. The protocol’s native token, REN, functions as a bond for those running nodes which power RenVM, known as Darknodes. Ren aims to expand the interoperability, and hence accessibility, of decentralised finance (DeFi) by removing hurdles involved in liquidity between blockchains.

REN Price Analysis

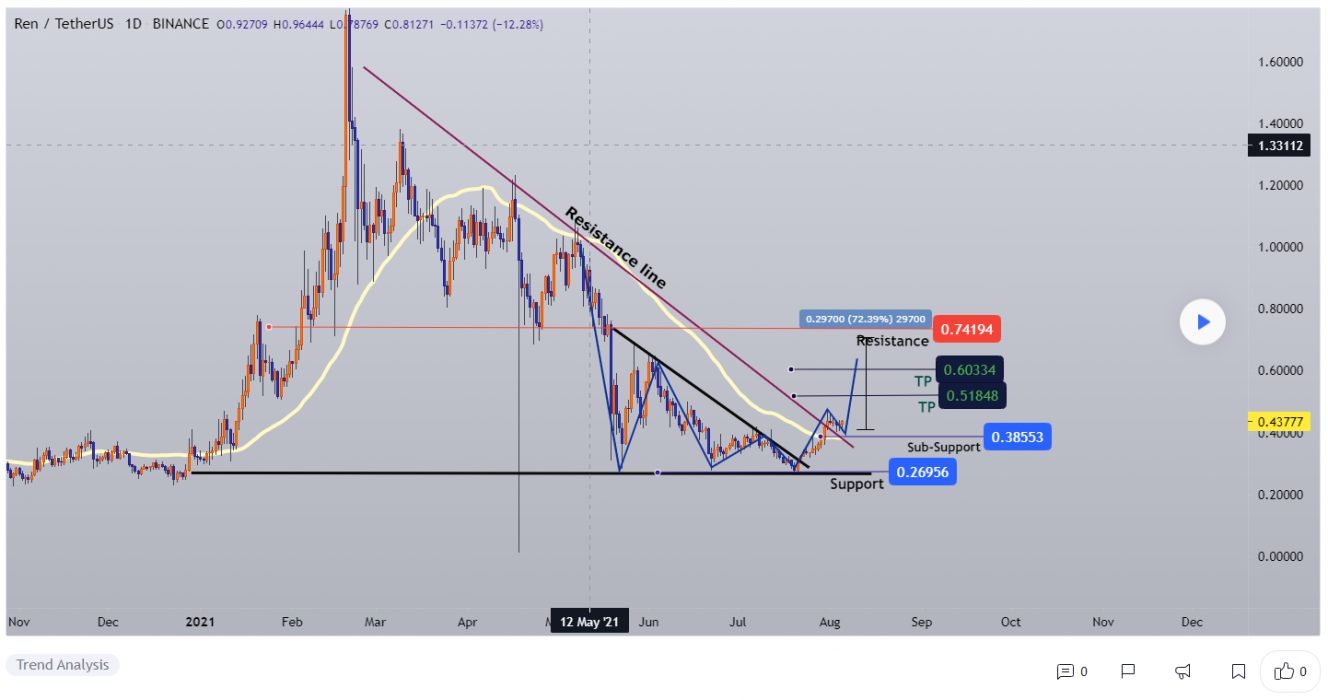
At the time of writing, REN is ranked the 114th cryptocurrency globally and the current price is A$0.5937. Let’s take a look at the chart below for price analysis:
Source: TradingView

REN’s explosive Q1 – climbing over 350% – retraced nearly 230% of the move within Q2.

While the price likely needs to cool off before any significant move is higher, stubborn bulls could look for entries in possible support beginning near A$0.5174. 

A break below A$0.4736 is likely to continue to an area near A$0.4589. Strong bearish momentum might push the price to possible support near A$0.4236.

In both bullish and bearish scenarios, it’s reasonable (but not guaranteed) to anticipate a retest of resistance near A$0.6734, which would sweep a cluster of relatively equal highs near A$0.6944. 

Continued strength above this area could continue to resistance near A$0.7514 and the high near A$0.8435.

2. Balancer (BAL)

Balancer BAL is an automated market maker (AMM) that was developed on the Ethereum blockchain and launched in March 2020. It was able to raise a $3 million seed round by Placeholder and Accomplice. Balancer protocol functions as a self-balancing weighted portfolio, price sensor and liquidity provider. It allows users to earn profits through its recently introduced token BAL by contributing to customisable liquidity pools.

BAL Price Analysis

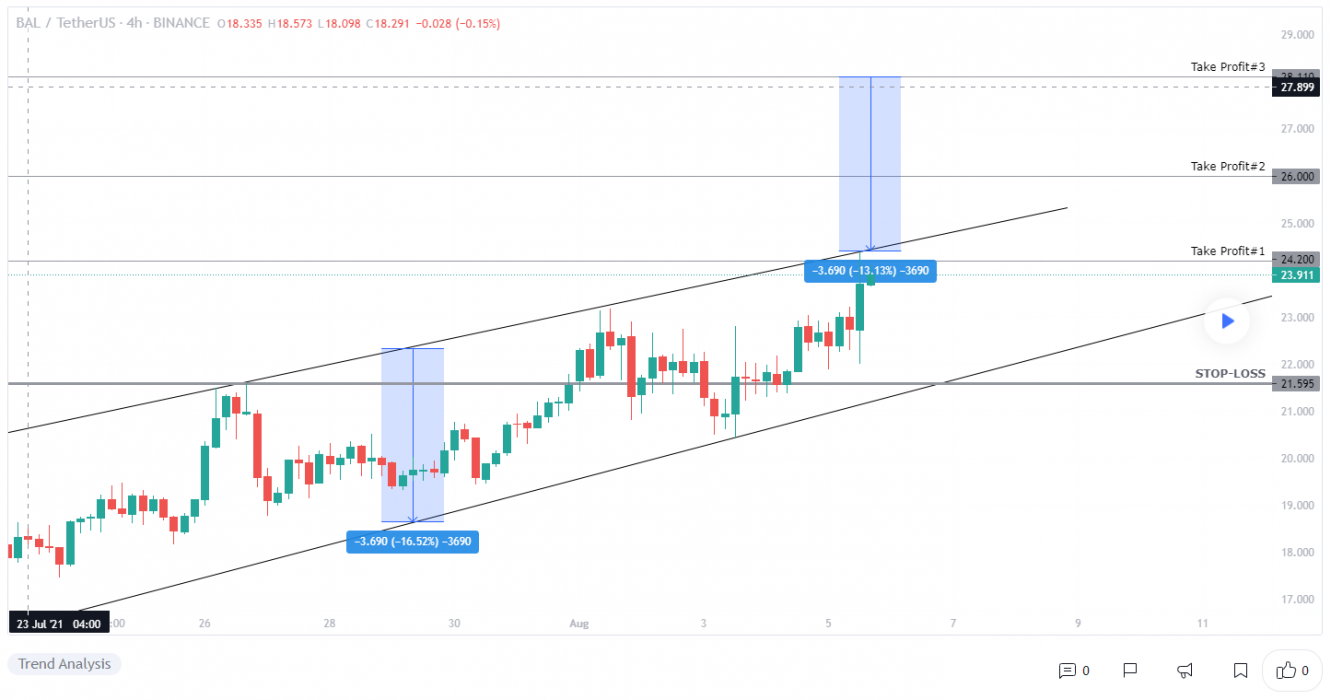
At the time of writing, BAL is ranked the 184th cryptocurrency globally and the current price is A$32.53. Let’s take a look at the chart below for price analysis:
Source: TradingView

Since the beginning of Q3, BAL has climbed 65% – a relatively small amount compared to many other altcoins. However, it continues to creep to new all-time highs, suggesting that the consolidation period may be near its end.

Aggressive bulls could look for entries in new possible support between A$29.15 and A$27.48. A dip below this area might also find support near A$24.66. However, a daily close near A$22.87 brings bullish strength into question. 

A sudden drop in the market is likely to test possible support beginning near A$20.33. This retracement would create extensions suggesting A$48.85 – A$59.25 as a potential target for bulls. 

Currently, extensions indicate a reasonable take-profit zone near A$35.44 to A$39.13, with A$41.55 having the most confluence. If bulls can maintain strength, confluent extensions point to A$43.62 – A$45.27 as a reasonable next target.

3. Curve DAO Token (CRV)

Curve CRV is a decentralised exchange for stablecoins that uses an automated market maker (AMM) to manage liquidity. Curve has gained considerable attention by following its remit as an AMM specifically for stablecoin trading. The launch of the DAO and CRV token brought in further profitability, given CRV’s use for governance, as it is awarded to users based on liquidity commitment and length of ownership. The explosion in DeFi trading has ensured Curve’s longevity, with AMMs turning over huge amounts of liquidity and associated user profits.

CRV Price Analysis

At the time of writing, CRV is ranked the 104th cryptocurrency globally and the current price is A$2.43. Let’s take a look at the chart below for price analysis:

Source: TradingView

June 1 spawned a bullish move in CRV, reaching over 122%. Chaotic price action near the top of this move resolved into a nearly 65% retracement.

Multiple breaks of swing lows between sweeps of swing highs suggest that the market structure has turned bearish for the weekend. If the overall market’s conditions remain bullish, this is likely to result in consolidation somewhere below the current price.

Possible support for the start of consolidation rests near A$2.35. A set of equal lows below this level will likely be swept into possible support, beginning near A$2.28.

Another spike upward is possible, but not guaranteed, as the price retraces. The area just under the July monthly open, beginning near A$2.61, gives a reasonable target. Above this resistance, the last swing high near A$2.75 provides the following target.

Where to Buy or Trade Altcoins?

These coins have high liquidity on Binance Exchange, so that could help with trading on AUD/USDT/BTC pairs. And if you’re looking at buying and HODLing cryptos, then Swyftx Exchange is an easy-to-use popular choice in Australia. However, you can also buy these coins from different exchanges listed on Coinmarketcap.

Categories
Binance Crypto News Market Analysis Swyftx Trading

TrueFi TRU Surged +162% in a Single Day After Raising $12.5M to Scale TrueFi Lending Protocol

TrueFi TRU is trading in an uptrend, like many other Altcoins. The cryptocurrency TRU just went up +162% in a single day by breaking a rising wedge pattern with strong buying volume on multiple exchanges and surges over +195% in a week.

What is TrueFi?

TrueFi TRU is a protocol for creating interest-bearing pools with a high APR for liquidity providers. TrueFi includes utility and rewards mechanisms using TrustTokens TRU and rewards participants for maintaining stable, high APRs. TRU is the native token of the TrueFi protocol and TrustToken holders ultimately have a say over who is a credible borrower in the prediction market. TRU gives the holder the ability to rate credit for third parties.

TRU Price Analysis

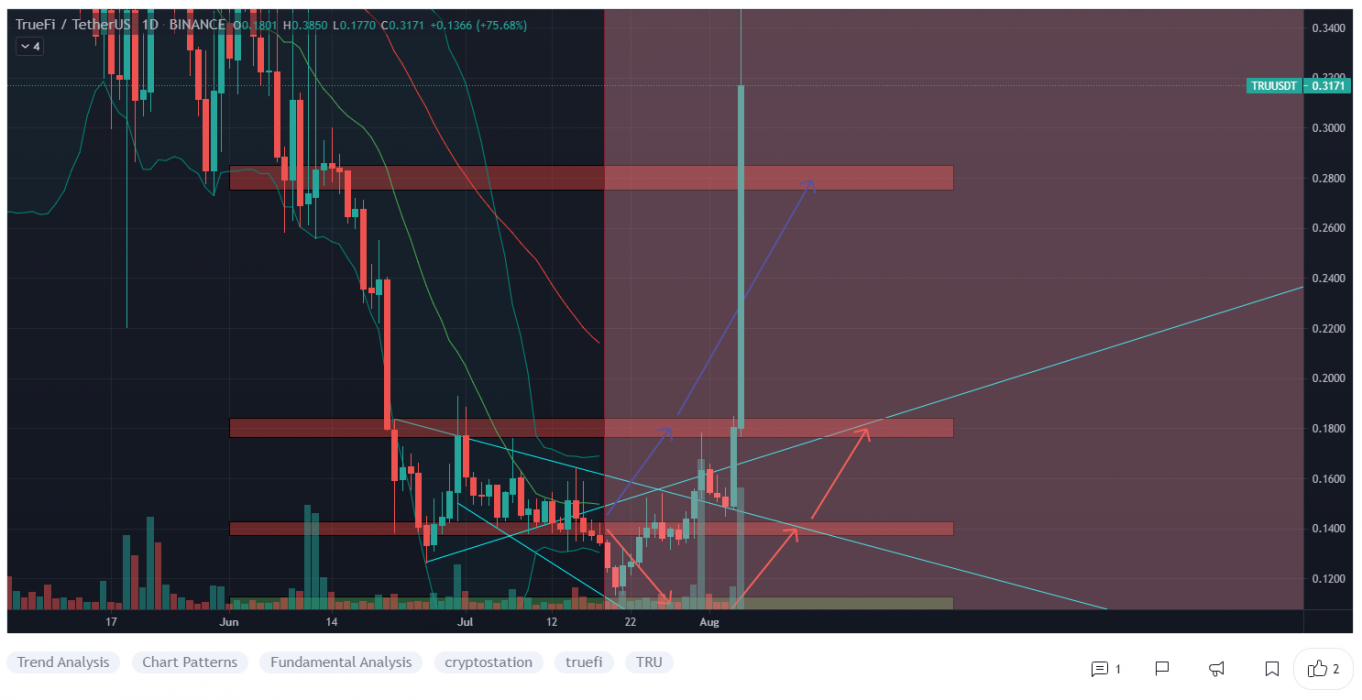
At the time of writing, TRU is ranked 464th cryptocurrency globally and the current price is A$0.4542. This represents a +195% increase since July 30, 2021 (seven days ago), as shown in the chart below.

Source: TradingView

After looking at the above 1-Day candle chart, we can clearly see that TRU was trading inside the rising wedge pattern on the TRU/USDT pair. The first resistance was on the A$0.2435 price levels, which TRU broke with a strong bullish trend buying volume and is now heading towards the previous monthly high price at A$0.4084. Seeing that many Altcoins are holding a strong position this week after the recent bitcoin price recovery, TRU may continue to increase in the uptrend if traders keep buying with high volume.

“The Rising Wedge is a bearish pattern that begins wide at the bottom and contracts as prices move higher and the trading range narrows. As a reversal pattern, the rising wedge will slope up and with the prevailing trend.”

What Do the Technical Indicators Say?

TradingView indicators (on the one-day window) mainly suggest TRU as a Strong Buy, except the Oscillators, which indicate TRU as a Buy.

So Why Did TRU Breakout?

General market sentiment seems to suggest cryptos are hopefully turning back bull run season after recent massive price corrections. Another reason for this sudden pump in price could be whales secretly buying TRU for the next Altcoins rally. Recent news was also announced regarding TrustToken Raises $12.5M from BlockTower.

Where to Buy or Trade TRU?

TRU has high liquidity on the Binance exchange, which could help for trading TRU/BTC or TRU/USDT pairs. Instead, if you’re looking at buying and HODLing cryptos, then Swyftx Exchange is a popular choice in Australia. However, you can also buy this coin from different exchanges listed on Coinmarketcap.

Categories
Binance Cardano Crypto News Market Analysis Swyftx Trading

Top 3 Coins To Watch Today: ADA, AXS, KEY August 5 Trading Analysis

Let’s take a closer look at today’s altcoins showing breakout signals. We’ll explain what the coin is, then dive into the trading charts and provide some analysis to help you decide.

1. Cardano (ADA)

Cardano ADA is a proof-of-stake blockchain platform that says its goal is to allow “changemakers, innovators, and visionaries” to bring about positive global change. Cardano is used by agricultural companies to track fresh produce from field to fork, while other products built on the platform allow educational credentials to be stored in a tamper-proof way, and retailers to clamp down on counterfeit goods.

ADA Price Analysis

At the time of writing, ADA is ranked the 5th cryptocurrency globally and the current price is A$1.86. Let’s take a look at the chart below for price analysis:

Source: TradingView

Mid-May’s 115% explosion retraced ADA into support at the 62% retracement and daily gap beginning near A$1.66 before spending the rest of the month inside this range.

Aggressive bulls could look for entries in potential support near A$1.63 and A$1.60. However, a more probable and higher-risk reward entry could present itself in support near A$1.57 and A$1.53 after a sweep of the relatively equal lows near A$1.49.

The last swing high near A$2.07 provides resistance. Breaking this resistance creates likely targets at the next high, near A$2.11, and June’s high, near A$2.35. 

Beyond these highs, overlapping extensions near A$2.42, A$2.48 and A$2.55 provide reasonable take-profit zones.

2. Axie Infinity (AXS)

Axie Infinity AXS is a blockchain-based trading and battling game that is partially owned and operated by its players. The Axie Infinity ecosystem has its own unique governance token, known as Axie Infinity Shards AXS. These are used to participate in key governance votes and will give holders a say in how funds in the Axie Community Treasury are spent.

AXS Price Analysis

At the time of writing, AXS is ranked the 39th cryptocurrency globally and the current price is A$59.90. Let’s take a look at the chart below for price analysis:

Source: TradingView

AXS’s relatively small 50% range could suggest that a much larger move is setting up in August.

Aggressive bulls could look for entries at the most recent area of support formed near A$53.41. However, equal lows near A$50.27 make a tempting target for a stop run into this support. This move could reach support near A$48.67. 

A decisive move to the downside could run stops below the second set of relatively equal lows near A$44.21, possibly reaching support at an old swing high and a daily gap near A$41.83.

A recent level near A$62.55 provided resistance and caused a recent swing high to form near A$66.38, offering first targets. A move through this high may arrive at new high levels near A$74.65 and A$82.93.

3. Selfkey (KEY)

SelfKey KEY is a blockchain-based identity platform. The technology provides individuals, companies, exchanges, fintech startups and banks with a platform to manage identity data (oftentimes KYC). SelfKey aims to revolutionise the KYC on-boarding process and remain true to the ethos of Self-Sovereign Identity where individuals should be able to own and control their identity.

KEY Price Analysis

At the time of writing, KEY is ranked the 536th cryptocurrency globally and the current price is A$0.00956. Let’s take a look at the chart below for price analysis:

Source: TradingView

June gave KEY another 69% leg into resistance, beginning near A$0.01602. The retracement through the second half of the month to 52% may be setting the stage for the next significant move upward.

A sweep of relatively equal lows near A$0.008654 into the daily gap and support down to A$0.008241 may offer a favourable risk-reward entry. More aggressive bulls could begin positions at potential support near A$0.007862.

Resistance near A$0.01097 is framed by relatively equal highs just above, which provides a reasonable first profit objective. The last swing high near A$0.01346 provides the next target on a break of this resistance. 

Overlapping extensions near A$0.01577, A$0.01739 and A$0.01957 may also be sources of resistance.

Where to Buy or Trade Altcoins?

These coins have high liquidity on Binance Exchange, so that could help with trading on AUD/USDT/BTC pairs. And if you’re looking at buying and HODLing cryptos, then Swyftx Exchange is an easy-to-use popular choice in Australia. However, you can also buy these coins from different exchanges listed on Coinmarketcap.

Categories
Binance Crypto News Market Analysis Swyftx Trading

Top 3 Coins To Watch Today: EPS, BZRX, ALPHA August 4 Trading Analysis

Let’s take a closer look at today’s altcoins showing breakout signals. We’ll explain what the coin is, then dive into the trading charts and provide some analysis to help you decide.

1. Ellipsis (EPS)

Ellipsis EPS finance is an exchange for stablecoins on the Binance Smart Chain. It allows for stablecoins swap with very low slippage and minimal fees. EPS is a Revenue Earning token where token stakers will earn fees from the Ellipsis protocol. EPS is the native token on the platform that provides value for LPs and token holders.

EPS Price Analysis

At the time of writing, EPS is ranked the 379th cryptocurrency globally and the current price is A$0.7646. Let’s take a look at the chart below for price analysis:

Source: TradingView

July has been an exceptionally volatile month for EPS. The price climbed nearly 285%, retraced over 135%, then bounced 88% into resistance beginning near A$0.9255.

This weekend filled a gap from A$0.6841 to A$0.7256, which may provide support again. A sweep through this level to tag Sunday’s swing low is likely to test probable support near A$0.6624.

A more substantial move down could reach support at A$0.6283 and possibly touch the gap near A$0.5689.

The price is testing fresh resistance at A$0.8263, making the swing high at A$0.8544 a likely target. A break of this level might continue to the swing high at A$0.9621 before continuing into price discovery.

2. Bzx Protocol (BZRX)

The Bzx protocol BZRX is an Ethereum-based decentralised platform built for DeFi lending and margin and leverage trading that differentiates itself from competitors through a smart contract-powered token system. Bzx’s trading front-end Fulcrum allows users to trade and/or lend crypto assets through tokenised loans (iTokens) and tokenized positions (pTokens). Torque serves as bZx’s lending front-end web interface, allowing users to borrow funds for any purpose at a fixed interest rate.

BZRX Price Analysis

At the time of writing, BZRX is ranked the 388th cryptocurrency globally and the current price is A$0.3257. Let’s take a look at the chart below for price analysis:

Source: TradingView

BZRX bulls enjoyed nearly 145% returns during March, with the Q2 retracing almost 85% beginning a consolidation from Q3 between resistance near A$0.3544 and the low around A$0.2357.

A stop run into support beginning near A$0.1932 is likely to precede any significant move upward. This stop run could easily reach the consolidation high near A$0.1766, giving bulls a better entry. 

A more significant shift in the market could reach probable support at the daily gap near A$0.1652, giving bulls a favorable risk-reward entry to target the last high at A$0.3685, A$0.4187, and A$0.4698.

3. Alpha Finance Lab (ALPHA)

Alpha Finance Lab ALPHA is a cross-chain DeFi platform that looks to bring alpha to users across a variety of different blockchains, including Binance Smart Chain (BSC) and Ethereum. ALPHA is the native utility token of the platform. Token holders can earn a share of network fees by staking ALPHA tokens to cover any default loans. Other use cases for the token include liquidity mining and governance voting.

ALPHA Price Analysis

At the time of writing, ALPHA is ranked the 155th cryptocurrency globally and the current price is A$0.882. Let’s take a look at the chart below for price analysis:

Source: TradingView

ALPHA printed reasonable returns during June and July, soaring over 129% before dropping to sweep the local lows and fill the daily gap near A$0.7285. 

This gap could continue to provide support, but a decline to the gap over the consolidation near A$0.6438 provides a more favourable entry.

A daily close-through resistance at A$0.9641 and A$0.9912 points to the A$1.15 swing high as the next primary target and may turn the current resistance to support.

Where to Buy or Trade Altcoins?

These coins have high liquidity on Binance Exchange, so that could help with trading on AUD/USDT/BTC pairs. And if you’re looking at buying and HODLing cryptos, then Swyftx Exchange is an easy-to-use popular choice in Australia. However, you can also buy these coins from different exchanges listed on Coinmarketcap.
Categories
Binance Crypto News Ethereum Market Analysis Swyftx Trading

Top 3 Coins To Watch Today: ETH, GRT, HBAR August 3 Trading Analysis

Let’s take a closer look at today’s altcoins showing breakout signals. We’ll explain what the coin is, then dive into the trading charts and provide some analysis to help you decide.

1. Ethereum (ETH)

Ethereum ETH is a decentralised open-source blockchain system that features its own cryptocurrency, Ether. ETH works as a platform for numerous other cryptocurrencies, as well as for the execution of decentralised smart contracts. Ethereum’s own purported goal is to become a global platform for decentralised applications, allowing users from all over the world to write and run software that is resistant to censorship, downtime and fraud.

ETH Price Analysis

At the time of writing, ETH is ranked the 2nd cryptocurrency globally and the current price is A$3,578. Let’s take a look at the chart below for price analysis:

Source: TradingView

After a 61% decline from May to June, ETH has ranged between A$3956 and A$2308.

The recent rally is approaching probable resistance near A$3679 but could be aiming for stops above the relatively equal highs near A$3956 Continuation of the bullish move could target the daily gap near A$4073.

Aggressive bulls might add to positions near A$3410 and A$3288. Price action near A$3152 may be more likely to provide support – if the price reaches it – during any retracements.

Relatively equal lows clustered around A$2300 seem likely to be swept if the bearish trend resumes. If this move occurs, the price might find support at the significant higher-timeframe level near A$1930.

2. The Graph (GRT)

The Graph GRT is an indexing protocol for querying data for networks like Ethereum and IPFS, powering many applications in both DeFi and the broader Web3 ecosystem. Anyone can build and publish open APIs, called subgraphs, that applications can query using GraphQL to retrieve blockchain data. GRT is a work token that is locked up by Indexers, Curators and Delegators in order to provide indexing and curating services to the network.

GRT Price Analysis

At the time of writing, GRT is ranked the 34th cryptocurrency globally and the current price is A$0.9129. Let’s take a look at the chart below for price analysis:

Source: TradingView

GRT‘s 85% retracement from its February highs set a low near A$0.5847 during its consolidation that began in mid-May.

Relatively equal highs near A$1.09 could be the current target if the price breaks through resistance beginning near A$0.9958. Bullish continuation might reach through the next significant swing high near A$1.32 into the daily gap near A$1.33.

If bullish strength continues, the zones just below the monthly open near A$0.84 and A$0.8124 could halt any retracement. 

A bearish shift in the market might seek the relatively equal lows near A$0.7136 into possible support near A$0.6982. If this down move occurs, the swing low near A$0.5433 and possible support near A$0.5214 may be the primary objective.

3. Hedera Hashgraph (HBAR)

Hedera Hashgraph HBAR is a public network that allows individuals and businesses to create powerful decentralised applications (DApps). It is designed to be a fairer, more efficient system that eliminates some of the limitations that older blockchain-based platforms face, such as slow performance and instability. Unlike most other cryptocurrency platforms, Hedera Hashgraph isn’t built on top of a conventional blockchain. Instead, it introduces a completely novel type of distributed ledger technology known as a Hashgraph.

HBAR Price Analysis

At the time of writing, HBAR is ranked the 50th cryptocurrency globally and the current price is A$0.2966. Let’s take a look at the chart below for price analysis:

Source: TradingView

After retracing nearly 70% from its March high, HBAR set a low near A$0.1982 as it formed its current range.

Last week, the price swept highs near A$0.2936, which now also marks the August monthly open. Relatively equal daily highs near A$0.3085 provide a reasonable target, although resistance beginning near A$0.3155 could cap the move. A break of this resistance is likely to target the swing high near A$0.3524 into higher-timeframe resistance beginning near A$0.3769.

The current area near A$0.2652 could provide support, although bulls may be more likely to buy near the price fractal near A$0.2437 if a retracement reaches this level. A break of this area could continue down to sweep the June low near A$0.2048 into possible support beginning near A$0.1874.

Where to Buy or Trade Altcoins?

These coins have high liquidity on Binance Exchange, so that could help with trading on AUD/USDT/BTC pairs. And if you’re looking at buying and HODLing cryptos, then Swyftx Exchange is an easy-to-use popular choice in Australia. However, you can also buy these coins from different exchanges listed on Coinmarketcap.
Categories
Binance Crypto News Market Analysis NEO Swyftx Trading

Top 3 Coins To Watch Today: NEO, MATIC, ICP August 2 Trading Analysis

Let’s take a closer look at today’s altcoins showing breakout signals. We’ll explain what the coin is, then dive into the trading charts and provide some analysis to help you decide.

1. Neo (NEO)

Neo bills itself as a “rapidly growing and developing” ecosystem that has the goal of becoming the foundation for the next generation of the internet – a new economy where digitised payments, identities and assets come together. The team behind this project operates an EcoBoost initiative that’s designed to encourage people to build decentralised apps and smart contracts on its blockchain. It’s often been likened to the Chinese version of the Ethereum network.

NEO Price Analysis

At the time of writing, NEO is ranked the 34th cryptocurrency globally and the current price is A$59.86. Let’s take a look at the chart below for price analysis:

Source: TradingView

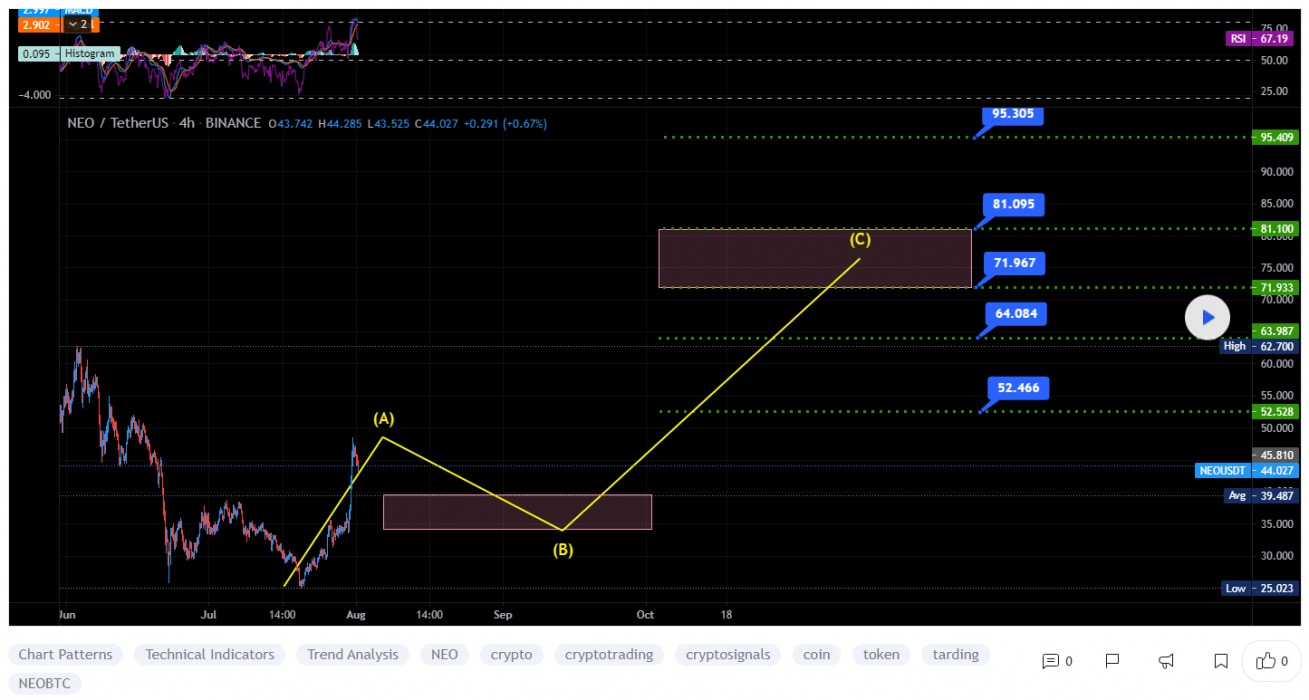
July brought an instant turn in NEO‘s retracement as the price pumped nearly 88% into the resistance near A$62.55. 

A daily gap and down candle between A$53.85 and A$47.26 may support a push through the high at around A$66.31.

Bulls looking for longer-term plays could wait for a retracement to probable support near A$45.22 and potentially down to support at A$42.59.

Extensions based on June’s retracement suggest that A$81.43 and A$84.36 may be the following primary targets. The swing high’s resistance near A$87.55 provides a logical area to take first profits.

2. Polygon (MATIC)

Polygon MATIC is the first well-structured, easy-to-use platform for Ethereum scaling and infrastructure development. Its core component is Polygon SDK, a modular, flexible framework that supports building multiple types of applications. MATIC, the native token of Polygon, is an ERC-20 token running on the Ethereum blockchain. The tokens are used for payment services on Polygon and as a settlement currency between users who operate within the Polygon ecosystem. The transaction fees on Polygon sidechains are also paid in MATIC tokens.

MATIC Price Analysis

At the time of writing, MATIC is ranked the 17th cryptocurrency globally and the current price is A$1.48. Let’s take a look at the chart below for price analysis:

Source: TradingView

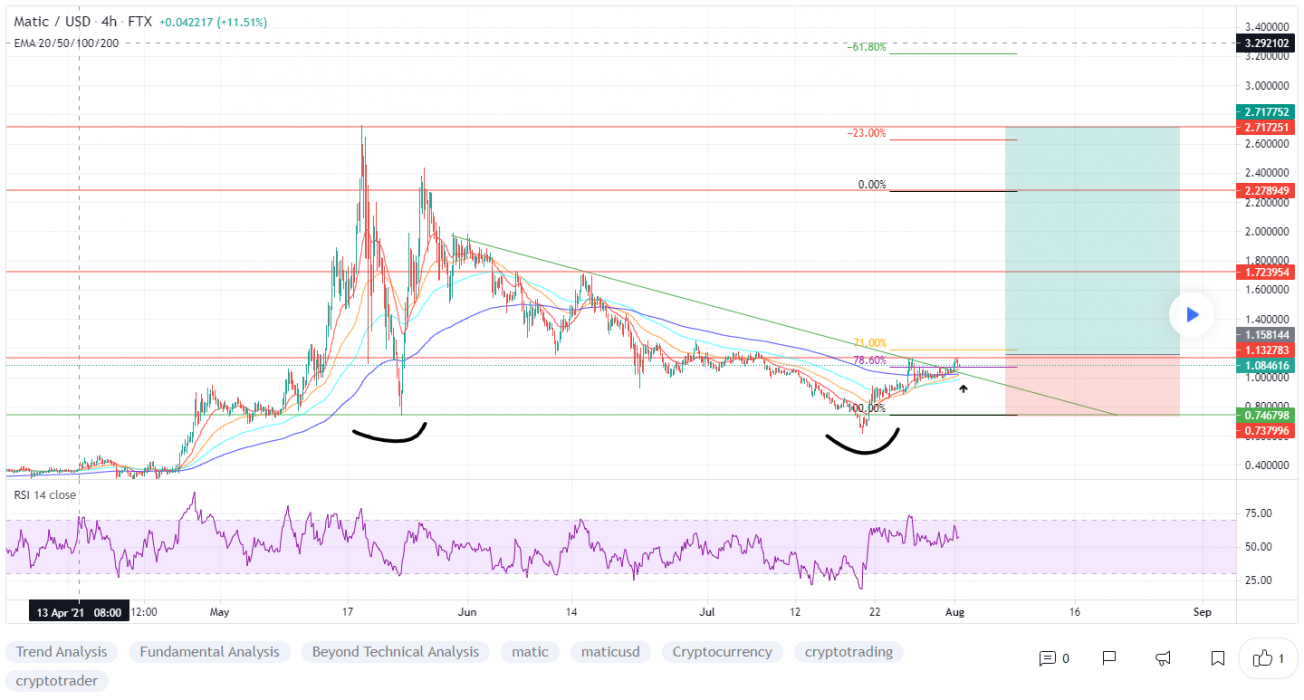
MATIC shot up nearly 74% from mid-July as the price aggressively challenges the last high and resistance near A$1.54.

Bulls waiting to get on board could watch support near A$1.45, just above the series of swing highs near A$1.40. 

A deeper retracement to end the month could reach as low as A$1.36, which would run the swing lows down to A$1.28 and provide a better entry.

Overlapping extensions hint at the areas around A$1.82 and A$1.94 as logical take-profit zones.

3. Internet Computer (ICP)

The Internet Computer ICP is the world’s first blockchain that runs at web speed with unbounded capacity. It also represents the third major blockchain innovation, alongside Bitcoin and Ethereum a blockchain computer that scales smart contract computation and data runs them at web speed, processes and stores data efficiently, and provides powerful software frameworks to developers.

ICP Price Analysis

At the time of writing, ICP is ranked the 21st cryptocurrency globally and the current price is A$58.79. Let’s take a look at the chart below for price analysis:

Source: TradingView

ICP‘s bullish July month-end turned into consolidation, which is likely to break upward if market conditions remain bullish.

Support may be forming around the current area near A$47.26, giving bulls an aggressive entry with a wide stop.

A sweep of July 24’s low near A$45.71 into the support just below would give a much higher risk-reward entry. If the price drops this far, it could reach support near A$42.13.

Overhead, several layers of resistance rest near A$68.55, A$75.24 and A$81.66. Confident bulls could take profits at the swing highs accompanying this resistance. 

More patient bulls waiting for higher risk-reward entries could watch for setups to form in potential retracements from these levels.

Where to Buy or Trade Altcoins?

These coins have high liquidity on Binance Exchange, so that could help with trading on AUD/USDT/BTC pairs. And if you’re looking at buying and HODLing cryptos, then Swyftx Exchange is an easy-to-use popular choice in Australia. However, you can also buy these coins from different exchanges listed on Coinmarketcap.

Categories
Ardor Binance Crypto News Market Analysis Swyftx Trading

Ardor ARDR Surged +96% in a Single Day Amid BridgeChamp Released Updated Project Roadmap

Ardor ARDR is trading in an uptrend, like many other Altcoins. The cryptocurrency ARDR just went up +96% in a single day by breaking a rising wedge pattern with strong buying volume on multiple exchanges and surges over +122% in a week.

What is ARDR?

Ardor ARDR is a multichain blockchain platform with a parent-child chain architecture. The security of the whole network is provided by the parent Ardor chain while the interoperable child chains have all the functionality. The team believes that this design and access to hybrid user permissioning capabilities are the key to the flexibility necessary for a variety of use cases and opens the door towards the mainstream adoption of blockchain technology.

ARDR Price Analysis

At the time of writing, ARDR is ranked 125th cryptocurrency globally and the current price is A$0.4323. This represents a +122% increase since July 25, 2021 (seven days ago), as shown in the chart below.

Source: TradingView

After looking at the above 4-Hour candle chart, we can clearly see that ARDR was trading inside the rising wedge pattern on the ARDR/USD pair. The first resistance was on the A$0.2835 price levels which ARDR broke with a strong bullish trend buying volume and is now heading towards the previous monthly high price at A$0.5784. Seeing that many Altcoins are holding a strong position this week after the recent bitcoin price recovery, ARDR may continue to increase in the uptrend if traders keep buying with high volume.

“The Rising Wedge is a bearish pattern that begins wide at the bottom and contracts as prices move higher and the trading range narrows. As a reversal pattern, the rising wedge will slope up and with the prevailing trend.”

What Do the Technical Indicators Say?

TradingView indicators (on the one-day window) mainly suggest ARDR as a Strong Buy, except the Oscillators which indicate ARDR as a Buy.

So Why Did ARDR Breakout?

General market sentiment seems to suggest cryptos are hopefully turning back bull run season after recent massive price corrections. Another reason for this sudden pump in price could be whales secretly buying ARDR for the next Altcoins rally. Recent news was also announced regarding Ardor’s BridgeChamp Releases Updated Project Roadmap.

Where to Buy or Trade ARDR?

ARDR has high liquidity on the Binance exchange, which could help for trading ARDR/BTC or ARDR/USDT pairs. Instead, if you’re looking at buying and HODLing cryptos, then Swyftx Exchange is a popular choice in Australia. However, you can also buy this coin from different exchanges listed on Coinmarketcap.

Categories
Binance Crypto News Market Analysis Power Ledger Swyftx Trading

Power Ledger POWR Surged +90% in a Single Day Amid Blockchain Migration from Ethereum to Solana

Power Ledger POWR is trading in an uptrend, like many other Altcoins. The cryptocurrency POWR just went up +90% in a single day by breaking a falling wedge pattern with strong buying volume on multiple exchanges and surges over +265% in a week.

What is POWR?

Power Ledger POWR is a blockchain-based platform released in May 2016 with the goal of disrupting the global energy industry by enabling local areas to sell and distribute solar power to their neighbors without the help of middlemen. It is a technology company that uses blockchain to facilitate energy and environmental commodity trading. It is based in Australia and encourages dependable and affordable electricity. Power Ledger runs on the Ethereum network as a peer-to-peer energy exchange platform.

POWR Price Analysis

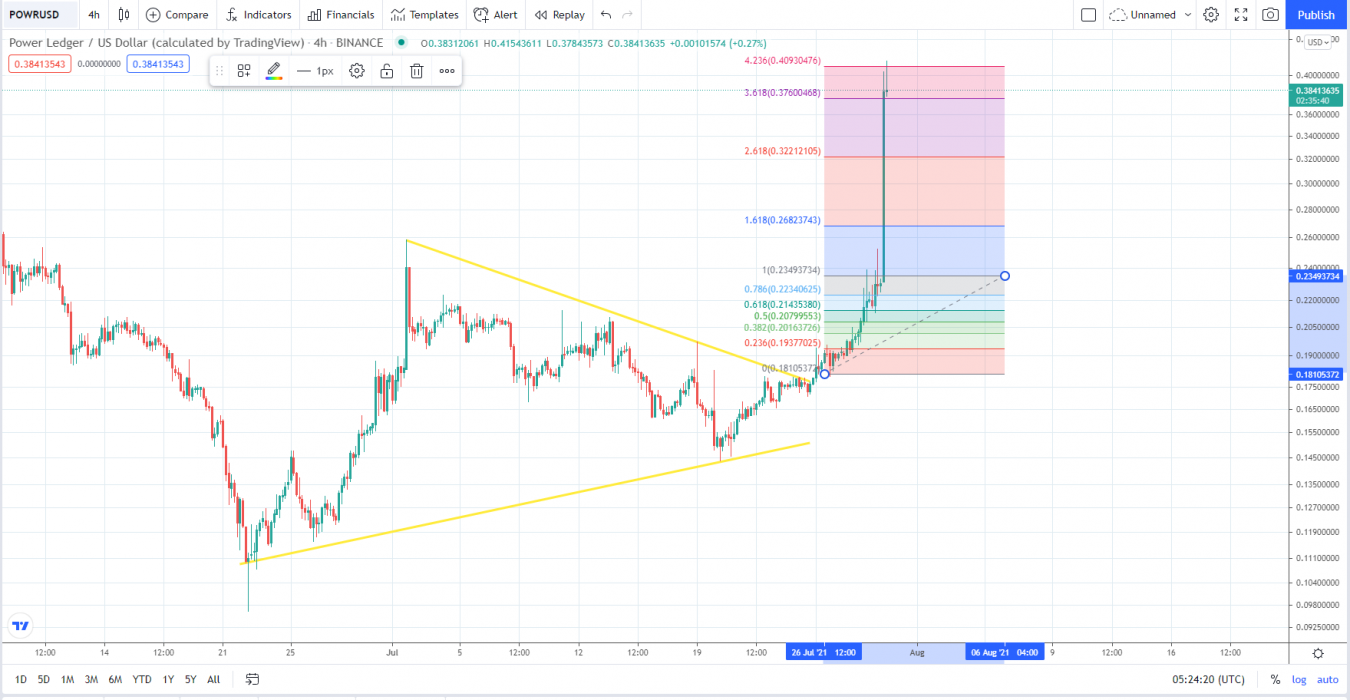
At the time of writing, POWR is ranked 174th cryptocurrency globally and the current price is A$0.5445. This represents a +265% increase since July 24, 2021 (seven days ago), as shown in the chart below.

Source: TradingView

After looking at the above 4-Hour candle chart, we can clearly see that POWR was trading inside the falling wedge pattern on the POWR/USD pair. The first resistance was on the A$0.3248 price levels which POWR broke with a strong bullish trend buying volume and is now heading towards the previous monthly high price at A$0.7285. Seeing that many Altcoins are holding a strong position this week after the recent bitcoin price recovery, POWR may continue to increase in the uptrend if traders keep buying with high volume.

“The Falling Wedge is a bullish pattern that begins wide at the top and contracts as prices move lower. This price action forms a cone that slopes down as the reaction highs and reaction lows converge.”

What Do the Technical Indicators Say?

TradingView indicators (on the one-day window) mainly suggest POWR as a Strong Buy, except the Oscillators which indicate POWR as a Buy.

So Why Did POWR Breakout?

General market sentiment seems to suggest cryptos are hopefully turning back bull run season after recent massive price corrections. Another reason for this sudden pump in price could be whales secretly buying POWR for the next Altcoins rally. Recent news was also announced regarding Power Ledger’s energy blockchain migration from Ethereum to a permissioned Solana blockchain.

Where to Buy or Trade POWR?

POWR has high liquidity on the Binance exchange, which could help for trading POWR/BTC or POWR/ETH pairs. Instead, if you’re looking at buying and HODLing cryptos, then Swyftx Exchange is a popular choice in Australia. However, you can also buy these coins from different exchanges listed on Coinmarketcap.

Categories
Binance Crypto News Market Analysis Swyftx Trading

Top 3 Coins To Watch Today: DOT, ZEN, CRV July 30 Trading Analysis

Let’s take a closer look at today’s altcoins showing breakout signals. We’ll explain what the coin is, then dive into the trading charts and provide some analysis to help you decide.

1. Polkadot (DOT)

Polkadot’s native DOT token serves three clear purposes: providing network governance and operations, and creating parachains by bonding. Polkadot is an open-source sharding multichain protocol that facilitates the cross-chain transfer of any data or asset types, not just tokens, thereby making a wide range of blockchains interoperable with each other. This interoperability seeks to establish a fully decentralized and private web, controlled by its users, and simplify the creation of new applications, institutions, and services.

DOT Price Analysis

At the time of writing, DOT is ranked the 9th cryptocurrency globally and the current price is A$20.38. Let’s take a look at the chart below for price analysis:

Source: TradingView

DOT exploded upwards from its long-term accumulation range during Q1 as it swept 2021’s high. The recent 40% drop found support near A$13.24 before opening last week near A$12.58

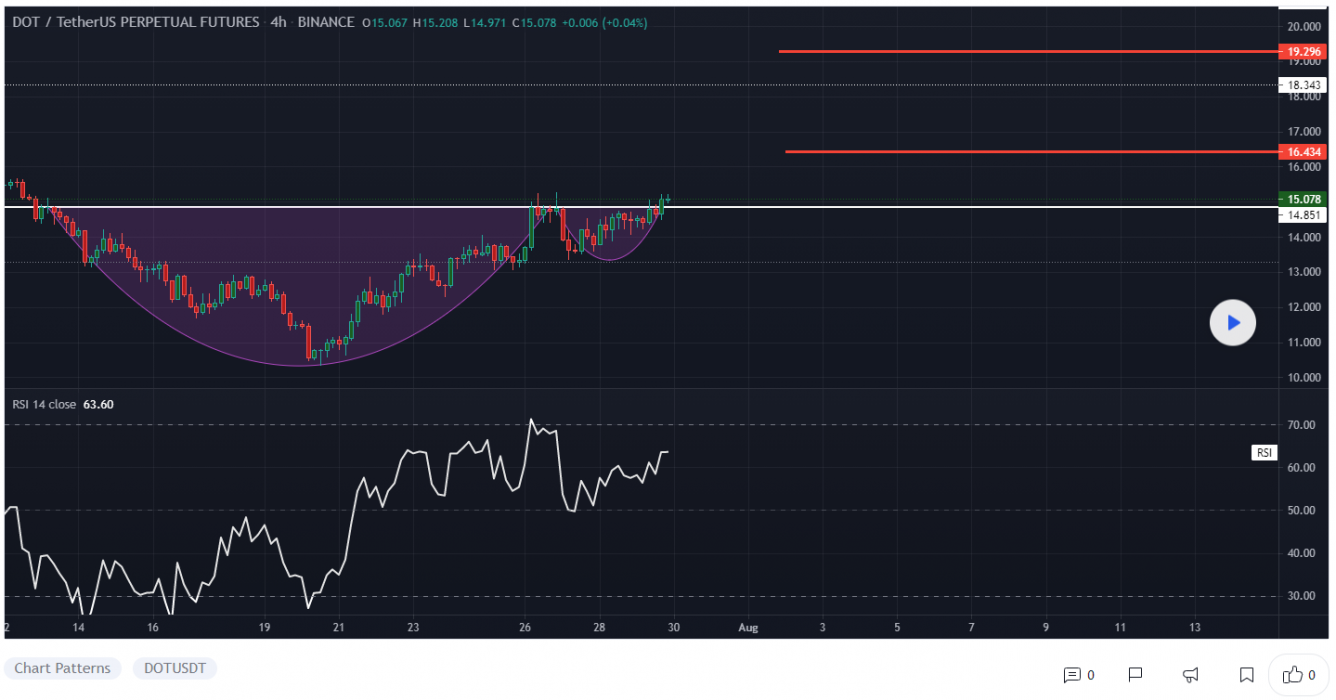
Support formed over the weekly open near A$13.15 This week is likely to test new support around A$16.34. However, the relatively equal lows below provide an attractive downwards draw for the price. If this test of possible support near A$15.47 and A$14.89 occurs, it could give longer-term bulls a better opportunity for entry.

Multiple resistances rest overhead, with the level at A$20.95 currently pinning the price down. A reclaim of this level will have to contend with resistance at A$23.17 and A$25.52.

However, a decisive break of this level likely means that the recent high at A$30.69 is a target. A more extended move may reach resistance and an old high near A$35.77, which has confluence with the 1.0 extension.

2. Curve DAO Token (CRV)

Curve CRV is a decentralized exchange for stablecoins that uses an automated market maker (AMM) to manage liquidity. Curve is now synonymous with the decentralized finance (DeFi) phenomenon and has seen significant growth in 2021.

CRV Price Analysis

At the time of writing, CRV is ranked the 97th cryptocurrency globally and the current price is A$2.16 Let’s take a look at the chart below for price analysis:

Source: TradingView

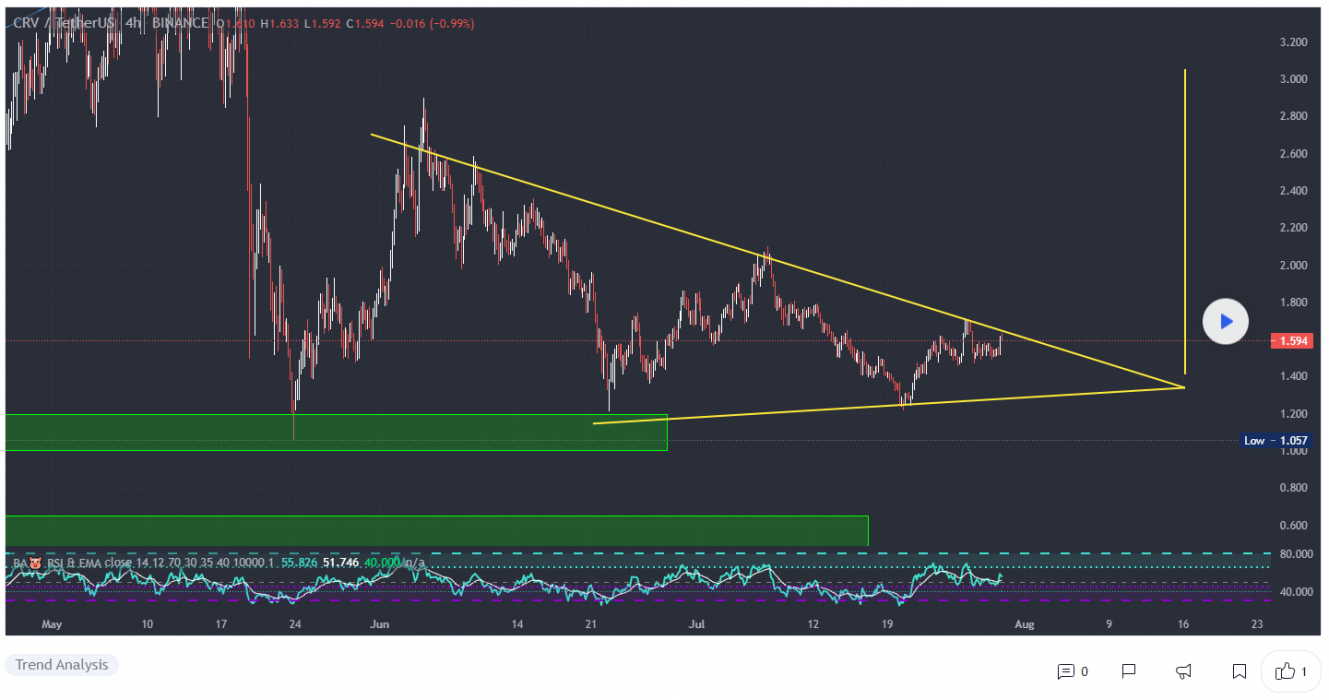
During the last week of June CRV provided nearly 105% gains before the price ran into resistance near A$2.95 Currently, the price is accumulating under the July last week open near A$2.23, just over relatively equal daily lows around A$2.13. 

A sweep of these lows into probable support beginning at A$1.88 may provide traders with at least a short-term bounce to capitalize on. If this zone breaks, support could be found at A$1.72, although a move this far down may sweep the next set of the relatively equal lows near A$1.59 and fill the daily gap down to A$1.50.

A break of resistance beginning near A$2.35 could run highs near A$2.54 into resistance at A$2.83 which marks the beginning of the upper half of the June 12th daily gap. A more sustained upward move could target the last major swing high at A$2.96 with resistance beginning at A$3.22.

3. Horizen (ZEN)

Horizen ZEN is an interoperable blockchain system, supported by a decentralized node infrastructure. Its sidechain platform focuses on scalable data privacy, and as such enables businesses as well as developers to build private or public blockchains using the unique sidechain technology known as Zendoo. Horizen claims to be completely decentralized, fully customizable with privacy features and supports low costs associated with building blockchains with configurable revenue models and an unlimited number of tokens and digital assets.

ZEN Price Analysis

At the time of writing, ZEN is ranked the 95th cryptocurrency globally and the current price is A$74.65. Let’s take a look at the chart below for price analysis:

Source: TradingView

ZEN saw an energetic run from April to May, climbing approximately 160% before cooling off into support near A$65.36 Resistance beginning near A$62.85 pinned down last week’s attempt to rally, which is likely to retest possible support near A$60.14.

A deeper marketwide retracement could take out the relatively equal lows below the weekly open and support near A$58.69. This move might offer entries near probable support near A$56.47 and A$54.78.

However, more bullish market conditions may prompt a rally to the relatively equal highs near A$83.67 into resistance beginning at A$85.46. If the price reaches this level, the last high at A$93.58 gives the next likely target before price discovery begins.

Where to Buy or Trade Altcoins?

These coins have high liquidity on Binance Exchange, so that could help with trading on AUD/USDT/BTC pairs. And if you’re looking at buying and HODLing cryptos, then Swyftx Exchange is an easy-to-use popular choice in Australia. However, you can also buy these coins from different exchanges listed on Coinmarketcap.
Categories
Binance Crypto News Market Analysis Swyftx Trading

Hive Surged +65% in a Single Day Amid CryptoPlug On The Block Event

Hive is trading in an uptrend, like many other Altcoins. The cryptocurrency HIVE just went up +65% in a single day by breaking a falling wedge pattern with strong buying volume on multiple exchanges and surges over +92% in a week.

What is HIVE?

Hive is a decentralised information sharing network with an accompanying blockchain-based financial ledger built on the Delegated Proof of Stake (DPoS) protocol. Hive supports many different types of information sharing applications. Myriad dapps, APIs and front-ends contribute to a general and straightforward accessibility of data, transactions and records, so that this existing diversity and utility ensure that the ecosystem is welcoming to content creators, consumers, investors and builders.

HIVE Price Analysis

At the time of writing, HIVE is ranked 154th cryptocurrency globally and the current price is A$0.6775. This represents a +92% increase since July 23, 2021 (seven days ago), as shown in the chart below.

Source: TradingView

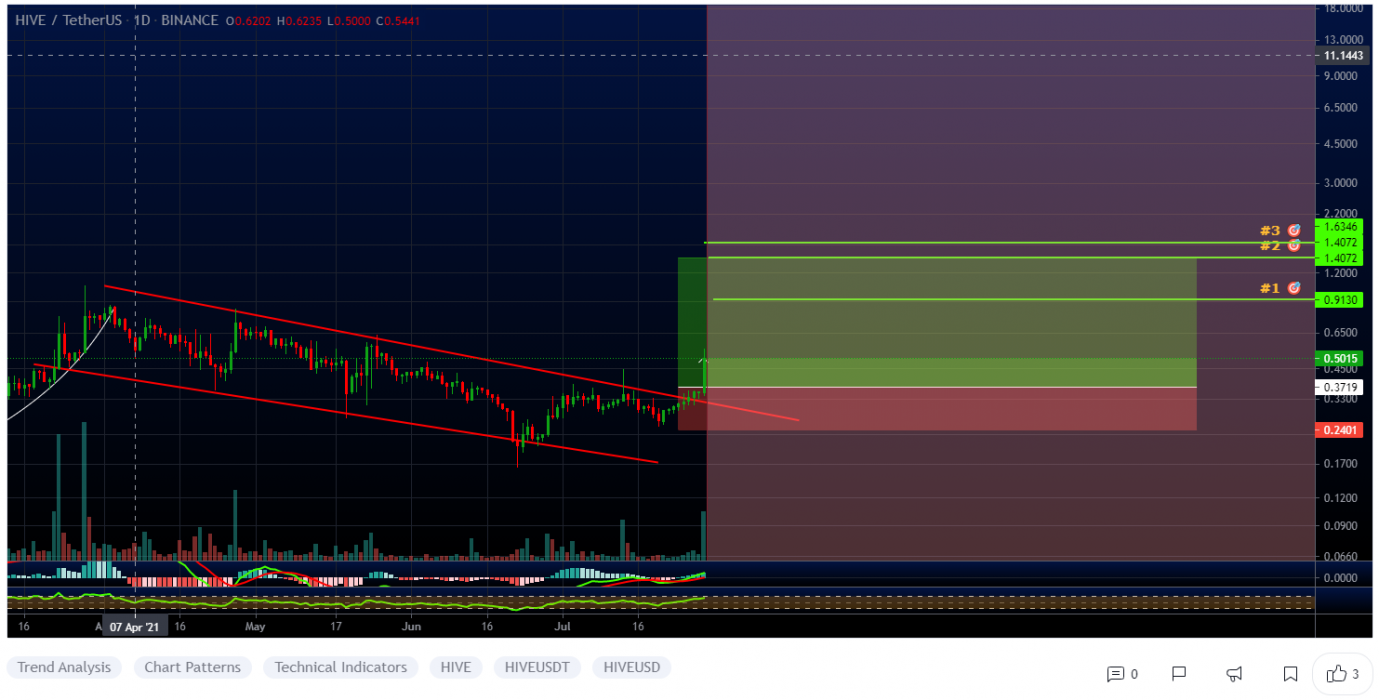
After looking at the above 1-Day candle chart, we can clearly see that HIVE was trading inside the falling wedge pattern on the HIVE/USDT pair. The first resistance was on the A$0.4755 price levels which HIVE broke with a strong bullish trend buying volume and is now heading towards the previous monthly high price at A$0.7428. Seeing that many Altcoins are holding a strong position this week after the recent bitcoin price recovery, HIVE may continue to increase in the uptrend if traders keep buying with high volume.

The chart seems to be in an cup and handle pattern, and the crypto market looks to be gearing up for something big again. First target is based on a fib, second is the cut and handle pattern, and the third is the golden fib.

“The Falling Wedge is a bullish pattern that begins wide at the top and contracts as prices move lower. This price action forms a cone that slopes down as the reaction highs and reaction lows converge.”

What Do the Technical Indicators Say?

TradingView indicators (on the one-day window) mainly suggest HIVE as a Strong Buy, except the Oscillators which indicate HIVE as a Neutral.

So Why Did HIVE Breakout?

General market sentiment seems to suggest cryptos are hopefully turning back bull run season after recent massive price corrections. Another reason for this sudden pump in price could be whales secretly buying HIVE for the next Altcoins rally. Recent news was also announced regarding CryptoPlug on the Block Event.

Where to Buy or Trade HIVE?

Hive has high liquidity on the Binance exchange, which could help for trading HIVE/BTC or HIVE/USDT pairs. Instead, if you’re looking at buying and HODLing cryptos, then Swyftx Exchange is a popular choice in Australia. However, you can also buy these coins from different exchanges listed on Coinmarketcap.