Categories
Crypto News Market Analysis NEO Trading

Top 3 Coins To Watch Today: NEO, FIL, AVAX – September 27 Trading Analysis

Let’s take a closer look at today’s altcoins showing breakout signals. We’ll explain what the coin is, then dive into the trading charts and provide some analysis to help you decide.

1. Neo (NEO)

NEO bills itself as a “rapidly growing and developing” ecosystem that has the goal of becoming the foundation for the next generation of the internet – a new economy where digitised payments, identities and assets come together. As well as creating a worldwide community of developers who create new infrastructure for the network and lower barriers to entry, the team behind this project operates an EcoBoost initiative that’s designed to encourage people to build decentralised apps and smart contracts on its blockchain.

NEO Price Analysis

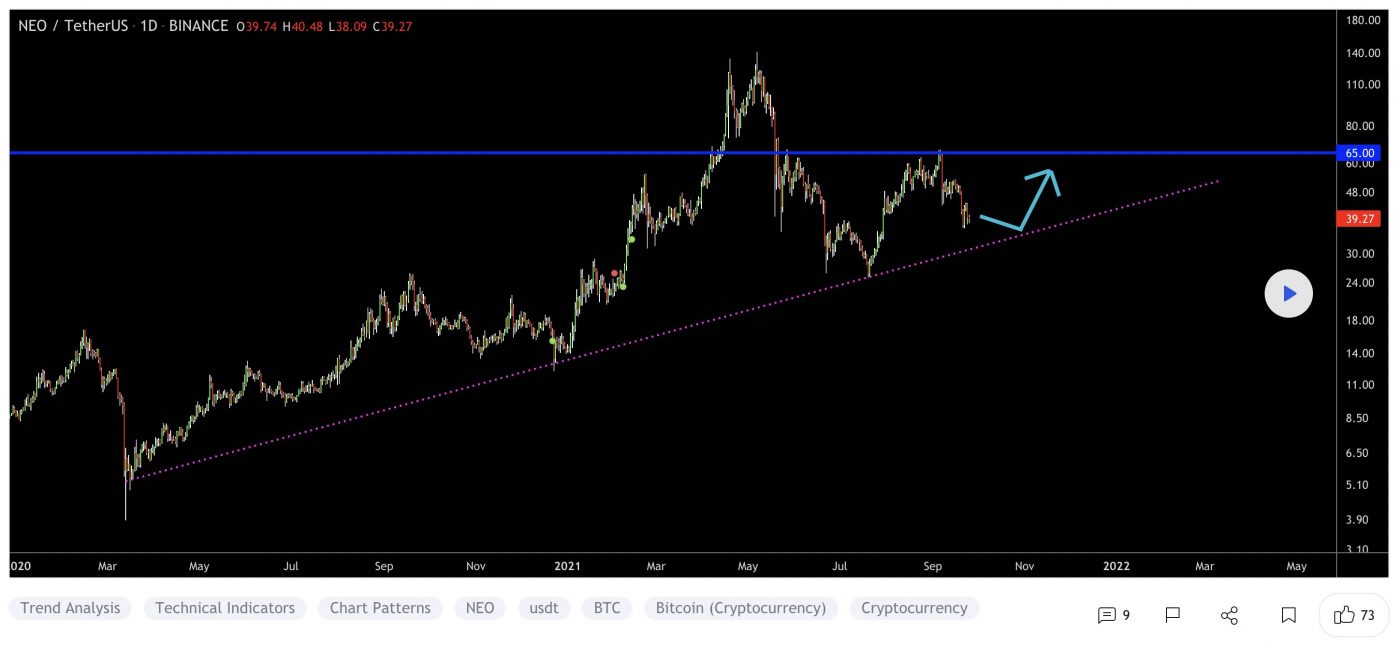
At the time of writing, NEO is ranked the 49th cryptocurrency globally and the current price is A$53.40. Let’s take a look at the chart below for price analysis:
Source: TradingView

After creating a second equal low in mid-July, NEO has rallied nearly 115% into resistance that starts near A$90.25.

Aggressive bulls looking for a continuation to the nearest cluster of relatively equal highs around A$57.33 might look for bids near A$50.86. More significant resistance rests above near A$66.15. A group of significant swing highs at A$70.19, A$74.55 and A$79.46 give possible targets if this resistance breaks.

A stop run on the recent low at A$48.00 into possible support beginning near A$45.13 might see stronger bidding. This area also has a confluence with the August monthly open.

A bearish market shift could reach the swing low at A$40.68 into possible support beginning near A$37.24.

2. Filecoin (FIL)

Filecoin FIL is a decentralised storage system that aims to “store humanity’s most important information”. The project was first described back in 2014 as an incentive layer for the Interplanetary File System (IPFS), a peer-to-peer storage network. Filecoin is an open protocol and backed by a blockchain that records commitments made by the network’s participants, with transactions made using FIL, the blockchain’s native currency. The blockchain is based on both proof-of-replication and proof-of-spacetime.

FIL Price Analysis

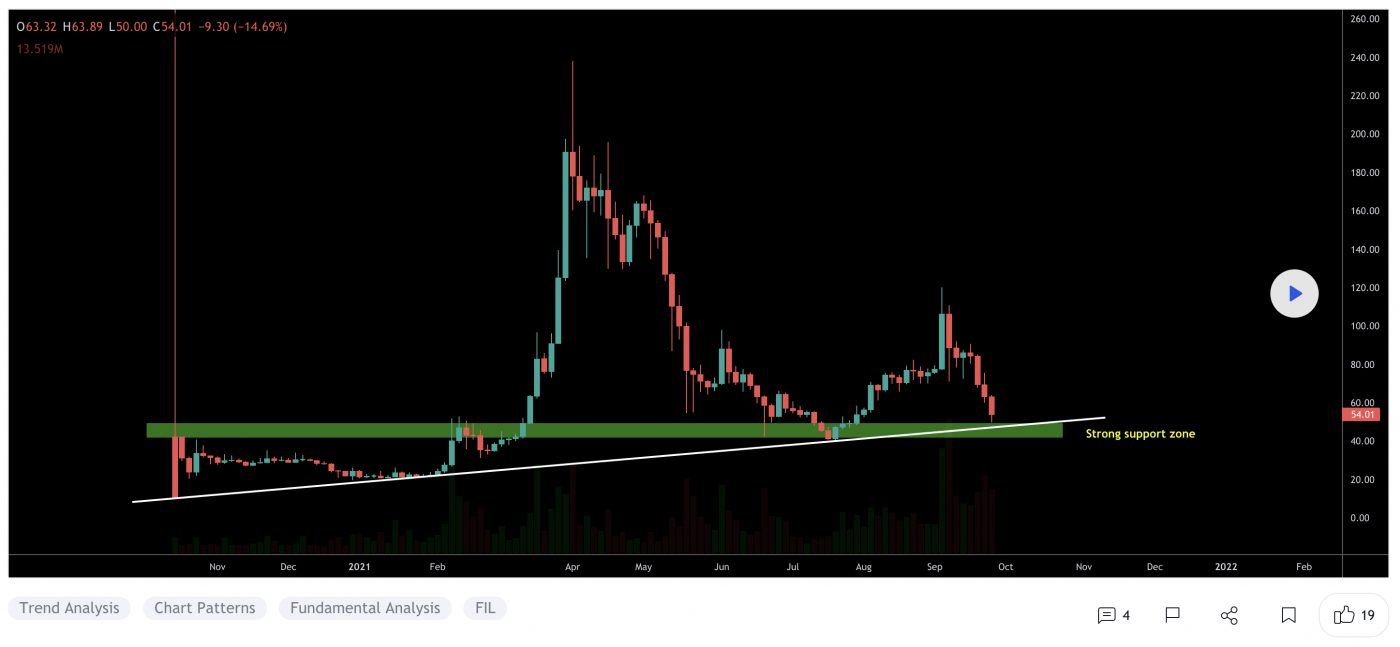
At the time of writing, FIL is ranked the 27th cryptocurrency globally and the current price is A$78.34. Let’s take a look at the chart below for price analysis:
Source: TradingView

After rallying over 150% from its July low, FIL is encountering resistance near A$152.88.

This resistance and the September monthly mid at A$118.35 currently have the price trapped. The swing high and resistance near A$107.22 provide a likely target before any major bearish market shift, with continuation through this resistance possibly reaching for short stops and resistance near A$134.67.

The daily gap at A$72.38 could provide support, while the area beginning near A$69.86 could see more substantial interest from the bulls. A longer-term bearish shift in the marketplace will likely reach the relatively equal lows near A$65.29, possibly finding a floor at support beginning near A$60.93.

3. Avalanche (AVAX)

Avalanche AVAX is the fastest smart contracts platform in the blockchain industry, as measured by time-to-finality, and has the most validators securing its activity of any proof-of-stake protocol. Avalanche is blazingly fast, low-cost, and green. Any smart contract-enabled application can outperform its competition on Avalanche. AVAX is the native token of Avalanche. It is a hard-capped, scarce asset that is used to pay for fees, secure the platform through staking, and provide a basic unit of account between the multiple subnets created on Avalanche.

AVAX Price Analysis

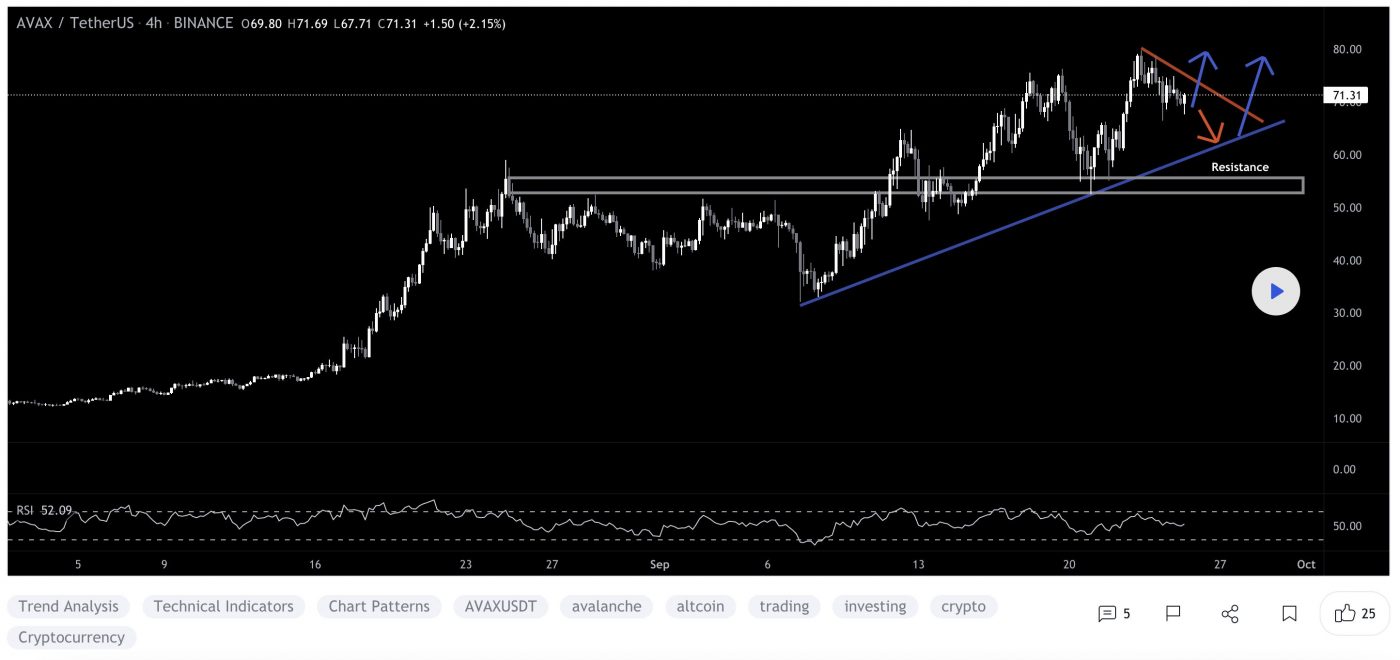
At the time of writing, AVAX is ranked the 11th cryptocurrency globally and the current price is A$96.98. Let’s take a look at the chart below for price analysis:
Source: TradingView

AVAX continued its rally through the daily gap between A$99.45 and A$97.25, turning this region into an area of possible support. 

However, a stop run under the relatively equal lows at A$94.34 could form a wick below this level, potentially reaching an untapped daily gap beginning near A$87.14.

Resistance starting at $104.50 has seen significant profit-taking, shown by the long upper wicks on the daily candles. A break of this resistance may reach the next significant swing high at A$110.89, continue into probable resistance just above, and possibly set new all-time highs at A$122.56.

Where to Buy or Trade Altcoins?

These coins have high liquidity on Binance Exchange, so that could help with trading on AUD/USDT/BTC pairs. And if you’re looking at buying and HODLing cryptos, then Swyftx Exchange is an easy-to-use popular choice in Australia.

Categories
Crypto News Market Analysis Trading

Top 3 Coins To Watch Today: KAVA, 1INCH, LUNA – September 24 Trading Analysis

Let’s take a closer look at today’s altcoins showing breakout signals. We’ll explain what the coin is, then dive into the trading charts and provide some analysis to help you decide.

1. Kava.io (KAVA)

Kava.io KAVA is a cross-chain DeFi lending platform that allows users to borrow USDX stablecoins and deposit a variety of cryptocurrencies to begin earning a yield. The Kava DeFi hub operates as a decentralised bank for digital assets, allowing users to access a range of decentralised financial services, including its native USD-pegged stablecoin USDX, as well as synthetics and derivatives. Through Kava, users are able to borrow USDX tokens by depositing collateral, effectively leveraging their exposure to crypto assets.

KAVA Price Analysis

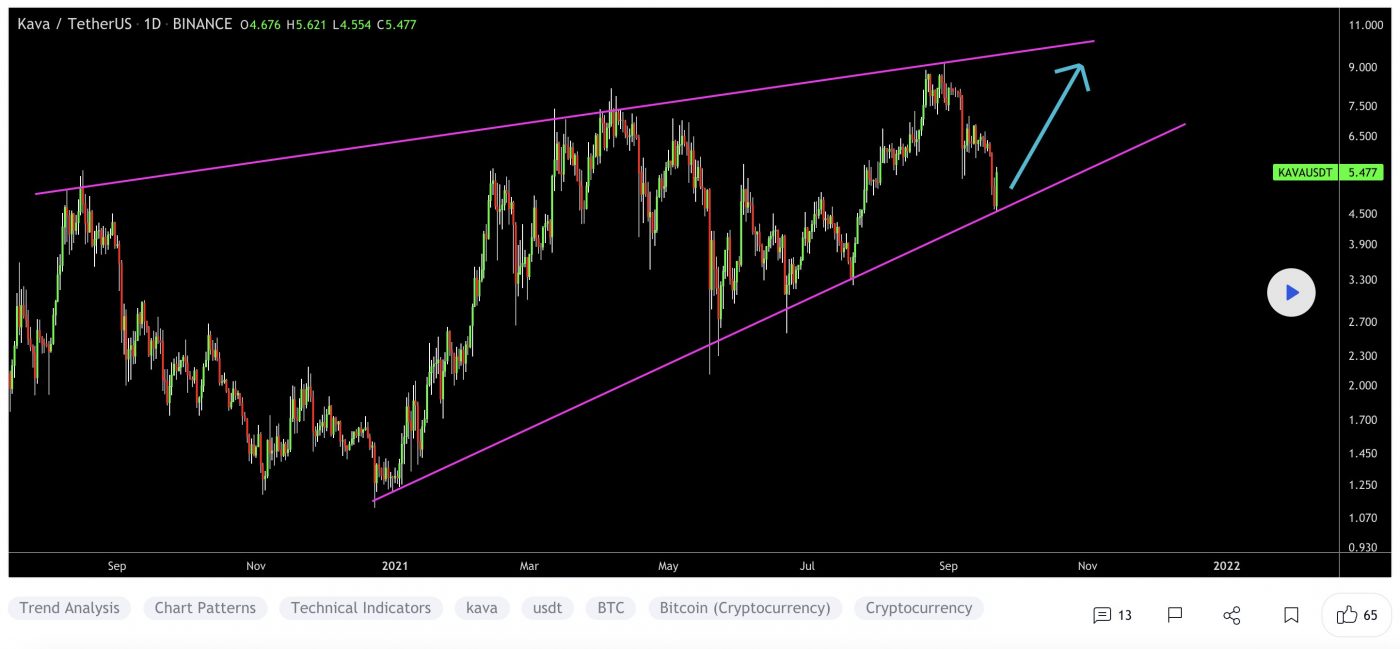
At the time of writing, KAVA is ranked the 124th cryptocurrency globally and the current price is A$7.64. Let’s take a look at the chart below for price analysis:

Source: TradingView

During August, KAVA broke several swing highs that could be the signal for a new bullish trend.

Last week’s break of the most recent swing low could suggest some downside in the short term. It formed probable resistance near A$7.33 and may target the swing low and possible support near A$7.05.

The swing low and possible support near A$6.89 could be the second bearish target if the move down continues. The relatively equal lows near A$6.22 and possible support underneath near A$6.45 could provide more substantial support.

The last swing high near A$7.93 gives a near-term target if bullish continuation continues. However, resistance beginning around A$8.26 could cap this move. A break of this resistance might continue to probable resistance near A$8.65 and reach above the cluster of relatively equal highs near A$9.34.

2. 1inch (1INCH)

1INCH is a decentralised exchange (DEX) aggregator, connecting several DEXes into one platform to allow its users to find the most efficient swapping routes across all platforms. In order for users to find the best price for a swap, they need to look at every exchange – DEX aggregators eliminate the need for manually checking, bringing efficiency to swapping on DEXes. 1inch has launched its 1INCH governance token, and the 1inch Network began to be governed by a decentralised autonomous organisation (DAO).

1INCH Price Analysis

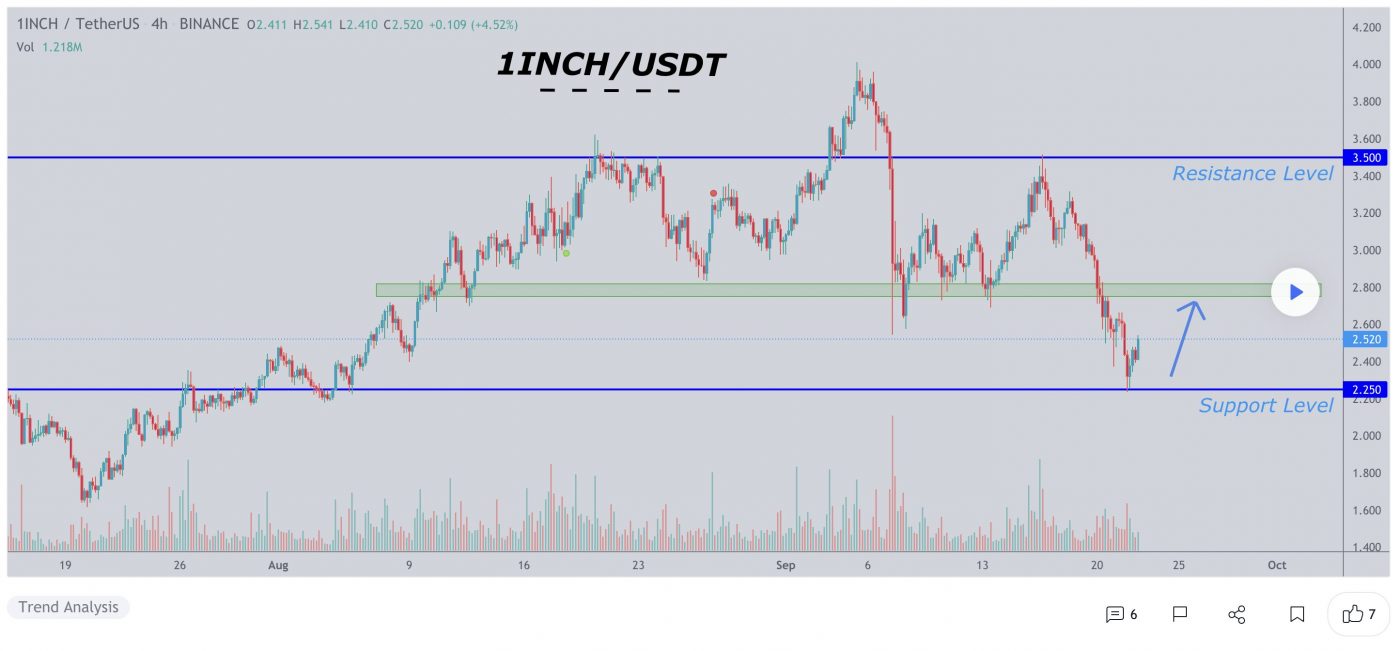
At the time of writing, 1INCH is ranked the 124th cryptocurrency globally and the current price is A$3.72. Let’s take a look at the chart below for price analysis:

Source: TradingView

May marked a turning point for 1INCH, with the price rocketing up almost 175% from its lows to probable resistance beginning near A$5.13.

The price is currently struggling with the area between A$4.25 and A$3.47. This region could provide support after a close above – or resistance after a close below. 

A retracement could reach into the daily gap and possible support around A$3.41. A more bearish shift in the marketplace will likely aim for the relatively equal lows near A$3.25, and the potential support just below that begins around A$3.08.

Continuation to the upside will likely target the monthly high near A$3.90. However, probable resistance beginning at A$4.32 and A$4.77 could cap or slow down this move.

3. Terra (LUNA)

Terra LUNA is a blockchain protocol that uses fiat-pegged stablecoins to power price-stable global payments systems. According to its white paper, Terra combines the price stability and wide adoption of fiat currencies with the censorship-resistance of Bitcoin and offers fast and affordable settlements. Terra’s native token, LUNA, is used to stabilise the price of the protocol’s stablecoins. LUNA holders are also able to submit and vote on governance proposals, giving it the functionality of a governance token.

LUNA Price Analysis

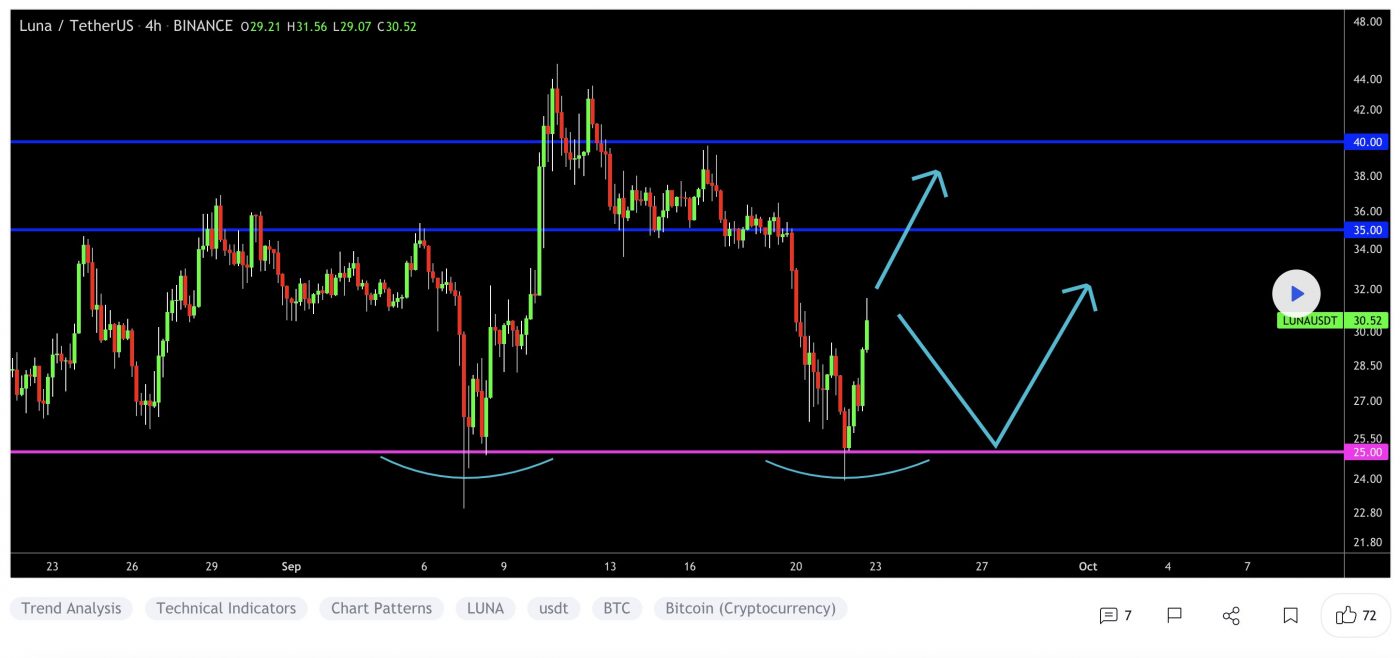
At the time of writing, LUNA is ranked the 12th cryptocurrency globally and the current price is A$48.56. Let’s take a look at the chart below for price analysis:

Source: TradingView

In July, LUNA also turned the corner, breaking a key swing high in mid-August. This move could suggest a longer-term bullish trend.

The swing high near A$53.02 stands out as a bullish target and marks an area of probable resistance. Further continuation could reach into possible resistance starting near A$59.68.

Even if the bullish trend continues, a stop run at the recent swing low near A$46.12 into possible support beginning near A$42.32 is reasonable. If the price reaches further down, the swing low and possible support near A$39.60 might provide another downside target. 

The area near A$38.24 could also provide support. However, a drop this far could suggest a stop run below the higher-timeframe relatively equal lows near A$36.48 into possible support beginning around A$34.57.

Where to Buy or Trade Altcoins?

These coins have high liquidity on Binance Exchange, so that could help with trading on AUD/USDT/BTC pairs. And if you’re looking at buying and HODLing cryptos, then Swyftx Exchange is an easy-to-use popular choice in Australia.

Categories
Bitcoin Cardano Crypto News Ethereum Markets Ripple Solana Trading

$2.5 Billion Longs Liquidated As Crypto Market Sees Sudden Drop

Over the past two days, more than US$2.5 billion longs have been liquidated as the crypto market sees yet another drop.

Traders woke up to a rough Monday as the crypto market saw up to double-digit percentage losses across the board. The sudden drop saw Solana, Cardano and Ripple (XRP) drop millions from their market caps, and Bitcoin (BTC) and Ethereum (ETH) plunge 10.4 and 14.7 percent respectively over the past seven days, according to data from CoinGecko.

What are Liquidations?

Liquidations occur when traders borrow excess capital from exchanges or brokerages to place bigger bets on the assets they trade, known as margin trading or trading futures.

Traders pay a fixed fee for borrowing while exchanges close out these positions at a predetermined price. If a trader’s collateral is equal to the loss on that position, a trade then becomes ‘liquidated’.

Of all the traders liquidated in the past few days, a shocking 91 percent of them were in the ‘long’ market. Being in the long market means traders had put on positions betting on higher asset prices.

According to data from Bybt, 136,690 traders were liquidated in the past 24 hours, while the total value of liquidations during that period reached over US$635 million.

Total liquidations observed. Source: Bybt

Investors REKT

Liquidations of US$236 million BTC and US$216 million ETH were recorded, while large-cap altcoins such as Solana (SOL) and XRP saw liquidations worth US$26 million and US$17 million respectively in that 24-hour period.

The largest single liquidation order took place on Bitfinex-ETH, to the value of US$14.52 million.

The dip has investors confused and fuming as the market drop comes only days after BTC had reached a “Golden Cross”. One Reddit user aptly described his dismay at the situation:

The golden cross is a chart pattern that is generally seen as an indicator of bullish price action to come, but this is not always the case. Given the market is more mature, diminishing returns ought to be expected.

Investors should approach with caution, and not rely on a single indicator to guide them. Many factors influence the price, none of which is predictable.

Just a ‘Bit’ Too Soon

September is proving itself to be a worthy opponent to those finding their way in the crypto market.

Investors are still reeling from the previous round of liquidations on September 7, in which over US$3.7 billion worth of cryptos were liquidated after BTC and other major altcoins tanked.

During that period, a total of 375,824 traders were forced out of the market after becoming overleveraged as sudden crypto price drops were experienced.

Categories
Crypto News Market Analysis Trading

Top 3 Coins To Watch Today: TLM, EGLD, HBAR – September 23 Trading Analysis

Let’s take a closer look at today’s altcoins showing breakout signals. We’ll explain what the coin is, then dive into the trading charts and provide some analysis to help you decide.

1. Alien Worlds (TLM)

Alien Worlds TLM is a decentralised, non-fungible token (NFT) metaverse where players compete for scarce resources, Trilium (TLM), in a simulated economy based around planetary worlds. Due to this, Alien Worlds also has a decentralised finance (DeFi) element to the game, as players advance by staking TLM and using TLM to vote in Planet Decentralised Autonomous Organisations (DAOs).

TLM Price Analysis

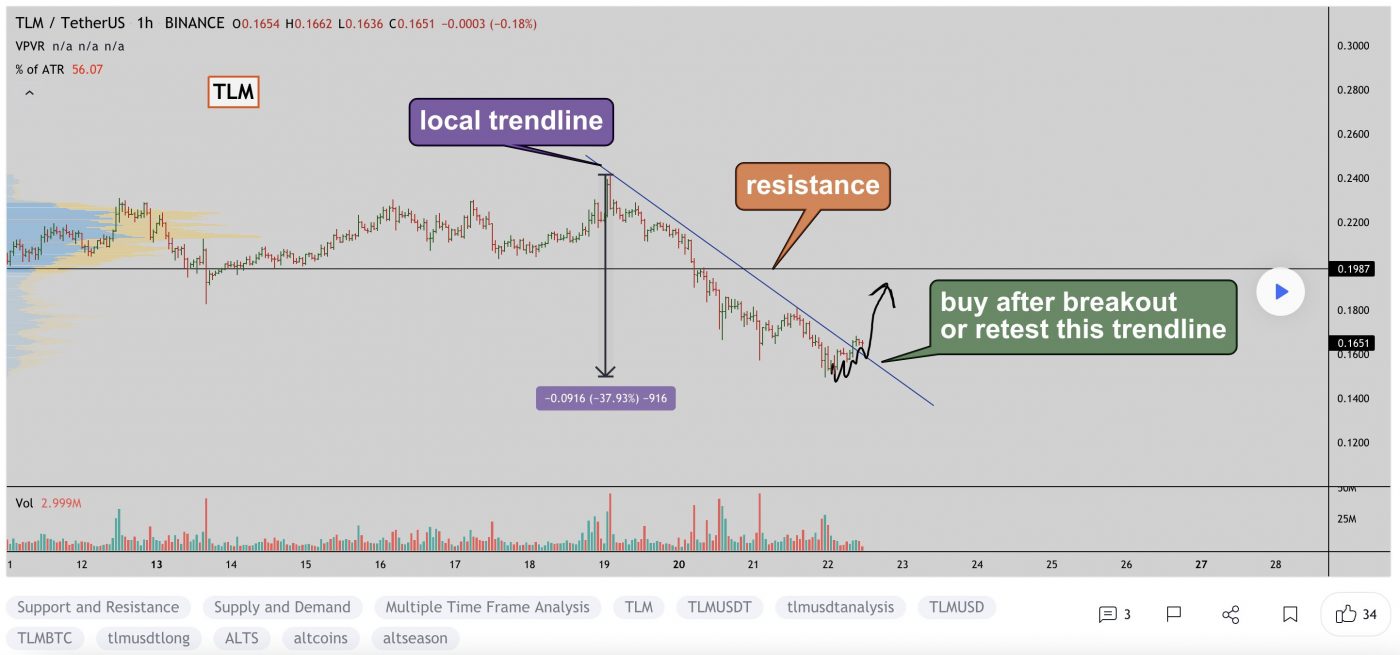
At the time of writing, TLM is ranked the 289th cryptocurrency globally and the current price is A$0.2462. Let’s take a look at the chart below for price analysis:

Source: TradingView

TLM formed relatively equal lows near A$0.1574 after dropping over 71% during July. These lows could provide the target for another leg down, possibly finding support in the monthly gap of around A$0.1285. 

If this sweep of the A$0.2277 swing lows occurs, more aggressive bulls might begin bidding the weekly level near the swing low around A$0.2144. Should the market take a more bullish turn, the level just below near A$0.2033 could provide some short-term support.

The steep drop left large areas of inefficient price action, making the daily gap up to A$0.2736 likely to be touched or filled. A sustained move through this resistance could visit a significant area on the monthly and weekly chart near A$0.2905.

2. Elrond (EGLD)

Elrond EGLD is a blockchain protocol that seeks to offer extremely fast transaction speeds by using sharding. The project describes itself as a technology ecosystem for the new internet, which includes fintech, decentralised finance, and the Internet of Things. Its smart contracts execution platform is reportedly capable of 15,000 transactions per second, six-second latency, and a $0.001 transaction cost. The blockchain has a native token known as eGold, or EGLD, that is used for paying network fees, staking, and rewarding validators.

EGLD Price Analysis

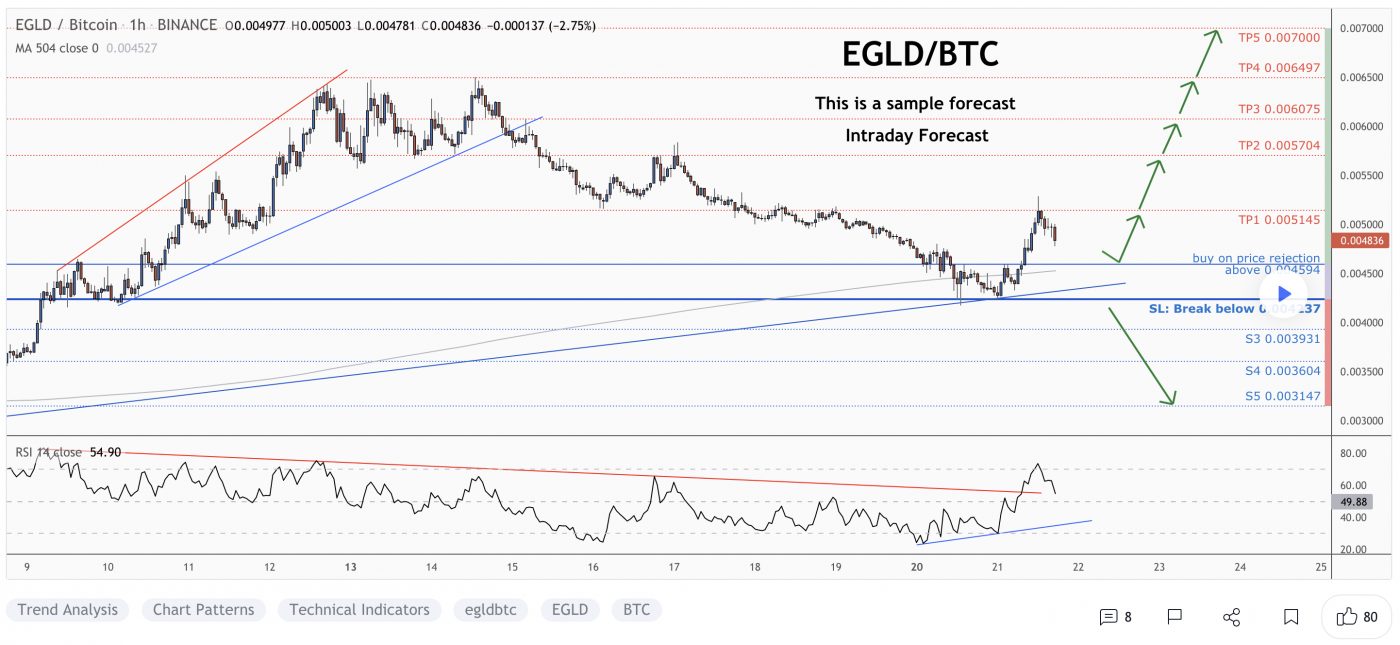
At the time of writing, EGLD is ranked the 34th cryptocurrency globally and the current price is A$300.10. Let’s take a look at the chart below for price analysis:

Source: TradingView

EGLD‘s stunning rally to A$381.45 has plummeted over 35% during September to sweep consolidation lows at A$289.76. This sweep of the lows could set the stage for a new bullish cycle to begin. 

The price is currently balancing around the monthly open. A quick stop run into support beginning near A$285.34 could set the stage for a move into the daily gap beginning near A$273.66 – potentially reaching resistance near A$310.46.

A sweep of the highs near A$317.55, followed by a sharp sell-off, could hint that the Bulls are preparing to run the swing high near A$326.18. This push could find resistance around A$334.89 in the candle wick that created the last week’s high. If the market remains bullish, the price will likely reach resistance near A$345.54.

3. Hedera Hashgraph (HBAR)

Hedera Hashgraph HBAR is a public network that allows individuals and businesses to create powerful decentralised applications (DApps). It is designed to be a fairer, more efficient system that eliminates some of the limitations that older blockchain-based platforms face, such as slow performance and instability. The HBAR token has a dual role within the Hedera public network.

HBAR Price Analysis

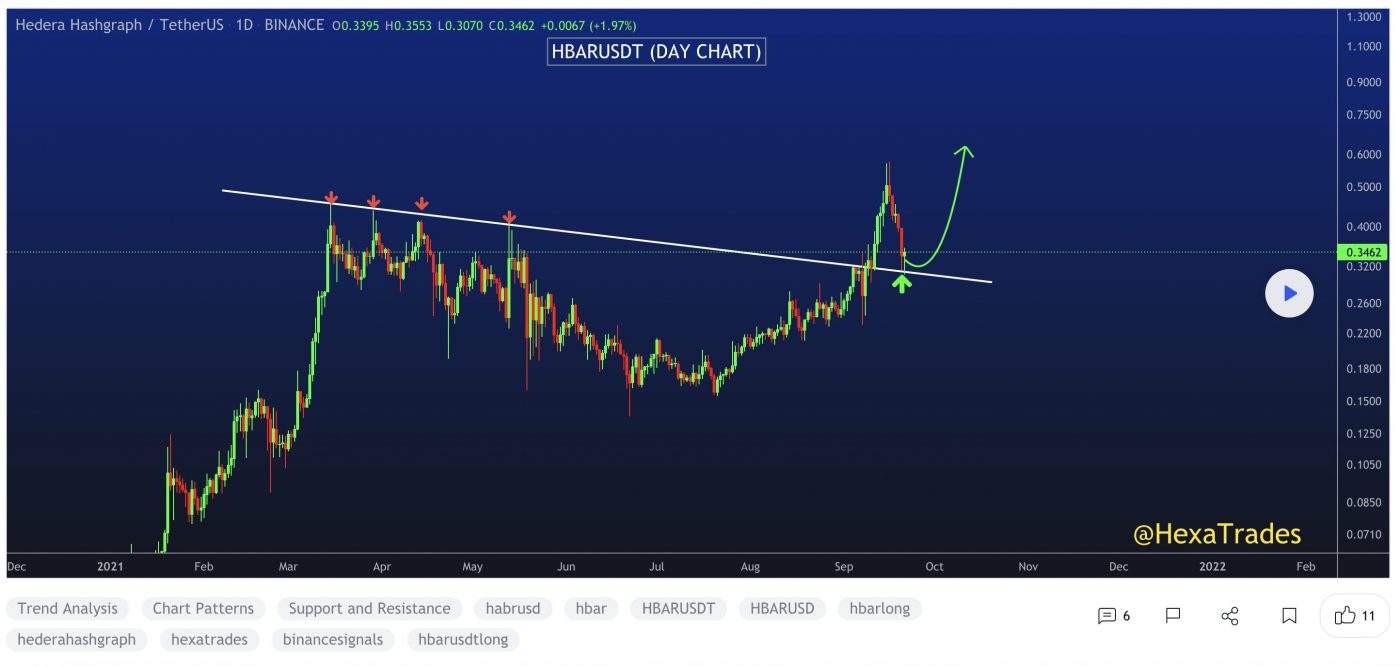
At the time of writing, HBAR is ranked the 41st cryptocurrency globally and the current price is A$0.4857. Let’s take a look at the chart below for price analysis:

Source: TradingView

July started a gradual 67% decline in HBAR‘s price. The move into August’s swing high saw a sharp jump in price, showing that some support exists near A$0.3655.

A sweep of the most recent swing lows into possible support beginning near A$0.4126 could lead to a rally over the monthly open. This rally would likely sweep the swing high into the resistance near A$0.5277. 

This potential bullish move could continue through the relatively equal swing highs near A$0.5621 – but is likely to find some resistance in the weekly level around A$0.5788.

Continued bearishness in the crypto markets might push the price to fill the weekly gap down to A$0.3400. This drop would sweep the stops under August’s low and potentially mark a new accumulation zone for the next bullish cycle.

Where to Buy or Trade Altcoins?

These coins have high liquidity on Binance Exchange, so that could help with trading on AUD/USDT/BTC pairs. And if you’re looking at buying and HODLing cryptos, then Swyftx Exchange is an easy-to-use popular choice in Australia.
Categories
Crypto News eToro Trading

29 New Cryptos Now Available for Trading on eToro Australia

Following a surge in crypto income for Q2, popular social trading platform eToro has launched an additional 29 cryptocurrencies on its Australian trading platform.

Cryptcurrencies on eToro

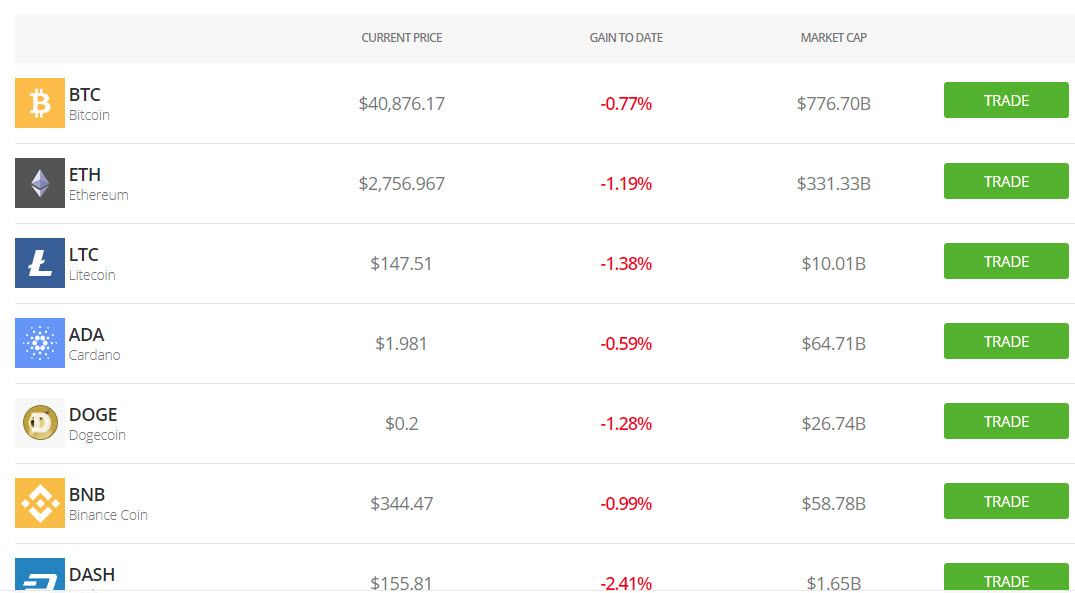
Cryptos now available to trade on eToro include: BTC, ETH, BCH, XRP, DASH, LTC, ETC, ADA, MIOTA, XML, EOS, NEO, TRX, ZEC, BNB, XTZ, MKR, COMP, LINK, UNI, YFI, DOGE, AAVE, ALGO, MANA, ENJ, BAT, MATIC, FLR and SHIB.

Now You Can Buy the Asset, Not the CFD

Users can now purchase the underlying crypto assets when buying on eToro, rather than trading a derivative (CFD). This is particularly important as regulators are putting pressure on leveraged products on crypto exchanges worldwide.

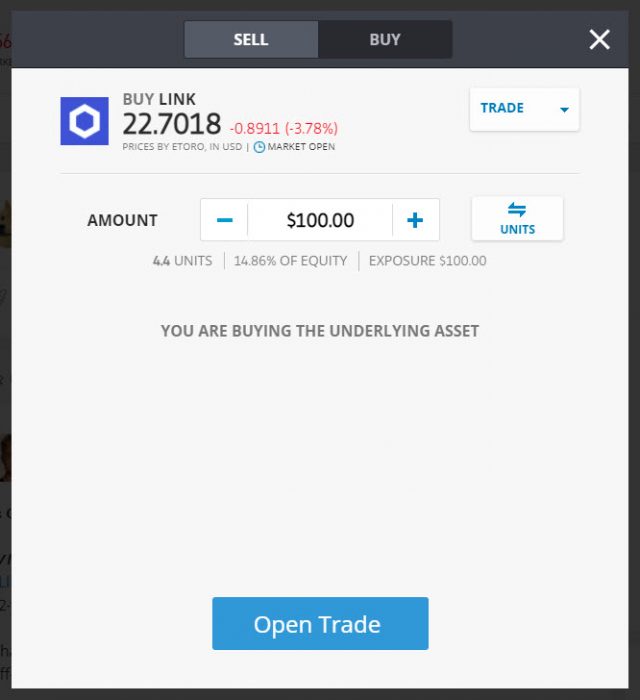
Buying Chainklink on eToro

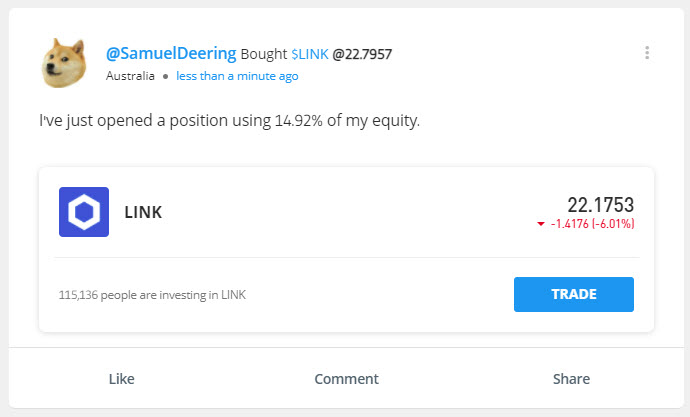
One of the unique features of eToro is the ability to openly share your trades and follow other traders and engage with them socially.

Social trading on eToro.

It’s also worth noting that cryptos bought will be held in a segregated custody account and currently you will be unable to transfer your cryptos out of your eToro account. We’ll keep you updated on any developments.

Categories
Crypto News Market Analysis Solana Stellar Trading

Top 3 Coins To Watch Today: XLM, SOL, MINA – September 22 Trading Analysis

Let’s take a closer look at today’s altcoins showing breakout signals. We’ll explain what the coin is, then dive into the trading charts and provide some analysis to help you decide.

1. Stellar (XLM)

Stellar XLM is an open network that allows money to be moved and stored. When it was released, one of its goals was boosting financial inclusion by reaching the world’s unbanked but soon afterward, its priorities shifted to helping financial firms connect with one another through blockchain technology. The network’s native token, lumens, serves as a bridge that makes it less expensive to trade assets across borders. All of this aims to challenge existing payment providers, who often charge high fees for a similar service.

XLM Price Analysis

At the time of writing, XLM is ranked the 25th cryptocurrency globally and the current price is A$0.3904. Let’s take a look at the chart below for price analysis:

Source: TradingView

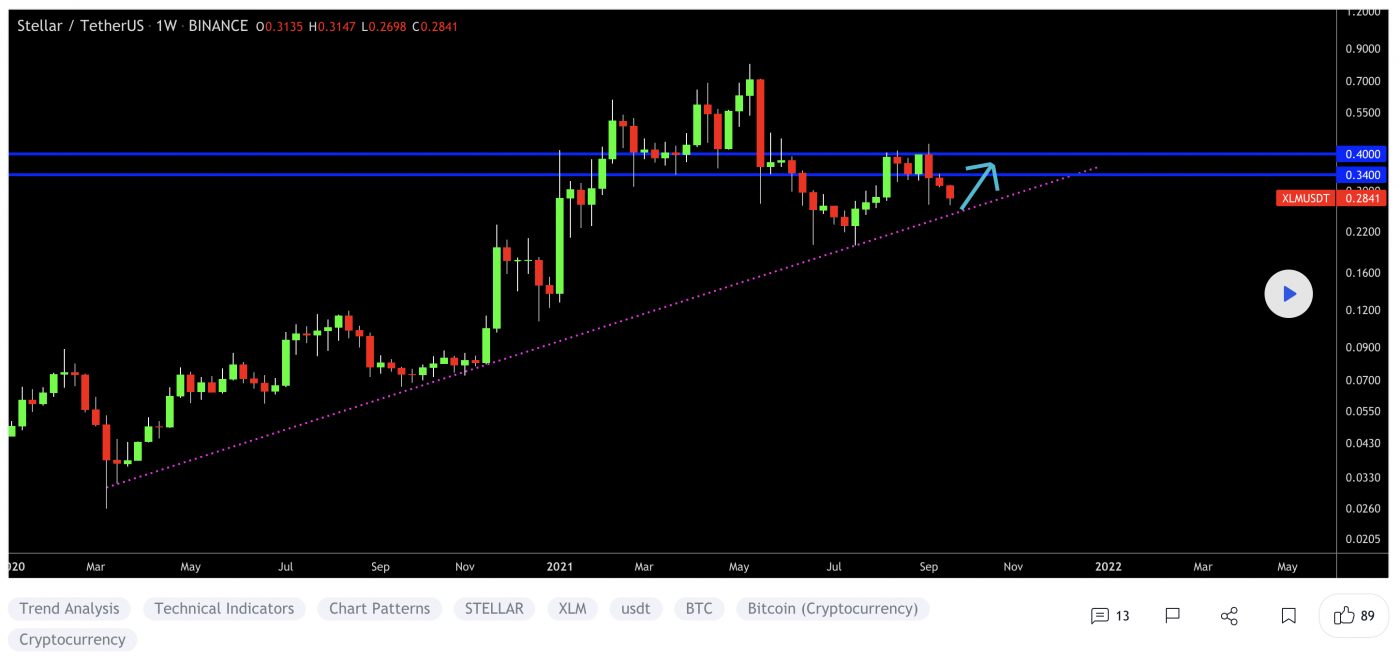
After climbing nearly 280% since the beginning of the year, a 115% range has trapped XLM between A$0.4268 and A$0.3544 during Q3.

A consolidation near A$0.3876, visible on the weekly chart, provided support on the last touch. This level could provide support again on a stop run under the A$0.3688. 

A deeper run-on stop at A$0.3479 might reach the top of a higher-timeframe gap at the same level. However, a push this low reduces the chance of a new monthly high soon. Below, little significant support exists until A$0.3218.

Higher-timeframe levels overlapping with a daily gap beginning at A$0.4169 are likely to provide resistance, perhaps on a sweep of the equal highs near A$0.4485. Breaking this resistance makes the relatively equal highs near A$0.4821 and the recent monthly high at A$0.5318 the next probable targets.

2. Solana (SOL)

Solana SOL is a highly functional open source project that banks on blockchain technology’s permissionless nature to provide decentralised finance (DeFi) solutions. The Solana protocol is designed to facilitate decentralised app (DApp) creation. It aims to improve scalability by introducing a proof-of-history (PoH) consensus combined with the underlying proof-of-stake (PoS) consensus of the blockchain.

SOL Price Analysis

At the time of writing, SOL is ranked the 7th cryptocurrency globally and the current price is A$187.33. Let’s take a look at the chart below for price analysis:

Source: TradingView

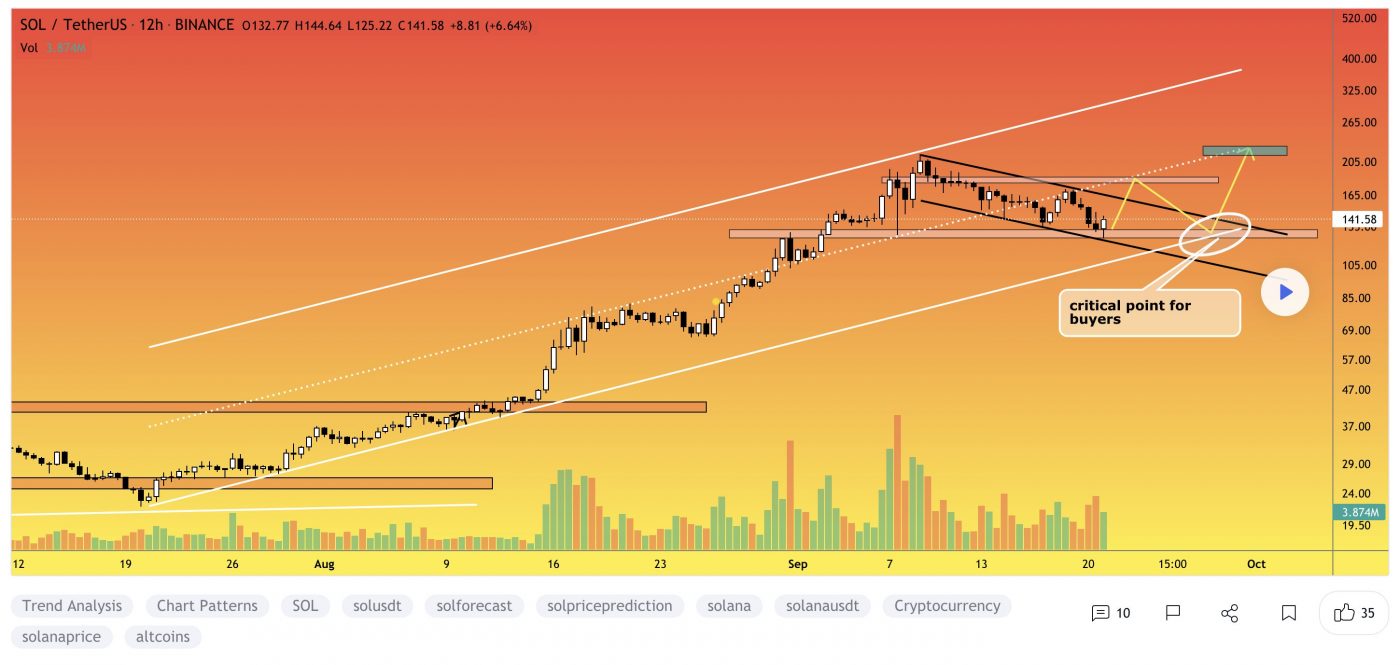
SOL‘s euphoric mid-August pump turned into a September dump, with little higher-timeframe support for bulls to justify entries.

Currently, the price is distributing at the 52% retracement level. A small consolidation near A$185.66 is visible on the 12-Hour chart, with a clearer consolidation at a higher timeframe. This area does have some confluence with the 69% retracement level and could offer some support in the future. 

The daily gap’s midpoint near A$198.34 has suppressed the price, although a push through this level could fill the daily gap up to A$215.39. A lack of sensitivity at this resistance could suggest a minor retracement before a possible move to new all-time highs.

3. Mina (MINA)

MINA Protocol is a minimal “succinct blockchain” built to curtail computational requirements in order to run DApps more efficiently. Mina has been described as the world’s lightest blockchain since its size is designed to remain constant despite growth in usage. Furthermore, it remains balanced in terms of security and decentralisation. The Mina network has a size of only 22 KB, which is minuscule when compared to Bitcoin’s 300 GB blockchain.

MINA Price Analysis

At the time of writing, MINA is ranked the 81st cryptocurrency globally and the current price is A$6.43. Let’s take a look at the chart below for price analysis:

Source: TradingView

MINA‘s 285% pump during Q3 ran into resistance near A$8.26 on September 15. Since then, the price has been consolidating between A$6.38 and A$7.12.

Just below the Monthly open, A$5.89 is the first level likely to provide substantial support. If the price breaks down through this level, overlapping levels near A$5.72 might cap a run on the lows near A$5.46 and A$5.08.

The higher-timeframe analysis points to the area near A$6.89 as the next substantial resistance. Significant selling has been occurring here on the daily chart. If this level breaks, the swing highs near A$7.28 and A$7.54 may be the next targets.

Where to Buy or Trade Altcoins?

These coins have high liquidity on Binance Exchange, so that could help with trading on AUD/USDT/BTC pairs. And if you’re looking at buying and HODLing cryptos, then Swyftx Exchange is an easy-to-use popular choice in Australia.
Categories
Crypto News Market Analysis Trading

Top 3 Coins To Watch Today: CAKE, FET, XAVA – September 21 Trading Analysis

Let’s take a closer look at today’s altcoins showing breakout signals. We’ll explain what the coin is, then dive into the trading charts and provide some analysis to help you decide.

1. PancakeSwap (CAKE)

PancakeSwap CAKE is an automated market maker (AMM), a decentralised finance (DeFi) application that allows users to exchange tokens, providing liquidity via farming and earning fees in return. PancakeSwap uses an automated market maker model where users trade against a liquidity pool. These pools are filled by users who deposit their funds and receive liquidity provider (LP) tokens in return.

CAKE Price Analysis

At the time of writing, CAKE is ranked the 30th cryptocurrency globally and the current price is A$27.65. Let’s take a look at the chart below for price analysis:

Source: TradingView

In mid-August, CAKE suggested the possible start of a new longer-term uptrend as the 9, 18, and 40 EMAs spread. At the same time, the price climbed from its May through July consolidation lows. 

Early September’s drop found some support around A$24.54, near the 78.6% retracement level, before creating a swing low and rallying over the 40 EMA. The nearby consolidation around the 61.8% retracement level could provide support if bulls add to their positions while the EMAs compress.

The price is currently testing old support that turned to resistance near A$32.34. If this resistance breaks, the price is likely to continue to, and possibly through, the last significant swing high and resistance beginning near A$36.08. 

A larger zone between A$41.41 and A$47.00, which surrounds the Q3 bear trend’s 61.8% retracement, could mark the end of the bullish move. On the other hand, if bulls show strength in this region – perhaps fuelled by increased interest from Wednesday’s NFT marketplace launch – the old high at A$61.12 gives a logical target for continuation.

However, the weakening of the last bull trend could also lead to a steeper drop in the short term. These deeper retracements often occur around this time of the month and after a major news event such as Wednesday’s launch. If this drop occurs, the price could reach down to broken resistances that may give support near A$24.54 or as low as A$22.22.

2. Fetch.ai (FET)

Fetch.ai FET is a platform that aims to connect Internet of Things (IoT) devices and algorithms to enable collective learning. Fetch.ai is built on a high-throughput sharded ledger and offers smart contract capabilities to deploy machine learning and artificial intelligence solutions for decentralised problem-solving. These open-source tools are designed to help users create ecosystem infrastructure and deploy commercial models.

FET Price Analysis

At the time of writing, FET is ranked the 121st cryptocurrency globally and the current price is A$0.9653. Let’s take a look at the chart below for price analysis:

Source: TradingView

FET recently saw significant profit-taking after breaking its Q1 highs before dropping from its distribution range into the 40 EMA.

Aggressive bulls might add to their positions near possible support around A$0.9768, which has confluence with the 40 EMA, old highs, and is near the 78.6% retracement level. If this level holds, the price might find some resistance near A$1.09 – an area of broken support. 

However, today’s airdrop could be a catalyst for a short-term selloff as holders release their tokens on the market. A decisive break of this potential support zone near A$0.9725 will likely reach or exceed A$0.8145 and A$0.6134. 

These levels are old resistances that could turn to support. If so, they could cause a short-term bounce or start a new bullish trend targeting probable resistances beginning near A$1.92 and A$2.21.

3. Avalaunch (XAVA)

Avalaunch XAVA is a launchpad powered by the Avalanche platform, allowing new and innovative projects to seamlessly prepare for launch with an emphasis on fair and broad distribution. With its values deeply rooted in the early Avalanche community, they are able to offer projects confidently to informed users who are aligned with the long-term goals of the rapidly expanding application ecosystem.

XAVA Price Analysis

At the time of writing, XAVA is ranked the 2761st cryptocurrency globally and the current price is A$5.61. Let’s take a look at the chart below for price analysis:

Source: TradingView

XAVA‘s retracement of the bullish trend turned the corner in early September. Currently, it’s consolidating just under the A$7.59 high.

The last swing high near A$5.80 marks an area of possible support for aggressive bulls and has confluence with the previous leg’s 61.8% retracement level and the 9 EMA. 

The 78.6% retracement level of the last leg up overlaps with another possible support near A$4.88 and could spark more interest from bulls looking for support just below the range EQ. 

A deeper retracement – more probable during the last 10 days of the month – could reach A$4.24, which is approximately where the price re-entered the old range. This level is also just below the 40 EMA, which can sometimes mark accumulation before a significant move higher.

Investor excitement about Wednesday’s IDO could help propel price through the A$7.59 high and lay the foundation for further continuation to near A$9.39. Longer-term, a sustained bullish trend fuelled by more real-world use cases built on XAVA could continue climbing to projected resistances near A$11.66, A$17.32 and A$20.70.

Where to Buy or Trade Altcoins?

These coins have high liquidity on Binance Exchange, so that could help with trading on AUD/USDT/BTC pairs. And if you’re looking at buying and HODLing cryptos, then Swyftx Exchange is an easy-to-use popular choice in Australia. You can buy XAVA coin from multiple exchanges listed on coinmarketcap.
Categories
Crypto News Market Analysis Trading

Top 3 Coins To Watch Today: ATOM, FTM, CKB – September 20 Trading Analysis

Let’s take a closer look at today’s altcoins showing breakout signals. We’ll explain what the coin is, then dive into the trading charts and provide some analysis to help you decide.

1. Cosmos (ATOM)

Cosmos ATOM bills itself as a project that solves some of the “hardest problems” facing the blockchain industry. It aims to offer an antidote to “slow, expensive, unscalable and environmentally harmful” proof-of-work protocols, like those used by Bitcoin, by offering an ecosystem of connected blockchains. ATOM tokens are earned through a hybrid proof-of-stake algorithm, and they help to keep the Cosmos Hub, the project’s flagship blockchain, secure. This cryptocurrency also has a role in the network’s governance.

ATOM Price Analysis

At the time of writing, ATOM is ranked the 20th cryptocurrency globally and the current price is A$60.26. Let’s take a look at the chart below for price analysis:

Source: TradingView

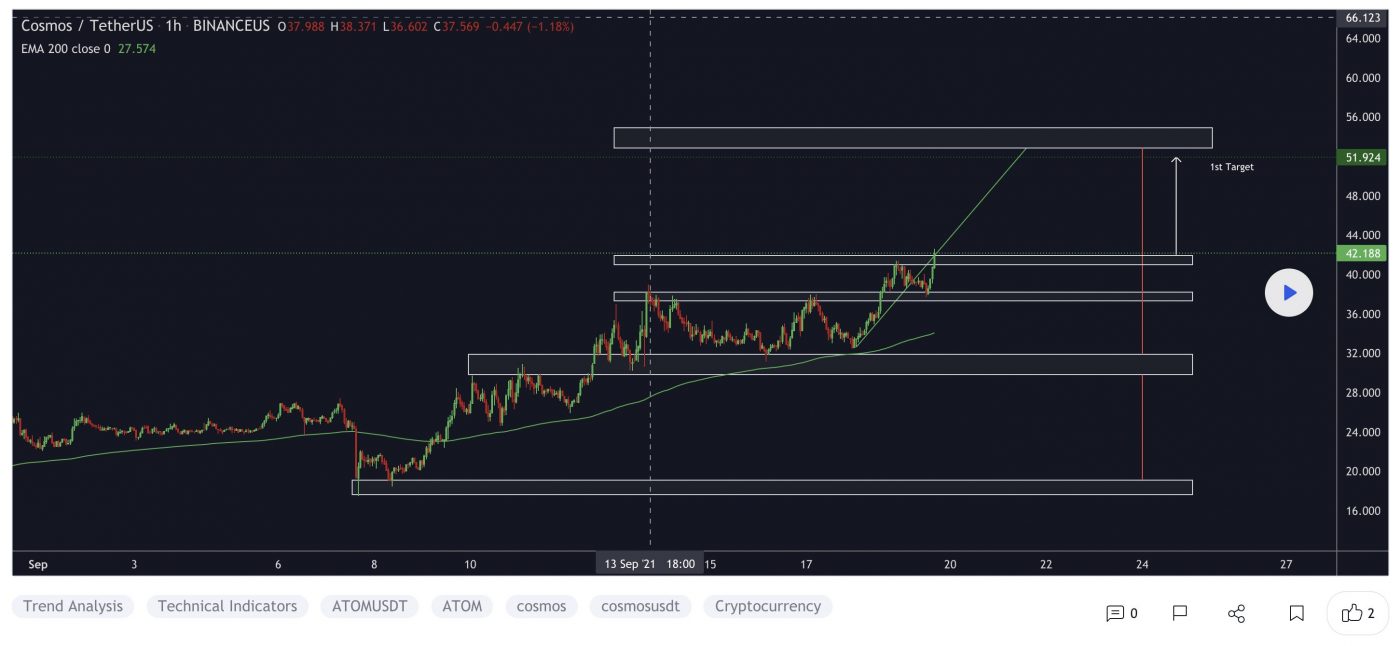
During August, ATOM broke several swing highs that could be the signal for a new bullish trend.

Last week’s break of the most recent swing low could suggest some downside in the short term. It formed probable resistance near A$55.78 and may target the swing low and possible support near A$52.39.

The swing low and possible support near A$50.00 could be the second bearish target if the move down continues. The relatively equal lows near A$48.95 and possible support underneath near A$47.55 could provide more substantial support.

The last swing high near A$65.46 gives a near-term target if bullish continuation continues. However, resistance beginning around A$63.88 could cap this move. A break of this resistance might continue to probable resistance near A$66.71 and reach above the cluster of relatively equal highs near A$68.02.

2. Fantom (FTM)

Fantom FTM is a directed acyclic graph (DAG) smart contract platform providing decentralised finance (DeFi) services to developers using its own bespoke consensus algorithm. Together with its in-house token FTM, Fantom aims to solve problems associated with smart-contract platforms, specifically transaction speed, which developers say they have reduced to under two seconds.

FTM Price Analysis

At the time of writing, FTM is ranked the 43rd cryptocurrency globally and the current price is A$1.98. Let’s take a look at the chart below for price analysis:

Source: TradingView

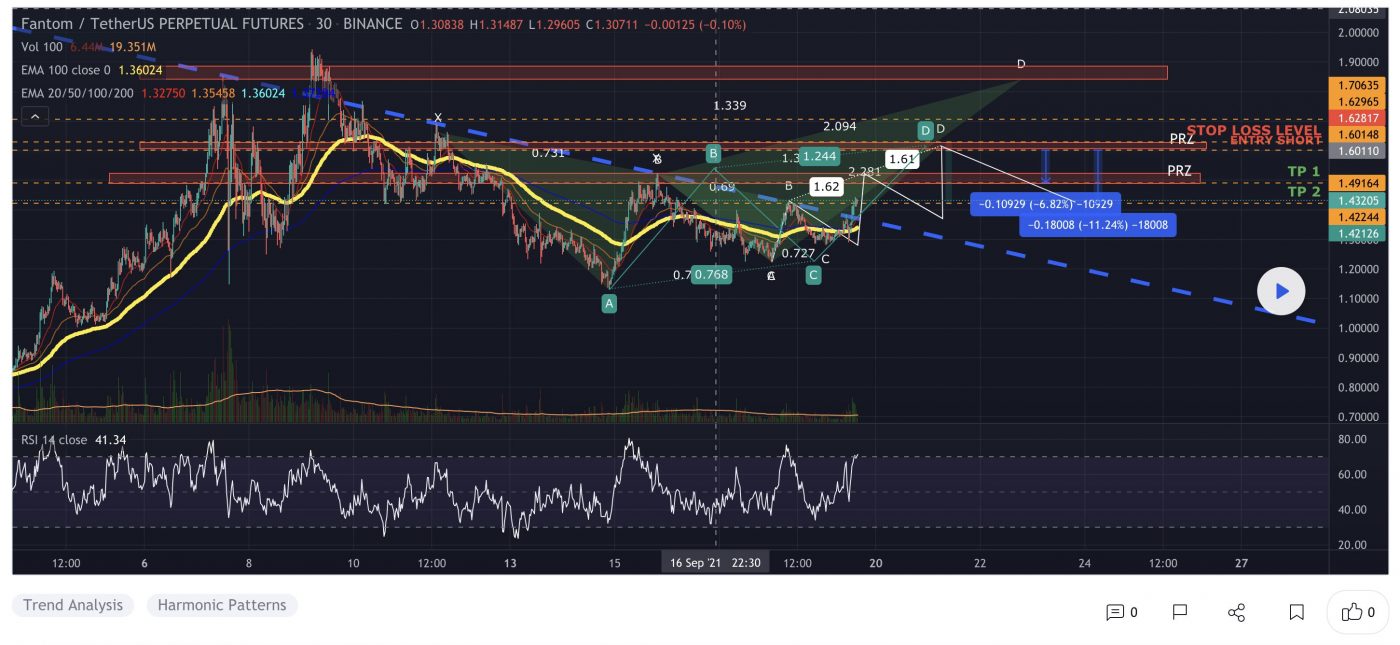
Mid-August marked a turning point for FTM, with the price rocketing up almost 325% from its lows to probable resistance beginning near A$0.5266.

The price is currently struggling with the area between A$1.82 and A$1.97. This region could provide support after a close above – or resistance after a close below. 

A retracement could reach into the daily gap and possible support around A$1.90. A more bearish shift in the marketplace will likely aim for the relatively equal lows near A$1.83, and the potential support just below that begins around A$1.75.

Continuation to the upside will likely target the all-time high near A$2.12. However, probable resistance beginning at A$2.05 and A$2.09 could cap or slow down this move.

3. Nervos Network (CKB)

The Nervos Network CKB describes itself as an open-source public blockchain ecosystem and collection of protocols. The Nervos CKB (Common Knowledge Base) is the layer 1, proof of work public blockchain protocol of the Nervos Network. It reportedly allows any crypto asset to be stored with the security, immutability, and permissionless nature of Bitcoin while enabling smart contracts and layer 2 scaling. It aims to capture the total network value through its “store of value” crypto-economic design and native token, the CKByte.

CKB Price Analysis

At the time of writing, CKB is ranked the 131st cryptocurrency globally and the current price is A$0.02418. Let’s take a look at the chart below for price analysis:

Source: TradingView

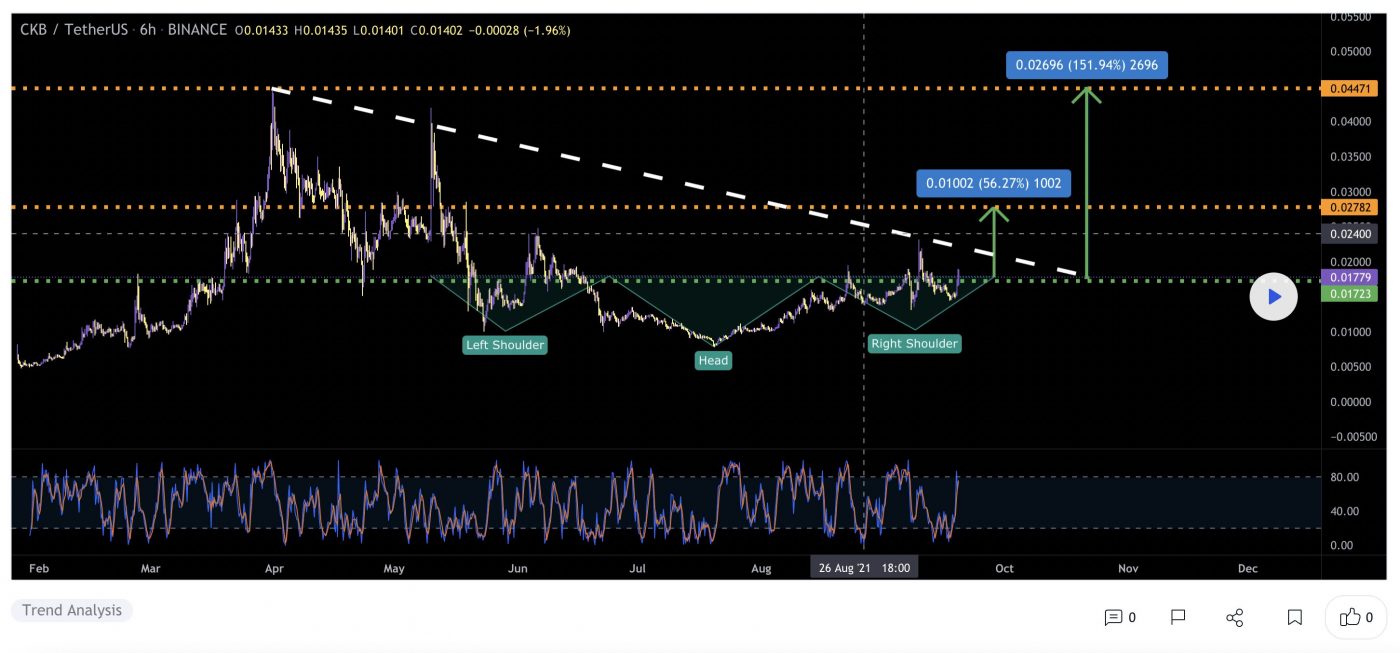
In mid-July, CKB also turned the corner, breaking a key swing high in early August. This move could suggest a longer-term bullish trend.

The swing high near A$0.02534 stands out as a bullish target and marks an area of probable resistance. Further continuation could reach into possible resistance starting near $0.02756.

Even if the bullish trend continues, a stop run at the recent swing low near A$0.02134 into possible support beginning near A$0.01988 is reasonable. If the price reaches further down, the swing low and possible support near A$0.01847 might provide another downside target. 

The area near A$0.01805 could also provide support. However, a drop this far could suggest a stop run below the higher-timeframe relatively equal lows near A$0.01688 into possible support beginning around A$0.01590.

Where to Buy or Trade Altcoins?

These coins have high liquidity on Binance Exchange, so that could help with trading on AUD/USDT/BTC pairs. And if you’re looking at buying and HODLing cryptos, then Swyftx Exchange is an easy-to-use popular choice in Australia.

Categories
Bitcoin Bitcoin Mining Crypto News Ethereum Litecoin Mining Trading

Debt-Laden Laos Approves Crypto Mining for Economic Growth, Reverses Previous Ban

The one-party socialist government of landlocked South-East Asian country Laos has green-lit six domestic firms to trade and mine cryptocurrencies.

As named by government mouthpiece The Laotian Times, the companies that have been licensed are Wap Data Technology, Phongsubthavy Road & Bridge Construction, Sisaket Construction, Boupha Road-Bridge Design Survey, Phousy Group and Joint Development Bank. Only the latter, a state-backed lender, appears to have any financial background. 

Most of the others are construction or infrastructure-related firms. Phousy Group, for example, has been active in road and bridge building in Laos since 1998, mainly as a favoured contractor to the Laotian government.

All six companies have been given permission to trial mining and trading of digital assets including bitcoin, ethereum and litecoin. A commission led by the Laotian Ministry of Technology and Communication will set out a regulatory plan to be scrutinised by the country’s prime minister, Phankham Viphavanh, this week.

After Banning Crypto in 2018, Laos Changes Its Tune

The announcement comes less than a month after Laos’s central bank issued a warning to the public against trading digital tokens. The government issued a decree that effectively banned crypto in 2018 and repeated its stance as recently as last month.

The country’s rediscovered enthusiasm for cryptos follows the crackdown earlier this year on bitcoin mining by Laos’s nearest and biggest neighbour, China, ostensibly on power consumption grounds. 

The Nam Ou hydro-electric project on the Mekong River in Laos, established in 2016 with an installed capacity of 1,272 megawatts.

What Laos has going for it is that it is a hydro-electric superpower, making it an ideal potential home for power-hungry crypto miners. Its economy is based on harnessing hydro electricity from the country’s extensive river system and exporting two-thirds of its reserves to neighbouring countries Thailand, China and Vietnam.

Crypto Mining: A Ready Antidote to Foreign Debt?

For that reason alone, Laos is seen by the World Bank as one of the Pacific region’s fastest-growing economies, with annual GDP growth averaging 7.4 percent since 2009, though the nation is also mired in foreign debt.

Government powerbrokers may have one eye on developments in El Salvador, which officially made bitcoin legal tender this month and plans to harness the Central American republic’s abundant geothermal energy, derived from its many volcanoes, to mine bitcoin. Based on the current BTC price, this could earn the Salvadorean government more than A$1 billion per year.

Categories
Bitcoin Crypto News Market Analysis Markets Trading

Bitcoin Price Hits Golden Cross, Bull Run Imminent?

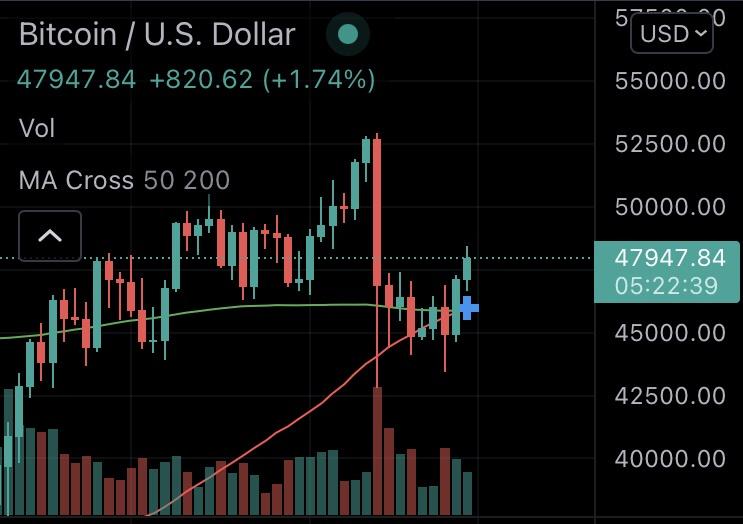
After showing signs last month, the holy grail of technical analysis is finally upon us – bitcoin has reached a “Golden Cross”, which typically is viewed as an indicator of bullish price action on the horizon.

What is a Golden Cross?

In the world of technical analysis (TA), the golden cross is a chart pattern where a shorter-term moving average (MA) crosses above a longer-term moving average. This is typically considered to be a bullish signal.

BTC golden cross. Source: Reddit

When considering a golden cross, the most commonly used moving averages are the 50- and 200-day periods. Once the crossover happens, the longer-term moving average is typically considered to be a strong area of support.

The opposite of a golden cross is a death cross, where a shorter-term moving average crosses below a longer-term moving average. This is typically considered to be a bearish signal.

What Happened with Previous Golden Crosses?

Since inception, there have been six Golden Crosses and in four cases it has resulted in massive price action. In the past two instances, it has resulted in values increasing by five and three times respectively.

Let’s examine how bitcoin has fared in each of the previous six Golden Crosses.

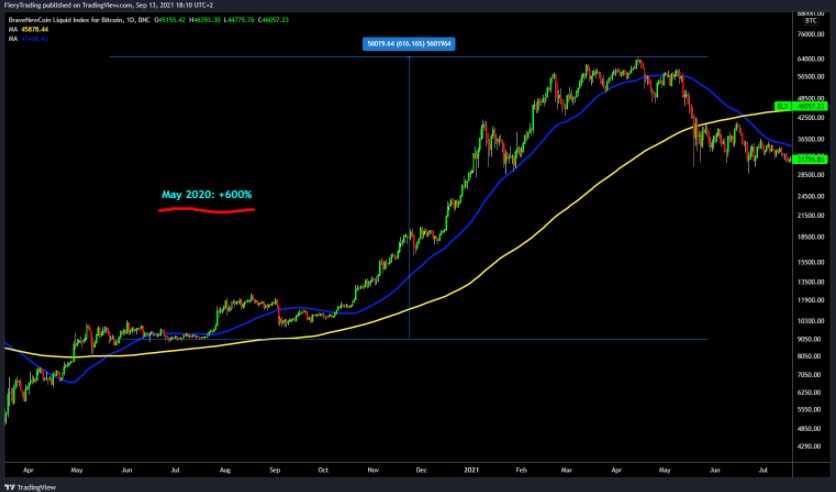
May 2020: + 600 percent

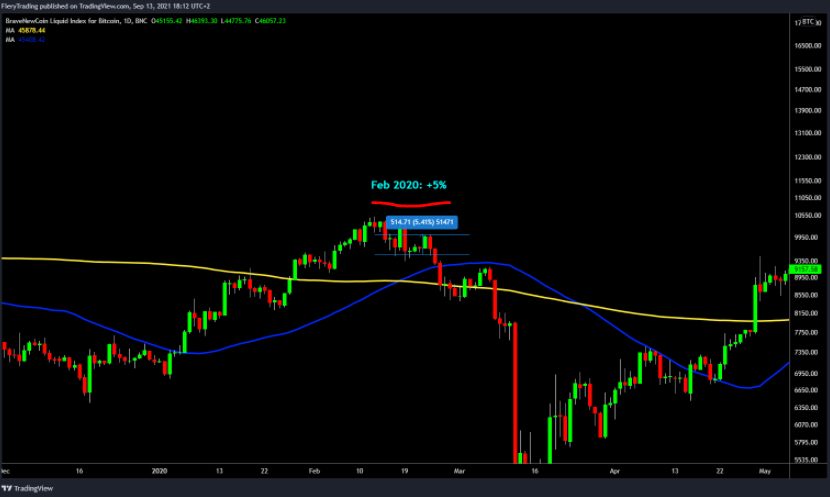
February 2020: +5 percent

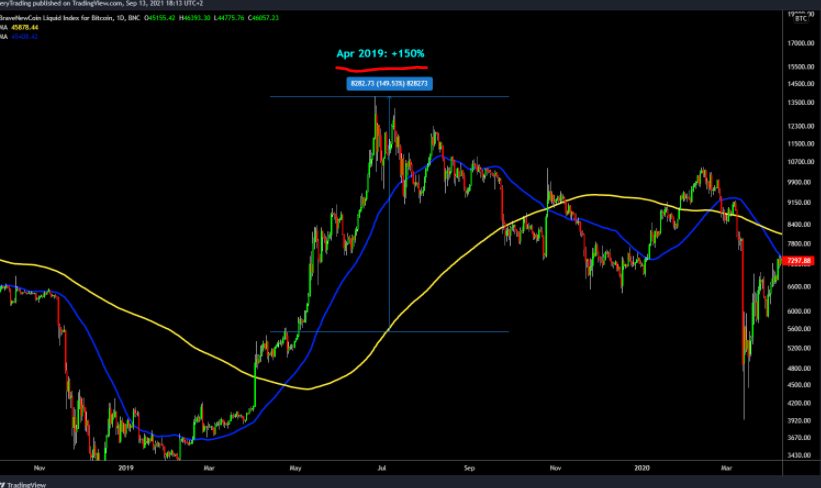
April 2019: +150 percent

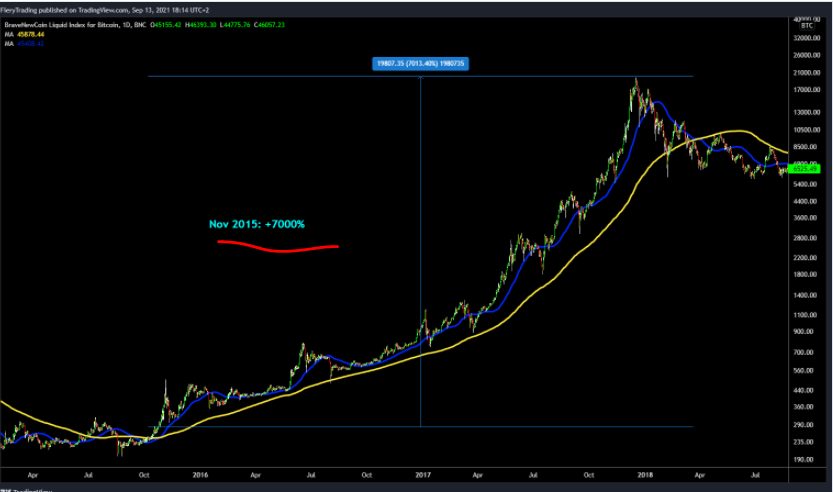
November 2015: +7,000 percent

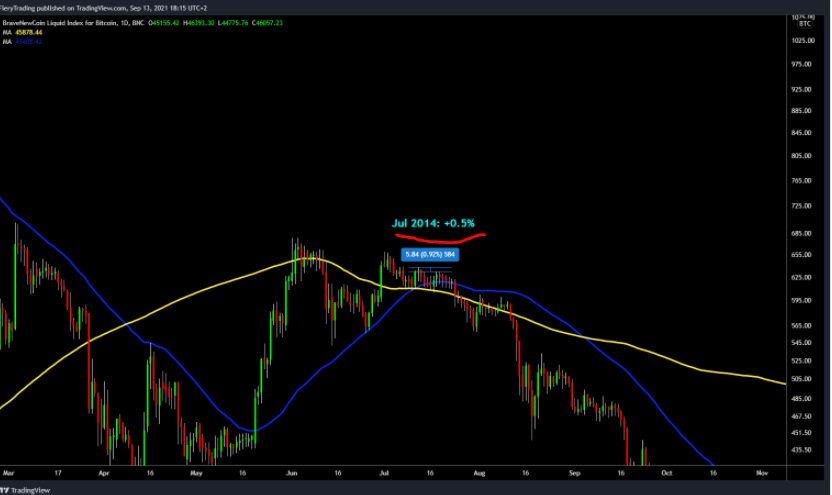
July 2014: +0.5 percent

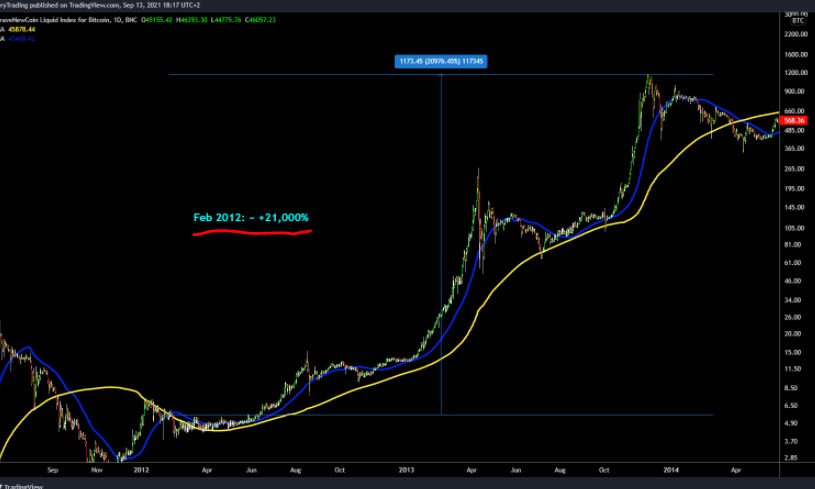
February 2012: +21,000 percent

What’s the TLDR?

It’s clear that in general, golden crosses tend to result in rather bullish price action, but not always. Given that the market is more mature, diminishing returns ought to be expected.

Importantly, one shouldn’t overly rely on any single indicator – a multiplicity of variables have an impact on the price, none of which is predictable. Experienced investors know this and are no doubt taking it into account going forward. Just recently, bitcoin looked unstoppable as it crossed US$50,000, before declining sharply shortly thereafter to US$44,500.

If you’re interested in upping your technical analysis game, be sure to consult Crypto News Australia‘s guide to bear and bull markets.