Categories
Cardano Crypto News Market Analysis Trading

Top 3 Coins To Watch Today: DOT, ADA, MANA – September 17 Trading Analysis

Let’s take a closer look at today’s altcoins showing breakout signals. We’ll explain what the coin is, then dive into the trading charts and provide some analysis to help you decide.

1. Polkadot (DOT)

Polkadot DOT is an open-source sharding multichain protocol that facilitates the cross-chain transfer of any data or asset types, not just tokens, thereby making a wide range of blockchains interoperable with each other. Polkadot’s native DOT token serves three clear purposes: providing network governance and operations, and creating parachains (parallel chains) by bonding. This interoperability seeks to establish a fully decentralised and private web, controlled by its users, and simplify the creation of new applications, institutions and services.

DOT Price Analysis

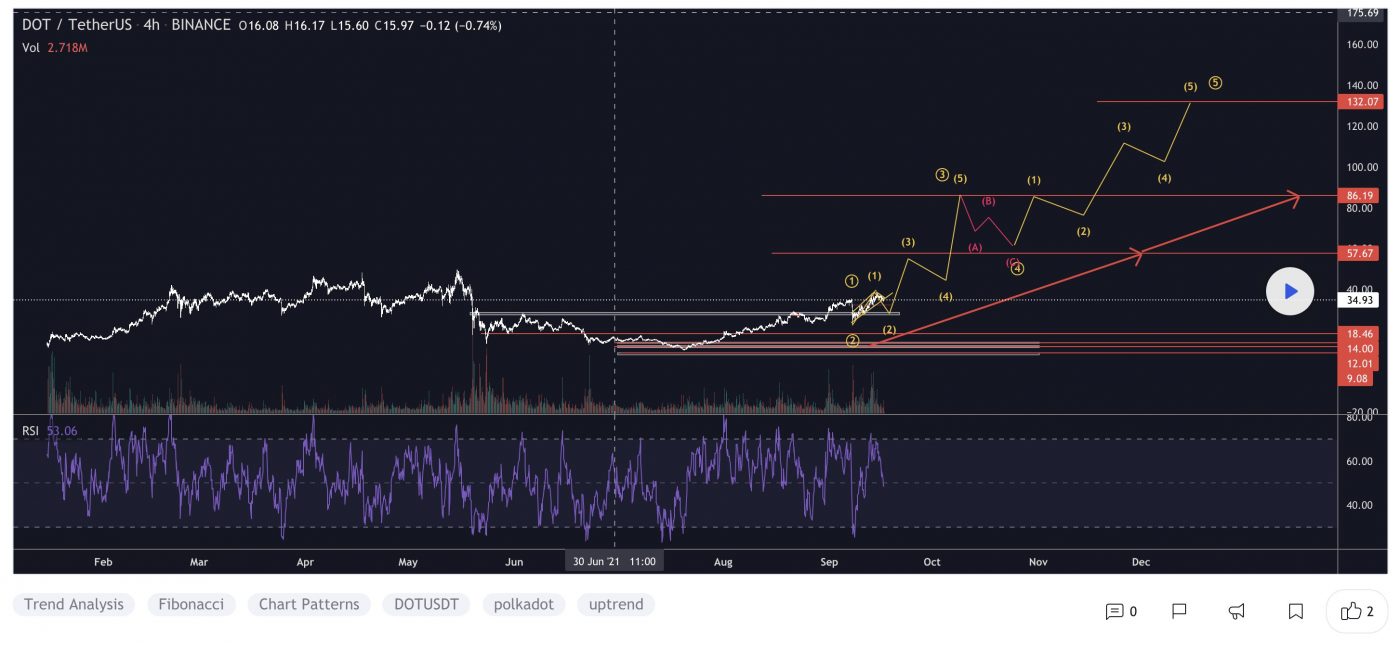
At the time of writing, DOT is ranked the 8th cryptocurrency globally and the current price is A$34.97. Let’s take a look at the chart below for price analysis:
Source: TradingView

DOT‘s nearly 87% retracement from its early May high found a low near A$20.65 in late June before July’s bullish trend began.

The price is currently approaching resistance at a swing high near A$36.89. If this level breaks, bulls might target the swing highs near A$38.52, A$39.80, and potentially up to A$41.68. Resistance near A$43.05 and A$45.21 could cap this move.

If the market remains bullish for the near term, bulls might buy at A$33.06. However, a stop run into A$31.77 could offer a higher probability entry. A steeper drop could reach below the swing low into possible support near A$28.75.

2. Cardano (ADA)

Cardano ADA is a proof-of-stake blockchain platform that says its goal is to allow “changemakers, innovators and visionaries” to bring about positive global change. The open-source project also aims to “redistribute power from unaccountable structures to the margins to individuals”, helping to create a society that is more secure, transparent and fair.

Cardano is used by agricultural companies to track fresh produce from field to fork, while other products built on the platform allow educational credentials to be stored in a tamper-proof way, and retailers to clamp down on counterfeit goods.

ADA Price Analysis

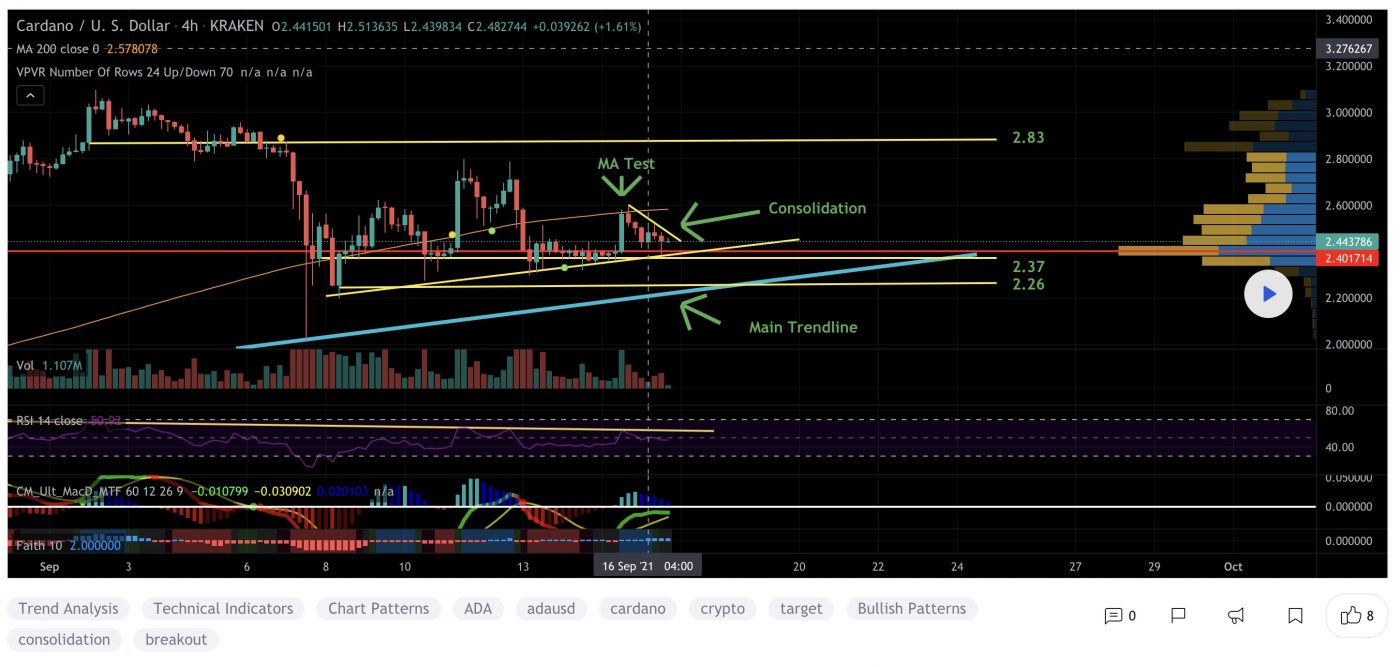
At the time of writing, ADA is ranked the 3rd cryptocurrency globally and the current price is A$3.36. Let’s take a look at the chart below for price analysis:
Source: TradingView

ADA‘s chart paints a different picture than many other altcoins, with August’s high leading to a massive range after setting a low near A$1.90 in July.

The nearly 85% spike within two weeks at the beginning of August makes immediate bids questionable. However, the price may be finding support near A$3.21 and possibly near A$3.14. Since the price swept the impulse’s high at A$3.05, bulls might be waiting to enter near the swing low and gap near A$2.93, or slightly lower near A$2.87.

Little resistance lies overhead, although some might exist between A$3.42 and approximately A$3.48, just above the current price. A sweep and rejection of the high near A$3.57 would make most areas of possible support highly suspect and could mark the end of the bullish trend.

3. Decentraland (MANA)

Decentraland MANA defines itself as a virtual reality platform powered by the Ethereum blockchain that allows users to create, experience, and monetise content and applications. In this virtual world, users purchase plots of land that they can later navigate, build upon and monetise.

Decentraland uses two tokens: MANA and LAND. MANA is an ERC-20 token that must be burned to acquire non-fungible ERC-721 LAND tokens. MANA tokens can also be used to pay for a range of avatars, wearables, names and more on the Decentraland marketplace.

MANA Price Analysis

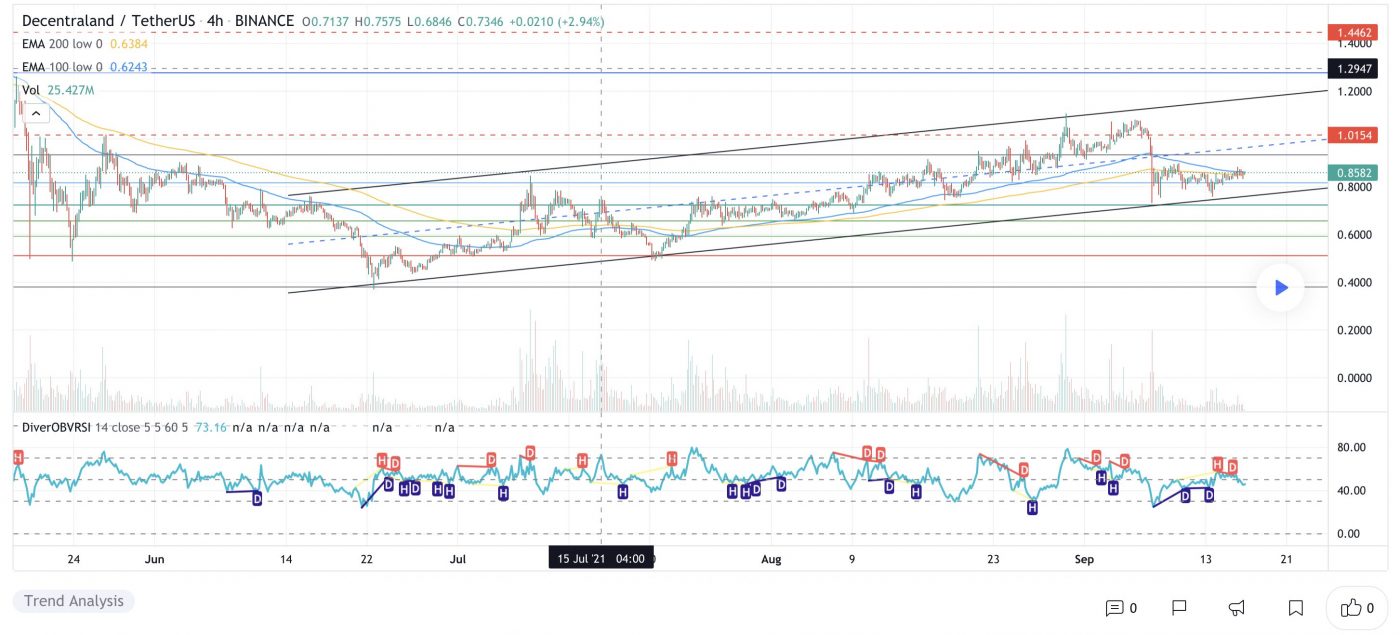
At the time of writing, MANA is ranked the 77th cryptocurrency globally and the current price is A$1.16. Let’s take a look at the chart below for price analysis:
Source: TradingView

Like many other altcoins, MANA set a high in early May before retracing 83% to the low at A$0.8539 in July.

Price broke through resistance near A$1.24, which may mark an area of possible support on a retracement. If this support fails, bulls might also step in near A$1.12. However, a drop this far increases the chances of a stop run to A$1.03 and possibly into support near A$0.9562. For now, continuing bullish market conditions could help A$1.00 become support.

The swing high around A$1.25 gives bulls a reasonable first target, with A$1.31 also likely to draw the price upward. Higher-timeframe resistance beginning near A$1.33 or A$1.35 could cap the move or trigger consolidations. If bullish market conditions continue, bulls might test probable resistance near A$1.40.

Where to Buy or Trade Altcoins?

These coins have high liquidity on Binance Exchange, so that could help with trading on AUD/USDT/BTC pairs. And if you’re looking at buying and HODLing cryptos, then Swyftx Exchange is an easy-to-use popular choice in Australia.

Categories
Crypto News EOS Market Analysis Trading Zilliqa

Top 3 Coins To Watch Today: ZIL, CELR, EOS – September 16 Trading Analysis

Let’s take a closer look at today’s altcoins showing breakout signals. We’ll explain what the coin is, then dive into the trading charts and provide some analysis to help you decide.

1. Zilliqa (ZIL)

Zilliqa ZIL is a public, permissionless blockchain designed to offer high throughput with the ability to complete thousands of transactions per second. It seeks to solve the issue of blockchain scalability and speed by employing sharding as a second-layer scaling solution. The platform is home to many decentralised applications, and as of October 2020 it also allows for staking and yield farming. The native utility token of Zilliqa, ZIL, is used to process transactions on the network and execute smart contracts.

ZIL Price Analysis

At the time of writing, ZIL is ranked the 85th cryptocurrency globally and the current price is A$0.1492. Let’s take a look at the chart below for price analysis:

Source: TradingView

ZIL‘s nearly 83% drop from its May highs found a low near A$0.09538 in July before closing over a short-term high around A$0.1237.

This daily close over the high could signal a shift in market structure that might reach probable resistance near A$0.1533. A sustained bullish move may target the swing high at A$0.1647. If this stop run occurs, a run beyond the high into probable resistance near A$0.1788 and A$0.1950 is possible.

Bulls could buy a retracement to possible support near A$0.1389, just above the August monthly open. A bearish turn in the marketplace may propel the price toward possible support near A$0.1236. 

However, relatively equal lows near A$0.1194 and A$0.1124 provide an attractive target for bears if the market resumes its bearish trend. A run on these lows might find support between A$0.1015 and A$0.1066.

2. Celer Network (CELR)

The Celer Network CELR is a smartly designed layer-2 scaling solution that provides off-chain transaction handling. The Celer platform offers fast, simple and secure off-chain transactions for both payments and smart contracts. The project was among the first to be developed using the Substrate framework and is part of the Polkadot ecosystem. As to the overall goal of the network, its founders envisioned unleashing the full potential of blockchain and revolutionising Dapps with more efficient and productive outputs.

CELR Price Analysis

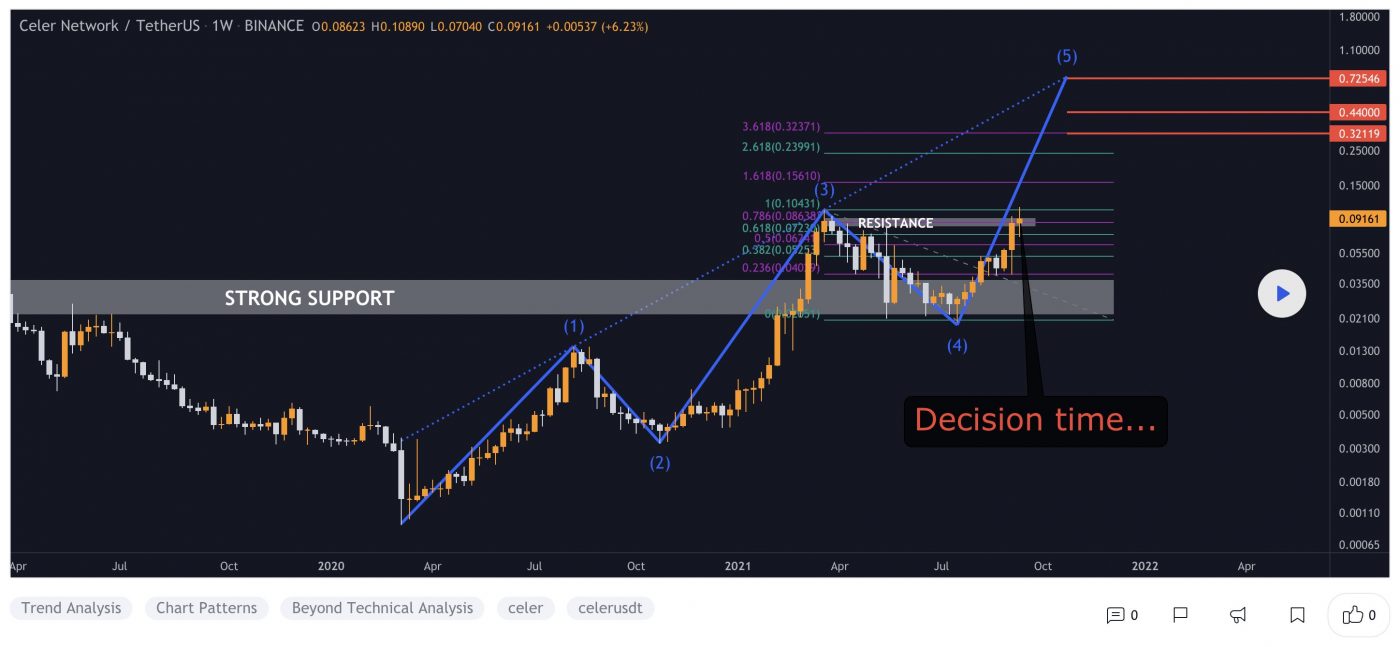
At the time of writing, CELR is ranked the 125th cryptocurrency globally and the current price is A$0.1249. Let’s take a look at the chart below for price analysis:

Source: TradingView

CELR‘s massive May spike retraced near A$0.03841 into the consolidation that began the impulse before bouncing to A$0.04266. 

This consolidation could provide support again, although bears would first have to push the price through possible support near A$0.1045. The market’s structure may be shifting bearish, with A$0.09365 likely to provide some resistance if this is the case. A sustained bearish move could reach the swing low near A$0.08973 before finding support near A$0.08456.

However, the bullish higher-timeframe trend may prevail, with relatively equal highs near A$0.1290 potentially providing an attractive target to lure the price over the September monthly high. If so, the price could reach for the midpoint of the massive wick near A$0.1377.

3. Eos (EOS)

EOS is a platform designed to allow developers to build decentralised apps. The project’s goal is relatively simple: to make it as straightforward as possible for programmers to embrace blockchain technology and ensure the network is easier to use than rivals. As a result, tools and a range of educational resources are provided to support developers who want to build functional apps quickly. EOS also aims to improve the experience for users and businesses. While the project tries to deliver greater security and less friction for consumers, it also vies to unlock flexibility and compliance for enterprises.

EOS Price Analysis

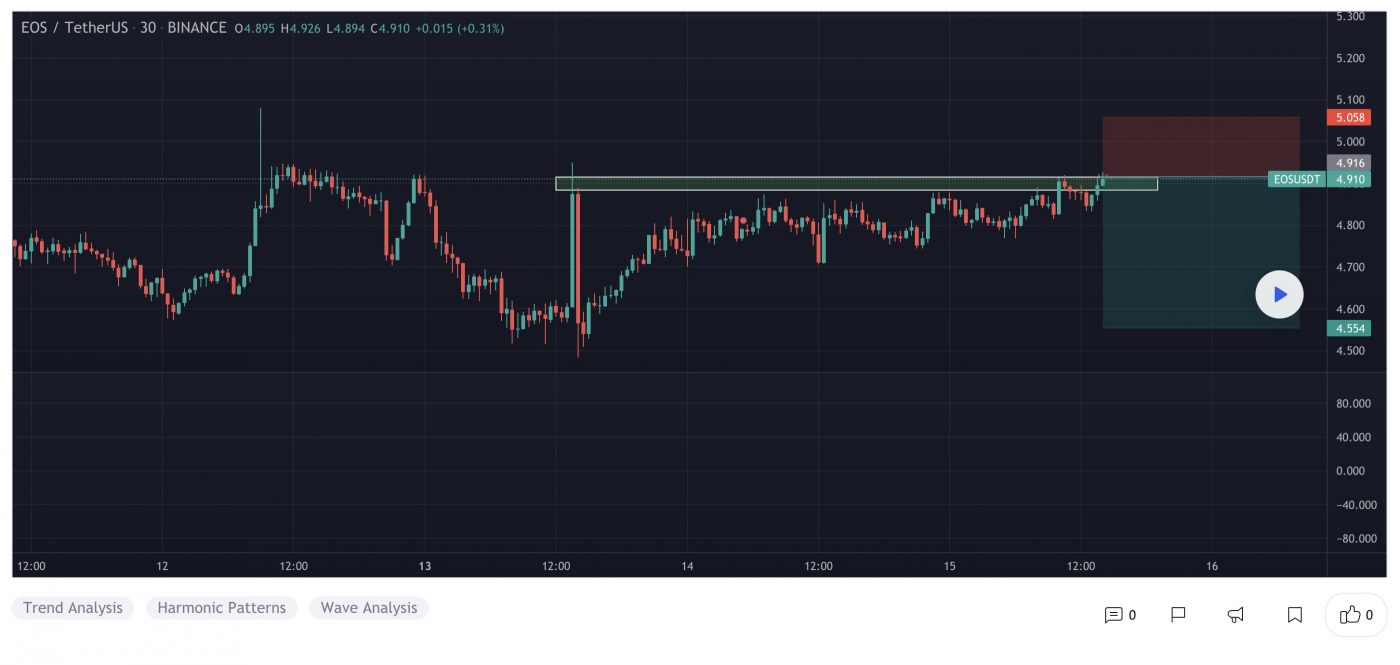
At the time of writing, EOS is ranked the 38th cryptocurrency globally and the current price is A$6.70. Let’s take a look at the chart below for price analysis:

Source: TradingView

EOS set a high near A$18.34 in May before retracing nearly 93% to find a low near A$6.10. The price consolidated around this level before the strong bullish impulse during the past several weeks.

Probable resistance near A$6.90 is slowing the bullish advance down. However, another leg might target the last swing high at A$7.24 and relatively equal highs at A$7.86. Resistance near A$8.15 could cap the move before the second swing high. Beyond these levels, little stands in the bulls’ way before reaching the swing high near A$8.94.

A retracement before a move higher might find support in the daily gap near A$6.05, just above the August monthly open. Relatively equal lows near A$5.83 could also provide support. Run-on stops at A$5.32 and A$5.08 might find support in the gap beginning near A$4.91 or a high-timeframe level near A$4.56.

Where to Buy or Trade Altcoins?

These coins have high liquidity on Binance Exchange, so that could help with trading on AUD/USDT/BTC pairs. And if you’re looking at buying and HODLing cryptos, then Swyftx Exchange is an easy-to-use popular choice in Australia.

Categories
Crypto News Market Analysis Trading

ACM Surges +85% in a Single Day after Partnership between FTX and Chiliz to promote and launch Fan Tokens

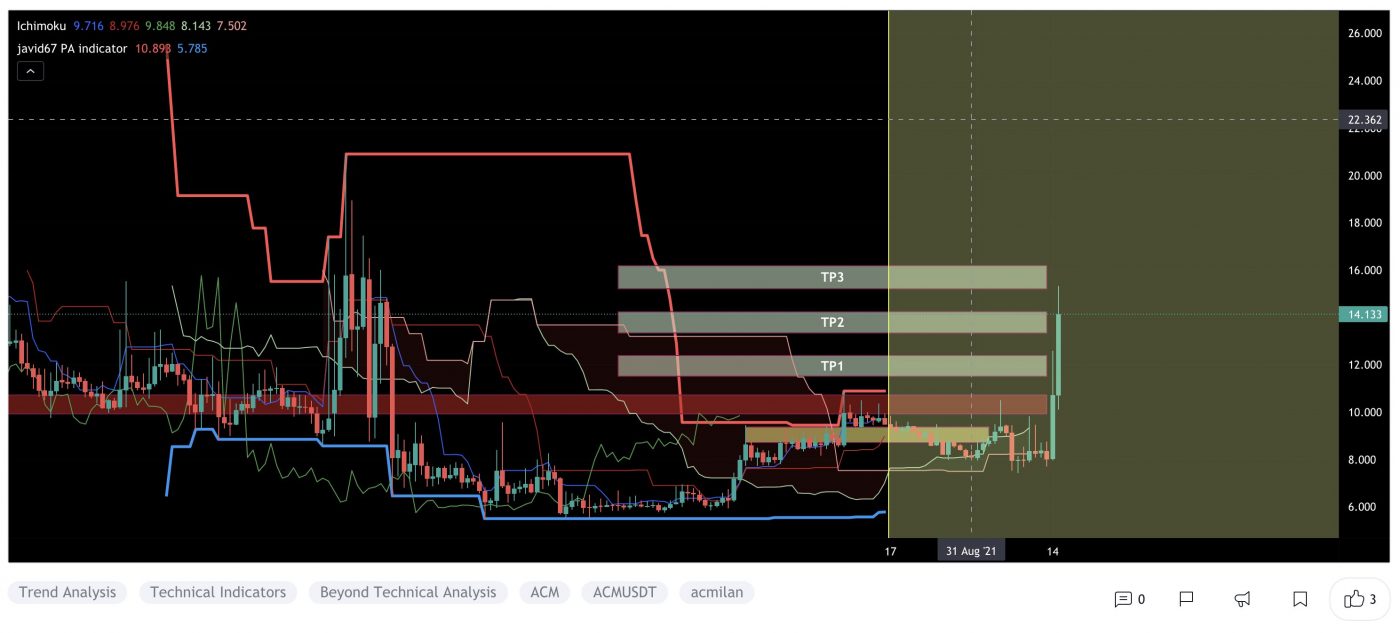
ACM Fan Token is trading in an uptrend, like many other Altcoins. The cryptocurrency ACM just went up +85% in a single day by breaking a rising wedge pattern with strong buying volume on multiple exchanges and surges over +130% in a week.

What is ACM Fan Token?

The AC Milan Fan Token ACM is a utility token that gives AC Milan fans a tokenized share of influence on club decisions using the Socios application and services. The token serves as a membership key that allows users to compete for exclusive rewards, club recognition, and more.ACM token holders can vote via smart contract on “fan decision” polls published by AC Milan. Token holders can interact with the Socios platform (voting on polls, competing in contests and quizzes, connecting/chatting with like-minded users, etc.) and earn rewards.

ACM Price Analysis

At the time of writing, ACM is ranked the 570th cryptocurrency globally and the current price is A$19.44. Let’s take a look at the chart below for price analysis:

Source: TradingView

After looking at the above 1-Day candle chart, we can clearly see that ACM was trading inside the rising wedge pattern on the ACM/USDT pair. The first resistance was on the A$13.82 price level, which ACM broke with a strong bullish trend buying volume and is now heading towards the recent high price at A$20.17. Seeing that many Altcoins are holding a strong position this week after the recent bitcoin price crash, ACM may continue to increase in the uptrend if traders keep buying with high volume.

“The Rising Wedge is a bearish pattern that begins wide at the bottom and contracts as prices move higher and the trading range narrows. As a reversal pattern, the rising wedge will slope up and with the prevailing trend.”

What Do the Technical Indicators Say?

The ACM TradingView indicators (on the 1 day) mainly indicate ACM as a Strong Buy, except the Oscillators which indicate ACM as a Buy.

So Why Did ACM Breakout?

General market sentiment seems to suggest cryptos are hopefully turning back bull run season after recent price corrections. Another reason for this sudden pump in price could be whales secretly buying ACM for the coming Altcoins rally. Recent news was also announced regarding the Partnership between FTX and Chiliz.

Where to Buy or Trade ACM?

ACM has the highest liquidity on Binance Exchange so that would help for trading ACM/BTC or ACM/USDT pairs. And if you’re looking at buying and HODLing cryptos, then Swyftx Exchange is an easy-to-use popular choice in Australia.

Categories
Crypto News IOTA Market Analysis Trading

Top 3 Coins To Watch Today: IOTA, ONE, WAN – September 15 Trading Analysis

Let’s take a closer look at today’s altcoins showing breakout signals. We’ll explain what the coin is, then dive into the trading charts and provide some analysis to help you decide.

1. IOTA (MIOTA)

IOTA is a distributed ledger with one big difference: it isn’t actually a blockchain. Instead, its proprietary technology is known as Tangle, a system of nodes that confirm transactions. The foundation behind the platform says this offers far greater speeds than conventional blockchains – and an ideal footprint for the ever-expanding Internet of Things ecosystem.

IOTA Price Analysis

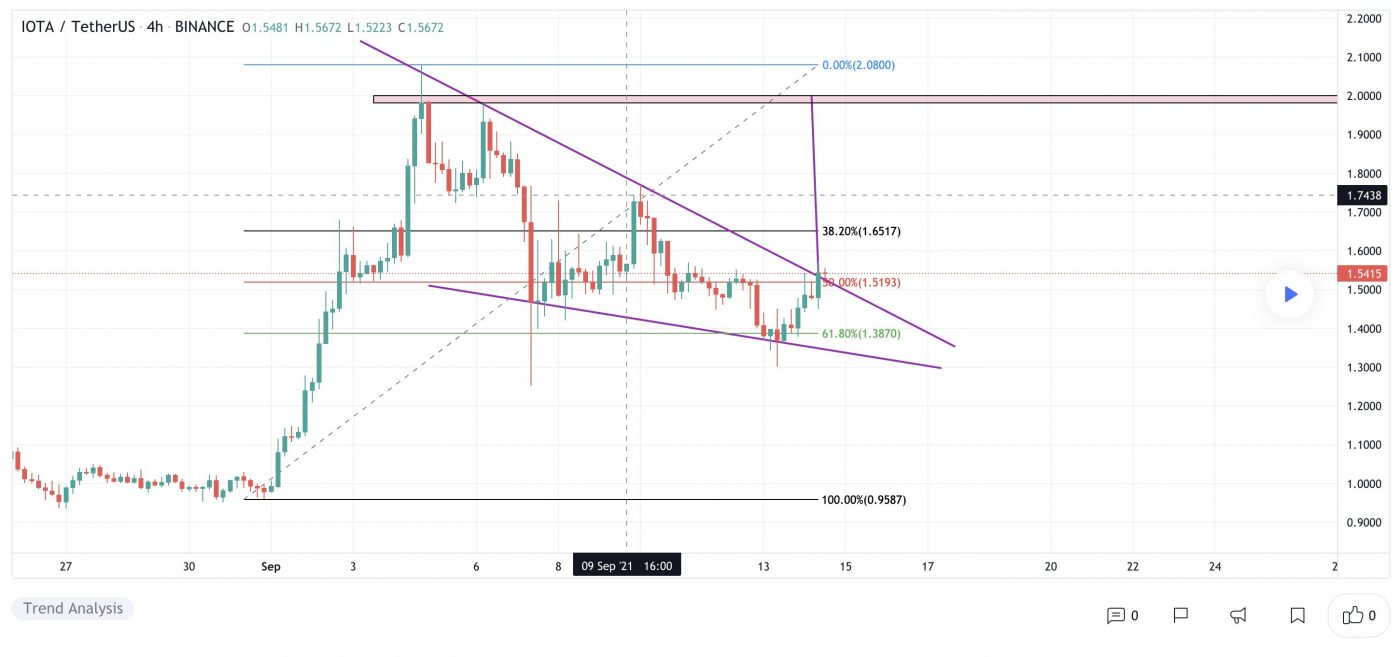
At the time of writing, IOTA is ranked the 40th cryptocurrency globally and the current price is A$1.53. Let’s take a look at the chart below for price analysis:

Source: TradingView

After a 61% decline from May to June, IOTA has ranged between A$1.24 and A$1.03.

The recent rally is approaching probable resistance near A$1.72 – but could be aiming for stops above the relatively equal highs near A$1.79. Continuation of the bullish move could target the daily gap near A$1.87.

Aggressive bulls might add to positions near A$1.47 and A$1.44. Price action near A$1.40 may be more likely to provide support – if the price reaches it – during any retracements.

Relatively equal lows clustered around A$1.38 seem likely to be swept if the bearish trend resumes. If this move occurs, the price might find support at the significant higher-timeframe level near A$1.32.

2. Harmony (ONE)

Harmony ONE is a blockchain platform designed to facilitate the creation and use of decentralised applications (DApps). The network aims to innovate the way decentralised applications work by focusing on random state sharding, which allows creating blocks in seconds. Focusing on processing speed and validation, the Harmony mainnet aims to revolutionise block creation. By introducing the sharding process, the company reduced node validation times significantly.

ONE Price Analysis

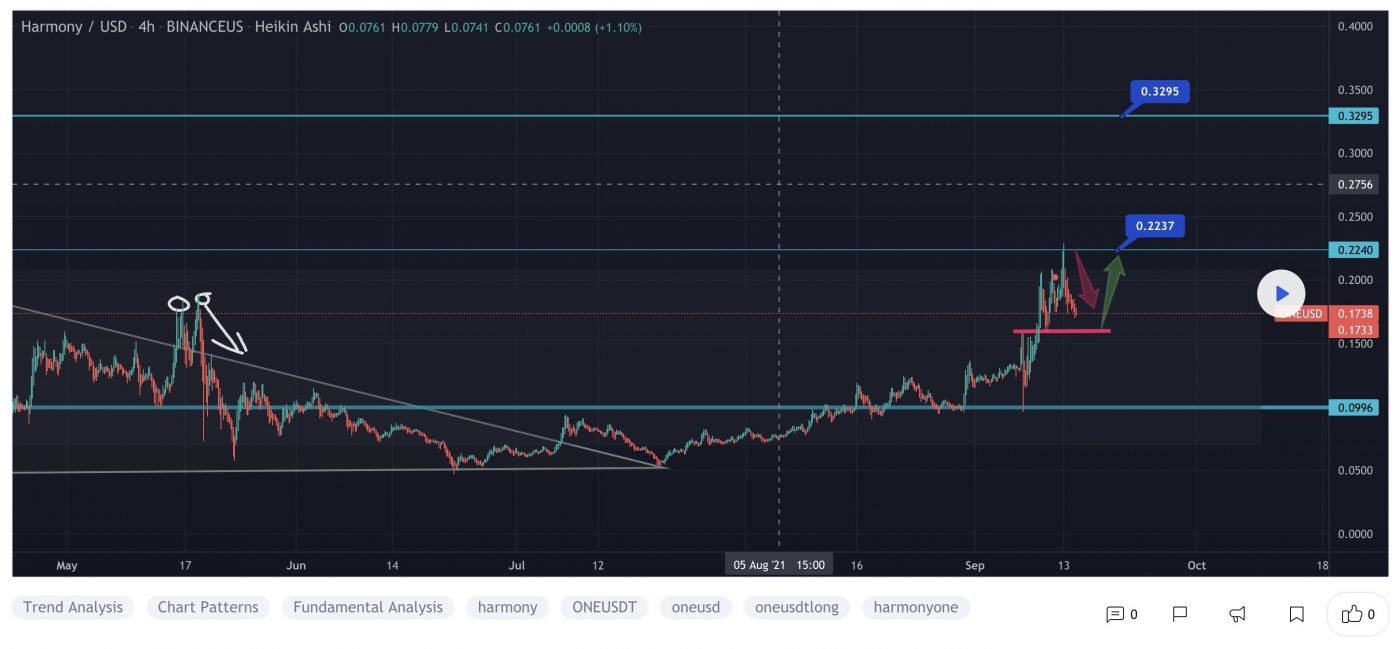
At the time of writing, ONE is ranked the 67th cryptocurrency globally and the current price is A$0.1728. Let’s take a look at the chart below for price analysis:

Source: TradingView

ONE‘s 85% retracement from its May highs set a low near A$0.0922 during its consolidation that began in July.

Relatively equal highs near A$0.1855 could be the current target if the price breaks through resistance beginning near A$0.1903. Bullish continuation might reach through the next significant swing high near A$0.2158 into the daily gap near A$0.2496.

If bullish strength continues, the zones just below the monthly open near A$0.2530 and A$0.2614 could halt any retracement. 

A bearish shift in the market might seek the relatively equal lows near A$0.1624 into possible support near A$0.1588. If this down move occurs, the swing low near A$0.1436 and possible support near A$0.1369 may be the primary objective.

3. Wanchain (WAN)

Wanchain WAN is a distributed ledger that allows for cross-chain transactions and the interoperability of multiple chains. Although Wanchain facilitates transactions between blockchains, it is also a stand-alone blockchain that runs autonomously. The protocol acts as a distributed ledger that processes and maintains records of cross-chain transactions.

WAN Price Analysis

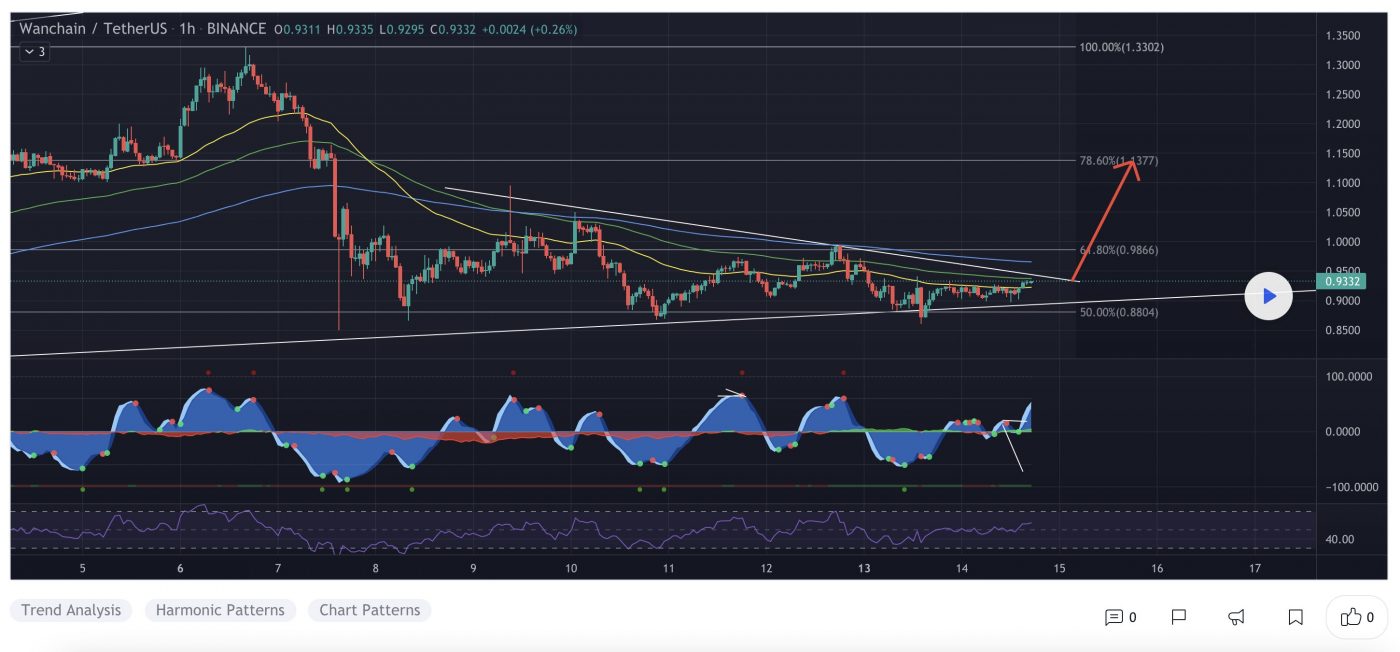
At the time of writing, WAN is ranked the 294th cryptocurrency globally and the current price is A$1.27. Let’s take a look at the chart below for price analysis:

Source: TradingView

After retracing nearly 70% from its May high, WAN set a low near A$0.9542 as it formed its current range.

Last week, the price swept highs near A$1.53, which now also marks the September monthly high. Relatively equal daily highs near A$1.35 provide a reasonable target, although resistance beginning near $1.37 could cap the move. A break of this resistance is likely to target the swing high near A$1.45 into higher-timeframe resistance beginning near A$1.42.

The current area near A$1.25 could provide support, although bulls may be more likely to buy near the price fractal near A$1.20 if a retracement reaches this level. A break of this area could continue down to sweep the July low near A$1.17 into possible support beginning near A$1.13.

Where to Buy or Trade Altcoins?

These coins have high liquidity on Binance Exchange, so that could help with trading on AUD/USDT/BTC pairs. And if you’re looking at buying and HODLing cryptos, then Swyftx Exchange is an easy-to-use popular choice in Australia.
Categories
Crypto News Market Analysis Tezos Trading

Top 3 Coins To Watch Today: XTZ, RSR, DYDX – September 14 Trading Analysis

Let’s take a closer look at today’s altcoins showing breakout signals. We’ll explain what the coin is, then dive into the trading charts and provide some analysis to help you decide.

1. Tezos (XTZ)

Tezos XTZ is a blockchain network that’s based on smart contracts, in a way that’s not too dissimilar to Ethereum. However, there’s a big difference: Tezos aims to offer infrastructure that is more advanced – meaning it can evolve and improve over time without there ever being a danger of a hard fork, something both Bitcoin and Ethereum have suffered since they were created. People who hold XTZ can vote on proposals for protocol upgrades that have been put forward by Tezos developers.

XTZ Price Analysis

At the time of writing, XTZ is ranked the 30th cryptocurrency globally and the current price is A$10.33. Let’s take a look at the chart below for price analysis:

Source: TradingView

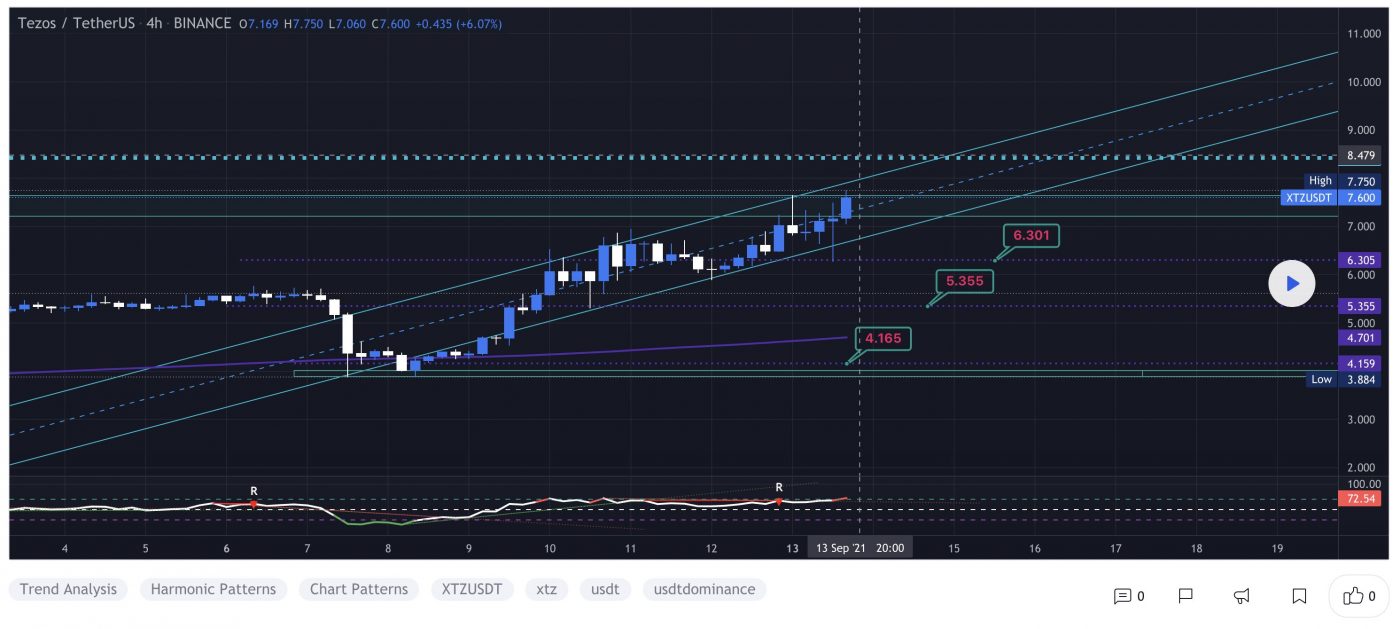
XTZ‘s 255% rally since mid-July saw a second leg after last Tuesday’s market-wide drop ran the previous consolidation’s stops.

The level near A$10.29 is providing some resistance. However, continuation through the all-time high at A$11.44 is not out of the question. Aggressive bulls might bid in the current region near A$9.45. 

If the price runs the recent swing low, bulls might bid in the gap near A$8.02. A deeper retracement could reach near the September monthly open and a gap near A$7.05. The region near A$5.29 and A$4.87 may also provide some support during a deeper retracement.

Beyond the May highs, little exists to frame probable bullish targets. Extensions suggest that the areas near A$12.91, A$14.27 and A$16.03 could provide some resistance.

2. Reserve Rights (RSR)

Reserve Rights RSR is a dual-token stablecoin platform that was launched in May 2019 following a successful initial exchange offering (IEO) on the Huobi Prime platform. Reserve Rights’ dual token setup includes a stablecoin known as the Reserve stablecoin (RSV), which is backed by a basket of assets managed by smart contracts. The second token is the Reserve Rights token (RSR), which is used to keep the RSV stable at its $1.00 price target through a system of arbitrage opportunities

RSR Price Analysis

At the time of writing, RSR is ranked the 134th cryptocurrency globally and the current price is A$0.03483. Let’s take a look at the chart below for price analysis:

Source: TradingView

RSR‘s late-August rally has retraced approximately 42% as the price hovers over possible support beginning near A$0.047.

The significant number of lows in this area will likely see a stop run before any potential move higher. The gap at A$0.043 could provide support for a shallow stop run. 

However, lows near A$0.039 also provide a tempting downside target if bitcoin begins a bearish trend. Under these lows, bulls might find support near A$0.036 – or as low as A$0.029 if the market sees a sustained bearish move.

The confluence of levels near A$0.058 that surround the September monthly open may provide some resistance, particularly if reached before a run of the lows near A$0.047. 

Should the bullish trend resume, A$0.070 may provide some resistance before running the swing highs at A$0.073 and A$0.083. Looking higher, A$0.092 and A$0.12 may also provide resistance in the future.

3. Dydx (DYDX)

DYDX is a governance token that allows the dYdX community to truly govern the dYdX Layer 2 Protocol. By enabling shared control of the protocol, DYDX allows traders, liquidity providers and partners of dYdX to work collectively towards an enhanced Protocol. DYDX enables a robust ecosystem around governance, rewards and staking, each designed to drive future growth and decentralisation of dYdX, resulting in a better experience for users.

DYDX Price Analysis

At the time of writing, DYDX is ranked the 224th cryptocurrency globally and the current price is A$13.72. Let’s take a look at the chart below for price analysis:

Source: TradingView

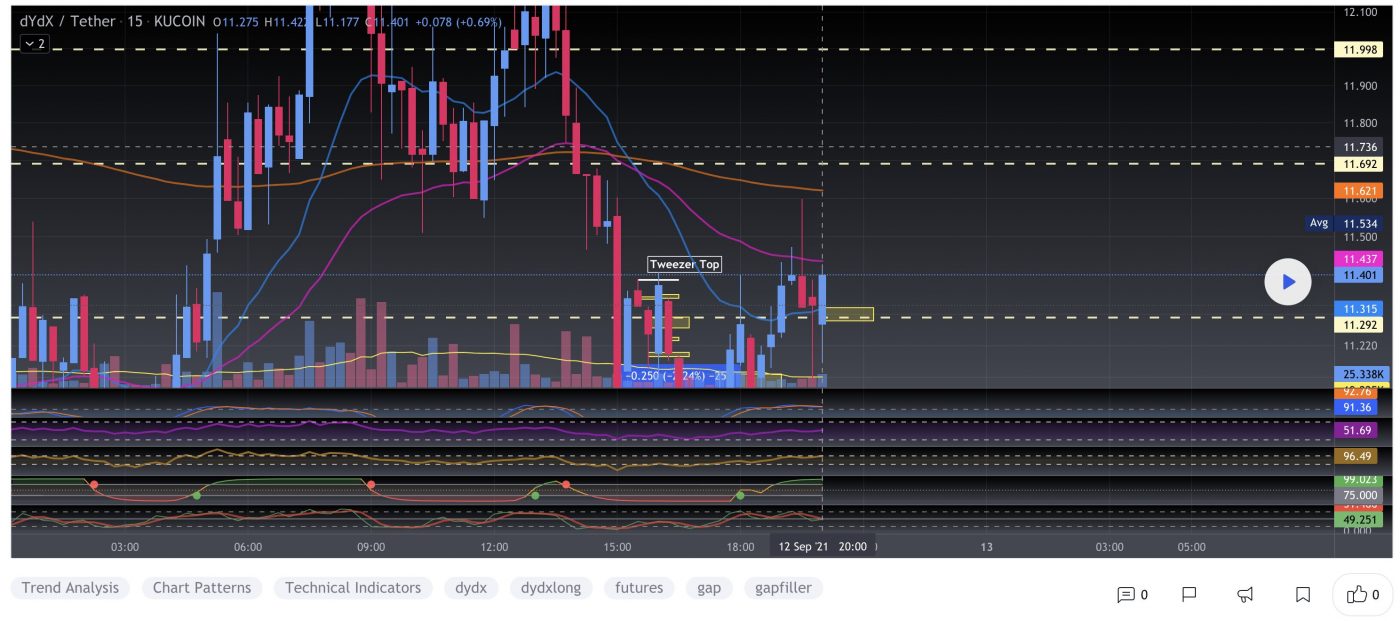
DYDX consolidates between A$22.32 and A$13.35 with the bulk of the volume concentrated in the lower half of the range. The price does not indicate a clear longer-term direction yet as stop orders build on both sides of the range.

Range traders will likely take profits or sell near A$16.53. A stop run and swift rejection above A$17.34 could provide a more favourable risk-to-reward entry for bears. An old 4h gap around A$18.34 might cap this stop run.

Bulls will likely accumulate more long positions on a run below the relatively equal lows near A$13.35. Little exists below the current range to identify precise support levels. However, the area between A$9.51 and A$10.87 could also give support during a deeper stop run.

If the price does break out decisively to the upside, the swing high at A$19.70 provides a reasonable target. The highs and daily resistance levels between A$21.47 and A$22.32 may provide a second target.

Where to Buy or Trade Altcoins?

These coins have high liquidity on Binance Exchange, so that could help with trading on AUD/USDT/BTC pairs. And if you’re looking at buying and HODLing cryptos, then Swyftx Exchange is an easy-to-use popular choice in Australia.
Categories
Crypto News Market Analysis Solana Trading

Top 3 Coins To Watch Today: SOL, ROSE, LUNA – September 13 Trading Analysis

Let’s take a closer look at today’s altcoins showing breakout signals. We’ll explain what the coin is, then dive into the trading charts and provide some analysis to help you decide.

1. Solana (SOL)

Solana SOL is a highly functional open source project that banks on blockchain technology’s permissionless nature to provide decentralised finance (DeFi) solutions. While the idea and initial work on the project began in 2017, The Solana protocol is designed to facilitate decentralised app (DApp) creation. It aims to improve scalability by introducing a proof-of-history (PoH) consensus combined with the underlying proof-of-stake (PoS) consensus of the blockchain.

SOL Price Analysis

At the time of writing, SOL is ranked the 6th cryptocurrency globally and the current price is A$239.20. Let’s take a look at the chart below for price analysis:

Source: TradingView

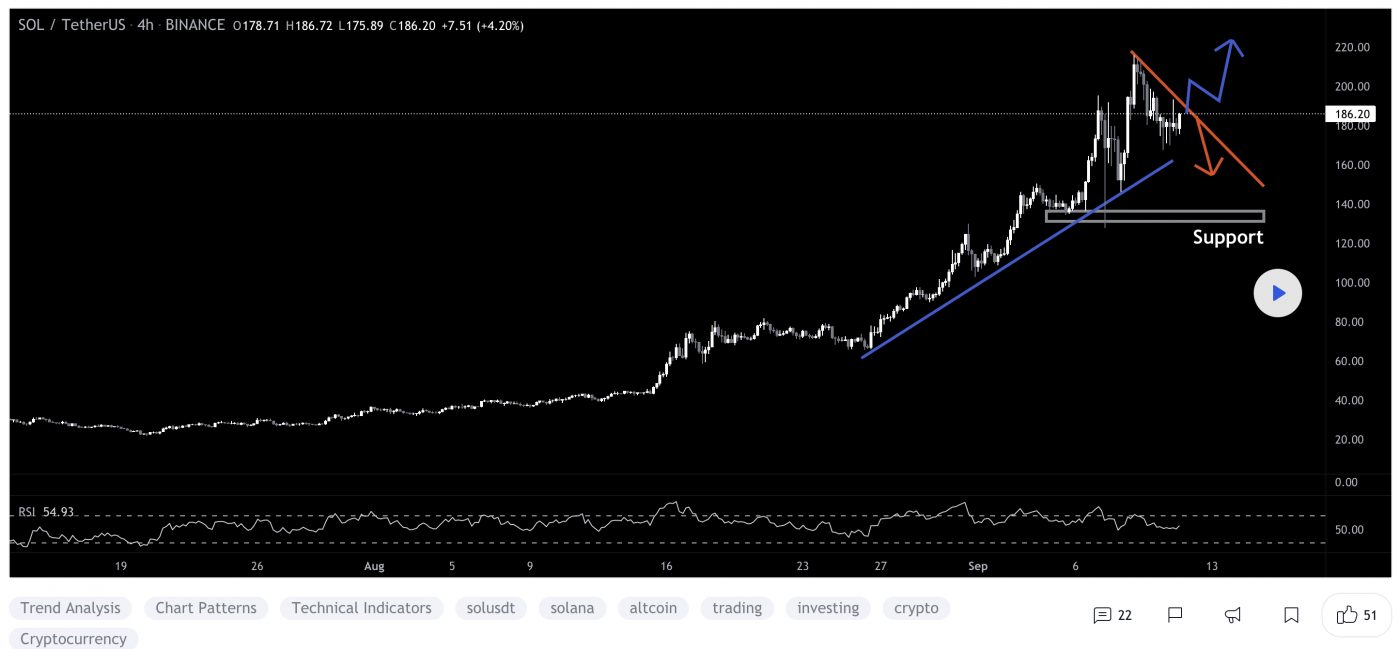
SOL formed relatively equal lows near A$89.56 after dropping over 61% during August. These lows could provide the target for another leg down, possibly finding support in the monthly gap of around A$75.21.

If this sweep of the A$224.31 swing lows occurs, more aggressive bulls might begin bidding the weekly level near the swing low around A$215.43. Should the market take a more bullish turn, the level just below near A$206.77 could provide some short-term support.

The steep drop left large areas of inefficient price action, making the daily gap up to A$262.99 likely to be touched or filled. A sustained move through this resistance could visit a significant area on the monthly and weekly chart near A$287.09.

2. Oasis Network (ROSE)

The Oasis Network ROSE is the first privacy-enabled blockchain platform for open finance and a responsible data economy. Combined with its high throughput and secure architecture, the Oasis Network is able to power private, scalable DeFi, revolutionising Open Finance and expanding it beyond traders and early adopters to a mass market. Its unique privacy features can not only redefine DeFi but also create a new type of digital asset called Tokenised Data that can enable users to take control of the data they generate and earn rewards for staking it with applications – creating the first-ever responsible data economy.

ROSE Price Analysis

At the time of writing, ROSE is ranked the 154th cryptocurrency globally and the current price is A$0.3523. Let’s take a look at the chart below for price analysis:

Source: TradingView

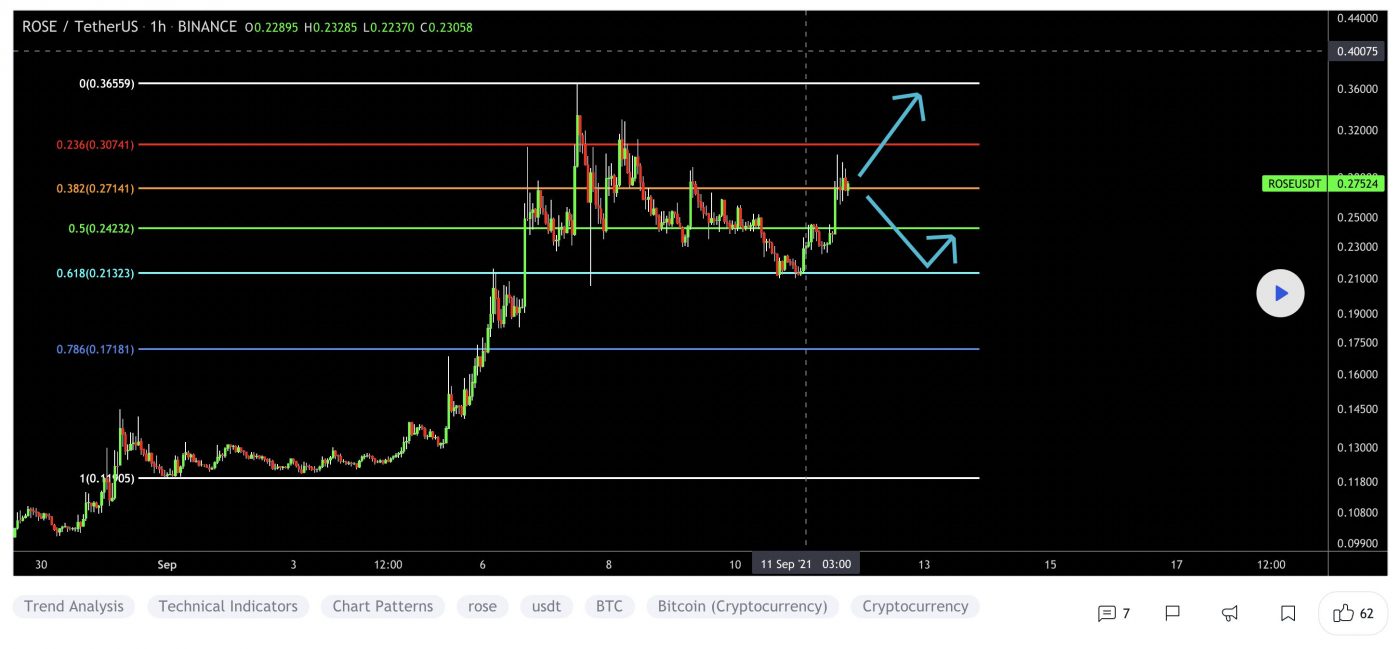
ROSE has dropped nearly 77% since late March and found a low in late May, with price action now trending upward through a higher-timeframe range.

The area beginning near A$0.3944 has provided strong resistance and may do so again. However, relatively equal highs near A$0.3712 offer a tempting target for bulls. A run of these highs may reach up into the daily gap near A$0.3814.

Aggressive bulls might add to their positions near A$0.3178. If the price breaks through this level, it may be reaching for the cluster of swing lows near A$0.2954 and A$0.2605. A more substantial move down may run stops below the relatively equal June and July lows, around A$0.2466, into the daily gap at this level.

3. Terra (LUNA)

Terra LUNA is a blockchain protocol that uses fiat-pegged stablecoins to power price-stable global payments systems. According to its white paper, Terra combines the price stability and wide adoption of fiat currencies with the censorship-resistance of Bitcoin and offers fast and affordable settlements. Terra’s native token, LUNA, is used to stabilise the price of the protocol’s stablecoins. LUNA holders are also able to submit and vote on governance proposals.

LUNA Price Analysis

At the time of writing, LUNA is ranked the 11th cryptocurrency globally and the current price is A$53.15. Let’s take a look at the chart below for price analysis:

Source: TradingView

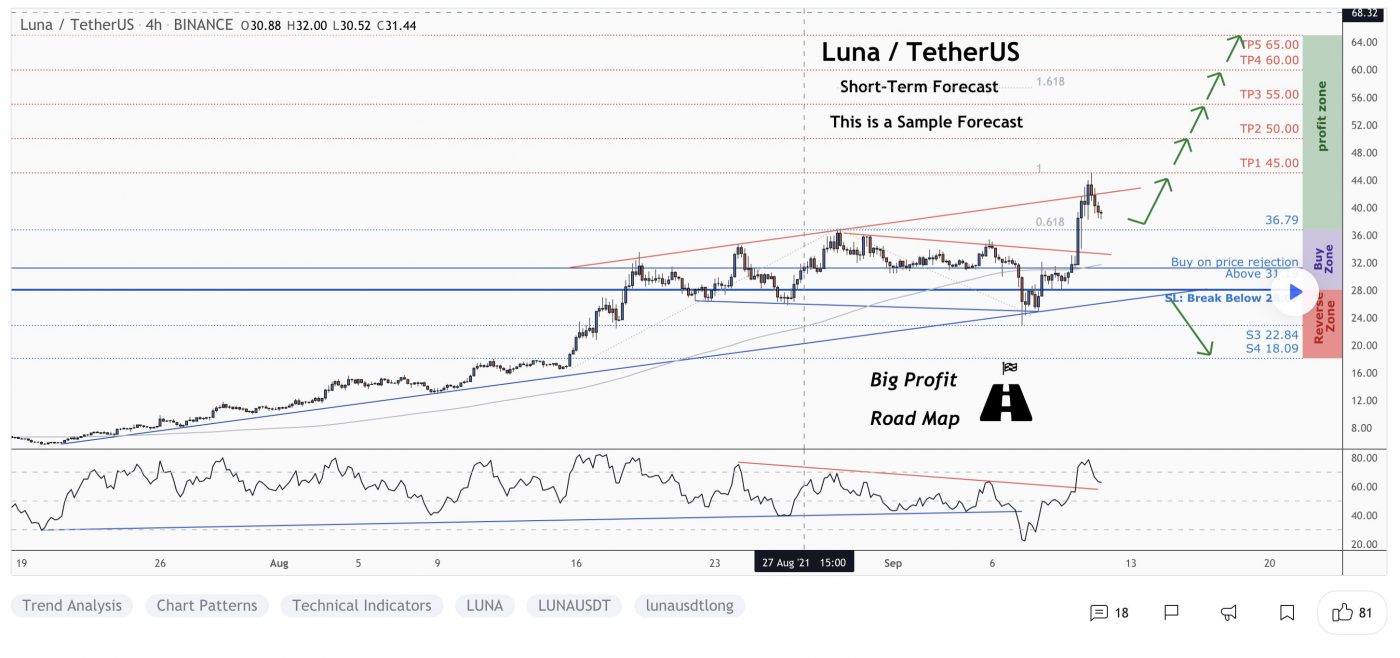
LUNA has been trading through a massive range since August, with the price showing mild bullishness during September.

Bulls bought at a price level near A$43.75. The weekly level and daily gap near A$48.33 could prompt buyers to step in again as the price challenges the swing high and resistance around A$56.19. A strong move and acceptance above this level may reach for the swing highs at A$58.14 and $61.34, which marks another area of resistance.

However, rejection from the current area may send the price down to retest support near A$48.63. Relatively equal lows around A$47.00 provide a rich target for a stop run. Sustained bearishness may reach a low near A$45.97 and possibly as low as A$42.85 into higher-timeframe support.

Where to Buy or Trade Altcoins?

These coins have high liquidity on Binance Exchange, so that could help with trading on AUD/USDT/BTC pairs. And if you’re looking at buying and HODLing cryptos, then Swyftx Exchange is an easy-to-use popular choice in Australia.
Categories
Crypto News Market Analysis Trading

POND Surges +165% in a Single Day after Marlin Partners with Commonwealth to Build a Decentralised Community

Marlin POND is trading in an uptrend, like many other Altcoins. The cryptocurrency POND just went up +165% in a single day by breaking a rising wedge pattern with strong buying volume on multiple exchanges and surges over +203% in a week.

What is Marlin?

Marlin POND is an open protocol that provides high-performance programmable network infrastructure for DeFi and Web 3.0. The nodes in the Marlin network, called Meta nodes, operate the MarlinVM, which provides a virtual router interface for developers to deploy customised overlays and perform edge computations. Its native utility token POND is used for running validator nodes on the network via staking, and voting on governance proposals to determine how network resources are allocated.

POND Price Analysis

At the time of writing, POND is ranked the 374th cryptocurrency globally and the current price is A$0.1905. Let’s take a look at the chart below for price analysis:

Source: TradingView

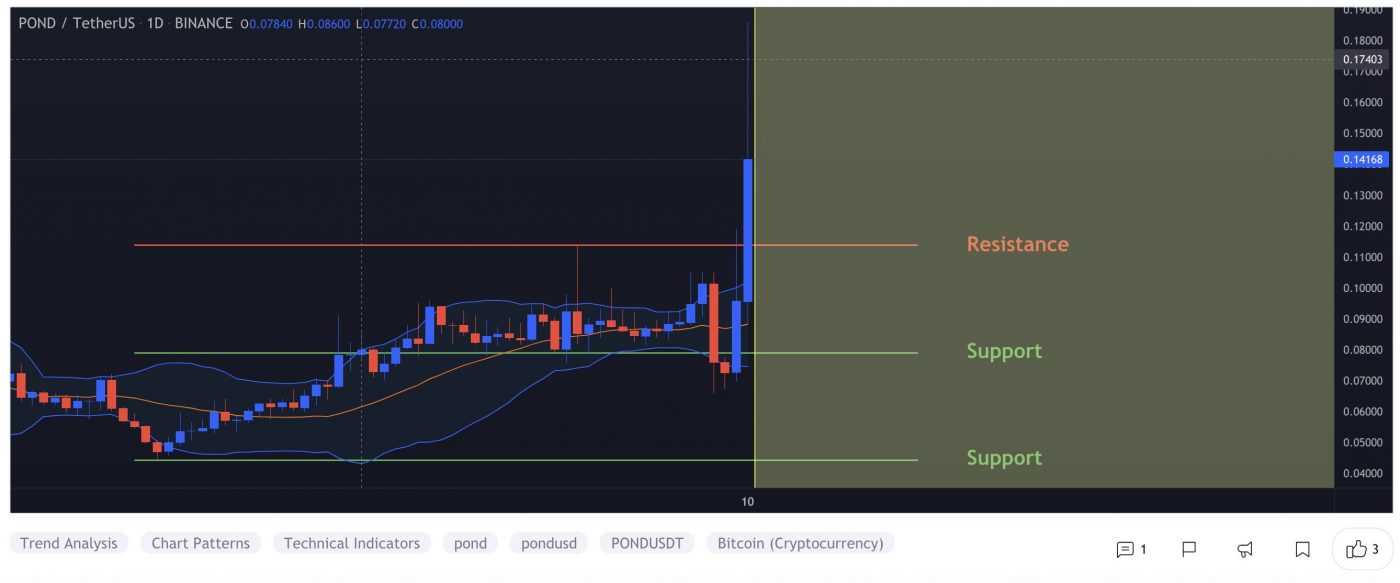
After looking at the above 1-Day candle chart, we can clearly see that POND was trading inside the rising wedge pattern on the POND/USDT pair. The first resistance was on the A$0.1297 price level, which POND broke with a strong bullish trend buying volume and is now heading towards the recent high price at A$0.2105. Seeing that many Altcoins are holding a strong position this week after the recent bitcoin price crash, POND may continue to increase in the uptrend if traders keep buying with high volume.

“The Rising Wedge is a bearish pattern that begins wide at the bottom and contracts as prices move higher and the trading range narrows. As a reversal pattern, the rising wedge will slope up and with the prevailing trend.”

What Do the Technical Indicators Say?

The POND TradingView indicators (on the 1 day) mainly indicate POND as a Strong Buy, except the Oscillators which indicate POND as a Buy.

So Why Did POND Breakout?

General market sentiment seems to suggest cryptos are hopefully turning back bull run season after recent price corrections. Another reason for this sudden pump in price could be whales secretly buying POND for the coming Altcoins rally. Recent news was also announced regarding some project enhancements and other pertinent topics.

Currently, it is very important to increase communication efficiency. However, in the century of technology, it seems that blockchains will play a great role in the decentralised economy and should be trusted by the people. So, the main goal of the Marlin is to contribute to increasing the rapidity of Web 3 and also make it more safe and reliable by changing the architecture of networking under blockchains.

Where to Buy or Trade POND?

POND has the highest liquidity on Binance Exchange so that would help for trading POND/BTC or POND/USDT pairs. However, you can also buy POND from different exchanges listed on Coinmarketcap.

Categories
Crypto News Dent ICON Market Analysis Trading TRON

Top 3 Coins To Watch Today: DENT, TRX, ICX – September 10 Trading Analysis

Let’s take a closer look at today’s altcoins showing breakout signals. We’ll explain what the coin is, then dive into the trading charts and provide some analysis to help you decide.

1. Dent (DENT)

Dent is a revolutionary digital mobile operator offering eSIM cards, mobile data plans, call minutes top-ups, and a roaming-free experience. According to the company website, Dent employs blockchain technology’s powers to create a global marketplace for mobile data liberalisation. Dent has an ambitious roadmap ahead, with plans to expand its services to new markets by the end of 2021. The company has already attracted more than 25 million mobile device users, and Dent services are available in more than 140 countries.

DENT Price Analysis

At the time of writing, DENT is ranked the 126th cryptocurrency globally and the current price is A$0.005217. Let’s take a look at the chart below for price analysis:

Source: TradingView

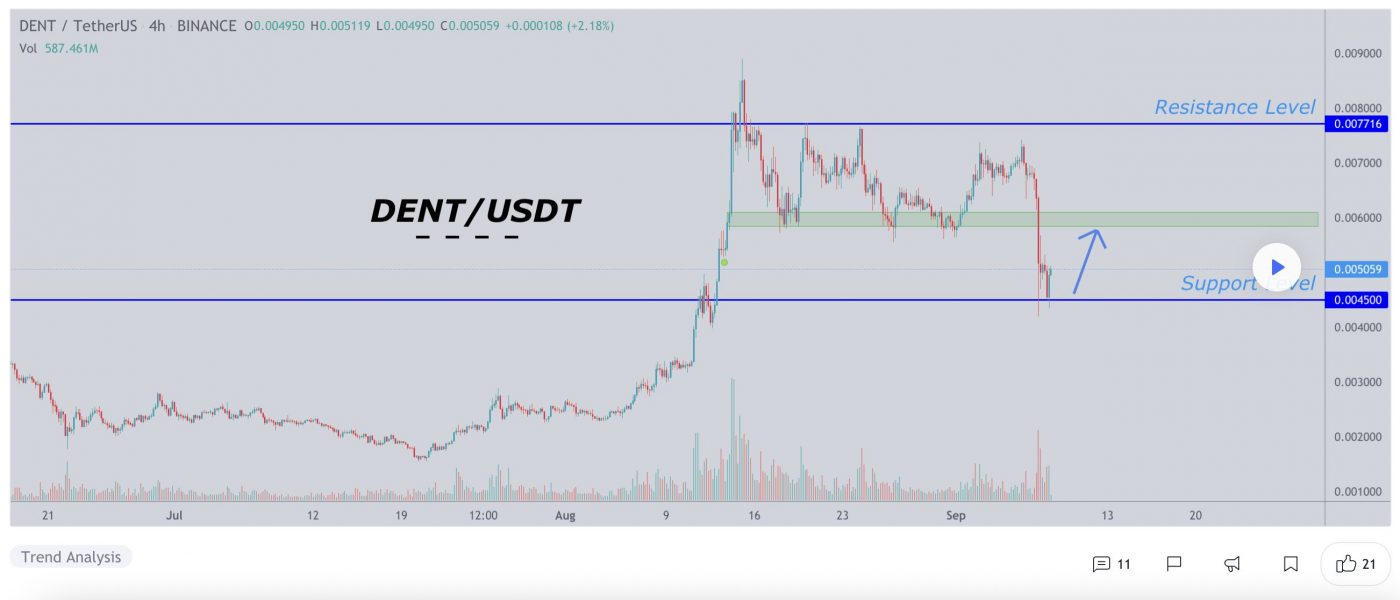
After dropping nearly 60% in less than two weeks, DENT found a low just above the monthly gap near A$0.005187. Since then, the price has been consolidating in a range between A$0.004833 and A$0.005439.

The weekly level near A$0.005121 may continue to provide support during a run on the local swing lows. The monthly gap beginning near A$0.004975 will likely give the next higher-timeframe support if this level fails.

The price is currently chewing into potentially strong resistance near A$0.005297. A sweep of the relatively equal highs near A$0.005428, and a daily close above this level, could signal a move to the next set of relatively equal highs near A$0.005736. 

Just above these highs, probable resistance rests near A$0.006143, which may cap the price until the market moves out of consolidation. However, any significant bullish shift in market conditions during the next few weeks could help bulls reach the swing high near A$0.006482, running stops into probable resistance near A$0.006733.

2. Tron (TRX)

Tron TRX is a blockchain-based operating system that aims to ensure this technology is suitable for daily use. Whereas Bitcoin can handle up to six transactions per second, and Ethereum up to 25, TRON claims that its network has a capacity for 2,000 TPS. This project is best described as a decentralised platform focused on content sharing and entertainment and to this end, one of its biggest acquisitions was the file-sharing service BitTorrent in 2018. Overall, TRON has divided its goals into six phases. These include delivering simple distributed file sharing, driving content creation through financial rewards.

TRX Price Analysis

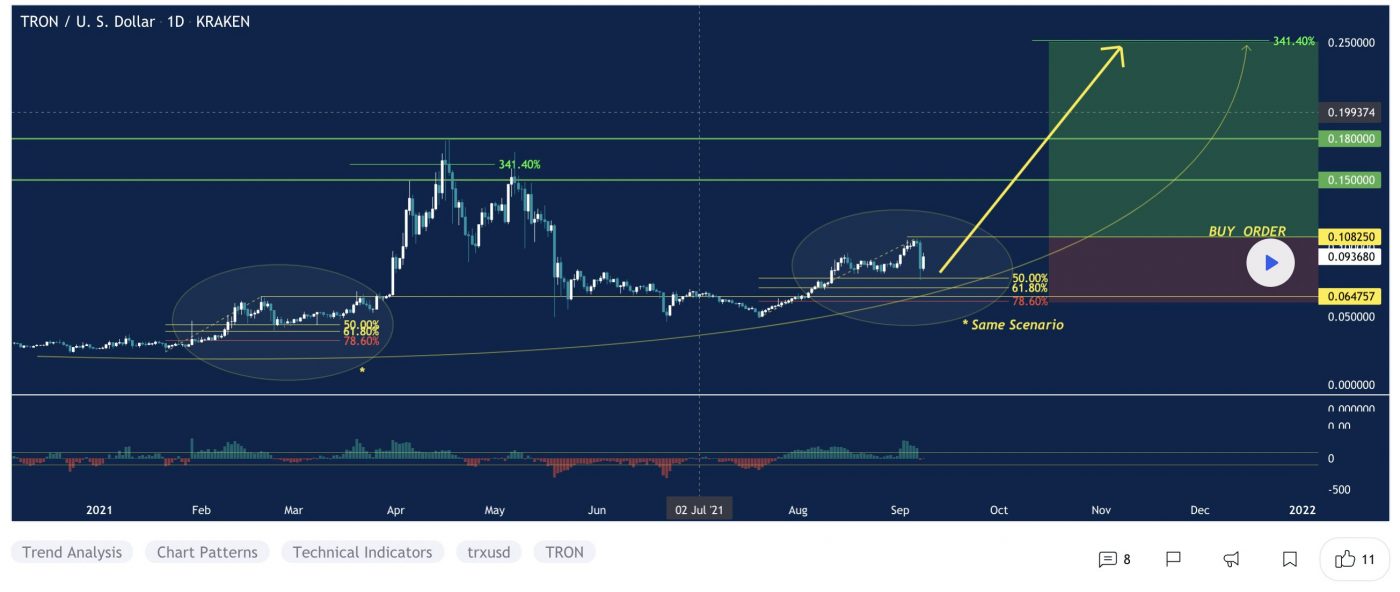
At the time of writing, TRX is ranked the 28th cryptocurrency globally and the current price is A$0.09369. Let’s take a look at the chart below for price analysis:

Source: TradingView

TRX accompanied the rest of the market in the mid-Q2 drop, falling nearly 73% from its mid-May high until it found a low late in June.

Price action in late June formed a weekly support level near A$0.08654, which has so far held up the price. The most recent swing low inside this range, near A$0.08439, might be the target for any future stop runs. After this low, the swing low near A$0.08229 and the gap beginning near A$0.07955 mark possible higher-timeframe support.

The price is currently battling with significant higher-timeframe resistance levels, with the closest probable resistance resting near A$0.09422, just over the July monthly open. A sweep of the relatively equal highs above this resistance might find sellers near A$0.09735 – but could reach as high as A$0.1087.

3. Icon (ICX)

Icon ICX is a decentralised blockchain network focused on interoperability. With ICON’s “blockchain transmission protocol”, independent blockchains like Bitcoin and Ethereum can connect and transact with each other. This opens up cross-chain use cases that are impossible without an interoperability layer like ICON. The ICON Network is powered by a proprietary blockchain engine called ‘loopchain’, which has the ability to handle hundreds of transactions per second. 

ICX Price Analysis

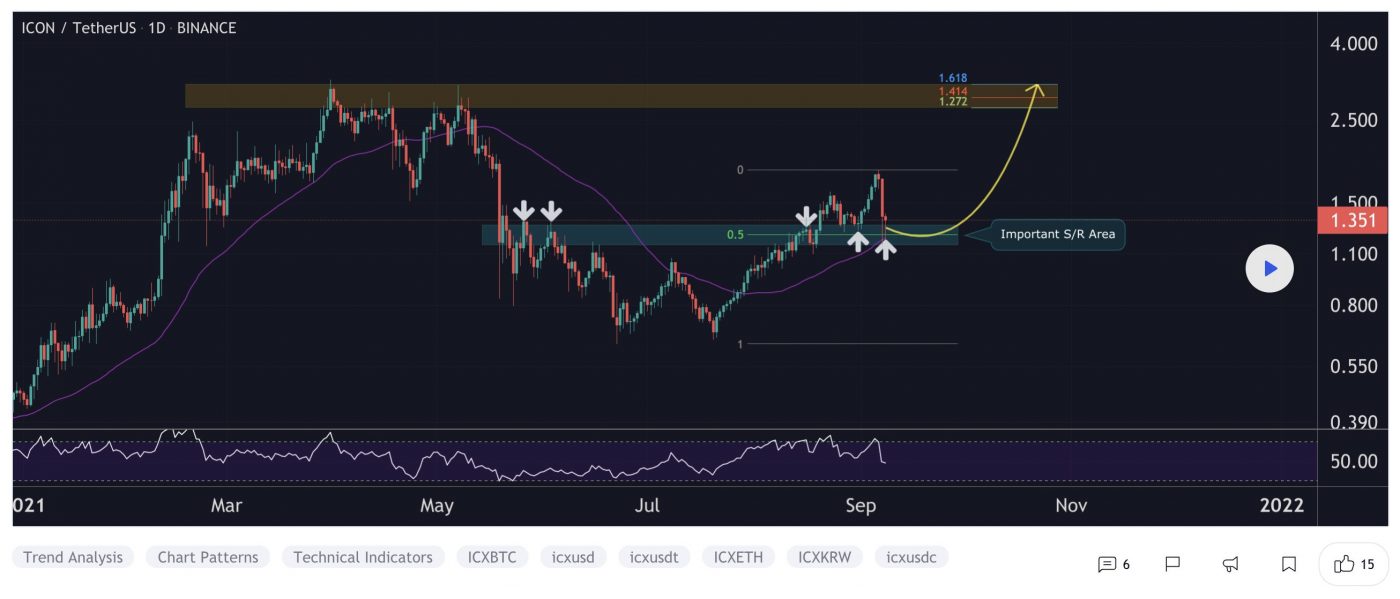
At the time of writing, ICX is ranked the 94th cryptocurrency globally and the current price is A$1.62. Let’s take a look at the chart below for price analysis:

Source: TradingView

ICX has been trading through a massive range since June, with the price showing mild bullishness during August.

The breaks of the swing highs at A$1.60 and A$1.65 led to support forming near A$1.57. Some bulls will likely wait for a more favourable entry on a potential stop run that could reach near A$1.53. 

If the support near A$1.59 continues to hold, the recent swing high at A$1.68 is the likely next short-term target. This potential bullish swing might end with a run on short stops up to A$1.73 and A$1.75. 

Higher-timeframe resistance between A$1.77 and A$1.79 may cap any move upwards until the overall market becomes more bullish. However, any significant bearish move in bitcoin will likely push the price down toward the low and possible support near A$1.56.

Where to Buy or Trade Altcoins?

These coins have high liquidity on Binance Exchange, so that could help with trading on AUD/USDT/BTC pairs. And if you’re looking at buying and HODLing cryptos, then Swyftx Exchange is an easy-to-use popular choice in Australia.

Categories
Bitcoin Crypto Exchange Crypto News Ethereum Trading

Over $3.7 Billion Liquidated as Bitcoin Tanks Below $46,000 – What Happened?

Over US$3.7 billion worth of crypto positions were suddenly liquidated this week as Bitcoin (BTC) and major altcoins tanked. The market downturn was preceded by a flash selloff mostly in bitcoin, which resulted in an 11.6 percent drop in the overall cryptocurrency market capitalisation, down to US$2.16 billion over the past 24 hours. 

According to data from Bybt, US$3.71 billion worth of crypto futures positions were liquidated in 24 hours. A total of 375,824 traders were forced out of the market as they got overleveraged due to the sudden drop in crypto prices. The single largest liquidation (US$43.7 million) happened on the Huobi-BTC market. 

The total value of bitcoin liquidated at the time was US$1.39 billion. Within two hours, the price of BTC tanked by 11 percent, from US$51,101 to $45,299 on Coingecko. However, major crypto exchanges Binance and Coinbase recorded as low as US$42,900 and U$42,850, respectively.

Major altcoins that were significantly affected in the flash crash include Ether (US$928.7 million), Ripple ($223.78 million), Solana ($95.1 million) and Cardano ($84.28 million).

This incident comes as a reminder of how risky leveraged trading can be, noting that it can amplify profits and losses in trading.

What Happened?

The flash crash on September 7 came as a shock to many crypto investors, given the day was supposed to be bullish as El Salvador officially legalised bitcoin. In addition to market volatility, many experts said bitcoin dropped because the El Salvador news was already priced in. Crypto researcher Larry Cermak also pointed out one possible reason was that the funding rates for altcoins were spiking too much:

Categories
Crypto News IOTA Market Analysis Trading

Top 3 Coins To Watch Today: IOTA, DOT, FIL – September 9 Trading Analysis

Let’s take a closer look at today’s altcoins showing breakout signals. We’ll explain what the coin is, then dive into the trading charts and provide some analysis to help you decide.

1. IOTA (MIOTA)

IOTA is a distributed ledger with one big difference: it isn’t actually a blockchain. Instead, its proprietary technology is known as Tangle, a system of nodes that confirm transactions. The foundation behind this platform says this offers far greater speeds than conventional blockchains – and an ideal footprint for the ever-expanding Internet of Things ecosystem.

IOTA Price Analysis

At the time of writing, IOTA is ranked the 36th cryptocurrency globally and the current price is A$2.14. Let’s take a look at the chart below for price analysis:

Source: TradingView

Since the beginning of June, IOTA has been in a gentle downtrend. The future likely holds more stop runs and erratic volatility until the chart forms more substantial high-timeframe levels.

A retracement might uncover support near A$1.33, which is the daily high of the last swing low. The high of the wick beginning near A$1.78 may also provide support. However, bulls will likely remain wary of the current downtrend, making the low at A$1.89 likely to be the next bearish target.

Just above, the daily gap beginning near A$2.28 may provide resistance to bulls, possibly marking a future range high. A push through this level is likely to target the swing high near A$2.39 – perhaps running to probable resistance near A$2.47. Strength above this level might signal the start of a bullish trend, encouraging bulls to “buy the dip”.

2. Polkadot (DOT)

Polkadot DOT is an open-source sharding multichain protocol that facilitates the cross-chain transfer of any data or asset types, not just tokens, thereby making a wide range of blockchains interoperable with each other. This interoperability seeks to establish a fully decentralised and private web, controlled by its users, and simplify the creation of new applications, institutions and services. The Polkadot protocol connects public and private chains, permissionless networks, oracles and future technologies, allowing these independent blockchains to trustlessly share information and transactions through the Polkadot relay chain.

DOT Price Analysis

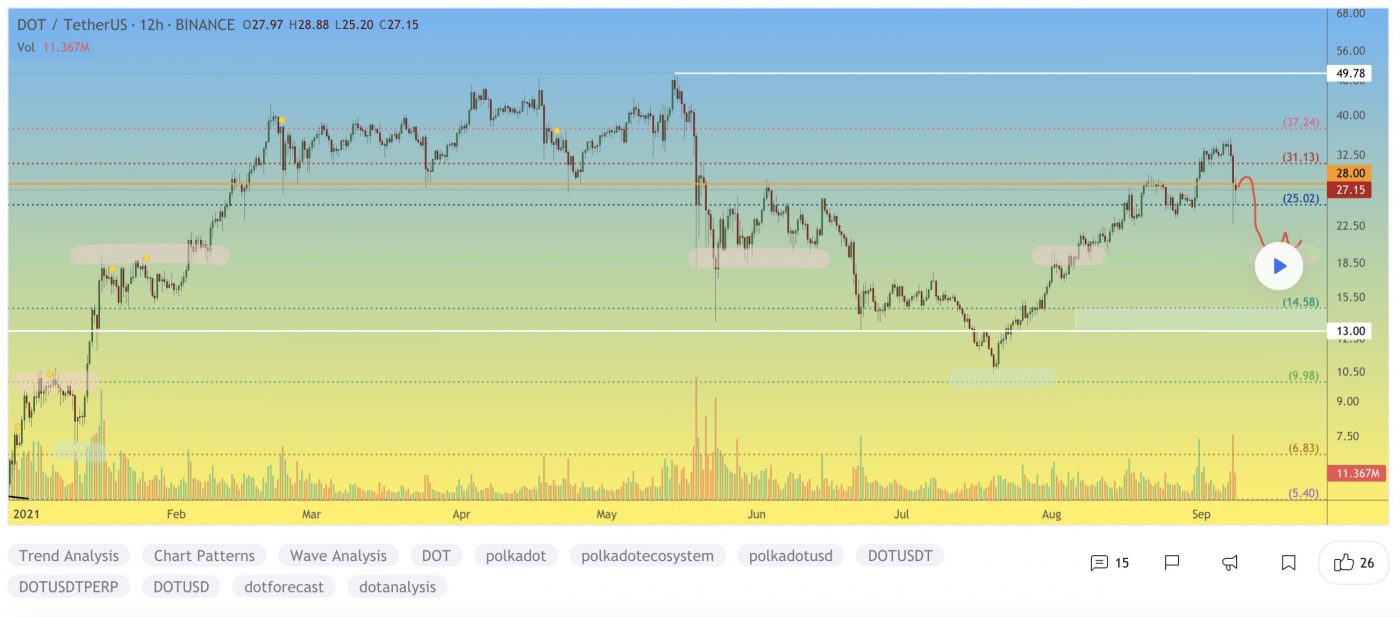
At the time of writing, DOT is ranked the 10th cryptocurrency globally and the current price is A$37.95. Let’s take a look at the chart below for price analysis:

Source: TradingView

Bulls are buying DOT at each drop into support near A$36.77, with higher lows forming each time. However, the equal lows near A$32.41 can create an attractive target for a stop run. Still, bulls might buy this dip near possible support beginning at A$28.13.

Just over the June monthly open, A$40.24 marks the beginning of a probable resistance zone. A breakthrough in this area might target the equal highs near A$42.67 before running into possible resistance near A$44.76.

A sustained move upward – perhaps from a market-wide bullish shift – could reach the swing high near A$48.13 before encountering probable resistance near A$51.63.

3. Filecoin (FIL)

Filecoin FIL is a decentralised storage system that aims to “store humanity’s most important information”. The project was first described back in 2014 as an incentive layer for the Interplanetary File System (IPFS), a peer-to-peer storage network. Filecoin is an open protocol and backed by a blockchain that records commitments made by the network’s participants, with transactions made using FIL, the blockchain’s native currency. The blockchain is based on both proof-of-replication and proof-of-spacetime.

FIL Price Analysis

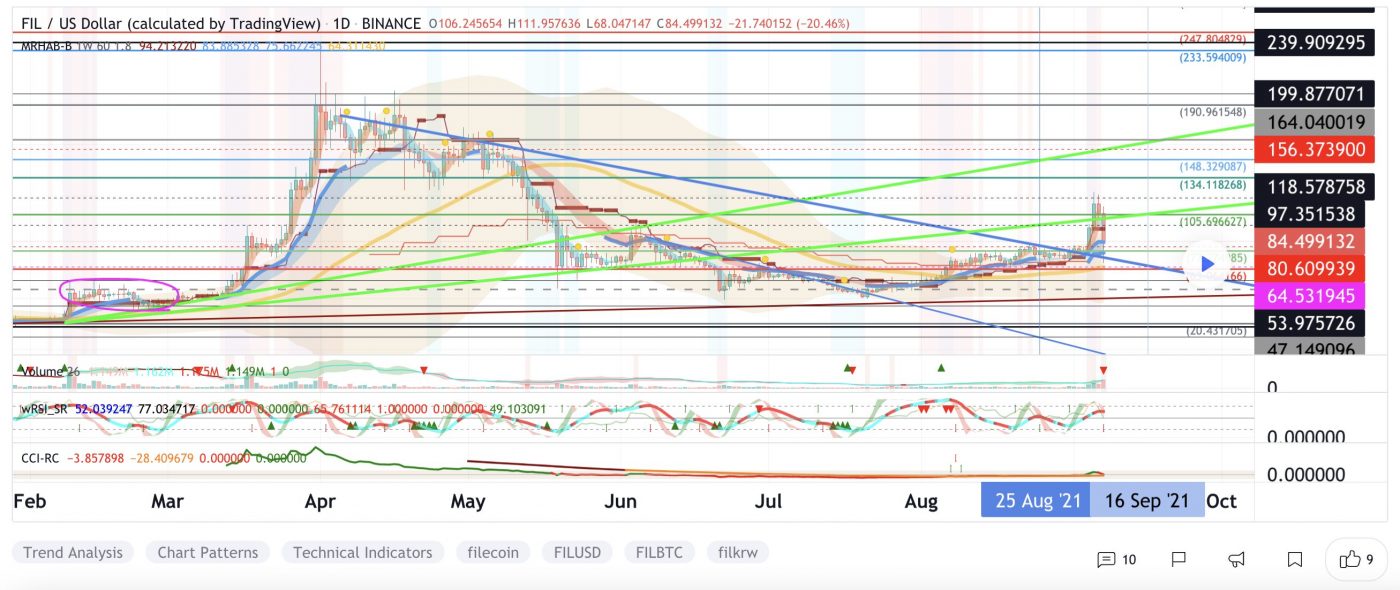
At the time of writing, FIL is ranked the 19th cryptocurrency globally and the current price is A$122.82. Let’s take a look at the chart below for price analysis:

Source: TradingView

During five days in May, FIL dumped over 86% before finding support near A$81.34. Consolidation above this level has created a series of relatively equal lows, which are likely to be swept before any longer-term bullish trend begins. 

In the shorter term, the price might establish support near A$98.24 before running the swing high at A$105.14. If this bullish move occurs, the price could reach resistance near the June monthly open around A$135.56 – and even sweep the swing high near A$141.72.

Some support might exist at the daily gap near A$113.45. A move this low would also fill the June monthly gap and set the stage for a possible bullish reversal.

Where to Buy or Trade Altcoins?

These coins have high liquidity on Binance Exchange, so that could help with trading on AUD/USDT/BTC pairs. And if you’re looking at buying and HODLing cryptos, then Swyftx Exchange is an easy-to-use popular choice in Australia.