Categories
Crypto News Initial Coin Offering Market Analysis Trading

Hard Protocol Breakout Analysis – HARD Gains +21% in a Day on Binance Launchpad

After the launch of Hard Protocol on Binance Launchpad, HARD was trading sideways with strong buying volume and took a breakout today with +21% gains. Let’s take a quick look at HARD, price analysis, and possible reasons for the recent breakout.

What is Hard Protocol?

HARD Protocol is a decentralized money market built on Kava, enabling the lending and borrowing of cross-chain assets. HARD Protocol supports supply-side deposits for BTC, XRP, BNB, BUSD, and USDX. The platform will allow overcollateralized borrowing for supported assets.

HARD Quick Stats

SYMBOL:HARD
Global rank:289
Market cap:$43,643,209 AUD
Current price:$1.23 AUD
All-time high price:$1.59 AUD
1 day:+21.2%
7 day:+56.7%
1 year:+78.3%

HARD Price Analysis

At the time of writing, HARD is ranked 289th cryptocurrency globally and the current price is $1.23 AUD with an All-time +78.3% increase since the launch of its ICO at Binance Launchpad. Have a look at the chart below for price analysis.
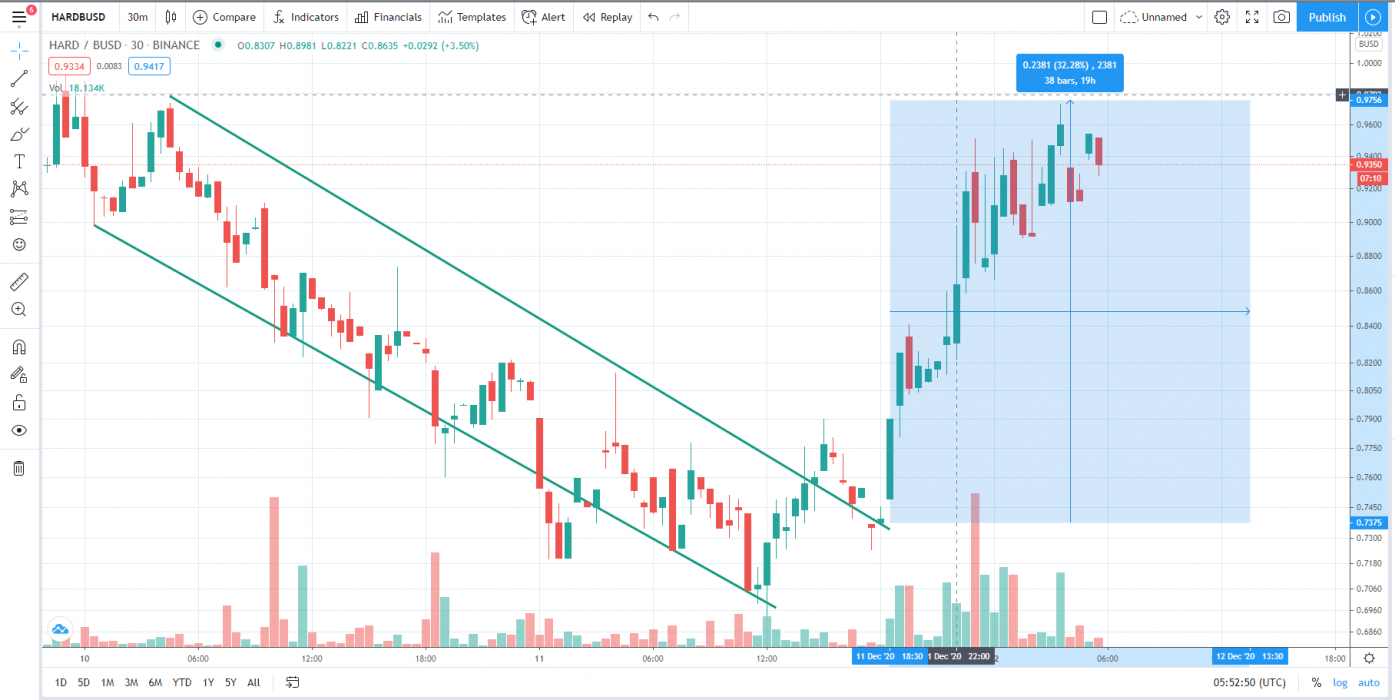
Source: TradingView

After the launch of HARD on Binance Launchpad, It pumped up to $3.95 AUD having +296% gains in just a few hours and the initial opening price of HARD was $0.83 AUD at Binance Exchange with many different trading pairs like HARD/BTC, HARD/BUSD, and HARD/USDT.

Currently, HARD is trading at $1.23 AUD price levels after breaking out the falling wedge pattern in its sideways trend & now HARD is heading towards its all-time high price facing some previous weekly resistances.

What do the technical indicators say?

The HARD TradingView indicators (on the 1 day) mainly indicate HARD as a strong buy, except the Oscillators which indicate HARD as a buy.

So Why did HARD Breakout?

After the opening at Binance Launchpad, mostly ICO’s pumps after going live on exchange for trade and, the recent rise in Bitcoin over 100% since the halving in May and then the suggested start of the Altcoin season could have contributed to the recent breakout. It could also be contributed to some recent news of Hard Margin Trading on Binance.

Recent HARD News & Events:

Where to Buy or Trade HARD?

Hard Protocol has the highest liquidity on Binance Exchange so that would help for trading HARD/USDT or HARD/BTC pairs. However, you can also buy from other different exchanges listed in Coinmarketcap.


Categories
Crypto News Market Analysis Trading

Cover Protocol Breakout Analysis – Cover Pumps +42% in a Single Day

Cover is trading in active uptrend here like many other altcoins. The Cryptocurrency Cover Protocol just went up +42% in a single day and surges over +126% in a week.

What is COVER?

COVER Protocol provides peer to peer coverage with fungible tokens. It lets the market set coverage prices as opposed to a bonding curve. COVER Protocol allows DeFi users to be protected against smart contract risk. It stabilizes the turbulent DeFi space by instilling confidence and trust between protocols and their users. By bridging the gap between decentralized finance and traditional finance, COVER Protocol will open the doors of DeFi to all investors.

COVER Quick Stats

SYMBOL:COVER
Global rank:264
Market cap:$67,431,440 AUD
Current price:$1,500 AUD
All time high price:$1,813 AUD
1 day:+42.5%
7 day:+126.4%
1 year:+152.7%

COVER Price Analysis

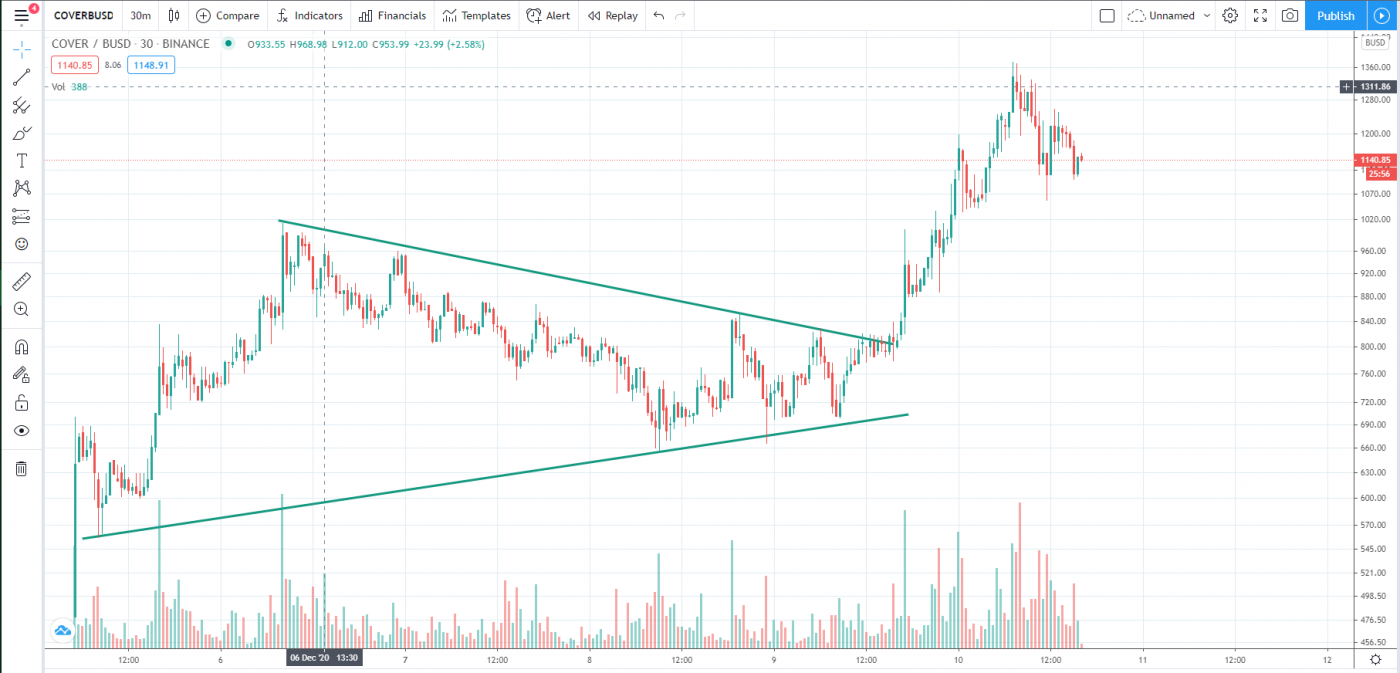
At the time of writing, Cover is ranked 264th cryptocurrency globally and the current price is $1,500 AUD. This is a +126.4% increase since 4th December 2020 (7 days ago) as shown in the chart below.

Source: TradingView

After looking at the above 30-Minute candle chart, we can clearly see that Cover was trading inside the falling wedge pattern on the COVER/BUSD pair. The first resistance was on the $1250 AUD price levels which COVER broke with a strong bullish trend buying volume and is now heading towards the All-time high price. Seeing that many altcoins are bearish today but COVER is likely to continue to increase.

“The falling wedge pattern is a continuation pattern formed when price bounces between two downward slopings, converging trendlines. It is considered a bullish chart formation but can indicate both reversal and continuation patterns – depending on where it appears in the trend”

What do the Technical indicators say?

The  Cover TradingView indicators (on the 1 day) mainly indicate COVER as a Neutral.

So Why did Civic Breakout?

The recent rise in Bitcoin over 100% since the halving in May and then the suggested start of the Altcoin season could have contributed to the recent breakout. Another reason could be the whales, secretly stacking up COVER to their portfolio for this Altcoins rally. It could also be contributed to some of the recent news having Initial Implementation of Creame V2 & Cover.

Recent COVER News & Events:

Where to Buy or Trade Cover?

Cover has the highest liquidity on Binance Exchange so that would help for trading COVER/BUSD or COVER/ETH pairs. However, if you’re just looking at buying some quick and hodling then Swyftx Exchange is a popular choice in Australia.


Categories
Crypto News Market Analysis Trading

WING Breakout Analysis – Parabolic Breakout on WING with +45% Gains in a Day

WING is trading in uptrend here like many other altcoins. The Cryptocurrency WING just went up +45% in a single day by breaking a Descending triangle with strong buying volume and surges over +81% in a week.

What is WING?

Wing is described to be a credit-based, cross-chain DeFi lending platform dedicated to crypto-asset lending and cross-chain interactions between DeFi products. The project’s decentralized governance model and risk control mechanism are described to promote a mutually beneficial relationship between borrowers, creditors, and guarantors. Wing has also developed a credit evaluation module as a showcase example of credit-based decentralized lending.

WING Quick Stats

SYMBOL:WING
Global rank:486
Market cap:$16,560,710 AUD
Current price:$26.35 AUD 
All time high price:$188.29 AUD
1 day:+45.4%
7 day:+81.70%
1 year:+129.34%

WING Price Analysis

At the time of writing, WING is ranked 486th cryptocurrency globally and the current price is $26.35 AUD. This is a +81.70% increase since 3rd December 2020 (7 days ago) as shown in the chart below.

Source: TradingView

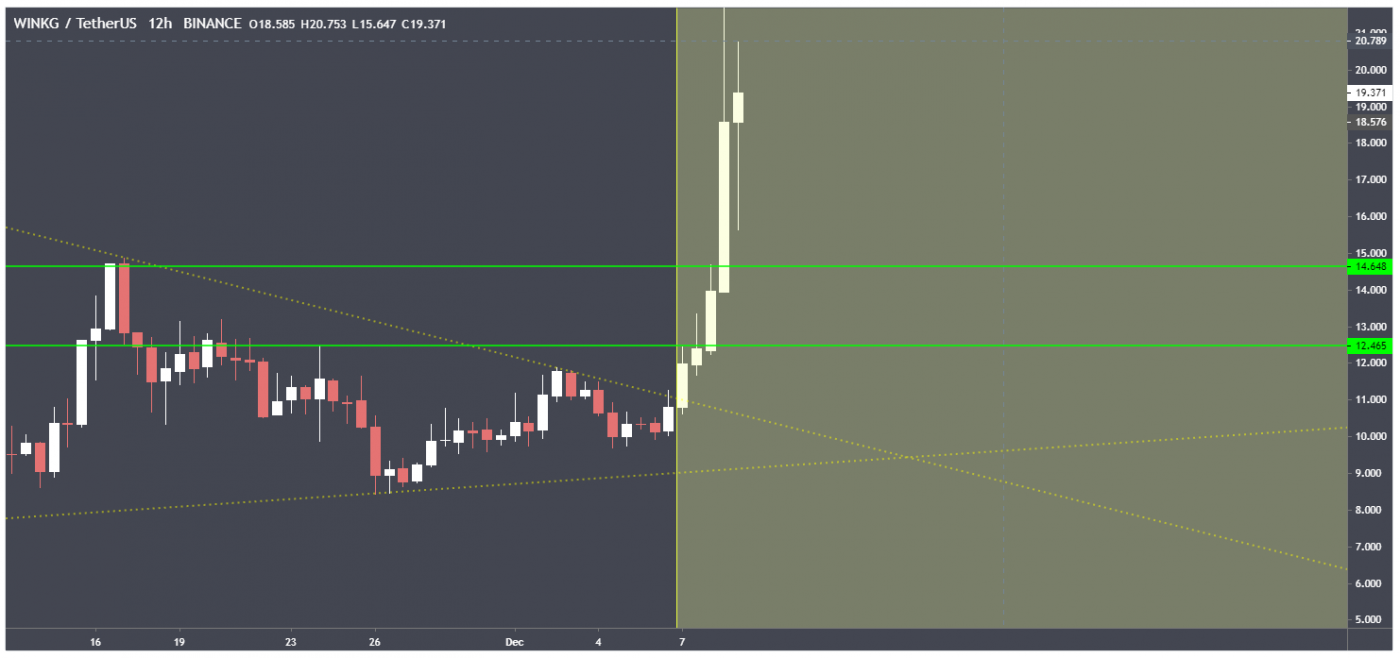
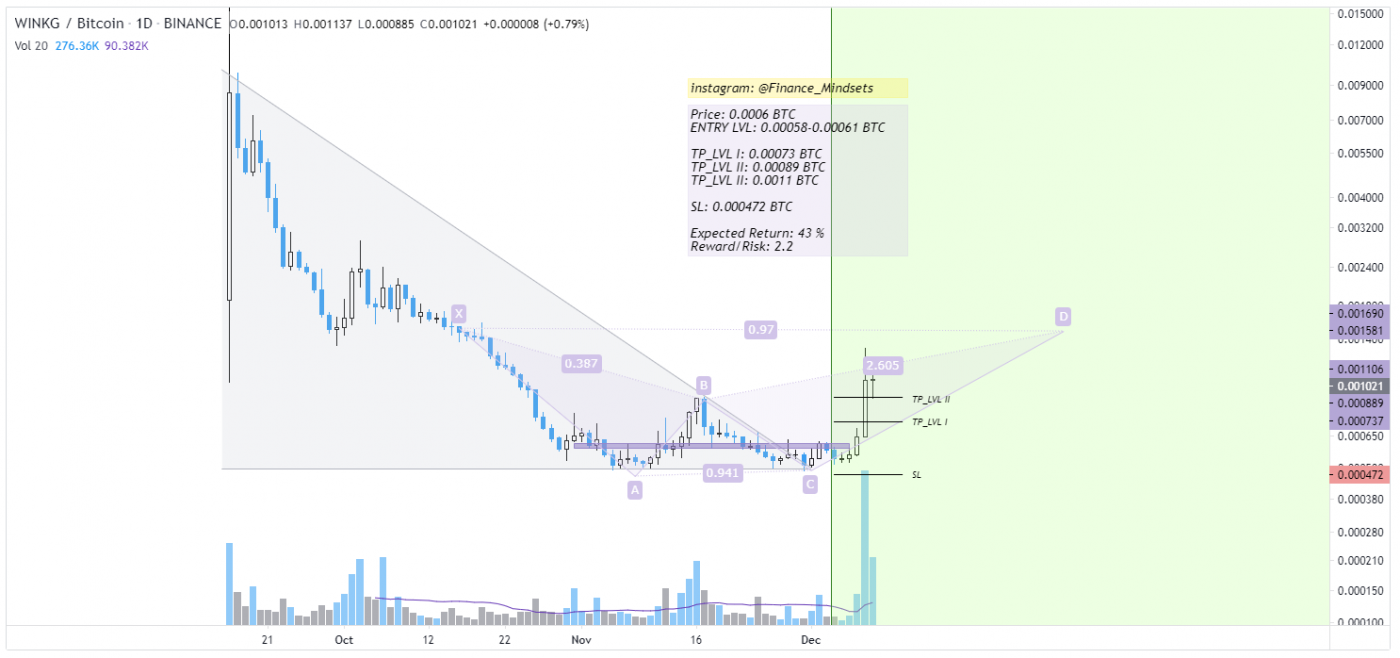
If we see the above 12-hour candle chart, WING just bounced back from its support levels of $15.35 AUD and took a strong breakout from Descending Triangle within the next resistance which was at $18.61 AUD. The line is acting as a support level for this Descending triangle trend.

“A descending triangle is a bearish chart pattern used in technical analysis that is created by drawing one trend line that connects a series of lower highs and a second horizontal trend line that connects a series of lows”

Source: TradingView

What do the technical indicators say?

The WING TradingView indicators (on the 1 day) mainly indicate WING as a buy, except the Oscillators which indicate WING as a neutral.

So Why did WING Breakout?

The recent rise in Bitcoin over 100% since the halving in May and then the suggested start of the Altcoin season could have contributed to the recent breakout. It could also be contributed to some of the recent events of WING Inclusive-Pool.

Recent WING News & Events:

Where to Buy or Trade WING?

WING has the highest liquidity on Binance Exchange so that would help for trading WING/USDT or WING/BTC pairs. However, if you’re just looking at buying some quick and hodling then Swyftx Exchange is a popular choice in Australia.

Categories
Crypto News Initial Coin Offering Market Analysis Trading

Venus XVS Breakout Analysis – XVS Performing Active Uptrend with +50% Gains in a Day

Venus is trading in active uptrend here like many other altcoins are. The Cryptocurrency Venus XVS just went up +50% in a single day and surges over +76% in a week.

What is Venus?

Venus is an algorithmic money market and synthetic stablecoin protocol launched exclusively on Binance Smart Chain BSC. The protocol introduces simple-to-use crypto-asset lending and borrowing solution to the decentralized finance DeFi ecosystem, enabling users to directly borrow against collateral at high speed while losing less to transaction fees. In addition, Venus allows users to mint VAI stablecoins on-demand within seconds by posting at least 200% collateral to the Venus smart contract.

Venus Quick Stats

SYMBOL:XVS
Global rank:195
Market cap:$42,887,723 AUD
Current price:$5.80 AUD
All time high price:$7.22 AUD
1 day:+50.5%
7 day:+76.6%
1 year:+83.74%

Venus Price Analysis

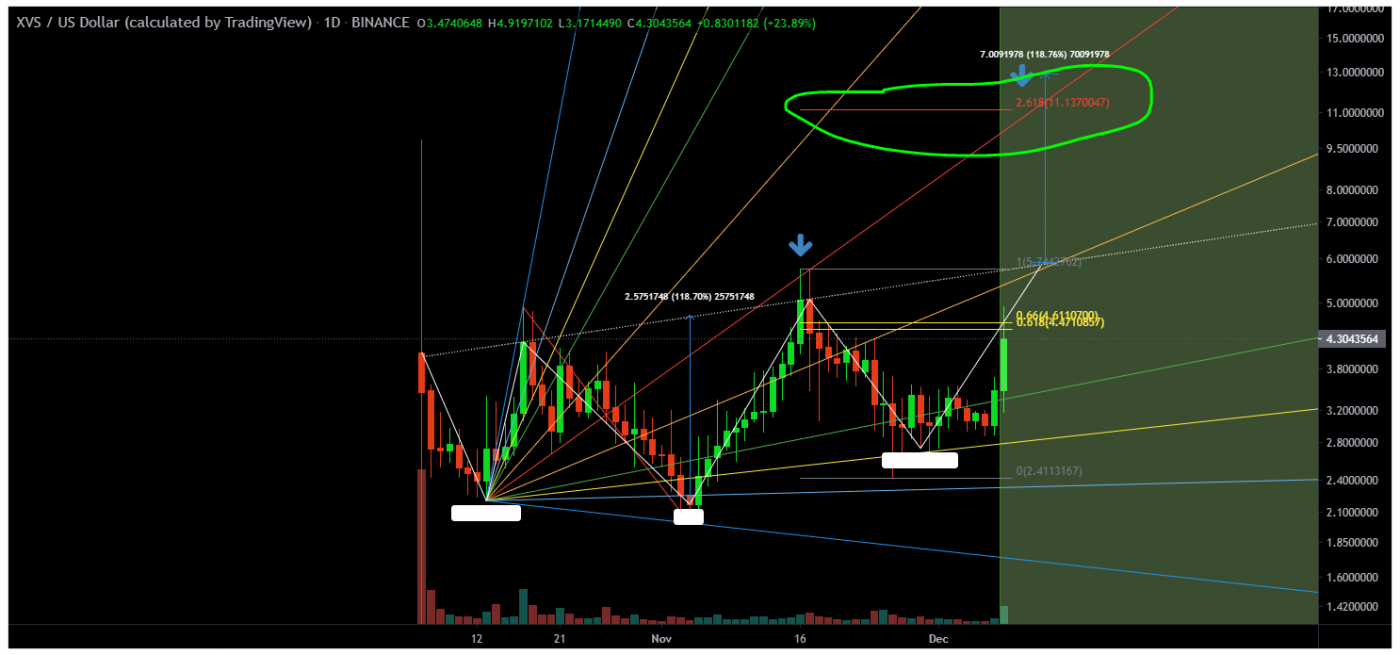
At the time of writing, Venus is ranked 195th cryptocurrency globally and the current price is $5.80 AUD. This is a +76.6% increase since 2nd December 2020 (7 days ago) as shown in the chart below.

Source: TradingView

Price already increased a little bit after the Venus announcement yesterday, and then XVS did an awesome breakout from this bearish rectangle by breaking all previous resistances & is now currently trading at $5.80 AUD price levels.

“The bearish rectangle is a continuation pattern that occurs when a price pauses during a strong downtrend and temporarily bounces between two parallel levels before the trend continues.”

What do the technical indicators say?

The Venus TradingView indicators (on the 1 day) mainly indicate XVS as a buy, except the Moving Averages which indicate XVS as a strong buy.

So Why did XVS Breakout?

The recent rise in Bitcoin over 100% since the halving in May and then the suggested start of the Altcoin season could have contributed to the recent breakout. Another reason could be the whales, secretly stacking up XVS to their portfolio for the upcoming Altcoins rally. It could also be contributed to some of the recent news where they announced adding Top 3 Cryptos to VenusProtocol.

Recent Venus News & Events:

Where to Buy or Trade Venus?

Venus has the highest liquidity on Binance Exchange so that would help for trading XVS/USDT or XVS/BTC pairs. However, if you’re just looking at buying some quick and hodling then Swyftx Exchange is a popular choice in Australia.

Categories
Crypto News Market Analysis Trading

PNetwork Breakout Analysis – PNT Pumps +47% in a Week with Strong Bullish Trend

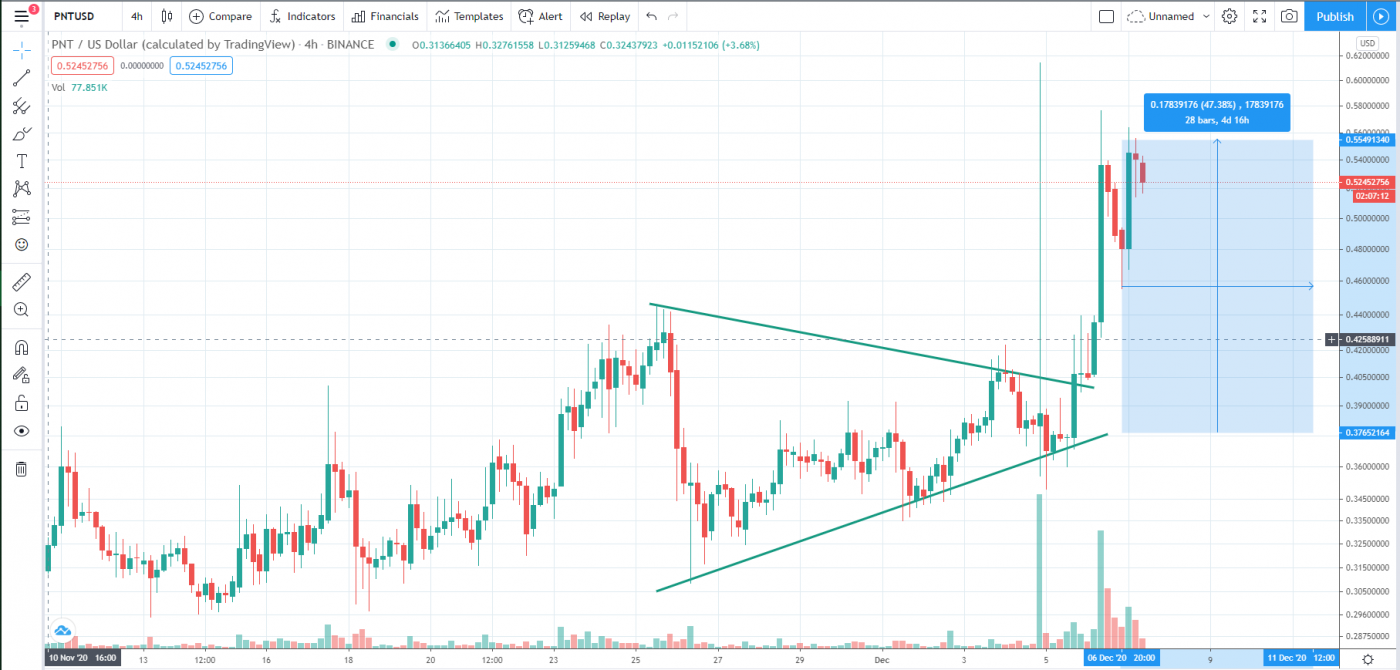
PNT was squeezing inside the double top pattern on a 4-hour candle chart, it just went up over +47% in the last 7 days. Let’s take a quick look at PNT, price analysis, and possible reasons for the recent breakout.

What is PNetwork PNT?

The pNetwork is the governance layer of the pTokens system. pTokens are unchained assets, moving liquidity from one blockchain to another. A Provable, portable, and pegged solution for the DeFi ecosystem.

PNT Quick Stats

SYMBOL:PNT
Global rank:526
Market cap:$14,233,378 AUD
Current price:$0.7096 AUD
All time high price:$1.88 AUD
1 day:+16.78%
7 day:+47.21%
1 year:+129.76%

PNT Price Analysis

At the time of writing, PNT is ranked 526th cryptocurrency globally and the current price is $0.7096 AUD. This is a +47% increase since 1st December 2020 (7 days ago) as shown in the chart below.

Source: TradingView

Price already increased a little bit after the pNetwork announcement last week and then PNT did an awesome breakout from the triangle of this bearish rectangle pattern by breaking all previous resistances & is now currently trading at $0.7096 AUD price levels.

“The bearish rectangle is a continuation pattern that occurs when a price pauses during a strong downtrend and temporarily bounces between two parallel levels before the trend continues.”

What do the technical indicators say?

The PNT TradingView indicators (on the 1 day) mainly indicate PNT as a buy, except the Moving Averages which indicate PNT as a strong buy.

So Why did PNT Breakout?

The recent rise in Bitcoin over 100% since the halving in May and then the suggested start of the Altcoin season could have contributed to the recent breakout. It could also be contributed to some of the recent news where they announced PNetwork Portals.

Recent PNT News & Events:

Where to Buy or Trade PNT?

PNetwork has the highest liquidity on Binance Exchange so that would help for trading PNT/USDT or PNT/BTC pairs. However, if you’re just looking at buying some quick and hodling then Swyftx Exchange is a popular choice in Australia.

Categories
Crypto News Initial Coin Offering Market Analysis Trading

UNIFI Protocol DAO Breakout Analysis – UNFI Pumps +85% in a Single Day

After the launch of UNFI Protocol DAO on Binance Launchpool. UNFI was flipping on a 4-hour candle chart & took a strong Breakout again with +85% gains in a single day. Let’s take a quick look at UNFI, price analysis, and possible reasons for the recent breakout.

What is Unifi?

Unifi Protocol DAO is a group of non-custodial, interoperable, decentralized, multi-chain smart contracts providing the building blocks for DeFi development. The project provides a bridge to connect the economy of Ethereum-based DeFi products to the growing DeFi markets on other blockchains. uTrade, a decentralized Automated Market Maker (AMM) and token exchange, is the first product built on the Unifi Protocol DAO smart contracts.

Unifi Quick Stats

SYMBOL:UNFI
Global rank:303
Market cap:$36,421,511 AUD
Current price:$18.03 AUD
All-time high price:$19.10 AUD
1 day:+85.4%
7 day:+203.70%
1 year:+305.74%

Unifi Price Analysis

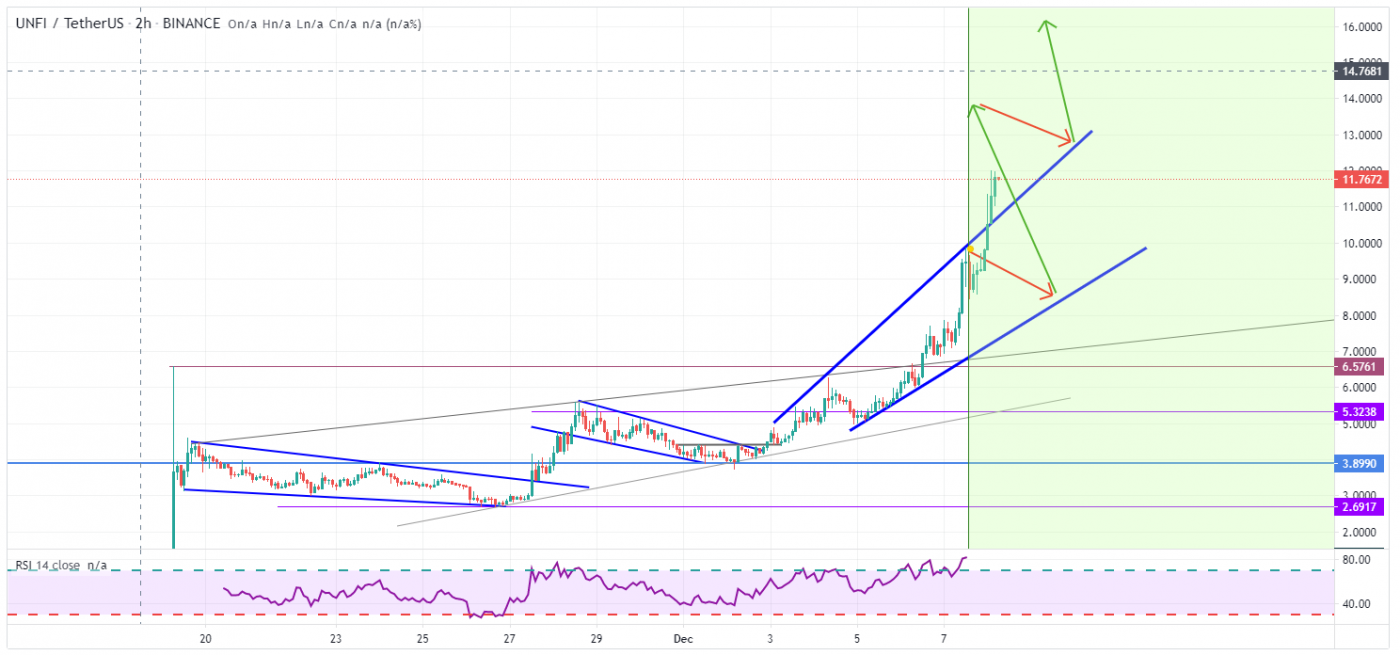
At the time of writing, UNFI is ranked 303rd cryptocurrency globally and the current price is $18.03 AUD. This is a +305.74% increase since the launch of its ICO at Binance Launchpool on 19 November 2020 as shown in the chart below.

Source: TradingView

After the launch of Unifi on Binance Launchpool, It pumped up to $8.12 AUD having +300% gains in few hours and the initial opening price of UNFI was $2.1 AUD at Binance Exchange with many different trading pairs like UNFI/BTC, UNFI/USDT, and UNFI/BUSD.

Currently, UNFI is trading at $18.03 AUD price levels after breaking out the squeeze resistance in its sideways trend & now heading towards its all-time high price with a strong bullish trend.

Source: TradingView

What do the technical indicators say?

The Unifi TradingView indicators (on the 1 day) mainly indicate UNFI as a buy, except the Oscillators which indicate UNFI as a strong sell.

So Why did UNFI Breakout?

The recent rise in Bitcoin over 100% since the halving in May and then the suggested start of the Altcoin season could have contributed to the recent breakout. It could also be contributed to some recent news where UNFI Protocol was Live on Ethereum

Recent UNFI News & Events:

Where to Buy or Trade UNFI?

UNFI has the highest liquidity on Binance Exchange so that would help for trading UNFI/USDT or UNFI/BTC pairs. However, if you’re just looking at buying some quick and hodling then Swyftx Exchange is a popular choice in Australia.

Categories
Australia Institutions Trading

SelfWealth, Australia’s Leading Trading Platform, Launches US trading In Their ASX Portfolio

Australia’s low-fee leading trading platform, SelfWealth, will launch a beta-test program with a few selected members to integrate US trading before Christmas 2020 — on December 14, with a new mobile app for Android and iOS.

More than 60,000 Aussie investors will have direct access to all major US exchanges through their SelfWealth account. The Melbourne-based broker will add the US trading account into their ASX portfolios.

Pre-registered traders will have access to popular American stocks like Facebook, Amazon, Tesla — and more than 7,500 + other financial instruments to choose from, a list which SelfWealth plans to expand in the future.

Competitive FX fees

The US trading launch is coming with a $9.50 USD flat fee per trade. Unlike banks, which can charge up to 1.00% SelfWealth implements competitive FX rates, charging only 0.60 % when transferring to or from USD.

For years, SelfWealth has been growing strongly off the back of disillusioned investors that have been overpaying to invest. Now, they can invest in the US and the ASX in one convenient place at a reasonable price.

– SelfWealth’s Managing Director Rob Edgley in a public statement.

Edgley underlined the support of SelfWealth clients, who have shown increased interest in the new US trading launch and additional products.

“Our hard-working team will now turn their efforts towards additional functionality across the trading platform and new products that our clients have been asking for.”

According to Edgley, Aussie investors don’t need multiple trading accounts and apps to access US stock markets. SelfWealth members will have a US cash account to help them avoid per-trade foreign exchange fees.

Categories
Crypto News Initial Coin Offering Market Analysis Trading

Injective Protocol Breakout Analysis–INJ Pumps +70% in a Week on Binance Launchpad

After the launch of Injective Protocol on Binance Launchpad, INJ took a strong Breakout with +70% gains in a week. Let’s take a quick look at INJ, price analysis, and possible reasons for the recent breakout.

What is Injective Protocol?

Injective is the first front-running resistant, layer-2 exchange protocol that unlocks the full potential of borderless finance by supporting margin trading, derivatives, and futures.

INJ Quick Stats

SYMBOL:INJ
Global rank:318
Market cap:$36,295,556 AUD
Current price:$2.41 AUD
All-time high price:$2.60 AUD
1 day:+18.2%
7 day:+70.7%
1 year:+161.3%

INJ Price Analysis

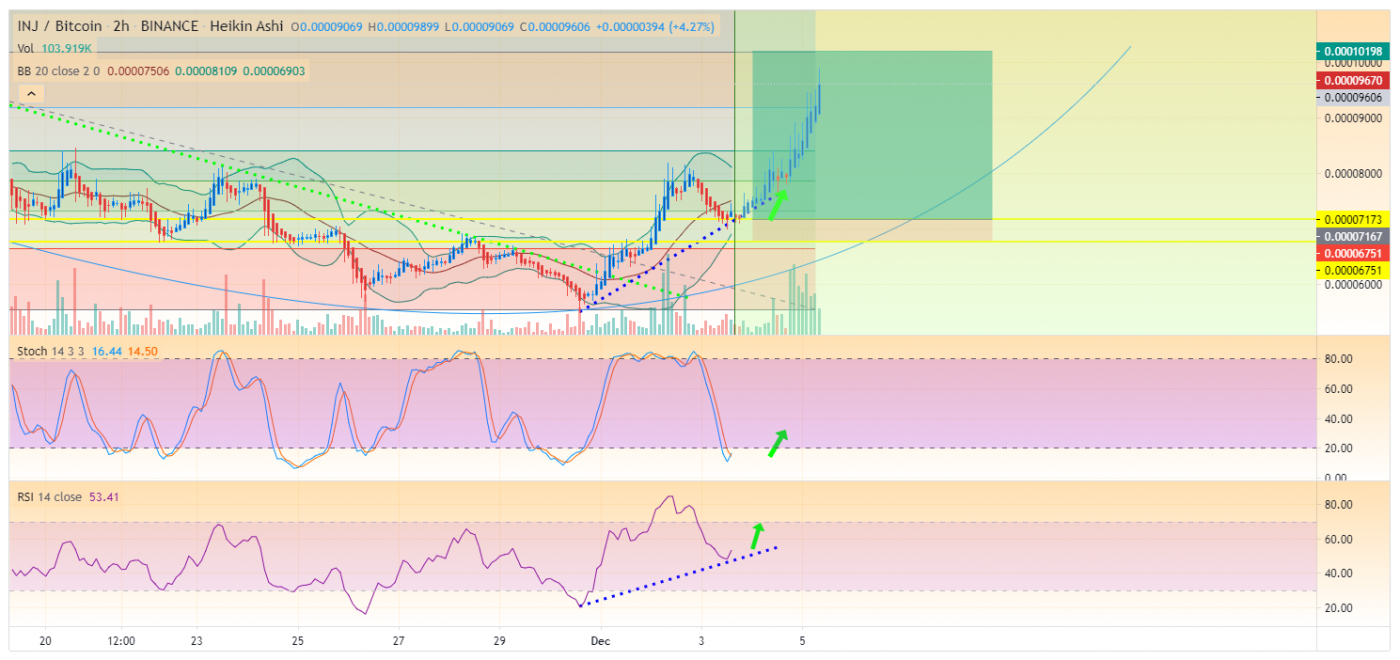
At the time of writing, INJ is ranked 318th cryptocurrency globally and the current price is $2.41 AUD. This is a +161.3% increase since the launch of its ICO at Binance Launchpad. Have a look at the chart below for price analysis.

Source: TradingView

After the launch of INJ on Binance Launchpad, It pumped up to $2.60 AUD having +385% gains in just a few hours and the initial opening price of INJ was $0.73 AUD at Binance Exchange with many different trading pairs like INJ/BTC, INJ/BNB, and INJ/ETH.

Currently, INJ is trading at $2.41 AUD price levels after breaking out the squeeze resistance in its sideways trend & now INJ is heading towards making a new all-time high price.

Source: TradingView

What do the technical indicators say?

The INJ TradingView indicators (on the 1 day) mainly indicate INJ as a strong buy, except the Oscillators which indicate INJ as a buy.

So Why did INJ Breakout?

After the opening at Binance Launchpad, mostly ICO’s pumps after going live on exchange for trade and, the recent rise in Bitcoin over 100% since the halving in May and then the suggested start of the Altcoin season could have contributed to the recent breakout. It could also be contributed to some recent news of Solstice Testnet Launch.

Recent INJ News & Events:

Where to Buy or Trade INJ?

INJ has the highest liquidity on Binance Exchange so that would help for trading INJ/USDT or INJ/BTC pairs. However, if you’re just looking at buying some quick and hodling then Swyftx Exchange is a popular choice in Australia.

Categories
Cardano Crypto News Market Analysis Ripple Trading TRON

Altcoins Trading Analysis – 3 Coins that Might Breakout Today: XRP, ADA, TRX

For today’s trading news, we’re looking at are three altcoins that might breakout showing bullish trends in the charts.

1. Ripple (XRP)

Ripple is a real-time gross settlement system, currency exchange, and remittance network created by Ripple Labs Inc., a US-based technology company.

XRP Price Analysis

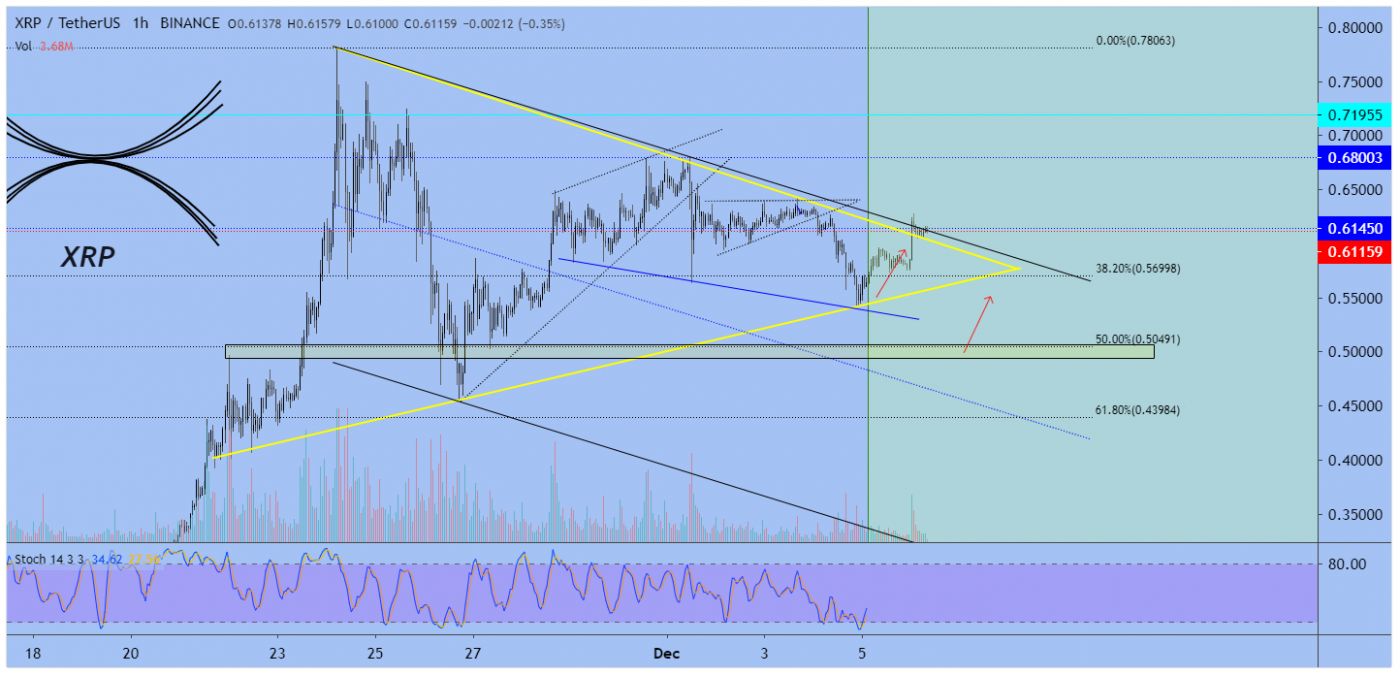
At the time of writing, XRP is ranked 3rd cryptocurrency globally and the current price is $0.8109 AUD. Let’s take a look at the chart below for price analysis.

Source: TradingView

If we see the above 1-hour candle chart, we are moving in a symmetrical triangle, just tested the lower support line of this triangle, and we can expect the movement to the upper resistance line.
if we breakout from this triangle, XRP might start a new bullish trend.

“A symmetrical triangle is a chart pattern characterized by two converging trend lines connecting a series of sequential peaks and troughs. Trend lines that are converging at unequal slopes are referred to as a rising wedge, falling wedge, ascending triangle, or descending triangle.”

2. Cardano (ADA)

Cardano is a proof-of-stake blockchain platform that says its goal is to allow “changemakers, innovators and visionaries” to bring about positive global change.

ADA Price Analysis

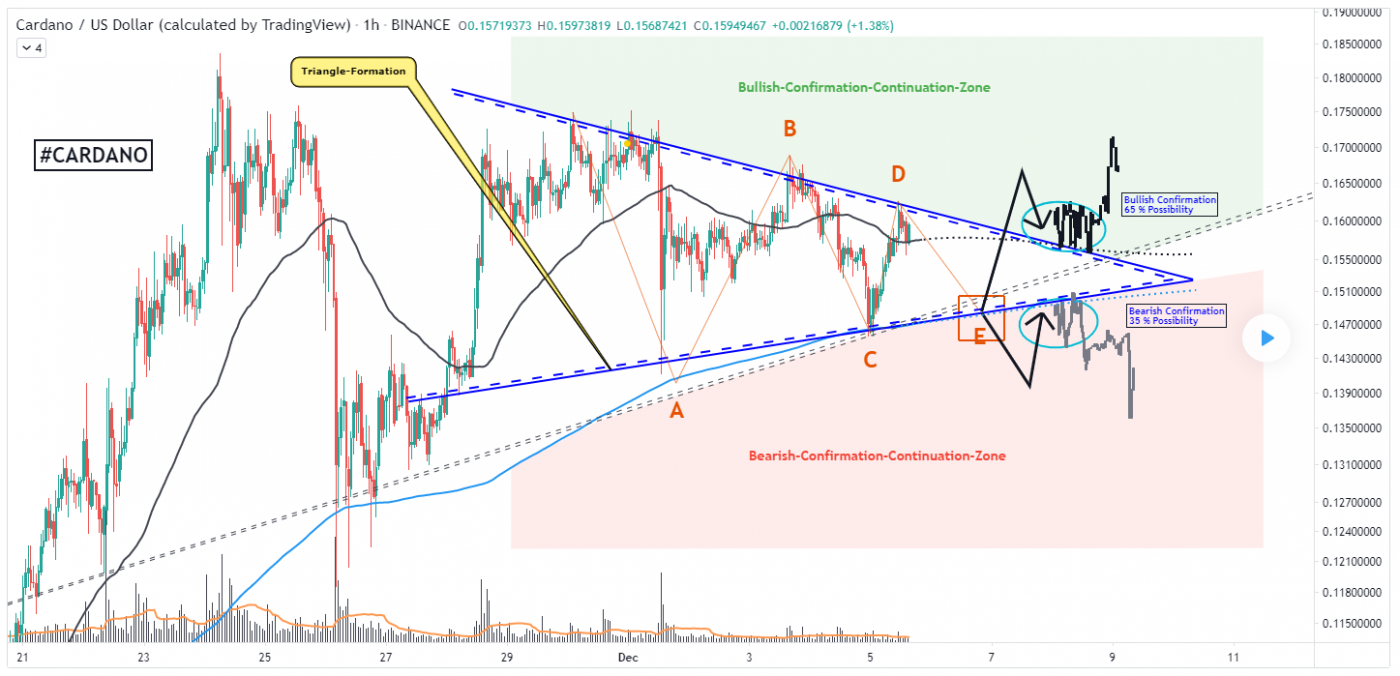
At the time of writing, ADA is ranked 8th cryptocurrency globally and the current price is $0.2093 AUD. Let’s take a look at the chart below for price analysis.

Source: TradingView

If we see the above 1-hour candle chart, Cardano ADA is forming an ABCD pattern in a Triangle Formation by making higher-highs & higher-lows in the price levels. If ADA bounces back from the E point of a Triangle Formation, It can start its new bullish trend after breaking the next resistances.

“The ABCD pattern is an easy-to-identify chart pattern that consists of two equivalent price legs. It is a harmonic pattern that helps traders predict when the price of a stock is about to change direction. The pattern can be used to predict either a bullish or bearish reversal depending on the orientation.”

3. Tron (TRX)

TRON is a blockchain-based operating system that aims to ensure this technology is suitable for daily use. Whereas Bitcoin can handle up to six transactions per second, and Ethereum up to 25, TRON claims that its network has capacity for 2,000 TPS — 24/7.

TRX Price Analysis

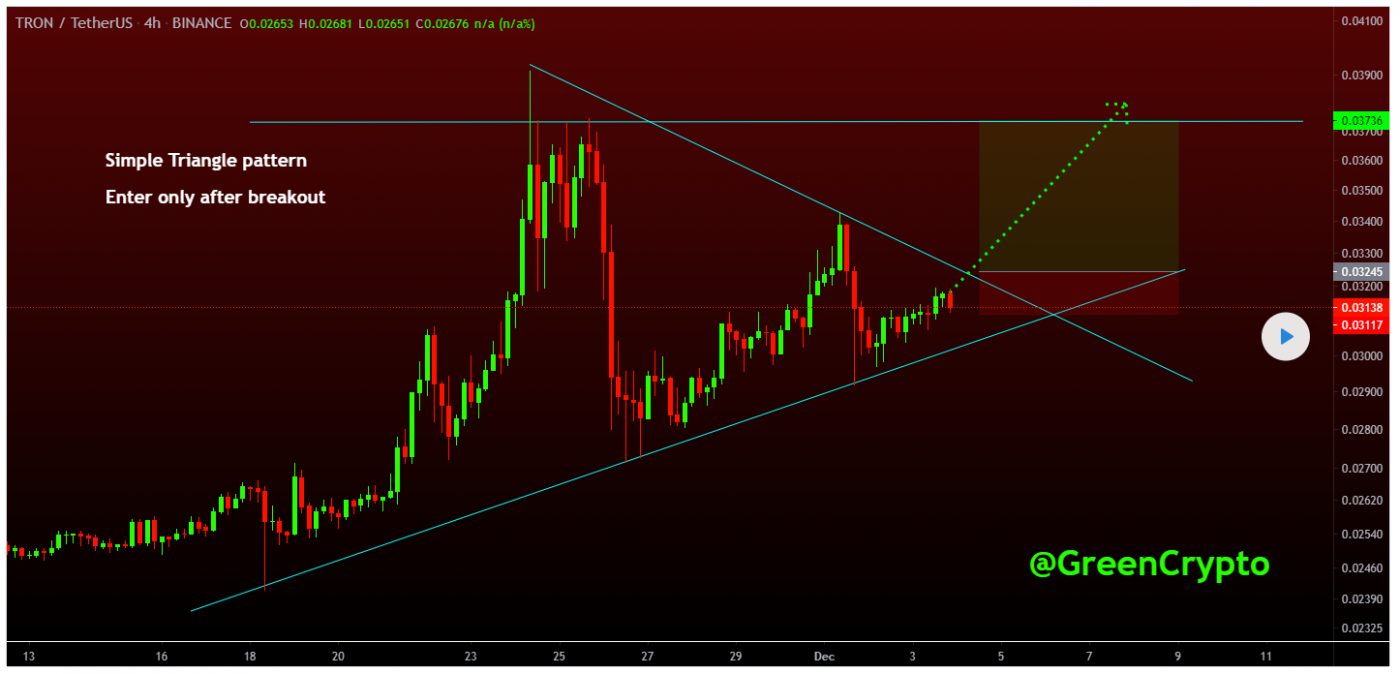
At the time of writing, TRX is ranked 18th cryptocurrency globally and the current price is $0.0408 AUD. Let’s take a look at the chart below for price analysis.

Source: TradingView

November brought an impressive 70% rally in TRX’s price before it encountered resistance below September’s swing high, near $0.0539 AUD.

Last week’s sweep of old highs could lead to a retest of support near the November monthly open, where equal lows make an appealing short-term target for bears. 

If we see the above 4-hour candle chart, TRX is squeezing inside the symmetrical triangle and is now charging up for the strong breakout, if TRX bounces back from the support like then it might pump with a breakout.

Where to Buy or Trade Altcoins?

These 3 Altcoins have the highest liquidity on Binance Exchange so that would help for trading USDT or BTC pairs. However, if you’re just looking at buying some quick and hodling then Swyftx Exchange is a popular choice in Australia.

Categories
Crypto News Market Analysis Trading

BotXcoin Breakout Analysis – BOTX Pumps +64% in a Single Day with Strong Bullish Trend

BotXcoin is flipping on a 1-day candle chart, BOTX has grown by a massive +64% in a single day. Let’s take a quick look at BOTX, price analysis, and possible reasons for the recent breakout.

What is BotXcoin?

BotXcoin is a future token for financial freedom that provide a functional token for using our profitable trading robot in all cryptocurrency exchange all over the world. The goal of this project is to utilize a trading robot BOTX App and build a multi-cryptocurrency trading exchange BOTXPRO.

BotXcoin Quick Stats

SYMBOL:BOTX
Global rank:217
Market cap:$340,603,325 AUD
Current price:$0.2085 AUD
All time high price:$0.2569 AUD
1 day:+64.31%
7 day:+17.95%
1 year:+566.36%

BotXcoin Price Analysis

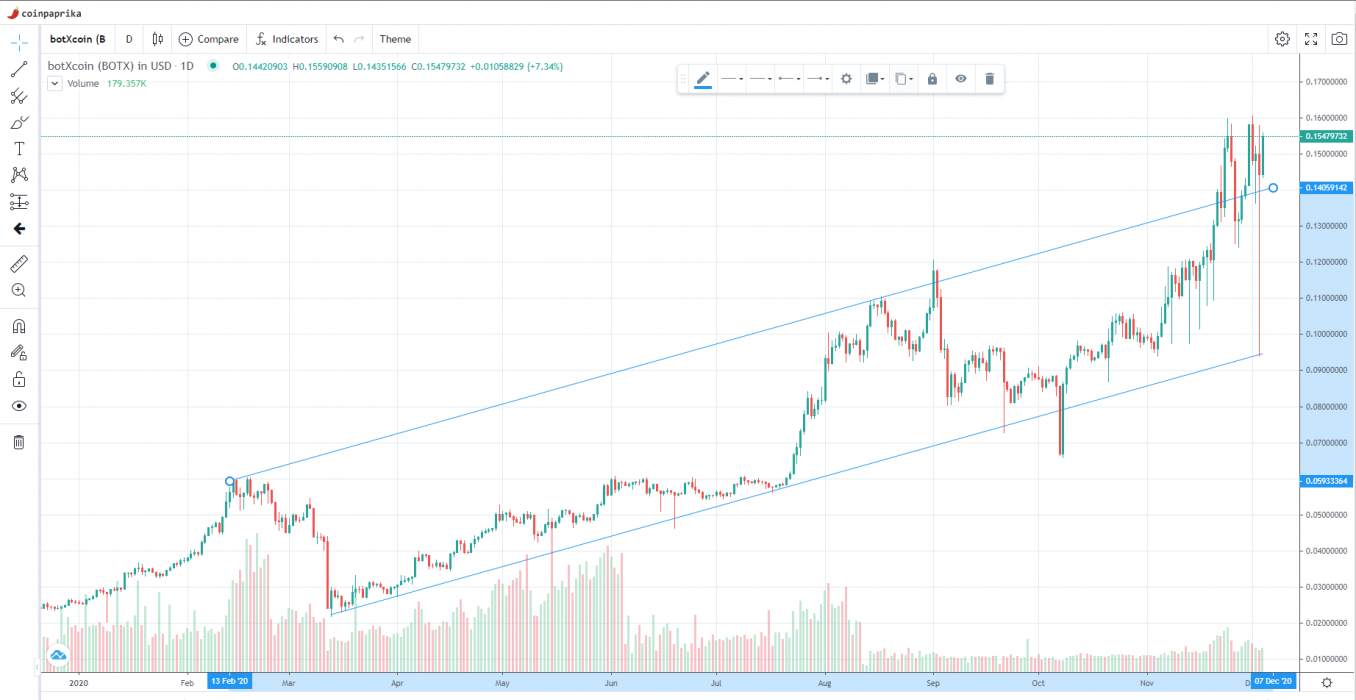
At the time of writing, BOTX is ranked 217th cryptocurrency globally and the current price is $0.2085 AUD. This is a +64.31% increase in a single day as shown in the chart below.

Source: Coinpaprika TradingView

In the past week, there was a strong rise in Bitcoin, Ethereum, and Ripple. As a result, BotXcoin also formed strong support near $0.1242 AUD price levels before starting a strong bullish trend.

Here we also have the “W” pattern with a higher low just as looking at it before starting a strong increase, there was a break above a crucial contracting triangle with resistance near $0.1552 on the daily chart of the BOTX/AUD. The pair gained pace above the $0.1742 and $0.1865 resistance levels.

“W pattern is a price pattern, also called Double Bottom. This pattern, when drawn it looks like the W and this is why it is called as W pattern. Sometimes patterns look like W but it is not the exact W pattern and these patterns are called Semi-W patterns.”

What do the technical indicators say?

The BotXcoin TradingView indicators (on the 1 day) mainly indicate BOTX as a buy, except the Moving Averages which indicate BOTX as a strong buy.

So Why did BOTX Breakout?

The recent rise in Bitcoin over 100% since the halving in May and then the suggested start of the Altcoin season could have contributed to the recent breakout. It could also be contributed to some of the recent events where the BotXcoin will be listed in Coinlim.

Recent BotXcoin News & Events:

Where to Buy or Trade BotXcoin?

Currently BOTX coin is mostly available to buy on P2PB2B exchange which is a cryptocurrency exchange operating out of the United Kingdom.