Categories
Crypto News Decentraland Market Analysis OMG Network Trading Waves

Top 3 Coins to Watch Today: OMG, MANA, WAVES – March 3 Trading Analysis

Let’s take a closer look at today’s altcoins showing breakout signals. We’ll explain what the coin is, then dive into the trading charts and provide some analysis to help you decide.

1. Omg Network (OMG)

Omg Network OMG, formerly known as OmiseGo, is a non-custodial, layer-2 scaling solution built for the Ethereum blockchain. As an Ethereum scaling solution, OMG Network is designed to allow users to transfer ETH and ERC20 tokens significantly faster and more cheaply than when transacting directly on the Ethereum network. The network is powered by the OMG utility token, which can be used as one of the payment methods for fees on the OMG Network, and will eventually be stackable – helping to secure the network in return for rewards.

OMG Price Analysis

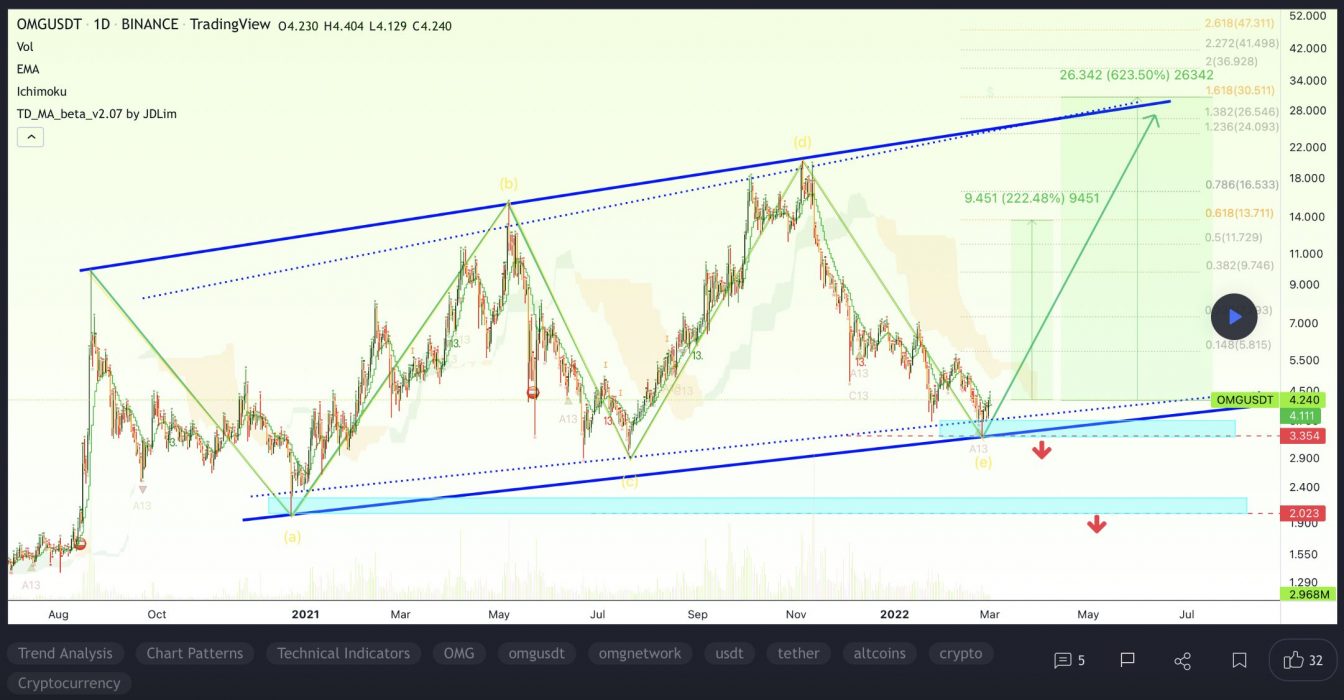
At the time of writing, OMG is ranked the 104th cryptocurrency globally and the current price is US$4.51. Let’s take a look at the chart below for price analysis:
Source: TradingView

OMG‘s 45% drop has filled the February monthly gap twice as the price consolidated between $3.88 and $4.70.

The price’s current region, between $4.41 and $4.27 and just under the monthly open, could continue to give support. If this area continues to hold, the cluster of relatively equal range highs up to $5.12 is a likely target. 

An animated move through these highs could reach up to the daily gap beginning at $5.31. The area between $5.73 and $6.19 provides a likely cap for a move into this zone.

A drop lower could be a run-on stop under $4.10 and find support near $3.94. If this level is lost, the swing low at $3.82 is a likely target, with $3.69 possibly giving support.

2. Decentraland (MANA)

Decentraland MANA defines itself as a virtual reality platform powered by the Ethereum blockchain that allows users to create, experience, and monetise content and applications. In this virtual world, users purchase plots of land that they can later navigate, build on and monetise. Decentraland uses two tokens: MANA and LAND. MANA is an ERC-20 token that must be burned to acquire non-fungible ERC-721 LAND tokens. MANA tokens can also be used to pay for a range of avatars, wearables, names and more on the Decentraland marketplace.

MANA Price Analysis

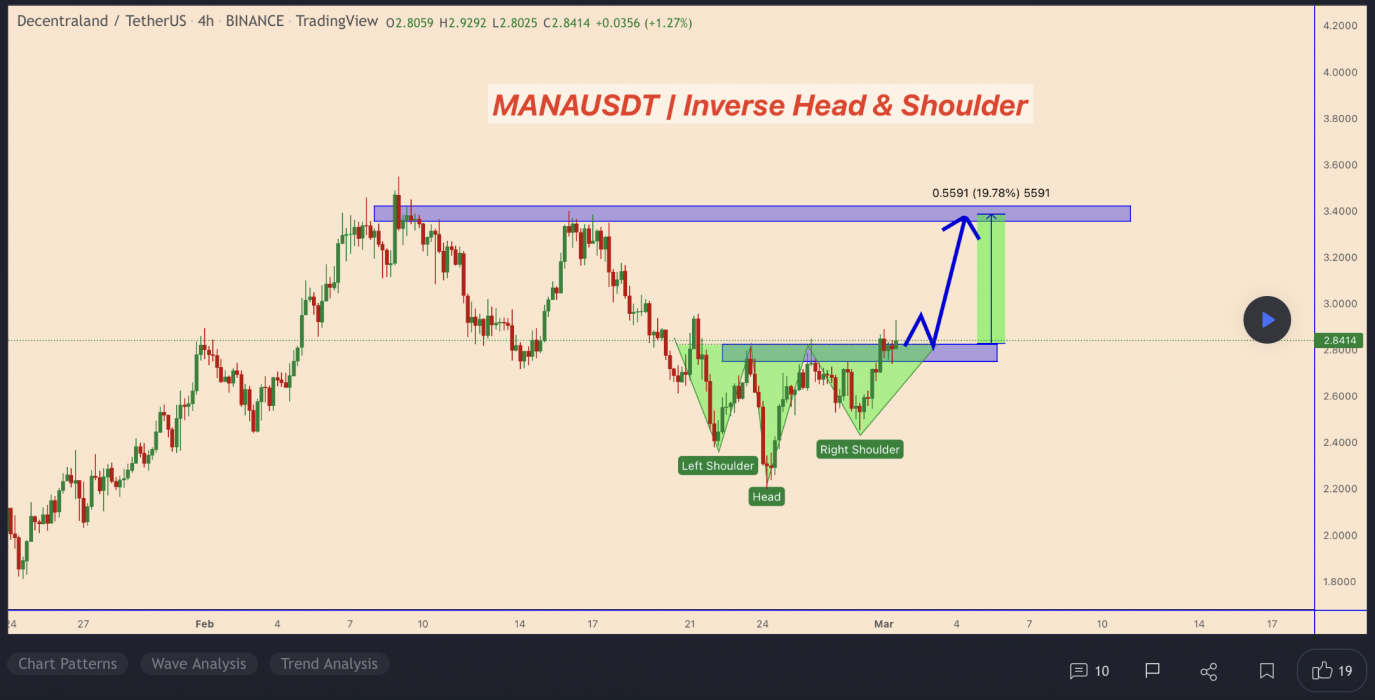
At the time of writing, MANA is ranked the 31st cryptocurrency globally and the current price is US$2.76. Let’s take a look at the chart below for price analysis:
Source: TradingView

Like many other altcoins, MANA set a monthly high during February before retracing 35% to the low at $2.50 last week.

The price broke through resistance near $2.53, which may mark an area of possible support on a retracement. If this support fails, bulls might also step in near $2.48. However, a drop this far increases the chances of a stop run to $2.42 and possibly into support near $2.37. For now, continuing bullish market conditions could help $2.67 become support.

The swing high around $2.90 gives bulls a reasonable first target, with $3.12 also likely to draw the price upward. Higher-timeframe resistance beginning near $3.22 or $3.25 could cap the move or trigger consolidations. If bullish market conditions continue, bulls might test probable resistance near new monthly highs around $3.35.

3. Waves (WAVES)

WAVES is a multi-purpose blockchain platform that supports various use cases, including decentralised applications (DApps) and smart contracts. The platform has undergone various changes and added new spin-off features to build on its original design. Waves’ native token is WAVES, an uncapped supply token used for standard payments such as block rewards. Waves initially set out to improve on the first blockchain platforms by increasing speed, utility, and user-friendliness.

WAVES Price Analysis

At the time of writing, WAVES is ranked the 54th cryptocurrency globally and the current price is US$17.52. Let’s take a look at the chart below for price analysis:

Source: TradingView

During December’s high, WAVES‘ 40% drop marks the current range as a reasonable area to expect accumulation.

The recent bearish flip of the 9, 18 and 40 EMAs might cause bulls to be less aggressive in bidding. However, possible support near $15.88 and $14.35 – between the 61.8% and 78.6% retracements – could see at least a short-term bounce. 

Long-term consolidation suggests that the areas near $19.45 and $20.61 may be more likely to cause a longer-term trend reversal.

Bears are likely to add to their shorts at probable resistance beginning near $22.77, which has confluence with the 18 EMA. A fast break of this resistance could trigger more selling near $25.42, the start of the bearish move.

Learn How to Trade Live!

Join Dave and The Crypto Den Crew and they’ll show you live on a webinar how to take your crypto trading to the next level.

Where to Buy or Trade Altcoins?

These coins have high liquidity on Binance Exchange, so that could help with trading on AUD/USDT/BTC pairs. And if you’re looking at buying and HODLing cryptos, then Swyftx Exchange is an easy-to-use popular choice in Australia.

Categories
Crypto News Market Analysis Trading Waves

Top 3 Coins to Watch Today: MATIC, SAND, WAVES – December 3 Trading Analysis

Let’s take a closer look at today’s altcoins showing breakout signals. We’ll explain what the coin is, then dive into the trading charts and provide some analysis to help you decide.

1. Polygon (MATIC)

Polygon MATIC is the first well-structured, easy-to-use platform for Ethereum scaling and infrastructure development. Its core component is Polygon SDK, a modular, flexible framework that supports building multiple types of applications. The MATIC token will continue to exist and will play an increasingly important role, securing the system and enabling governance.

MATIC Price Analysis

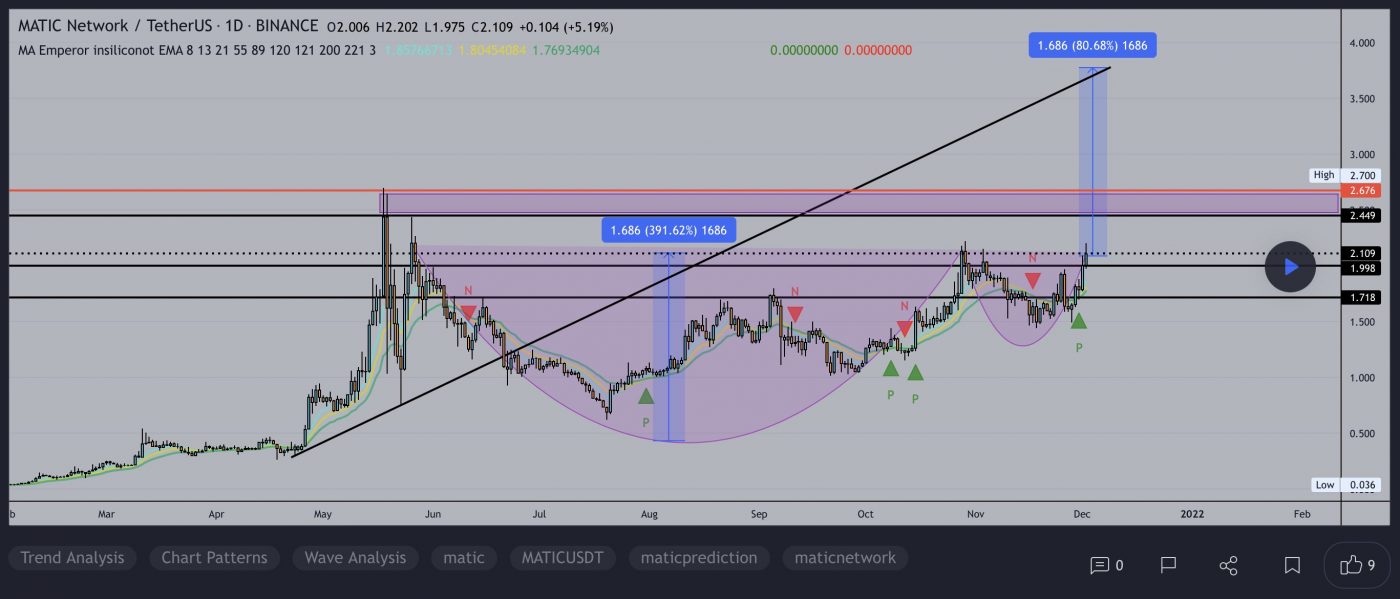
At the time of writing, MATIC is ranked the 15th cryptocurrency globally and the current price is US$2.08. Let’s take a look at the chart below for price analysis:

Source: TradingView

October marked a turning point for MATIC, with the price rocketing up almost 80% from its lows to probable resistance beginning near $2.21.

The price is currently struggling with the area between $1.88 and $2.10. This region could provide support after a close above, or resistance after a close below. 

A retracement could reach into the daily gap and possible support around $1.85. A more bearish shift in the marketplace will likely aim for the relatively equal lows near $1.74, and the potential support just below that begins around $1.60.

Continuation to the upside will likely target the recent monthly highs near $2.25. However, probable resistance beginning at $2.10 and $2.18 could cap or slow down this move.

2. The Sandbox (SAND)

The Sandbox SAND is a blockchain-based virtual world allowing users to create, build, buy and sell digital assets in the form of a game. By combining the powers of decentralised autonomous organisations (DAOs) and non-fungible tokens (NFTs), the Sandbox creates a decentralised platform for a thriving gaming community. The Sandbox employs the powers of blockchain technology by introducing the SAND utility token, which facilitates transactions on the platform.

SAND Price Analysis

At the time of writing, SAND is ranked the 39th cryptocurrency globally and the current price is US$6.30. Let’s take a look at the chart below for price analysis:

Source: TradingView

Since November’s high, SAND‘s 59% drop marks the current range as a reasonable area to expect accumulation.

The recent bearish flip of the 9, 18 and 40 EMAs might cause bulls to be less aggressive in bidding. However, possible support near $5.90 and $5.45 – between the 61.8% and 78.6% retracements – could see at least a short-term bounce. 

Long-term consolidation suggests that the areas near $6.84 and $7.27 may be more likely to cause a longer-term trend reversal. 

Bears are likely to add to their shorts at probable resistance beginning near $6.54, which has confluence with the 18 EMA. A fast break of this resistance could trigger more selling near $7.05, the start of the bearish move.

If an aggressive bullish move does appear, trapped buyers in the probable resistance beginning near $7.79 might provide a ceiling for this impulse.

3. Waves (WAVES)

WAVES is a multi-purpose blockchain platform that supports various use cases, including decentralised applications (DApps) and smart contracts. The platform has undergone various changes and added new spin-off features to build on its original design. Waves’ native token is WAVES, an uncapped supply token used for standard payments such as block rewards. Waves initially set out to improve on the first blockchain platforms by increasing speed, utility, and user-friendliness.

WAVES Price Analysis

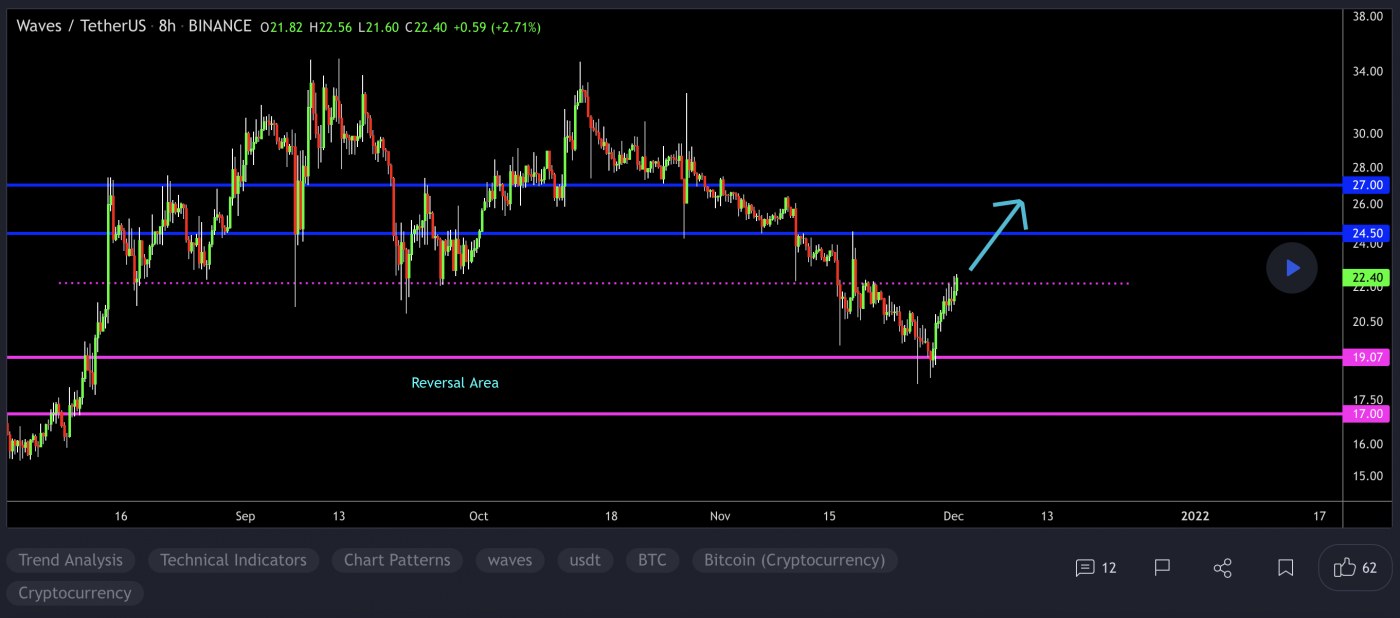
At the time of writing, WAVES is ranked the 70th cryptocurrency globally and the current price is US$21.53. Let’s take a look at the chart below for price analysis:

Source: TradingView

During November’s high, WAVES‘ 45% drop marks the current range as a reasonable area to expect accumulation.

The recent bearish flip of the 9, 18 and 40 EMAs might cause bulls to be less aggressive in bidding. However, possible support near $19.78 and $18.30 – between the 61.8% and 78.6% retracements – could see at least a short-term bounce. 

Long-term consolidation suggests that the areas near $26.45 and $28.61 may be more likely to cause a longer-term trend reversal.

Bears are likely to add to their shorts at probable resistance beginning near $29.77, which has confluence with the 18 EMA. A fast break of this resistance could trigger more selling near $31.42, the start of the bearish move.

Learn How to Trade Live!

Join Dave and The Crypto Den Crew and they’ll show you live on a webinar how to take your crypto trading to the next level.

Duration: 6-week course
From: November 15 to December 22
Date/Time: Twice a week, Mon and Wed at 7pm AEST
Location: Zoom webinar

Where to Buy or Trade Altcoins?

These coins have high liquidity on Binance Exchange, so that could help with trading on AUD/USDT/BTC pairs. And if you’re looking at buying and HODLing cryptos, then Swyftx Exchange is an easy-to-use popular choice in Australia.

Categories
Market Analysis Trading Waves

Breakout Analysis – WAVES Pumps 134% in 17 days, here is why

The cryptocurrency Waves just went up over 134% in the past couple of weeks. Let’s take a quick look at WAVES, price analysis and possible reasons for the recent breakout.

What is Waves?

Waves is an open blockchain protocol and development toolset for Web 3.0 applications allowing anyone to build their Blockchain decentralized apps (dapps).

Waves Price Analysis

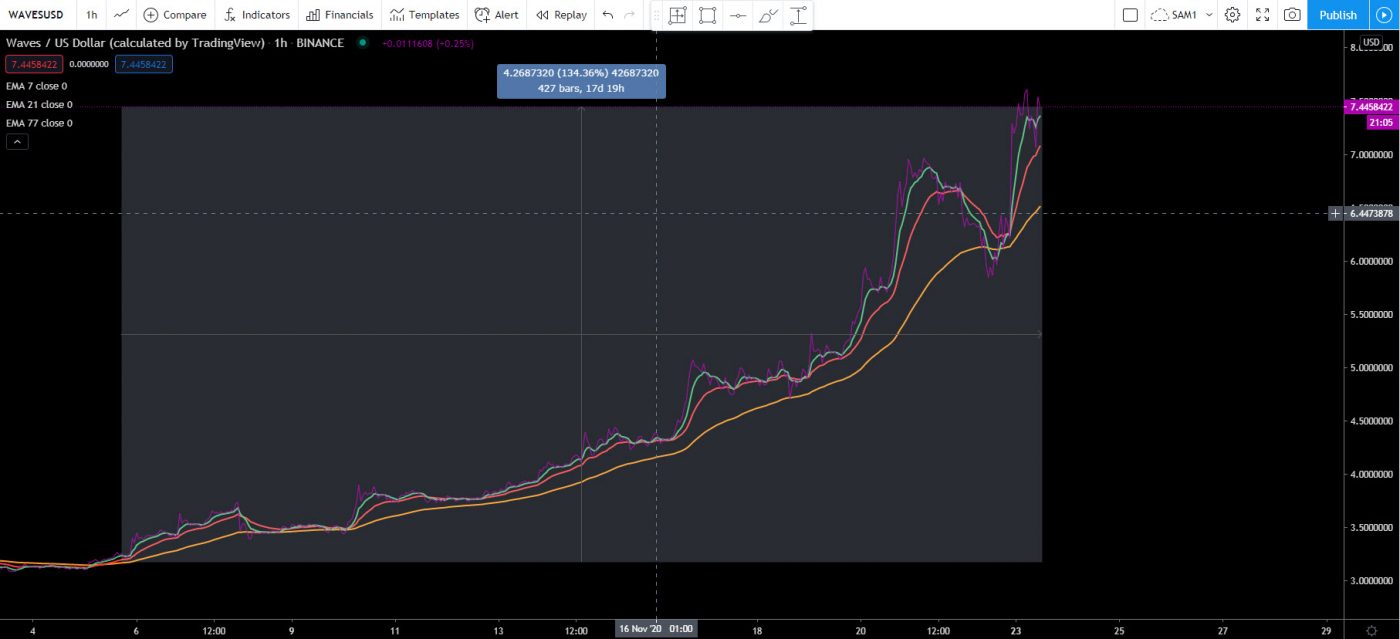
At the time of writing, WAVES is ranked the 32nd cryptocurrency globally and the current price is $10.21 AUD. This is a +134% increase since 05 November 2020 (17 days ago) as shown in the chart below.

Source: tradingview.com

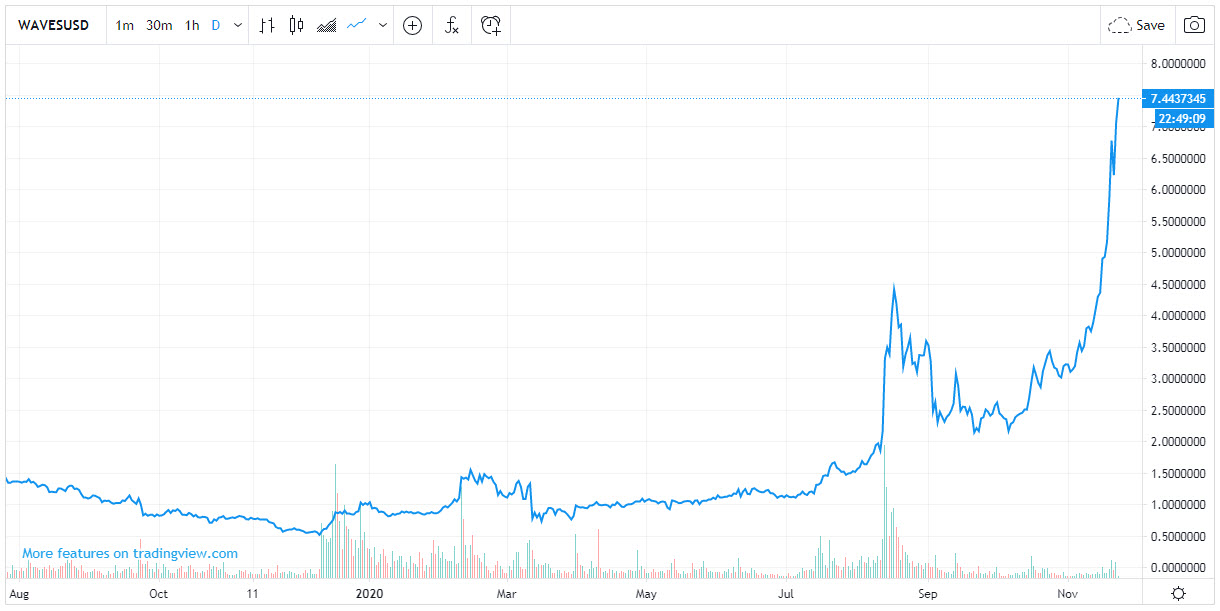
If we zoom out and take a look at the price over the past year or so, we can see the recent breakout more clearly, the line is almost vertical which is insane.

Source: tradingview.com

So Why did WAVES breakout?

​The recent rise in Bitcoin over 100% since the halvening in May and then the suggested start of the Altcoin season could have contributed to the recent breakout. It could also be contributed to some of the recent events where the WAVES project has made some partnerships and sidechain developments.

Recent WAVES News & Events:

The breakout started around 5th Nov, just 2 days after the news first surfaced on medium about the Blockchain IOST network is connecting the Gravity Network to support Cross-chain Functionality with Waves, Ethereum, and Tron.

The partnership with OKExChain announcement is pretty big news for the Waves protocol with regards to developing Distributed Ledger Tech (DLT) technology so this may have had an impact recently to keep the breakout going.

Where to Buy or Trade WAVES?

WAVES has highest liquidity on Binance Exchange so that would help for trading WAVES/USDT or WAVES/BTC pairs. However, if you’re just looking at buying some quick and hodling then Swyftx Exchange is a popular choice in Australia.