Categories
Avalanche Crypto News Elrond Market Analysis THORChain Trading

Top 3 Coins to Watch Today: AVAX, EGLD, RUNE – April 21 Trading Analysis

Let’s take a closer look at today’s altcoins showing breakout signals. We’ll explain what the coin is, then dive into the trading charts and provide some analysis to help you decide.

1. Avalanche (AVAX)

Avalanche AVAX is the fastest smart contracts platform in the blockchain industry, as measured by time-to-finality, and has the most validators securing its activity of any proof-of-stake protocol. Avalanche is blazingly fast, low-cost, and green. Any smart contract-enabled application can outperform its competition on Avalanche. AVAX is the native token of Avalanche. It is a hard-capped, scarce asset that is used to pay for fees, secure the platform through staking, and provide a basic unit of account between the multiple subnets created on Avalanche.

AVAX Price Analysis

At the time of writing, AVAX is ranked the 10th cryptocurrency globally and the current price is US$78.44. Let’s take a look at the chart below for price analysis:

Source: TradingView

AVAX‘s 60% gains during Q1 ended with an almost 25% retracement as the rest of the altcoin market dropped in early April. Bulls stepped in near the 50.8% retracement of Q2’s move, creating a consolidation that ended with last week’s bullish impulse to resistance near $97.35.

With the 9, 18 and 40 EMAs stacked bullish and a bullish higher-timeframe trend, it’s reasonable to anticipate retracement to possible support before further bullish expansion. 

Near the 40 EMA, a broad zone from $73.15 to $68.45 could see interest from bulls before further expansion. If this level fails, bears might capitalise on any sharp moves down in Bitcoin, aiming for possible support near the 65% retracement, at $64.70, and potentially lower to a higher-timeframe support zone between $60.42 and $57.80.

If the higher-timeframe bullish trend resumes and the current resistance near $99.35 breaks, the wicks near $120.84 and the new monthly highs might see profit-taking.

2. Elrond (EGLD)

Elrond EGLD is a blockchain protocol that seeks to offer extremely fast transaction speeds by using sharding. The project describes itself as a technology ecosystem for the new internet, which includes fintech, decentralised finance, and the Internet of Things. Its smart contracts execution platform is reportedly capable of 15,000 transactions per second, six-second latency, and a $0.001 transaction cost. The blockchain has a native token known as eGold, or EGLD, that is used for paying network fees, staking, and rewarding validators.

EGLD Price Analysis

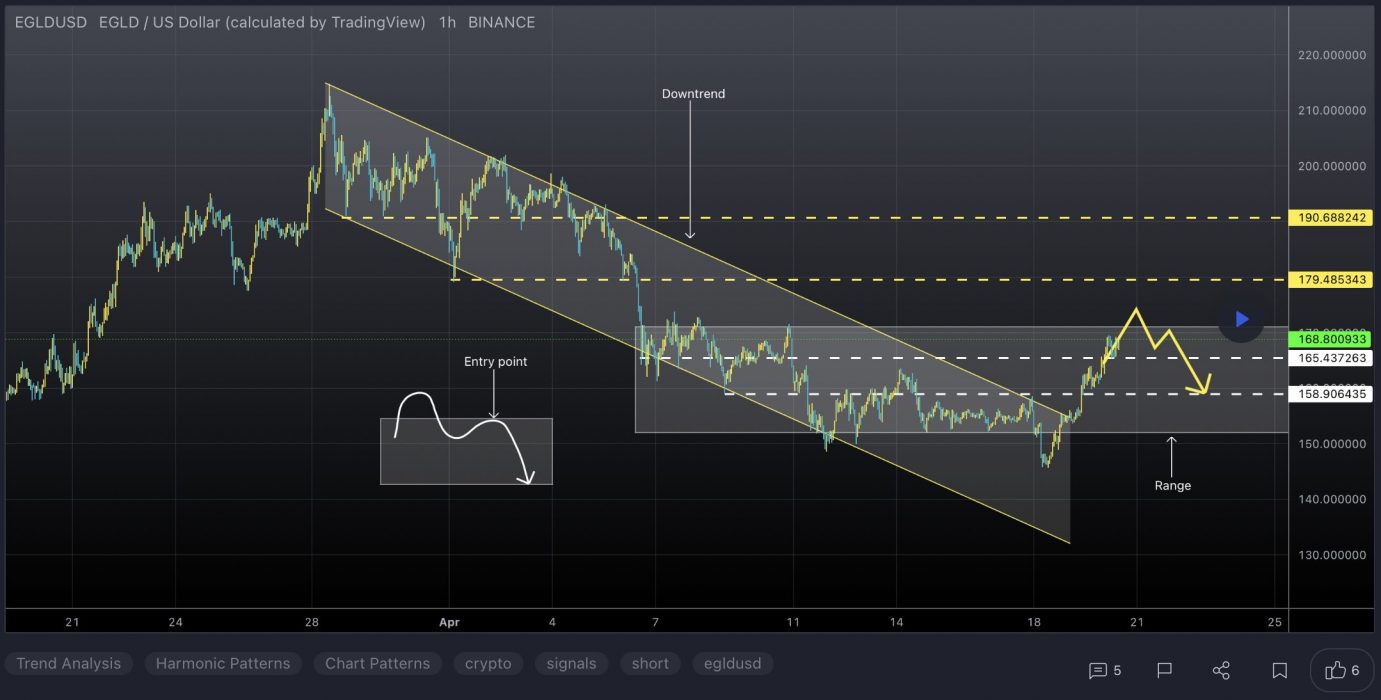
At the time of writing, EGLD is ranked the 39th cryptocurrency globally and the current price is US$162.73. Let’s take a look at the chart below for price analysis:
Source: TradingView

EGLD‘s 60% rally during March reversed with many other coins in April, retracing nearly 35%.

Just above the current price and near the April weekly open, $190.68 could provide resistance before a downward move. This level has confluence with the 18 EMA.

Bears might consider $169.94 as a higher probability resistance to hunt shorts for a longer swing downward. However, higher-timeframe charts suggest that the price could reach $153.45 at the top of an inefficiently traded area before any future bearish breakdowns.

Resistance might also rest near $210.45, above the 2022 yearly open. However, the price is less likely to reach this level unless the overall market starts a bullish swing.

The price is finding support between $150.44 and $143.586. This zone might continue to hold, while overlapping higher-timeframe levels from $138.44 to $135.81 could provide the most substantial support inside this area. 

3. THORChain (RUNE)

ThorChain RUNE is a decentralised liquidity protocol that allows users to easily exchange cryptocurrency assets across a range of networks without losing full custody of their assets in the process. The native utility token of the THORChain platform is RUNE. This is used as the base currency in the THORChain ecosystem, and is also used for platform governance and security as part of THORChain’s Sybil resistance mechanisms – since THORChain nodes must commit a minimum of 1 million RUNE to participate in its rotating consensus process.

RUNE Price Analysis

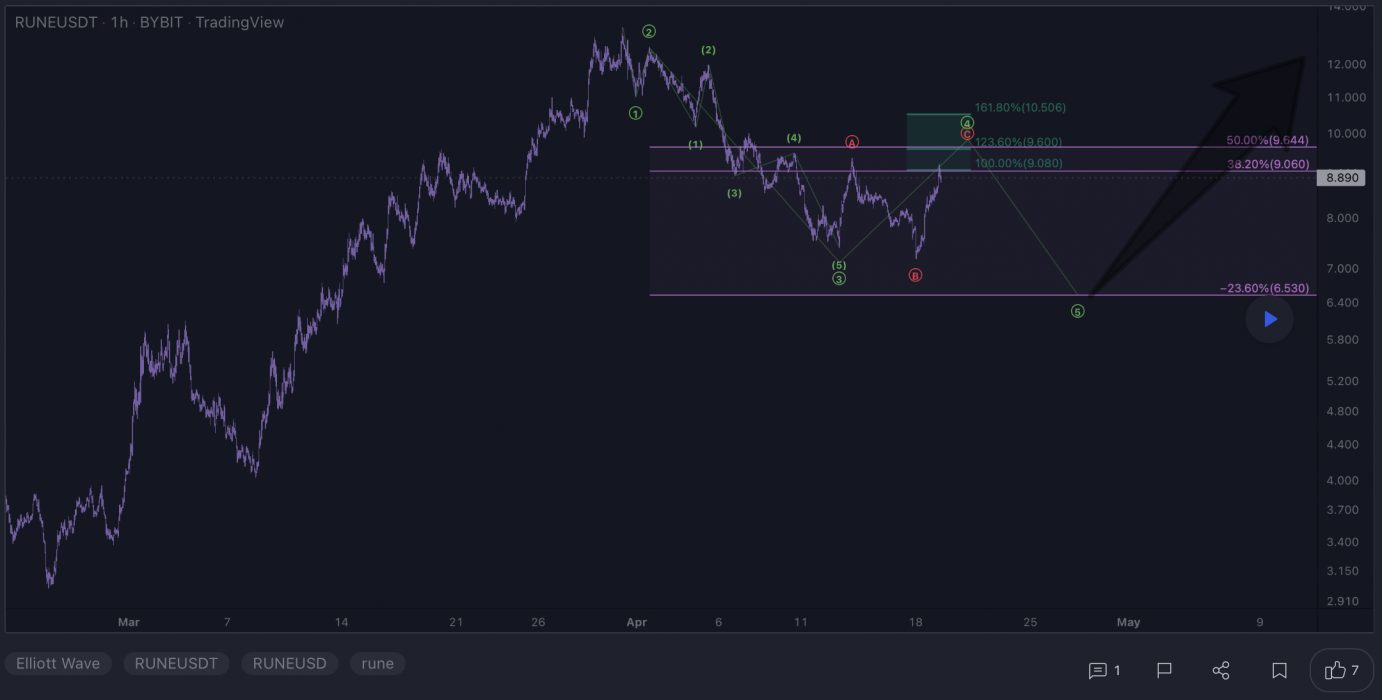
At the time of writing, RUNE is ranked the 44th cryptocurrency globally and the current price is US$9.14. Let’s take a look at the chart below for price analysis:
Source: TradingView

RUNE abruptly rallied after retracing nearly 83% from its November highs, climbing 128% from its late February low.

Bulls are currently taking profits in a contested area between $9.28 and $9.13. This area saw inefficient trading on higher timeframes. It could serve as support if the price trades through its high end and retests it – or as resistance if the price breaks back below.

The closest support rests just below, near $8.31. The old high at this level could support a rally into resistance near $9.52.

A move through the closest resistance might target the consolidation midpoint near $10.40, near the 27% extension of the current rally. If this level breaks, bulls might target an inefficient area near $12.38 and beyond.

If the price rejects from this level and breaks the closest support, it could find support near the midpoint of the current range and 2022 yearly open, near $7.98. The price might also find support slightly below near the 61.8% retracement level, around $7.28.

Learn How to Trade Live!

Join Dave and The Crypto Den Crew and they’ll show you live on a webinar how to take your crypto trading to the next level.

Where to Buy or Trade Altcoins?

These coins have high liquidity on Binance Exchange, so that could help with trading on AUD/USDT/BTC pairs. And if you’re looking at buying and HODLing cryptos, then Swyftx Exchange is an easy-to-use popular choice in Australia.

Categories
Crypto News Market Analysis Ocean Protocol Ripple The Sandbox Trading

Top 3 Coins to Watch Today: XRP, OCEAN, SAND – April 20 Trading Analysis

Let’s take a closer look at today’s altcoins showing breakout signals. We’ll explain what the coin is, then dive into the trading charts and provide some analysis to help you decide.

1. Ripple (XRP)

Ripple XRP is the currency that runs on a digital payment platform called RippleNet, on top of a distributed ledger database called XRP Ledger. While RippleNet is run by a company called Ripple, the XRP Ledger is open-source and not based on a blockchain, but rather the aforementioned distributed ledger database.

XRP Price Analysis

At the time of writing, XRP is ranked the 6th cryptocurrency globally and the current price is US$0.7720. Let’s take a look at the chart below for price analysis:

Source: TradingView

XRP printed some gains during early April after moving sideways for the past few months. The price was in a downtrend, with the 9, 18 and 40 EMAs providing resistance on each attempt to rally.

However, bulls are showing some interest at the 70.6% retracement, near $0.7372. If this level breaks, a move into possible support – just below the lows near $0.6852 – seems likely.

If the price does rally through the swing high at $0.8255 – perhaps triggered by a sudden surge in Bitcoin – bulls might find some resistance at the 61.8% retracement level near $0.8650. 

Overlapping swing highs and lows near $0.9046 might provide the next target, where bears immediately forced the price down in late December.

More bullish market conditions could shift targets up near the midpoint of Q3’s consolidation, near $0.9717, where higher timeframes show an inefficiently traded zone.

2. Ocean Protocol (OCEAN)

Ocean Protocol OCEAN is a blockchain-based ecosystem that allows individuals and businesses to easily unlock the value of their data and monetise it through the use of ERC-20 based datatokens. OCEAN is a utility token that is used for community governance and staking on data, in addition to buying and selling data as the basic unit of exchange on the Ocean Market. The price of these datatokens is set by an OCEAN-datatoken AMM pool, which adjusts the price of the datatoken as it is bought and sold based on supply and demand.

OCEAN Price Analysis

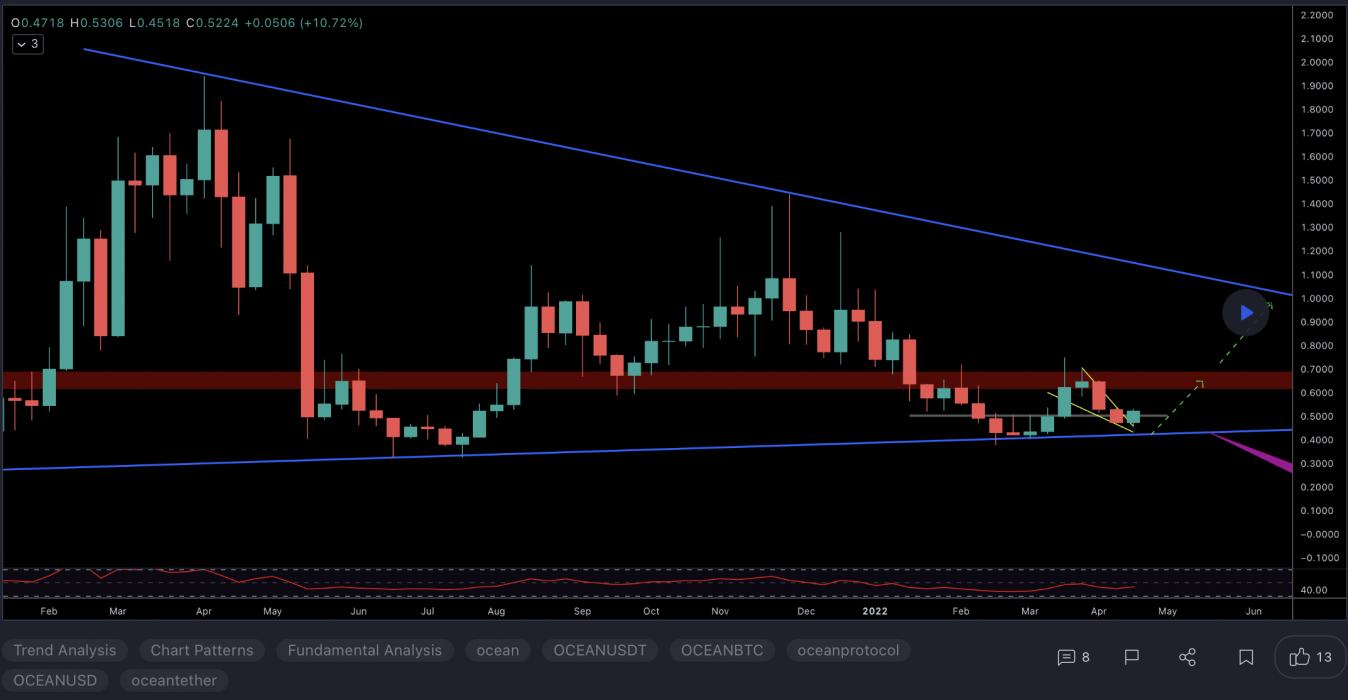
At the time of writing, OCEAN is ranked the 164th cryptocurrency globally and the current price is US$0.5427. Let’s take a look at the chart below for price analysis:

Source: TradingView

During March, OCEAN broke several swing highs that could be the signal for a new bullish trend.

Last week’s break of the most recent swing low could suggest some downside in the short term. It formed probable resistance near $0.6023 and may target the swing low and possible support near $0.5165.

The swing low and possible support near $0.4834 could be the second bearish target if the move down continues. The relatively equal lows near $0.4655 and possible support underneath near $0.4490 could provide more substantial support.

The last swing high near $0.6625 gives a near-term target if bullish conditions continue. However, resistance beginning around $0.6915 could cap this move. A break of this resistance might continue to probable resistance near $0.7428 and reach above the cluster of relatively equal highs near $0.8035.

3. The Sandbox (SAND)

The Sandbox SAND is a blockchain-based virtual world allowing users to create, build, buy and sell digital assets in the form of a game. By combining the powers of decentralised autonomous organisations (DAOs) and non-fungible tokens (NFTs), the Sandbox creates a decentralised platform for a thriving gaming community. The Sandbox employs the powers of blockchain technology by introducing the SAND utility token, which facilitates transactions on the platform.

SAND Price Analysis

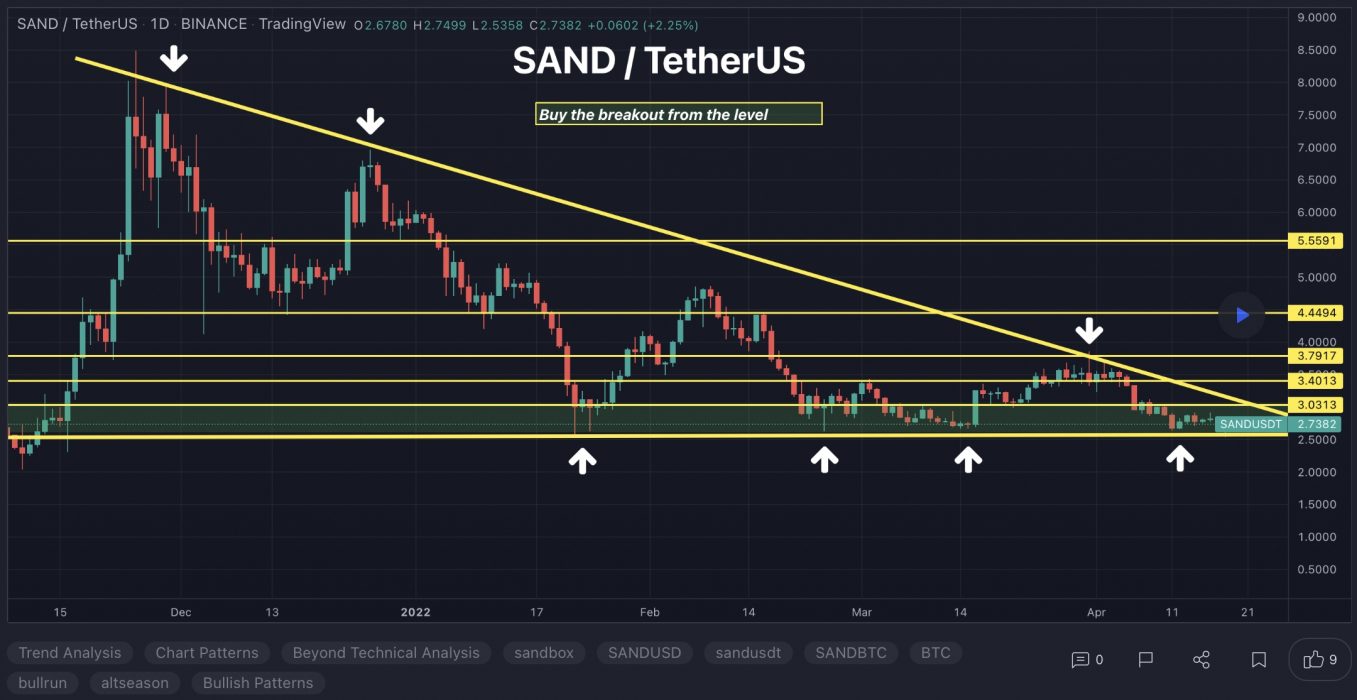
At the time of writing, SAND is ranked the 40th cryptocurrency globally and the current price is US$2.92. Let’s take a look at the chart below for price analysis:

Source: TradingView

SAND‘s impressive gains during February halted at $5.10 before retracing 70% of the move. This price action created several areas of possible higher-timeframe resistance in the process.

The price found resistance on its last swing upward near $3.60 – an area that could provide resistance again. If this swing high breaks, the price might find resistance near $3.85. If this area does provide resistance, it would suggest the formation of a higher-timeframe consolidation.

The fast move up left little higher-timeframe support. However, a vast zone between $2.90 and $3.82 has provided support before and could give support again on a retest. This zone is between the 61.8%-to-78.6% retracement levels of 2021 Q4’s parabolic move.

Inside this zone, the consolidation high near $2.78 to $2.73 might see more sensitivity and mark the bearish target.

Continuation downward through this level, especially if the overall market remains bearish, could retrace most of Q4’s move to the next higher-timeframe support near $2.60.

Learn How to Trade Live!

Join Dave and The Crypto Den Crew and they’ll show you live on a webinar how to take your crypto trading to the next level.

Where to Buy or Trade Altcoins?

These coins have high liquidity on Binance Exchange, so that could help with trading on AUD/USDT/BTC pairs. And if you’re looking at buying and HODLing cryptos, then Swyftx Exchange is an easy-to-use popular choice in Australia.

Categories
Crabada Crypto News EOS Market Analysis Trading

Top 3 Coins to Watch Today: CRA, EOS, SNP – April 19 Trading Analysis

Let’s take a closer look at today’s altcoins showing breakout signals. We’ll explain what the coin is, then dive into the trading charts and provide some analysis to help you decide.

1. Crabada (CRA)

Crabada CRA is a crab-themed play-to-earn NFT game on Avalanche, where players assemble a team of three crabada to earn the in-game currency Treasure Under Sea (TUS). Being an idle game, players deploy their Mining Party consisting of three crabada to mine treasure. Each mining expedition takes four hours and returns 3.75 CRA and 303.75 TUS. Players can also engage in looting missions to try to take over another player’s mining party. Moreover, idle crabada can be lent to other players and deployed as mercenaries.

CRA Price Analysis

At the time of writing, CRA is ranked the 564th cryptocurrency globally and the current price is US$0.488. Let’s take a look at the chart below for price analysis:

Source: TradingView

CRA has declined nearly 69% since its March high and is 8.6% from its all-time low. So far, there are no signs of reversal. 

Traders may still want to monitor the coin for signs of a short-term bounce or reversal as it reaches or declines below its all-time low. Starting Monday, the next month contains a series of launches that could trigger investor interest. These catalysts combined with this low – the last reference point in historical price action for possible support – make it an area of interest.

The closest resistance begins near $0.4799, where the price briefly consolidated before Monday’s move downward. Just above, near $0.5367, the 9 EMA and an inefficiently traded area may also provide resistance. 

A more sustained bounce could reach the low end of an inefficiently traded area near the 18 EMA at $0.6643. If this resistance breaks, the price might retest the previous range’s low and inefficiently traded area near the 2022 yearly open, from $0.7123 to $0.7622.

2. Eos (EOS)

EOS is a platform designed to allow developers to build decentralised apps. The project’s goal is relatively simple: to make it as straightforward as possible for programmers to embrace blockchain technology and ensure the network is easier to use than rivals. As a result, tools and a range of educational resources are provided to support developers who want to build functional apps quickly. EOS also aims to improve the experience for users and businesses. While the project tries to deliver greater security and less friction for consumers, it also vies to unlock flexibility and compliance for enterprises.

EOS Price Analysis

At the time of writing, EOS is ranked the 47th cryptocurrency globally and the current price is US$2.38. Let’s take a look at the chart below for price analysis:

Source: TradingView

EOS has been ranging since early 2022. Last week, the price bounced from an inefficiently traded area near $2.146 before testing the consolidation range low near $2.644. Both of these regions could provide support or resistance again.

Today, the price is testing possible support near $2.347. Bulls have rejected bears multiple times on higher timeframes in this region. The price is in the middle of its range with no apparent signs of its next direction, while market conditions remain bearish.

However, any rejection from possible resistance near $2.418 would suggest that the price is preparing to consolidate for longer or run Q1 2022’s lows into possible support near $1.766. This region saw strong buying in late 2018 and early 2020.

If the two closer resistances break, bulls might eye $3.274 to $3.660 as the next significant resistance. This large, inefficiently traded area on the monthly, above March’s high, provides an appealing target for bulls aiming for bears’ stops.

3. Synapse Network (SNP)

The Synapse Network SNP is a fully functional solution aimed at bridging the gap between investors and brilliant projects. Harnessing the full power of decentralised assets and cross-chain technology, the Synapse ecosystem will let everyone enter the previously extremely elitist world of fundraising, granting the chance to get involved in promising startups since their earliest phases and with minimum capital. Alongside the value of this connection, the network also offers its full backing, providing funds, connecting with VCs and aiding users with its extensive network of tech partners.

SNP Price Analysis

At the time of writing, SNP is ranked the 5567th cryptocurrency globally and the current price is US$0.07587. Let’s take a look at the chart below for price analysis:

Source: TradingView

SNP has declined nearly 91% since December 2021, with no sign of a bullish reversal. The consolidation last Thursday and Friday might provide resistance to push the price down for another leg of selling. 

A rally slightly higher is likely to meet resistance at a more extensive consolidation’s low between $0.08035 and $0.09107. An inefficiently traded area between $0.08241 and $0.08500 could provide the most sensitivity inside this zone.

A gap and old low near $0.1211 could be the target for a more significant rally. At these levels, there is no historical price action to hint at possible support. Extensions from the early February and early April rallies converge near $0.0644 and $0.0480. These zones could support at least short-term bounces.

Learn How to Trade Live!

Join Dave and The Crypto Den Crew and they’ll show you live on a webinar how to take your crypto trading to the next level.

Where to Buy or Trade Altcoins?

These coins have high liquidity on Binance Exchange, so that could help with trading on AUD/USDT/BTC pairs. And if you’re looking at buying and HODLing cryptos, then Swyftx Exchange is an easy-to-use popular choice in Australia.

Categories
Crypto News EOS Fantom Market Analysis Origin Protocol Trading

Top 3 Coins to Watch Today: EOS, FTM, OGN – April 18 Trading Analysis

Let’s take a closer look at today’s altcoins showing breakout signals. We’ll explain what the coin is, then dive into the trading charts and provide some analysis to help you decide.

1. Eos (EOS)

EOS is a platform designed to allow developers to build decentralised apps. The project’s goal is relatively simple: to make it as straightforward as possible for programmers to embrace blockchain technology and ensure the network is easier to use than rivals. As a result, tools and a range of educational resources are provided to support developers who want to build functional apps quickly. EOS also aims to improve the experience for users and businesses. While the project tries to deliver greater security and less friction for consumers, it also vies to unlock flexibility and compliance for enterprises.

EOS Price Analysis

At the time of writing, EOS is ranked the 47th cryptocurrency globally and the current price is US$2.55. Let’s take a look at the chart below for price analysis:

Source: TradingView

Q1 began a bearish trend for EOS, which dropped 70% before setting a low near $1.90 in early March.

After a several-week accumulation and running stops below the December 2021 swing low, late March began a bullish rally that climbed 38% by March 29, reaching the 2022 yearly open.

The old 2021 lows, near $3.20, could mark a resistance area. If this is the start of a larger bullish market cycle, bulls might take their next profits near $3.81 – an inefficient area near November’s breakdown. Another potential resistance is near $4.26, which saw multiple rejections during distribution before November’s breakdown.

An area of old consolidation from $2.75 to $2.97 could provide the next bullish setup before any continuation upward. This area contains the last swing high before late February’s stop run. A drop just below, near $2.30, is also reasonable. This level is near the March monthly open and 40 EMA.

If the bearish trend resumes, bulls might find the next higher-timeframe support between $2.10 and $1.90. This region, especially under $1.72, was inefficiently traded and has not been revisited since 2019.

2. Fantom (FTM)

Fantom FTM is a directed acyclic graph (DAG) smart contract platform providing decentralised finance (DeFi) services to developers using its own bespoke consensus algorithm. Together with its in-house token FTM, Fantom aims to solve problems associated with smart-contract platforms – specifically transaction speed, which developers say they have reduced to under two seconds.

FTM Price Analysis

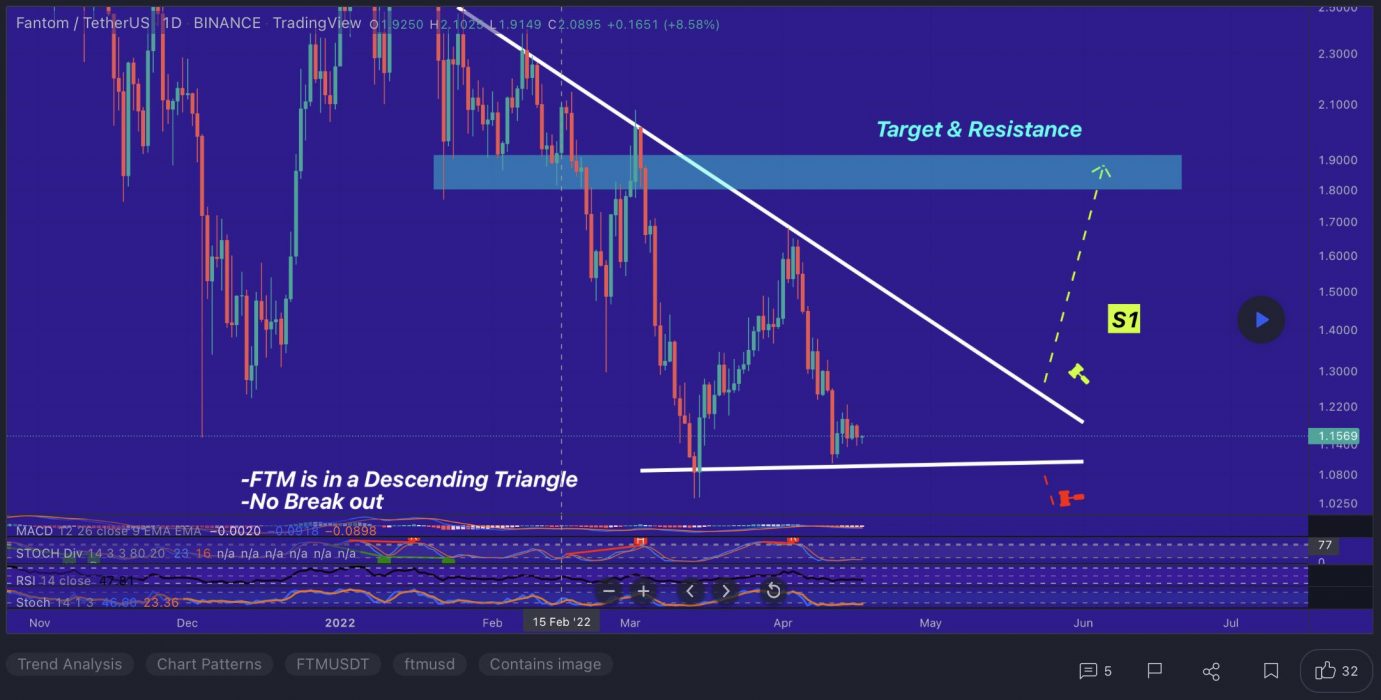
At the time of writing, FTM is ranked the 42nd cryptocurrency globally and the current price is US$1.16. Let’s take a look at the chart below for price analysis:

Source: TradingView

FTM‘s bounce since March ran into resistance near the old monthly highs. This rejection created a set of relatively equal highs near $1.65, possibly forming the next bullish leg’s target. Until then, the price will likely encounter resistance near $1.92.

Currently, the price is testing possible support near the weekly open, around $1.07. This level also has confluence with the 78.6% retracement of the current local range and the 18 and 40 EMAs. 

If this level fails to provide support, a zone from $0.9749 to $0.9130 might mark a possible swing low or consolidation area. This zone is between the 61.8% and 75.6% retracement of early December’s swing.

A more bearish tone in the market could propel the price lower. The lows, near $0.8730, might mark an area of possible support as well as a bearish target.

3. Origin Protocol (OGN)

Origin Protocol OGN is a network that allows market participants to share goods and services through peer-to-peer (P2P) networks. The platform aims to create an extensive online marketplace leveraging the Ethereum (ETH) blockchain and Interplanetary File System (IPFS) in order to eliminate the need for middlemen.

OGN Price Analysis

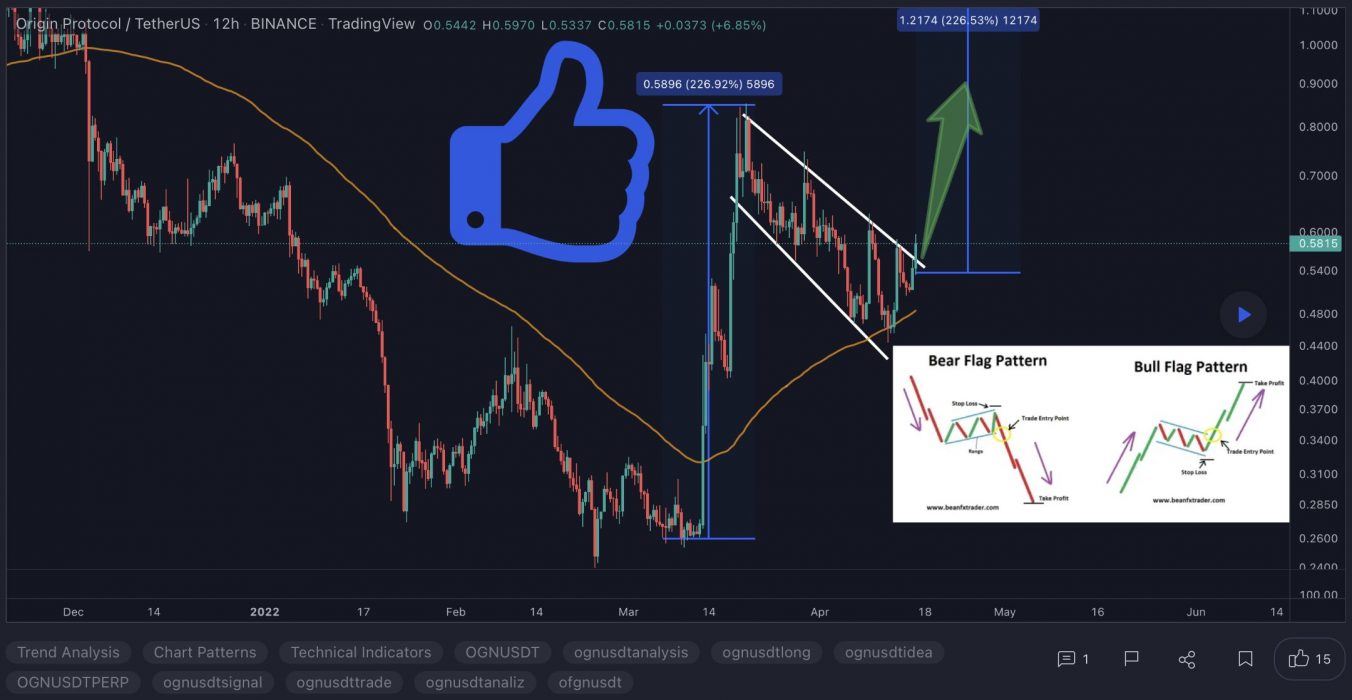
At the time of writing, OGN is ranked the 190th cryptocurrency globally and the current price is US$0.6253. Let’s take a look at the chart below for price analysis:

Source: TradingView

OGN climbed just over 40% from March’s monthly open as it positioned itself to challenge two old swing highs.

The region between $0.4668 and $0.5447 has provided support for the past few days, making it a reasonable place for aggressive traders to take smaller-size positions. However, a better risk-reward entry might form at support between $0.4344 and $0.4372.

If the resistance between $0.7517 and $0.8130 breaks, the next resistance is between $0.8641 and the December swing high at $0.9568, which marks the first primary target for this trend.

Beyond this first target, traders could target a swing high from last year at $1.08, and possibly up to resistance between $1.15 and $1.22.

Learn How to Trade Live!

Join Dave and The Crypto Den Crew and they’ll show you live on a webinar how to take your crypto trading to the next level.

Where to Buy or Trade Altcoins?

These coins have high liquidity on Binance Exchange, so that could help with trading on AUD/USDT/BTC pairs. And if you’re looking at buying and HODLing cryptos, then Swyftx Exchange is an easy-to-use popular choice in Australia.
Categories
ChainLink Crypto News Ethereum Market Analysis Trading WOO Network

Top 3 Coins to Watch Today: ETH, LINK, WOO – April 15 Trading Analysis

Let’s take a closer look at today’s altcoins showing breakout signals. We’ll explain what the coin is, then dive into the trading charts and provide some analysis to help you decide.

1. Ethereum (ETH)

Ethereum ETH is a decentralised open-source blockchain system that features its own cryptocurrency, Ether. ETH works as a platform for numerous other cryptocurrencies, as well as for the execution of decentralised smart contracts. Ethereum’s own purported goal is to become a global platform for decentralised applications, allowing users from all over the world to write and run software that is resistant to censorship, downtime and fraud.

ETH Price Analysis

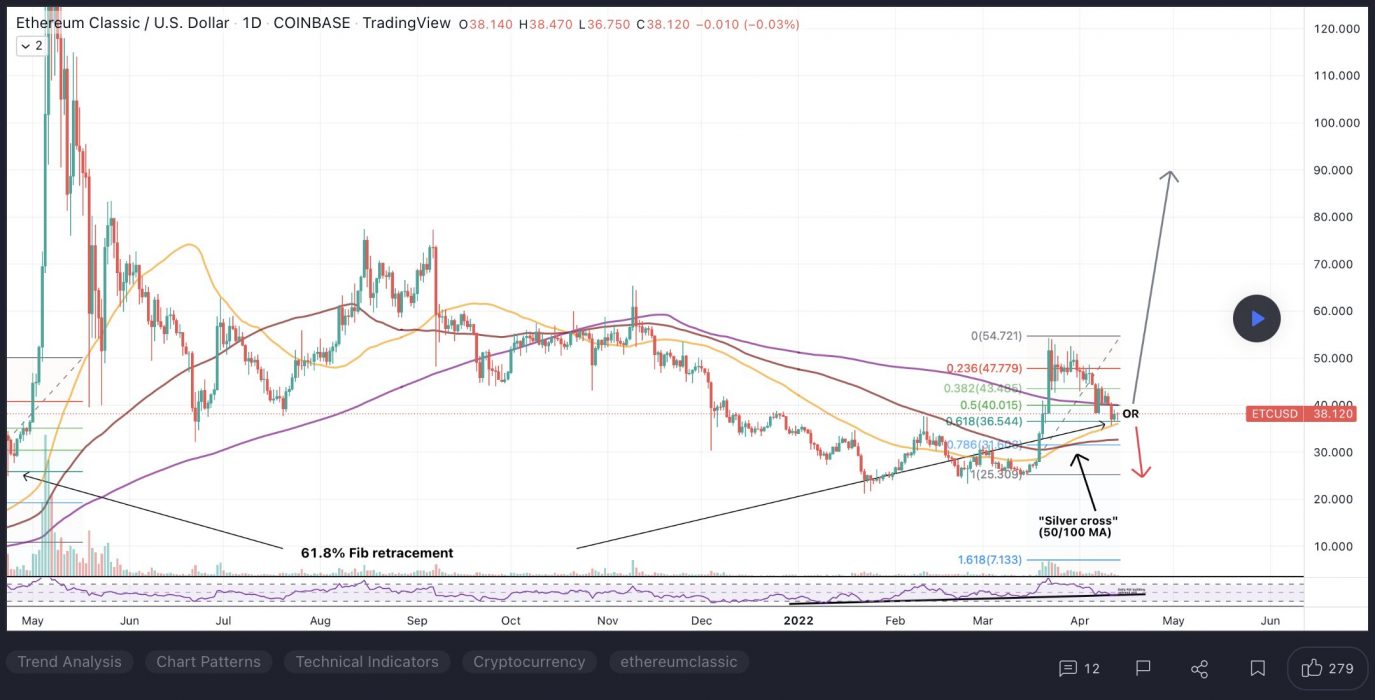
At the time of writing, ETH is ranked the 2nd cryptocurrency globally and the current price is US$3,034.89. Let’s take a look at the chart below for price analysis:

Source: TradingView

ETH‘s long-term range from Q1 highs could be coming to an end. The 9, 18 and 40 EMAs flipped bullish at the beginning of April after late March’s retracement, showing strength as BTC recovered. Currently, the price is hovering just under the monthly high as bulls take some profits.

Two swing highs and the 9 EMA could mark $3010.87 to $2940.72 as an area of possible support. A deeper retracement will likely find some buyers around the 61.8% retracement near $2760.59.

The monthly high will likely see some profit-taking, but the area near the 27% extension, at $3560.12, could also provide some resistance. The 61.8% extensions of the last two swings converge near $3820.54, which could be the target for a monthly high break before a new setup emerges.

The Chainlink Network LINK is driven by a large open-source community of data providers, node operators, smart contract developers, researchers, security auditors and more. The company focuses on ensuring that decentralised participation is guaranteed for all node operators and users looking to contribute to the network. Chainlink allows blockchains to securely interact with external data feeds, events and payment methods, providing the critical off-chain information needed by complex smart contracts to become the dominant form of digital agreement.

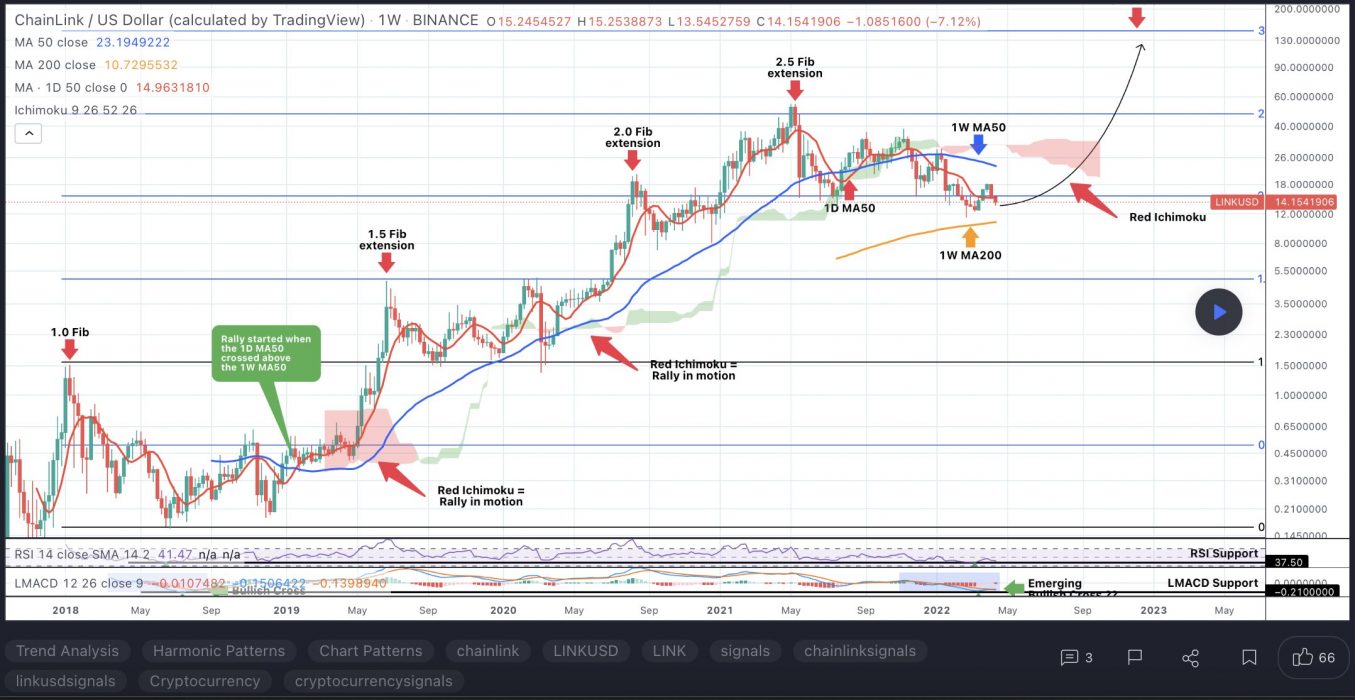
At the time of writing, LINK is ranked the 24th cryptocurrency globally and the current price is US$13.64. Let’s take a look at the chart below for price analysis:

Source: TradingView

LINK‘s early March spike retraced near $13.00 into the consolidation that began the impulse before bouncing to $16.90. 

This consolidation could provide support again, although bears would first have to push the price through possible support near $12.85. The market’s structure may be shifting bearish, with $12.32 likely to provide some resistance if this is the case. A sustained bearish move could reach the swing low near $11.70 before finding support near $11.23.

However, the bullish higher-timeframe trend might prevail, with relatively equal highs near $17.78 potentially giving an attractive target to lure the price over the monthly open. If so, the price could reach for the midpoint of the December wick near $20.58.

3. WOO Network (WOO)

WOO Network is a deep liquidity network connecting traders, exchanges, institutions and DeFi platforms with democratised access to best-in-class liquidity and trading execution at lower or zero cost. WOO Token is used in the network’s CeFi and DeFi products for staking and fee discounts. Presently, a diverse set of products and services interfacing retail, institutions, CeFi and DeFi have been built. WOO X is a zero-fee trading platform providing professional and institutional traders with best-in-class liquidity and execution. It features fully customisable modules for workspace customisation.

WOO Price Analysis

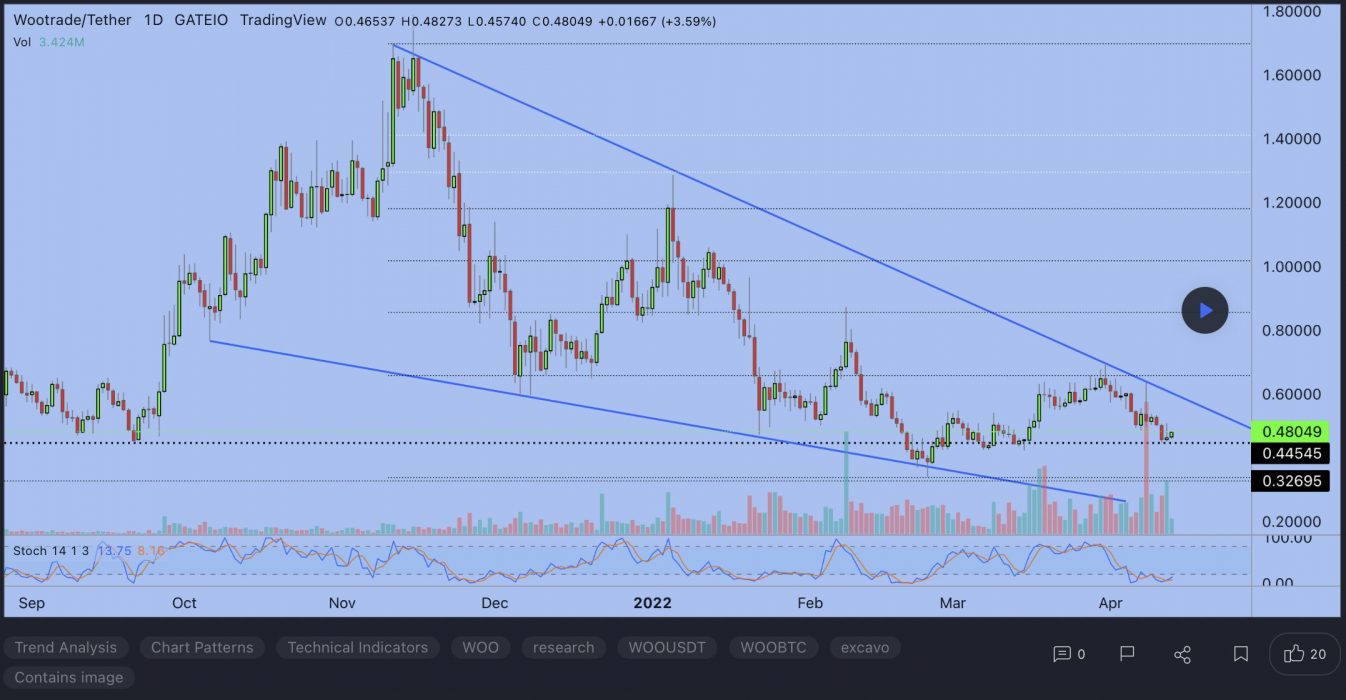
At the time of writing, WOO is ranked the 127th cryptocurrency globally and the current price is US$0.4826. Let’s take a look at the chart below for price analysis:

Source: TradingView

WOO has retraced 80% from its January highs and is currently challenging possible support near $0.4540, between the 61.8% and 78.6% retracement levels. 

If this level fails to provide support, the 78.6% retracement, near $0.4301, offers a strong draw for shorts with multiple daily swing lows and an inefficient area. 

Continued bearish conditions may cause this level to break, running all swing lows since Q2 2021 into the upper portion of an inefficient region starting near $0.3700. Near the midpoint and bottom of this region, lower timeframes show that $0.3520 and $0.3240 could also provide some sensitivity.

The low of early December’s consolidation, near $0.5817, and the 9 EMA may provide some resistance on any retracements. A continued rally – unlikely unless the overall market’s catalysts drastically shift – could reach over the 2021 open to $0.6427 and possibly $0.7100, where the daily chart shows a head-and-shoulders formation.

Learn How to Trade Live!

Join Dave and The Crypto Den Crew and they’ll show you live on a webinar how to take your crypto trading to the next level.

Where to Buy or Trade Altcoins?

These coins have high liquidity on Binance Exchange, so that could help with trading on AUD/USDT/BTC pairs. And if you’re looking at buying and HODLing cryptos, then Swyftx Exchange is an easy-to-use popular choice in Australia.
Categories
Algorand Crypto News Market Analysis NEAR Protocol Trading Zilliqa

Top 3 Coins to Watch Today: ALGO, NEAR, ZIL – April 14 Trading Analysis

Let’s take a closer look at today’s altcoins showing breakout signals. We’ll explain what the coin is, then dive into the trading charts and provide some analysis to help you decide.

1. Algorand (ALGO)

The Algorand ALGO blockchain is a permissionless, pure proof-of-stake blockchain protocol. Unlike Proof-of-Work (PoW) blockchains, where the root block must be validated by randomly selected validators (using computing power), in the pure proof-of-stake approach all of the validators are known to one another and only have to agree on the next block in order to create a new block. Algorand was invented to speed up transactions and improve efficiency in response to the slow transaction times of Bitcoin and other blockchains.

ALGO Price Analysis

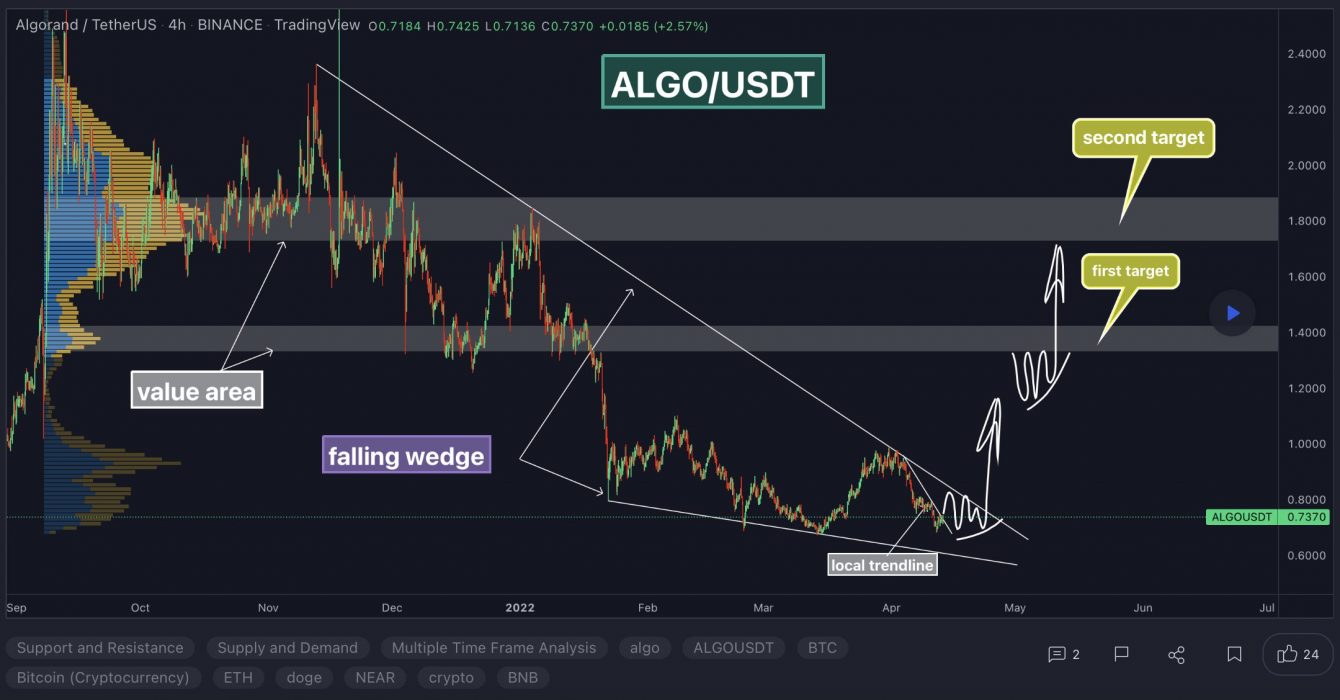
At the time of writing, ALGO is ranked the 30th cryptocurrency globally and the current price is US$0.7426. Let’s take a look at the chart below for price analysis:

Source: TradingView

After creating a second equal low during last month, ALGO gained nearly 20% into resistance that starts near $0.9322.

Swing traders looking for a continuation to the nearest cluster of relatively equal highs around $1.12 might look for bids near $1.06. More significant resistance rests above, near $1.18. A group of significant swing highs at $1.20 and $1.26 give possible targets if this resistance breaks.

A stop run on the recent low at $0.7065 into possible support beginning near $0.6630 might see stronger bidding. This area also has a confluence with the recent monthly lows.

2. Near Protocol (NEAR)

NEAR Protocol is a decentralised application platform designed to make apps usable on the web. The network runs on a Proof-of-Stake (PoS) consensus mechanism called Nightshade, which aims to offer scalability and stable fees. NEAR uses human-readable account names, unlike the cryptographic wallet addresses common to Ethereum. NEAR also introduces unique solutions to scaling problems and has its own consensus mechanism, called “Doomslug”.

NEAR Price Analysis

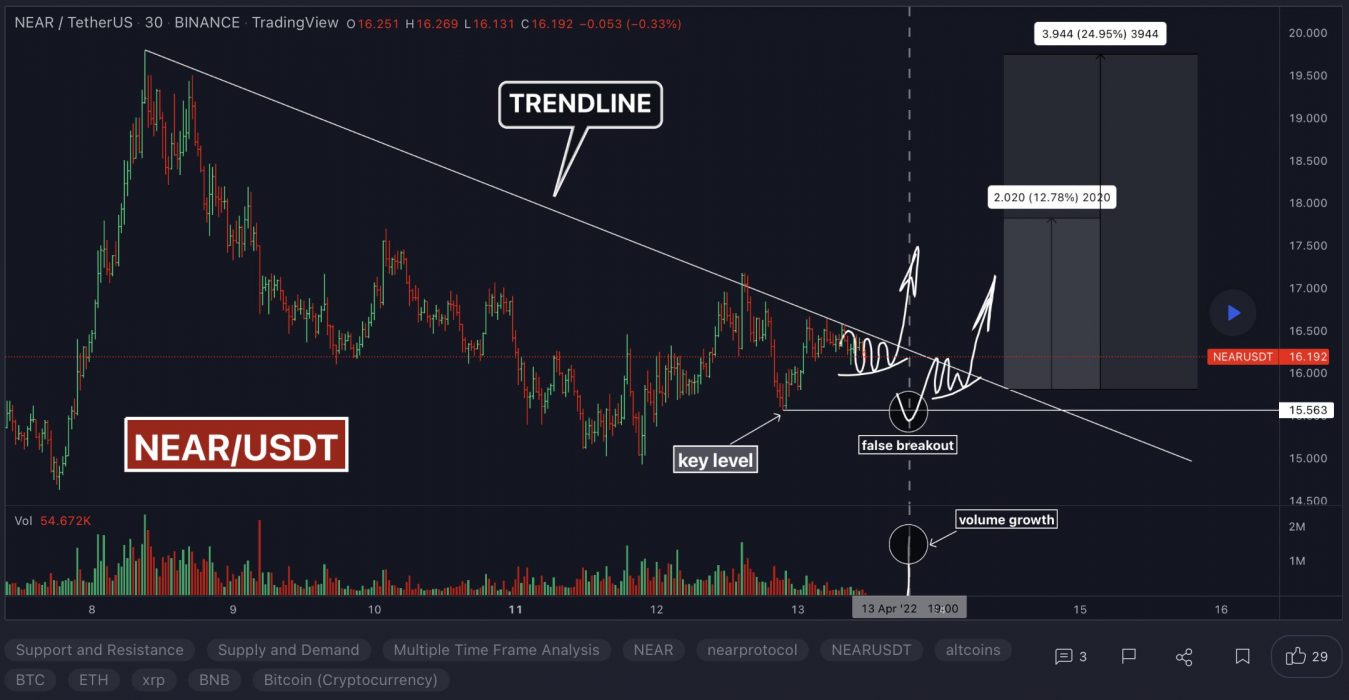
At the time of writing, NEAR is ranked the 17th cryptocurrency globally and the current price is US$16.74. Let’s take a look at the chart below for price analysis:

Source: TradingView

After its uptrend during Q1, NEAR has retraced 20% from its highs to support at the retracement of around $15.15.

The price shifted market structure to run to the consolidation lows near $14.51, just under the monthly open. Continued bullishness in the market may create support just below, between $14.00 and $13.45. 

Bulls might show more interest if the price retraces near the February open, around $13.00. Continued bearishness could see the price reach into old support around $12.55. 

On the other hand, if the current resistance breaks, the price might find resistance near $21.98, whereas mid-January buyers may still be trapped in longs.

3. Zilliqa (ZIL)

Zilliqa ZIL is a public, permissionless blockchain designed to offer high throughput with the ability to complete thousands of transactions per second. It seeks to solve the issue of blockchain scalability and speed by employing sharding as a second-layer scaling solution. The platform is home to many decentralised applications, and it also allows for staking and yield farming. The native utility token of Zilliqa, ZIL, is used to process transactions on the network and execute smart contracts.

ZIL Price Analysis

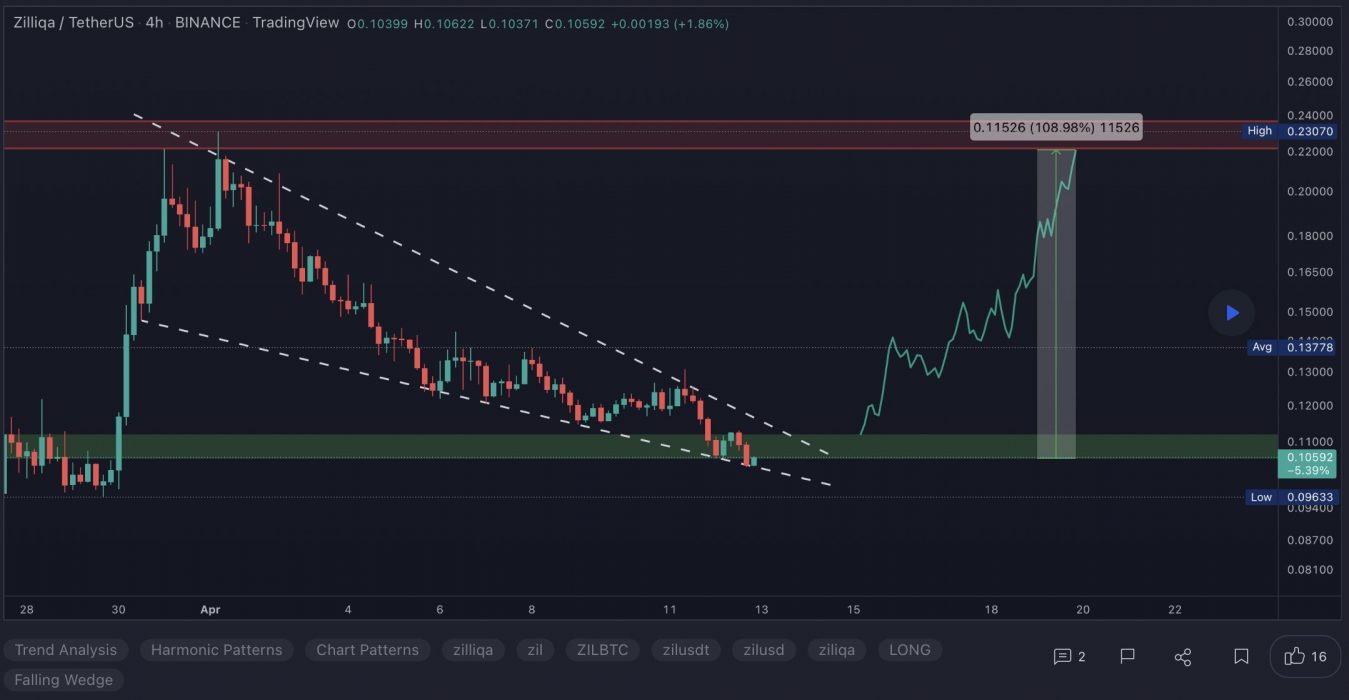
At the time of writing, ZIL is ranked the 70th cryptocurrency globally and the current price is US$0.1091. Let’s take a look at the chart below for price analysis:

Source: TradingView

ZIL‘s 65% drop during Q1 found a low near $0.04038 before closing over a monthly high around $0.1482 with massive gains. This daily close over the high could signal a shift in market structure that might reach probable resistance near $0.1637.

A sustained bullish move may target the swing high at $0.1864. If this stop run occurs, a run beyond the high into probable resistance near $0.1988 and $0.2045 is possible.

Bulls could buy a retracement to possible support near $0.1018, just above the weekly open. A bearish turn in the marketplace may propel the price toward possible support near $0.09376. 

However, relatively equal lows near $0.08834 and $0.08224 provide an attractive target for bears if the market resumes its bearish trend. A run on these lows might find support between $0.07815 and $0.07766.

Learn How to Trade Live!

Join Dave and The Crypto Den Crew and they’ll show you live on a webinar how to take your crypto trading to the next level.

Where to Buy or Trade Altcoins?

These coins have high liquidity on Binance Exchange, so that could help with trading on AUD/USDT/BTC pairs. And if you’re looking at buying and HODLing cryptos, then Swyftx Exchange is an easy-to-use popular choice in Australia.
Categories
Crypto News Kava Litecoin Market Analysis Stellar Trading

Top 3 Coins to Watch Today: LTC, XLM, KAVA – April 13 Trading Analysis

Let’s take a closer look at today’s altcoins showing breakout signals. We’ll explain what the coin is, then dive into the trading charts and provide some analysis to help you decide.

1. Litecoin (LTC)

Litecoin LTC is a cryptocurrency designed to provide fast, secure and low-cost payments by leveraging the unique properties of blockchain technology. The cryptocurrency was created based on the Bitcoin protocol, but it differs in terms of the hashing algorithm used, hard cap, block transaction times, and a few other factors. Litecoin has a block time of just 2.5 minutes and extremely low transaction fees, making it suitable for micro-transactions and point-of-sale payments.

LTC Price Analysis

At the time of writing, LTC is ranked the 20th cryptocurrency globally and the current price is US$103.65. Let’s take a look at the chart below for price analysis:

Source: TradingView

After setting a low last month, LTC kicked off a recovery trend that gained nearly 20% to break the weekly highs.

The following 65% plummet found support near $102.36, sweeping under the 40 EMA into the 61.8% retracement level before bouncing to resistance beginning at $120.53.

This area could continue to provide resistance, possibly causing a retracement to the 9 EMA and 18 EMA near $125.12, where aggressive bulls might begin bidding. The level near $134.98, which has confluence with the 40 EMA, may see more interest from bulls loading up for an attempt on probable resistance beginning near $147.13. 

However, if Bitcoin continues its sideways trend, much lower prices could be seen. The old support near $100.18 could provide at least a short-term bounce. If this level fails, the old monthly lows near $91.23 might also give support and see the start of a new bullish cycle after retesting these support levels.

2. Stellar (XLM)

Stellar XLM is an open network that allows money to be moved and stored. When it was released, the goal was boosting financial inclusion by reaching the world’s unbanked – but soon after, its priorities shifted to helping financial firms connect with one another through blockchain technology. The network’s native token, lumens, serves as a bridge that makes it less expensive to trade assets across borders. All of this aims to challenge existing payment providers who often charge high fees for a similar service.

XLM Price Analysis

At the time of writing, XLM is ranked the 30th cryptocurrency globally and the current price is US$0.1902. Let’s take a look at the chart below for price analysis:

Source: TradingView

XLM set a high near $0.2557 in early April before retracing nearly 25% to find a low near $0.1780. The price consolidated around this level before the strong bullish impulse during the past several weeks.

Probable resistance near $0.2478 is slowing the bullish advance down. However, another leg might target the last swing high at $0.2822 and relatively equal highs at $0.3136. Resistance near $0.3359 could cap the move before the second swing high. Beyond these levels, little stands in the bulls’ way before reaching the swing high near $0.3856.

A retracement before a move higher might find support in the daily gap near $0.1743, just above the monthly open. Relatively equal lows near $0.1675 could also provide support. Run-on stops at $0.1605 and $0.1583 might find support in the gap beginning near $0.1520.

3. Kava.io (KAVA)

KAVA is a cross-chain DeFi lending platform that allows users to borrow USDX stablecoins and deposit a variety of cryptocurrencies to begin earning a yield. The Kava DeFi hub operates as a decentralised bank for digital assets, allowing users to access a range of decentralised financial services, including its native USD-pegged stablecoin, USDX, as well as synthetics and derivatives. Through Kava, users are able to borrow USDX tokens by depositing collateral, effectively leveraging their exposure to crypto-assets.

KAVA Price Analysis

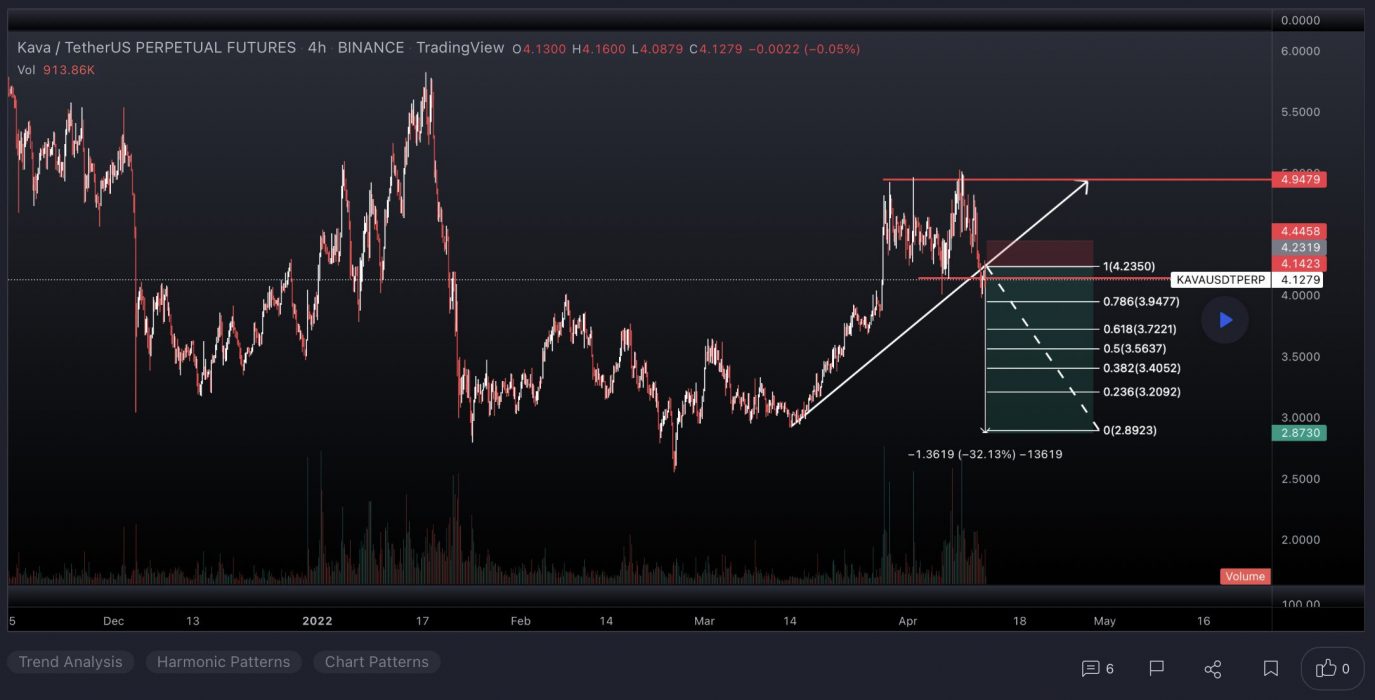
At the time of writing, KAVA is ranked the 96th cryptocurrency globally and the current price is US$4.07. Let’s take a look at the chart below for price analysis:

Source: TradingView

The last year saw KAVA travel through a massive range from approximately $8.00 to $3.66. Currently, it is trending downward into the range lows.

Resistance might be found just above the current price, beginning near $4.75. This area has confluence with the 9 and 18 EMAs. 

A stronger retracement against the bearish trend could reach the 40 EMA and the March monthly open, near $3.70. 

Although unlikely in the current bearish market conditions, a more significant rally might reach over the 2022 yearly open to test an inefficiently traded area from $4.19 to $4.48.

During Q1, the price bounced from the support between $3.15 to $3.00 while wicking just under a narrow support zone at $2.89. These two levels could provide support again. 

However, the price has been consolidating on higher timeframes since late January. Given the current bearish market conditions, it seems likely that a retest of these two support levels may fail. 

Learn How to Trade Live!

Join Dave and The Crypto Den Crew and they’ll show you live on a webinar how to take your crypto trading to the next level.

Where to Buy or Trade Altcoins?

These coins have high liquidity on Binance Exchange, so that could help with trading on AUD/USDT/BTC pairs. And if you’re looking at buying and HODLing cryptos, then Swyftx Exchange is an easy-to-use popular choice in Australia.
Categories
Crypto News Fetch.ai Market Analysis Oasis Network QuarkChain Trading

Top 3 Coins to Watch Today: FET, QKC, ROSE – April 12 Trading Analysis

Let’s take a closer look at today’s altcoins showing breakout signals. We’ll explain what the coin is, then dive into the trading charts and provide some analysis to help you decide.

1. Fetch.ai (FET)

Fetch.ai FET is a platform that aims to connect Internet of Things (IoT) devices and algorithms to enable their collective learning. Fetch.ai is built on a high-throughput sharded ledger and offers smart contract capabilities to deploy machine learning and artificial intelligence solutions for decentralised problem-solving. These open-source tools are designed to help users create ecosystem infrastructure and deploy commercial models.

FET Price Analysis

At the time of writing, FET is ranked the 184th cryptocurrency globally and the current price is US$0.3437. Let’s take a look at the chart below for price analysis:

Source: TradingView

FET rallied 139% from its February low before running to resistance near equal highs at $0.5440. These highs may be a target in the future. 

The price could find support near $0.3583 as holders buy and stake FET for the stakedrop. This level is close to the 61.8% retracement, the upper half of a consolidation, and 9, 18 and 40 EMAs bullish flip.

Just below, near $0.3153, the 78.6% retracement and inefficiently traded area at the origin of March’s move could also provide support.

Until the price tests these levels, $0.4190 could provide the closest resistance. This area is inefficiently traded and contains the 9 and 18 EMAs.

Slightly higher, near $0.4596, the April monthly open and origin of the current bearish retracement could also give resistance.

If the price does find support, this could be the start of a more significant swing that may reach probable resistance between $0.6318 and $0.6943. This inefficiently traded area fills the 27% and 50% extensions and would target bears’ stops above multiple swings.

2. QuarkChain (QKC)

The QuarkChain Network QKC is a permissionless blockchain architecture that aims to meet global commercial standards. It aims to provide a secure, decentralised and scalable blockchain solution to deliver 100,000+ on-chain TPS. QuarkChain is a public chain that can support multiple consensuses, and multiple transaction models including virtual machines VMs, ledger, and token economics in one network. It can reportedly adapt to blockchain innovations by customising consensus, transaction model (including VM), ledger, and token economics in each shard to satisfy different requirements of different industries/enterprises/DApps.

QKC Price Analysis

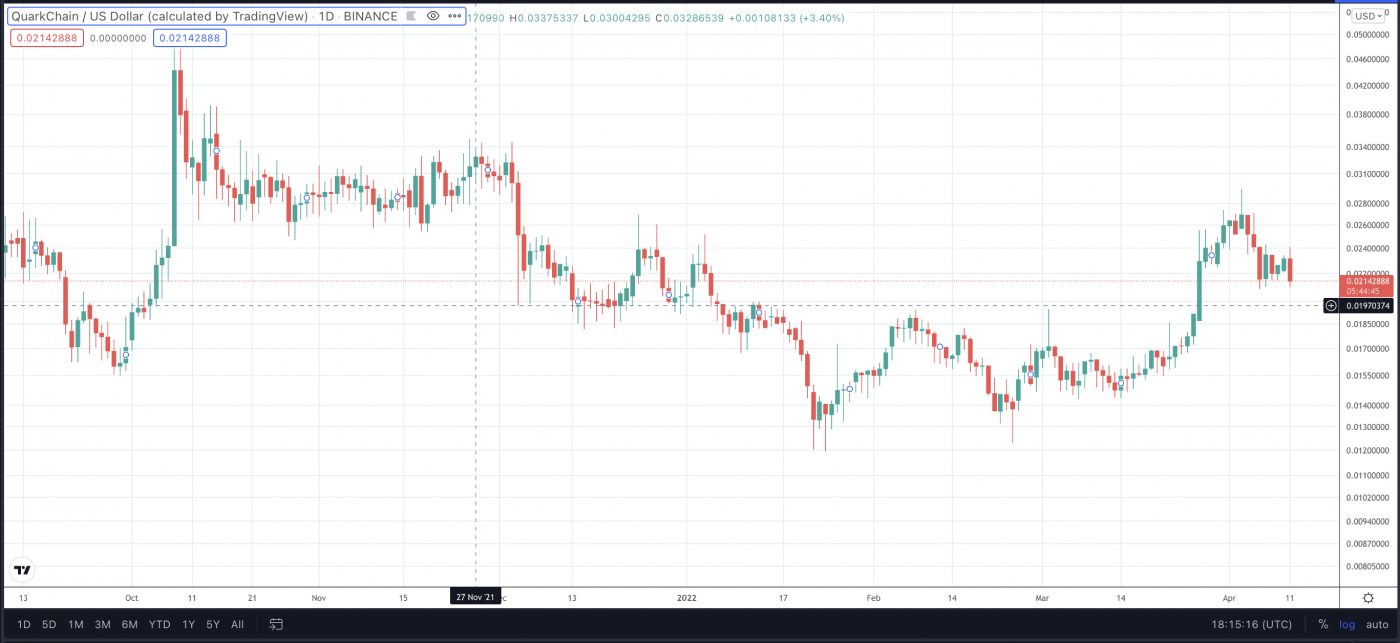
At the time of writing, QKC is ranked the 316th cryptocurrency globally and the current price is US$0.02138. Let’s take a look at the chart below for price analysis:

Source: TradingView

QKC surged near the end of March, setting a high 157% above its January low.

Consolidation lows near $0.02757 might provide the next significant resistance. However, the April monthly open could also offer some short-term resistance.

Near the 2022 yearly open, 40 EMA and 61.8% retracement, $0.02131 is being tested as support. The price bounced from this level and is compressing between the 9 and 18 EMAs.

Slightly lower, $0.01897 to $0.01710 may offer more robust support. The price may want to re-trade down through the inefficient area to this level, which has confluence with the 78.6% retracement and old swing highs.

If either of these supports does begin a new significant bullish rally, bulls might next target an area near $0.03599. Reaching this level would run bears’ stops above multiple relatively equal highs near the 27% extensions.

3. Oasis Network (ROSE)

The Oasis Network ROSE is the first privacy-enabled blockchain platform for open finance and a responsible data economy. Combined with its high throughput and secure architecture, the Oasis Network is able to power private, scalable DeFi, revolutionising Open Finance and expanding it beyond traders and early adopters to a mass market. Its unique privacy features can not only redefine DeFi but also create a new type of digital asset called Tokenised Data that can enable users to take control of the data they generate and earn rewards for staking it with applications – creating the first-ever responsible data economy.

ROSE Price Analysis

At the time of writing, ROSE is ranked the 90th cryptocurrency globally and the current price is US$0.2367. Let’s take a look at the chart below for price analysis:

Source: TradingView

ROSE climbed 82% from its February low, then dropped nearly 29% into support last Tuesday and Wednesday.

The price is currently testing this support again, near $0.2490. It may provide support again and has confluence with the 61.8% and 78.6% retracements.

Resistance begins just above, at $0.2637. This inefficiently traded area, which reaches slightly beyond $0.2862, contains the April monthly open, a bearish market structure break on the daily chart, and the 9, 18 and 40 EMAs. 

These confluences often provide strong resistance. Since this resistance is close to the $0.2490 support, the price might enter consolidation before breaking out to the next move.

If the price breaks this resistance, bulls might eye an area of old rejection, near $0.3062, as their next target. Continuation through this level may target another area of bearish rejection on the weekly chart, near the 27% extension from $0.3495 to $0.3660.

A more significant bearish turn in the market may reach for bulls’ stops under the February lows, down to an area of old support in an inefficiently traded area between $0.1641 and $0.1174.

Learn How to Trade Live!

Join Dave and The Crypto Den Crew and they’ll show you live on a webinar how to take your crypto trading to the next level.

Where to Buy or Trade Altcoins?

These coins have high liquidity on Binance Exchange, so that could help with trading on AUD/USDT/BTC pairs. And if you’re looking at buying and HODLing cryptos, then Swyftx Exchange is an easy-to-use popular choice in Australia.

Categories
Crypto News Market Analysis Solana Terra Trading TRON

Top 3 Coins to Watch Today: SOL, LUNA, TRX – April 11 Trading Analysis

Let’s take a closer look at today’s altcoins showing breakout signals. We’ll explain what the coin is, then dive into the trading charts and provide some analysis to help you decide.

1. Solana (SOL)

Solana SOL is a highly functional open-source project that banks on blockchain technology’s permissionless nature to provide decentralised finance (DeFi) solutions. The Solana protocol is designed to facilitate decentralised app (DApp) creation. It aims to improve scalability by introducing a proof-of-history (PoH) consensus combined with the underlying proof-of-stake (PoS) consensus of the blockchain.

SOL Price Analysis

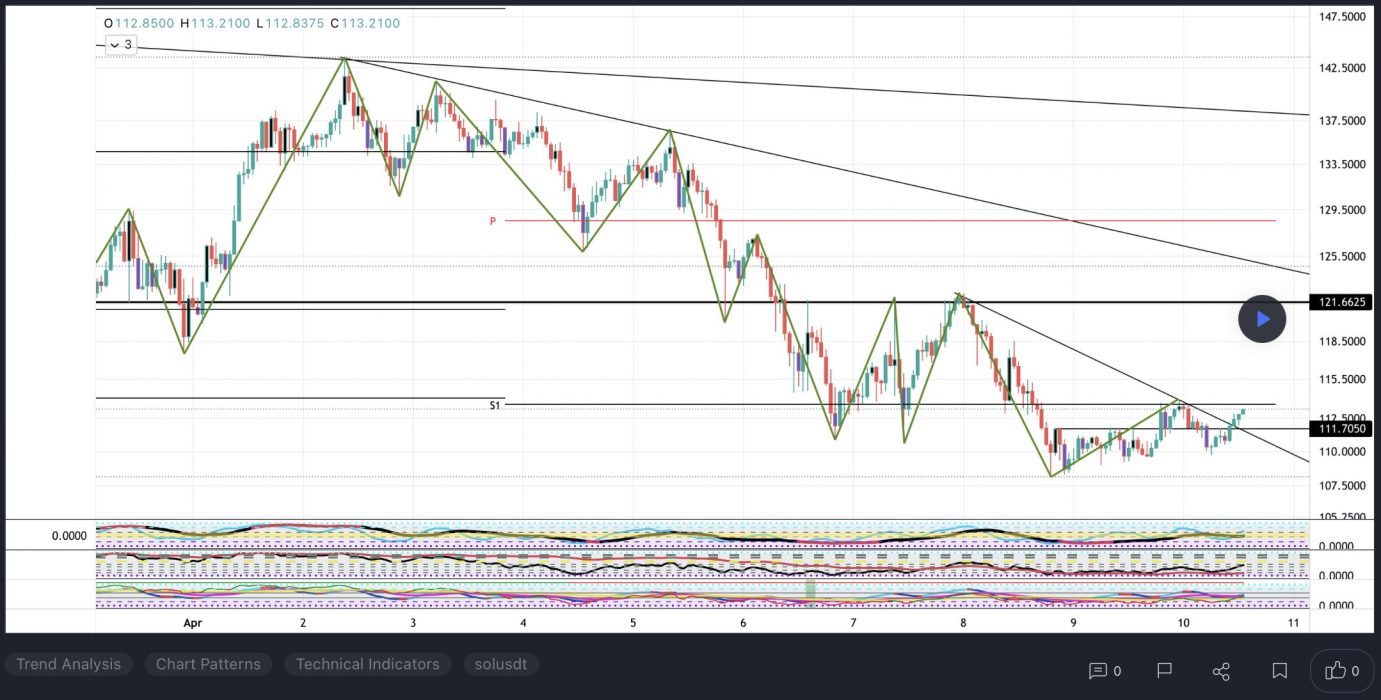
At the time of writing, SOL is ranked the 6th cryptocurrency globally and the current price is US$113.76. Let’s take a look at the chart below for price analysis:

Source: TradingView

SOL has retraced 60% from its December highs and reached possible support last month near $85.34. Resistance might begin near $115.24, which has confluence with the 9 and 18 EMAs.

A more substantial rally might reach near the swing high at $120.23 and the 40 EMA. This high is less likely to break if bears plan to continue the downtrend without a lengthier consolidation.

While not highly probable in the current market conditions, a more animated move upward could reach a wide resistance area between $126.42 and $139.94. This zone is where the last movement down accumulated positions before breaking down. 

Possible support rests near $105.34, which showed sensitivity on the last test. While it could provide support again, the higher-timeframe bearish trend is more likely to propel the price into an inefficient area between $96.10 and $90.54. If the price reaches this zone, the May 2021 swing high near $84.13 might mark a more sensitive level.

2. Terra (LUNA)

Terra LUNA is a blockchain protocol that uses fiat-pegged stablecoins to power price-stable global payments systems. According to its whitepaper, Terra combines the price stability and wide adoption of fiat currencies with the censorship-resistance of Bitcoin, and offers fast and affordable settlements. Terra’s native token, LUNA, is used to stabilise the price of the protocol’s stablecoins. LUNA holders are also able to submit and vote on governance proposals, giving it the functionality of a governance token.

LUNA Price Analysis

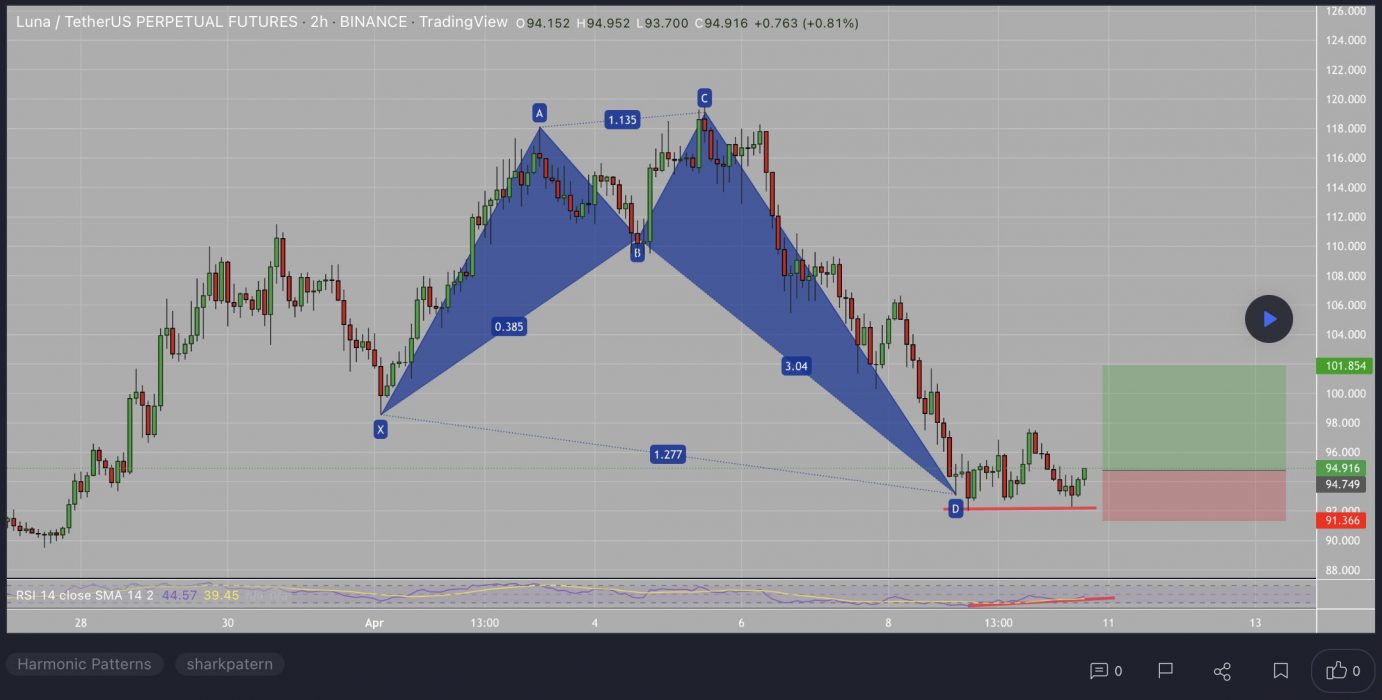
At the time of writing, LUNA is ranked the 9th cryptocurrency globally and the current price is US$94.89. Let’s take a look at the chart below for price analysis:

Source: TradingView

LUNA showed significant strength in the face of a mostly bearish altcoin market, rallying over 95% during Q1.

The price is currently retracing from resistance near $114.90, just below the all-time high. Bulls might begin eyeing entries near $90.00, which will soon be near the 18 EMA and between the 61.8% and 78.6% retracement levels of the last leg upward.

A deeper retracement might reach an inefficient zone and the 40 EMA under the last daily swing low, between $87.44 and $84.07. A move below this low suggests a more bearish shift in market structure. If this shift occurs, it could create a short setup to target possible support at the upmove’s accumulation zone, near $79.41.

While the price is retracing, $98.44 offers the closest probable resistance at the yearly open. Just above, near the March monthly open, the consolidation lows near $101.69 are also a reasonable candidate for resistance.

If the price breaks through these resistances, the significant resistance at $107.69 might also break and allow LUNA to set new monthly highs. However, bulls should keep in mind that the overall market is mostly bearish, decreasing the chances of a massive bullish breakout. If the price does break the all-time high and enter discovery, overlapping extensions near $125.40 offer a possible significant target.

3. Tron (TRX)

Tron TRX is a blockchain-based operating system that aims to ensure this technology is suitable for daily use. Whereas Bitcoin can handle up to six transactions per second, and Ethereum up to 25, TRON claims that its network has a capacity for 2,000 TPS. This project is best described as a decentralised platform focused on content sharing and entertainment and to this end, one of its biggest acquisitions was the file-sharing service BitTorrent in 2018. Overall, TRON has divided its goals into six phases. These include delivering simple distributed file sharing, driving content creation through financial rewards.

TRX Price Analysis

At the time of writing, TRX is ranked the 25th cryptocurrency globally and the current price is US$0.06387. Let’s take a look at the chart below for price analysis:

Source: TradingView

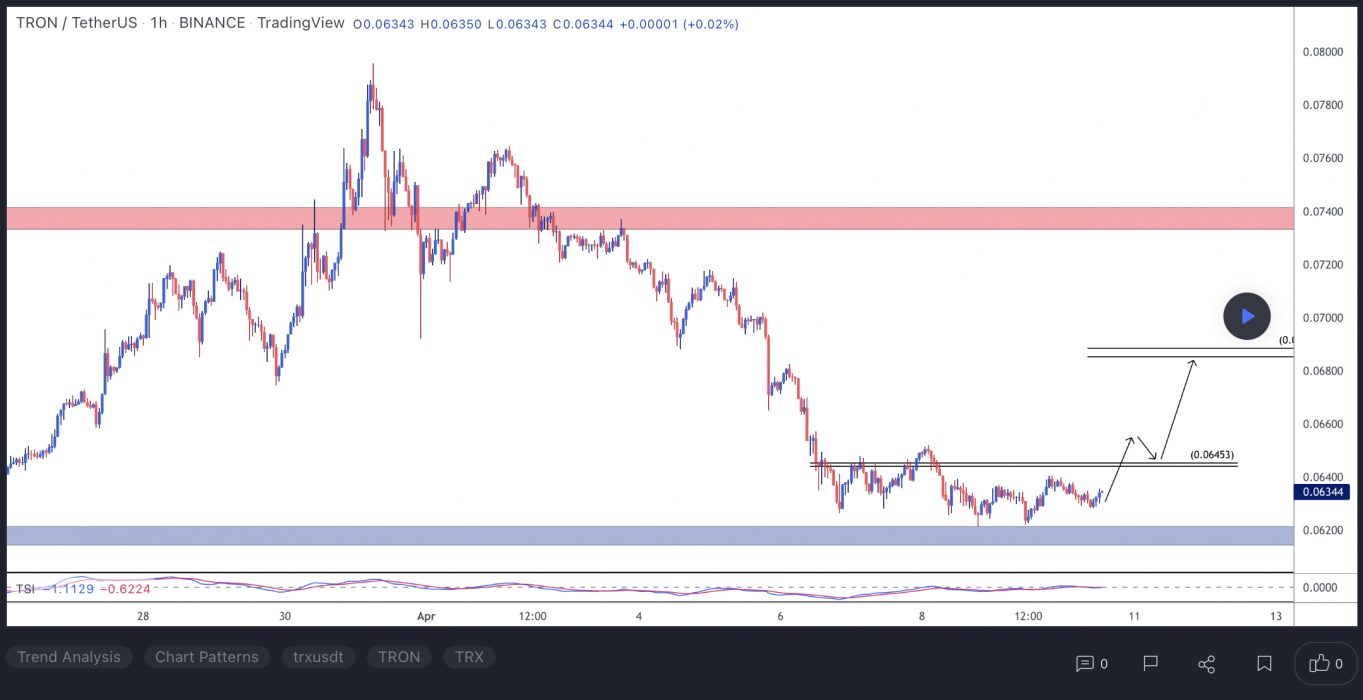
TRX accompanied the rest of the market during the January drop, falling nearly 50% from its mid-December high until it found a low early in February.

Price action formed a weekly support level near $0.06154, which has so far held up the price. The most recent swing low inside this range, near $0.05929, might be the target for any future stop runs. After this low, the swing low near $0.05789 and the gap beginning near $0.05555 mark possible higher-timeframe support.

The price is currently battling with significant higher-timeframe resistance levels, with the closest probable resistance resting near $0.07092, just over the previous monthly open. A sweep of the relatively equal highs above this resistance might find sellers near $0.07535 – but could reach as high as $0.08137.

Learn How to Trade Live!

Join Dave and The Crypto Den Crew and they’ll show you live on a webinar how to take your crypto trading to the next level.

Where to Buy or Trade Altcoins?

These coins have high liquidity on Binance Exchange, so that could help with trading on AUD/USDT/BTC pairs. And if you’re looking at buying and HODLing cryptos, then Swyftx Exchange is an easy-to-use popular choice in Australia.
Categories
Bitcoin Cash Crypto News Gala Internet Computer Market Analysis Trading

Top 3 Coins to Watch Today: BCH, ICP, GALA – April 8 Trading Analysis

Let’s take a closer look at today’s altcoins showing breakout signals. We’ll explain what the coin is, then dive into the trading charts and provide some analysis to help you decide.

1. Bitcoin Cash (BCH)

Bitcoin Cash BCH is a peer-to-peer electronic cash system that aims to become sound global money with fast payments, micro fees, privacy, and high transaction capacity (big blocks). In the same way that physical money, such as a dollar bill, is handed directly to the payee, Bitcoin Cash payments are sent directly from one person to another. As a permissionless, decentralised cryptocurrency, Bitcoin Cash requires no trusted third parties and no central bank. Unlike traditional fiat money, Bitcoin Cash does not depend on monetary middlemen such as banks and payment processors.

BCH Price Analysis

At the time of writing, BCH is ranked the 26th cryptocurrency globally and the current price is US$336.47. Let’s take a look at the chart below for price analysis:

Source: TradingView

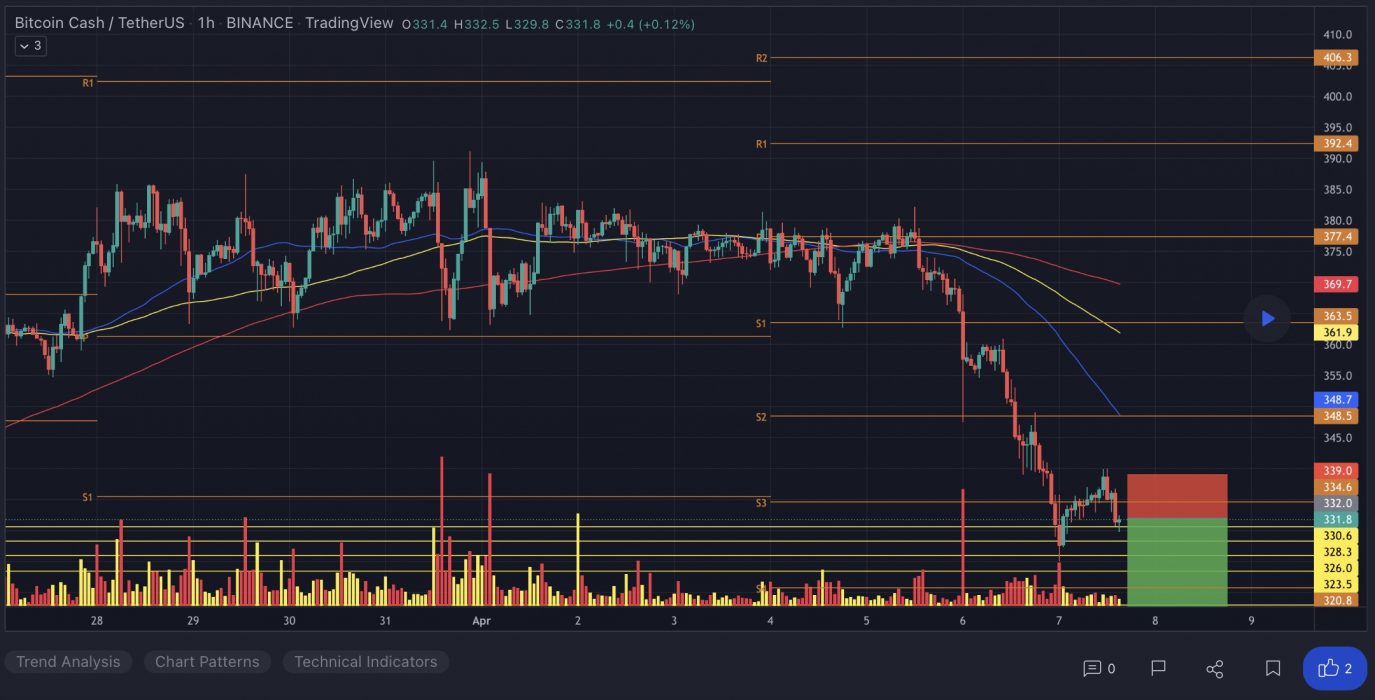
March marked a turning point for BCH, with the price rocketing up almost 45% from its lows to probable resistance beginning near $386.22.

The price is currently struggling with the area between $365.43 and $329.76. This region could provide support after a close above – or resistance after a close below. 

A retracement could reach into the daily gap and possible support around $340.33. A more bearish shift in the marketplace will likely aim for the relatively equal lows near $336.21, and the potential support just below that begins around $330.64.

Continuation to the upside will likely target the monthly high near $375.30. However, probable resistance beginning at $390.55 and $420.05 could cap or slow down this move.

2. Internet Computer (ICP)

The Internet Computer ICP is the world’s first blockchain that runs at web speed with unbounded capacity. It also represents the third major blockchain innovation, alongside Bitcoin and Ethereum – a blockchain computer that scales smart contract computation and data, runs them at web speed, processes and stores data efficiently, and provides powerful software frameworks to developers. By making this possible, the Internet Computer enables the complete reimagination of software, providing a revolutionary new way to build tokenised internet services, pan-industry platforms, decentralised financial systems, and even traditional enterprise systems and websites.

ICP Price Analysis

At the time of writing, ICP is ranked the 36th cryptocurrency globally and the current price is US$19.16. Let’s take a look at the chart below for price analysis:

Source: TradingView

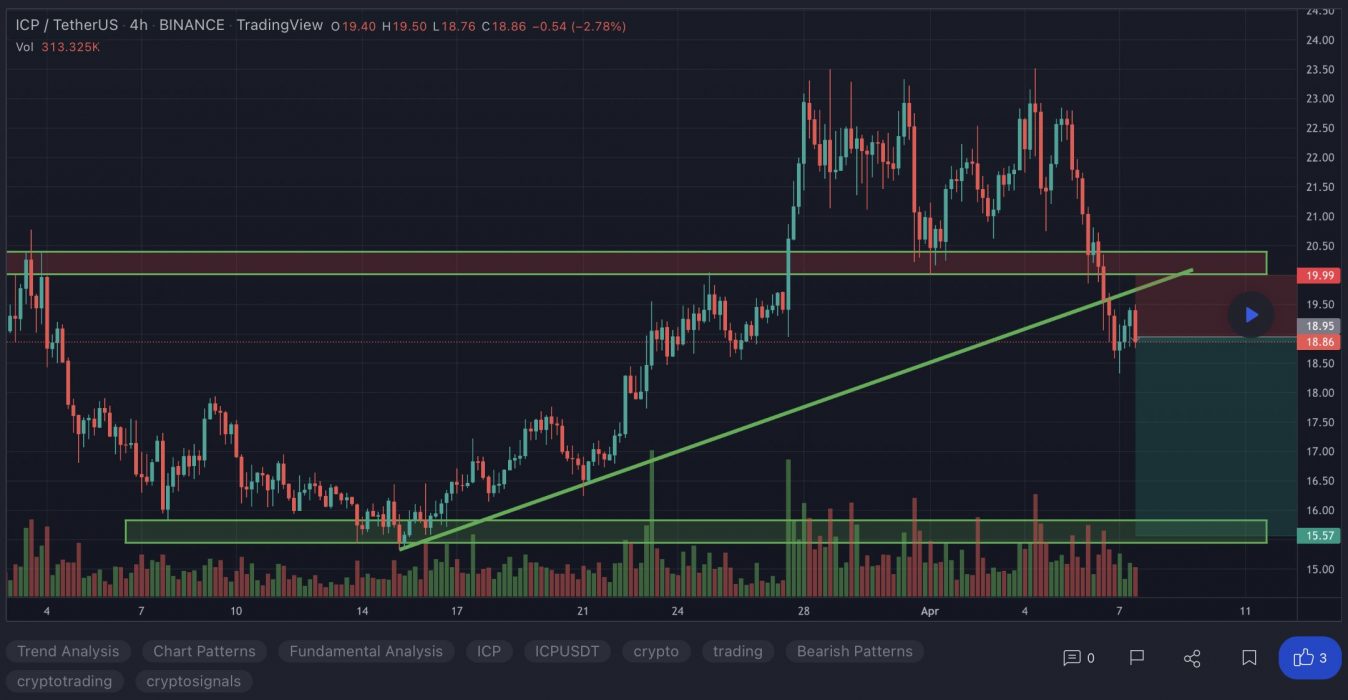
During March, ICP also turned the corner, breaking a key swing high. This move could suggest a longer-term bullish trend.

The swing high near $26.24 stands out as a bullish target and marks an area of probable resistance. Further continuation could reach into possible resistance starting near $30.12.

Even if the bearish trend continues, a stop run at the recent swing low near $17.15 into possible support beginning near $16.50 is reasonable. If the price reaches further down, the swing low and possible support near $15.70 might provide another downside target. 

The area near $14.55 could also provide support. However, a drop this far could suggest a stop run below the higher-timeframe relatively equal lows near $13.79 into possible support beginning around $12.90.

3. Gala (GALA)

GALA aims to take the gaming industry in a different direction by giving players back control over their games. Gala Games’ mission is to make “blockchain games you’ll actually want to play”. The project wants to change the fact that players can spend hundreds of dollars on in-game assets and countless hours playing the game, all of which could be taken away from them with the click of a button. It plans to reintroduce creative thinking into games by giving players control of the games and in-game assets with the help of blockchain technology.

GALA Price Analysis

At the time of writing, GALA is ranked the 67th cryptocurrency globally and the current price is US$0.2259. Let’s take a look at the chart below for price analysis:

Source: TradingView

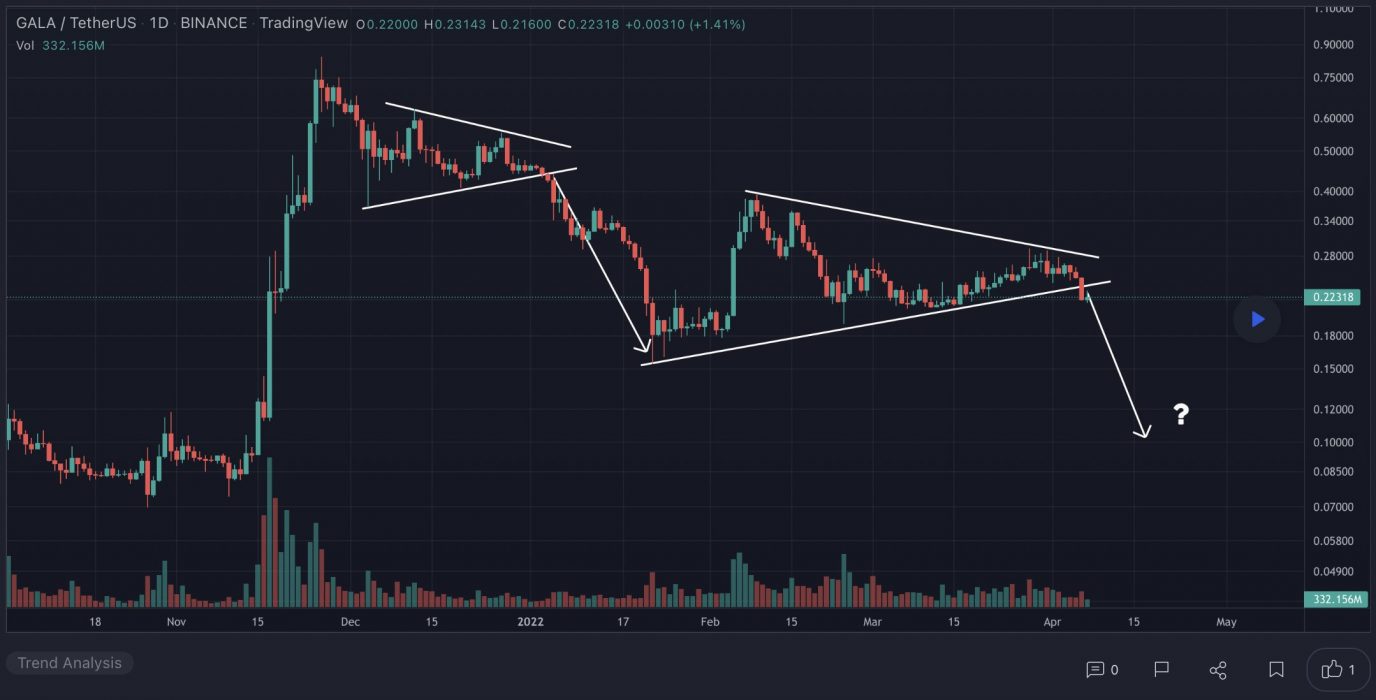
After setting a low last week, GALA kicked off a recovery trend to break the new monthly highs.

The following 55% plummet found support near $0.2076, sweeping under the 40 EMA into the 59.8% retracement level before bouncing to resistance beginning at $0.2430.

This area could continue to provide resistance, possibly causing a retracement to the 9 EMA and 18 EMA near $0.2712, where aggressive bulls might begin bidding. The level near $0.2950, which has confluence with the 40 EMA, may see more interest from bulls loading up for an attempt on probable resistance beginning near $0.3285. 

However, if Bitcoin continues its sideways trend, much lower prices could be seen. The old support near $0.1980 could provide at least a short-term bounce. If this level fails, the old highs near $0.1754 might also give support and see the start of a new bullish cycle after retesting these support levels.

Learn How to Trade Live!

Join Dave and The Crypto Den Crew and they’ll show you live on a webinar how to take your crypto trading to the next level.

Where to Buy or Trade Altcoins?

These coins have high liquidity on Binance Exchange, so that could help with trading on AUD/USDT/BTC pairs. And if you’re looking at buying and HODLing cryptos, then Swyftx Exchange is an easy-to-use popular choice in Australia.