Categories
Crypto News Fantom Market Analysis Smooth Love Potion Terra Trading

Top 3 Coins to Watch Today: FTM, LUNA, SLP – February 24 Trading Analysis

Let’s take a closer look at today’s altcoins showing breakout signals. We’ll explain what the coin is, then dive into the trading charts and provide some analysis to help you decide.

1. Fantom (FTM)

Fantom FTM is a directed acyclic graph (DAG) smart contract platform providing decentralised finance (DeFi) services to developers using its own bespoke consensus algorithm. Together with its in-house token FTM, Fantom aims to solve problems associated with smart-contract platforms – specifically transaction speed, which developers say they have reduced to under two seconds.

FTM Price Analysis

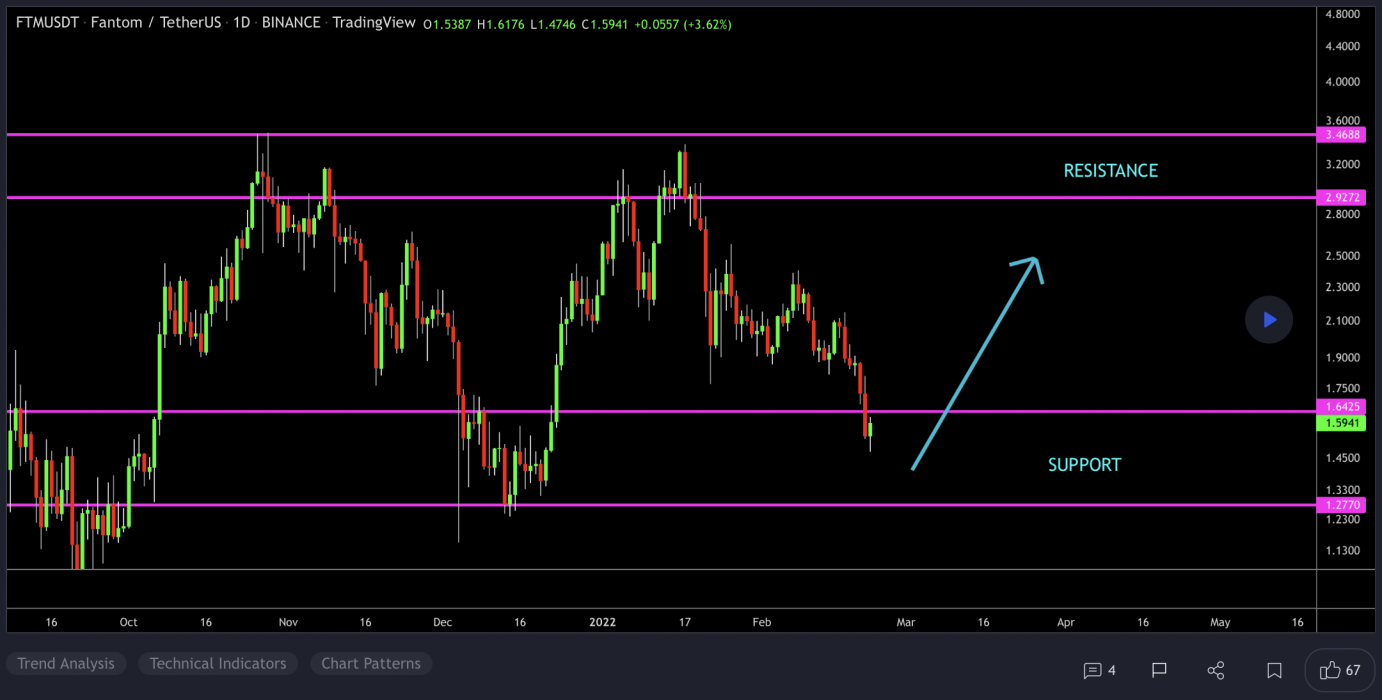
At the time of writing, FTM is ranked the 34th cryptocurrency globally and the current price is US$1.69. Let’s take a look at the chart below for price analysis:
Source: TradingView

FTM‘s bounce since mid-December ran into resistance near the old all-time highs. This rejection created a set of relatively equal highs near $3.29, possibly forming the next bullish leg’s target. Until then, the price will likely encounter resistance near $2.10.

Currently, the price is testing possible support near the weekly open, around $1.60. This level also has confluence with the 78.6% retracement of the current local range and the 18 and 40 EMAs. 

If this level fails to provide support, a zone from $1.49 to $1.40 might mark a possible swing low or consolidation area. This zone is between the 61.8% and 75.6% retracement of December’s swing.

A more bearish tone in the market could propel the price lower. The December lows, near $1.37, might mark an area of possible support as well as a bearish target.

2. Terra (LUNA)

Terra LUNA is a blockchain protocol that uses fiat-pegged stablecoins to power price-stable global payments systems. According to its whitepaper, Terra combines the price stability and wide adoption of fiat currencies with the censorship-resistance of Bitcoin, and offers fast and affordable settlements. Terra’s native token, LUNA, is used to stabilise the price of the protocol’s stablecoins. LUNA holders are also able to submit and vote on governance proposals, giving it the functionality of a governance token.

LUNA Price Analysis

At the time of writing, LUNA is ranked the 9th cryptocurrency globally and the current price is US$60.44. Let’s take a look at the chart below for price analysis:

Source: TradingView

After breaking its monthly lows last week, LUNA began a range that has been whiplashing both bulls and bears.

Resistance beginning near $62.23 held the price down for the weekly opening, although bulls have shown some strength near the 9 and 18 EMAs. 

A quick drop to $53.37, or into the zone beginning near $49.87, could give bulls the fuel to push through the nearby resistance. If this resistance breaks, the high near $69.47 provides a reasonable target. 

A break of this level could move further into uncharted territory with the nearest probable resistances projected around $74.28 and $80.57.

More patient bulls might be waiting far below the 40 EMA with bids close to the higher-timeframe range’s 61.8% retracement, near $46.59.

3. Smooth Love Potion (SLP)

Smooth Love Potion SLP tokens are earned by playing the Axie Infinity game. This digital asset serves as a replacement for experience points. SLP are ERC-20 tokens, and they can be used to breed new digital pets known as Axies. The cost of breeding begins at 100 SLP but increases gradually, rising to 200 SLP for the second breed, 300 for the third, 500 for the fourth, 800 for the fifth, and 1,300 for the sixth. Axies can be bred a maximum of seven times, and the seventh breed costs 2,100 SLP. This limit exists in order to prevent hyperinflation in the marketplace.

SLP Price Analysis

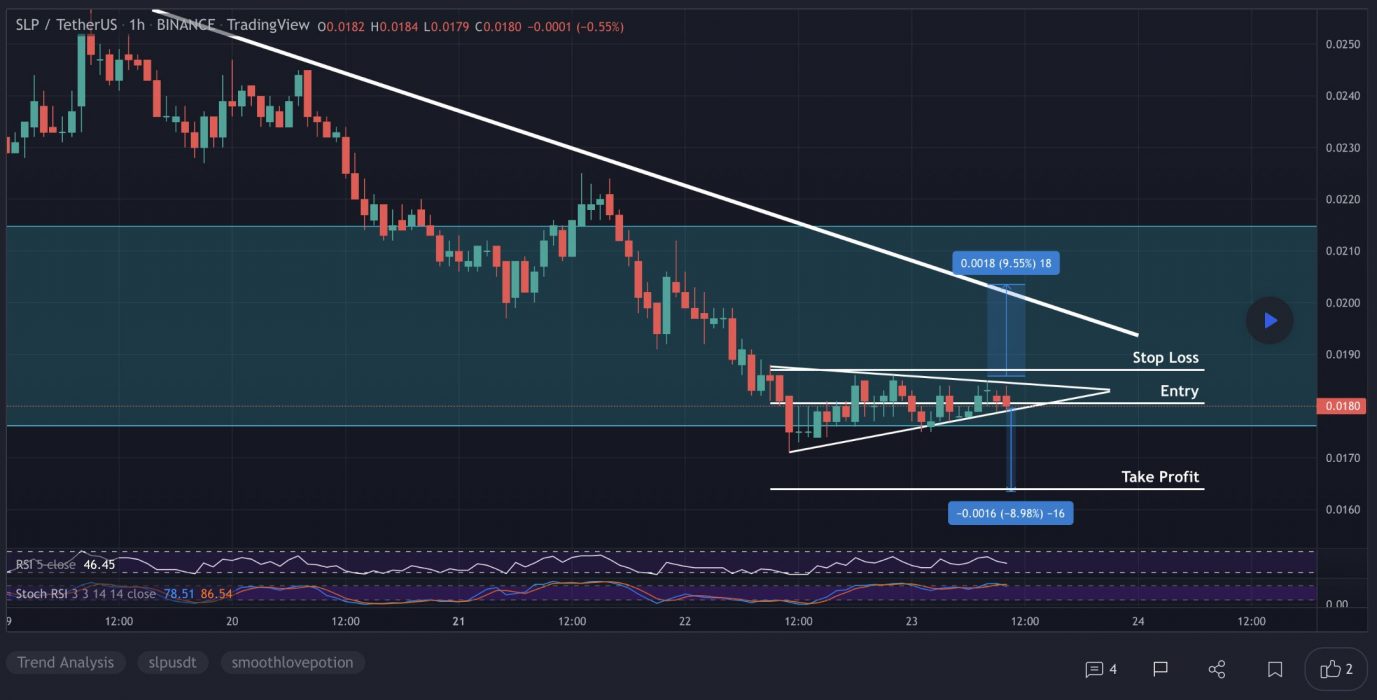
At the time of writing, SLP is ranked the 346th cryptocurrency globally and the current price is US$0.02164. Let’s take a look at the chart below for price analysis:
Source: TradingView

SLP‘s 135% rally during February ran into 30% retracement near $0.01815. Since then, the price has been consolidating in a 40% range between $0.02024 and $0.02445.

Just below the late-December low, $0.01797 is the first level likely to provide substantial support. If the price breaks down through this level, overlapping levels near $0.01678 might cap a run on the lows near $0.01524 and $0.01435.

The higher-timeframe analysis points to the area near $0.02751 as the next substantial resistance. Significant selling has been occurring here on the daily chart. If this level breaks, the swing highs near $0.03147 and $0.03340 may be the next targets.

Learn How to Trade Live!

Join Dave and The Crypto Den Crew and they’ll show you live on a webinar how to take your crypto trading to the next level.

Where to Buy or Trade Altcoins?

These coins have high liquidity on Binance Exchange, so that could help with trading on AUD/USDT/BTC pairs. And if you’re looking at buying and HODLing cryptos, then Swyftx Exchange is an easy-to-use popular choice in Australia.

Categories
Cardano Crypto News Market Analysis Polkadot The Sandbox Trading

Top 3 Coins to Watch Today: ADA, DOT, SAND – February 23 Trading Analysis

Let’s take a closer look at today’s altcoins showing breakout signals. We’ll explain what the coin is, then dive into the trading charts and provide some analysis to help you decide.

1. Cardano (ADA)

Cardano ADA is a proof-of-stake blockchain platform whose stated goal is to allow “changemakers, innovators, and visionaries” to bring about positive global change. The open-source project also aims to “redistribute power from unaccountable structures to the margins to individuals”, helping to create a society that is more secure, transparent, and fair. Cardano is used by agricultural companies to track fresh produce from field to fork, while other products built on the platform allow educational credentials to be stored in a tamper-proof way, and retailers to clamp down on counterfeit goods.

ADA Price Analysis

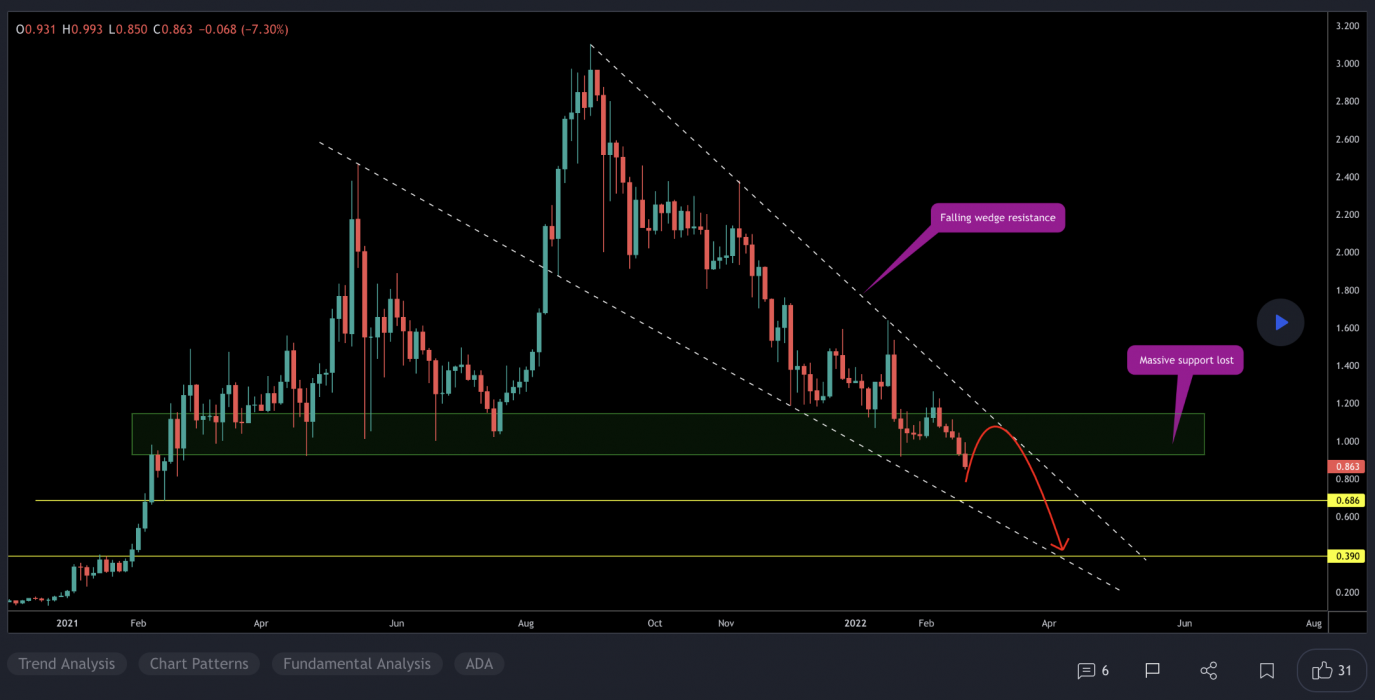
At the time of writing, ADA is ranked the 7th cryptocurrency globally and the current price is US$0.8693. Let’s take a look at the chart below for price analysis:

Source: TradingView

ADA‘s nearly 60% drop from its mid-January highs found a low near $0.8435 last week before closing over a short-term high.

This daily close over the high could signal a shift in market structure that may reach probable resistance near $0.9125. A sustained bullish move may target the swing high at $0.9535. If this stop run occurs, a run beyond the high into probable resistance near $1.12 and $1.21 is possible.

Bulls could buy a retracement to possible support near $0.8640, just above the weekly open. A bearish turn in the marketplace may propel the price toward possible support near $0.8325. 

However, relatively equal lows near $0.8057 and $0.7822 provide an attractive target for bears if the market resumes its bearish trend. A run on these lows might find support between $0.7647 and $0.7592.

2. Polkadot (DOT)

Polkadot DOT is an open-source sharding multichain protocol that facilitates the cross-chain transfer of any data or asset types, not just tokens, thereby making a wide range of blockchains interoperable with each other. Polkadot’s native DOT token serves three clear purposes: providing network governance and operations, and creating parachains by bonding. The Polkadot protocol connects public and private chains, permissionless networks, oracles and future technologies, allowing these independent blockchains to trustlessly share information and transactions through the Polkadot relay chain.

DOT Price Analysis

At the time of writing, DOT is ranked the 13th cryptocurrency globally and the current price is US$16.26. Let’s take a look at the chart below for price analysis:

Source: TradingView

DOT has retraced nearly 75% since its high in early January, showing little sign of interest from buyers.

February’s consolidation at possible support from $19.68 to $20.57 broke down with the rest of the market last week, turning this into likely resistance on future retests. This area now has confluence with the 9 and 18 EMAs.

If market conditions turn and this resistance breaks, an area near the midpoint of December’s consolidation range and the 2021 open, near $26.70, and the high of December’s consolidation range, near $29.88, might see profit-taking from bulls.

The first test of possible support near $15.40 showed some sensitivity. Still, continued bearishness in the market will likely cause a break of this level.

A break of this support might continue to drop to the next possible support near $14.56, running stops under July’s swing low. 

If this level gives support and begins a consolidation forming a bottom, bulls might wait for a wick below to possible support from $13.16 to $11.47 at the high of 2020’s consolidation range.

3. The Sandbox (SAND)

The Sandbox SAND is a blockchain-based virtual world allowing users to create, build, buy and sell digital assets in the form of a game. By combining the powers of decentralised autonomous organisations (DAOs) and non-fungible tokens (NFTs), the Sandbox creates a decentralised platform for a thriving gaming community. The Sandbox employs the powers of blockchain technology by introducing the SAND utility token, which facilitates transactions on the platform.

SAND Price Analysis

At the time of writing, SAND is ranked the 37th cryptocurrency globally and the current price is US$3.12. Let’s take a look at the chart below for price analysis:

Source: TradingView

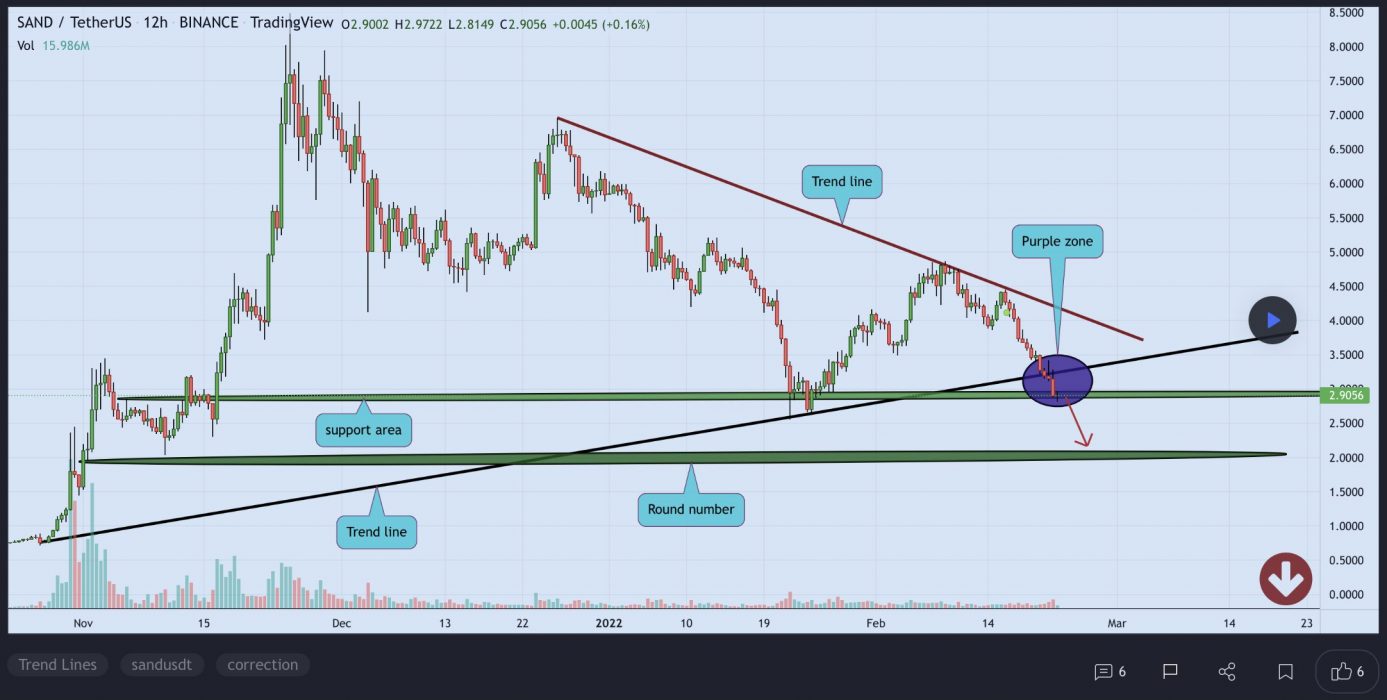
SAND‘s impressive rally during Q4 halted at $8.45 before retracing 80% of the move. This price action created several areas of possible higher-timeframe resistance in the process.

The price found resistance on its last swing upward near $3.67 – an area that could provide resistance again. If this swing high breaks, the price might find resistance near $3.90. If this area does provide resistance, it would suggest the formation of a higher-timeframe consolidation.

The fast move up left little higher-timeframe support. However, a vast zone between $3.12 and $3.00 has provided support before and could give support again on a retest. This zone is between the 61.8%-to-78.6% retracement levels of Q4’s parabolic move.

Inside this zone, the consolidation high near $2.89 to $2.80 might see more sensitivity and mark the bearish target.

Continuation downward through this level, especially if the overall market remains bearish, could retrace most of Q4’s move to the next higher-timeframe support near $2.60.

Learn How to Trade Live!

Join Dave and The Crypto Den Crew and they’ll show you live on a webinar how to take your crypto trading to the next level.

Where to Buy or Trade Altcoins?

These coins have high liquidity on Binance Exchange, so that could help with trading on AUD/USDT/BTC pairs. And if you’re looking at buying and HODLing cryptos, then Swyftx Exchange is an easy-to-use popular choice in Australia.

Categories
BitTorrent Crypto News IOST Market Analysis Swipe Trading

Top 3 Coins to Watch Today: BTT, IOST, SXP – February 22 Trading Analysis

Let’s take a closer look at today’s altcoins showing breakout signals. We’ll explain what the coin is, then dive into the trading charts and provide some analysis to help you decide.

1. BitTorrent (BTT)

BitTorrent BTT is a popular peer-to-peer (P2P) file-sharing and torrent platform which has become increasingly decentralised in recent years. Since its acquisition, BitTorrent has added various new tools, with a dedicated native cryptocurrency token, BTT, released in February 2019. BTT was launched on TRON’s own blockchain, using its TRC-10 standard. According to its official literature, BitTorrent is currently the world’s “largest decentralised P2P communications protocol”.

BTT Price Analysis

At the time of writing, BTT is ranked the 50th cryptocurrency globally and the current price is US$0.00000201. Let’s take a look at the chart below for price analysis:

Source: TradingView

BTT has been in a higher-timeframe downtrend since its 4,790% pump during Q1 2021. From late June 2021, the price has ranged between approximately $0.000004598 and $0.000002677.

Old swing lows near the current price recently broke. This approximate area, near the higher-timeframe range low, could offer support again on higher-timeframes. 

However, the current macro market conditions suggest further downside. Multiple retests of a level – in this case, the fourth retest – and traders “selling the news” of February 22’s Mainnet launch increase the probability of this region turning to resistance. 

The daily chart suggests that a zone around the February open, from $0.0000020300 to $0.0000021078, may offer resistance – although the price might reach as high as $0.0000021799.

A break of this resistance could run short stops into higher-timeframe resistance around $0.000002557 – near the 2022 yearly open. If the price does reach this far, volatile price action in this area hints at resistance between $0.000002557 and $0.000003382. 

Short-term rallies may occur, but the price is more likely to find a long-term bottom in an inefficient area above 2020’s accumulation range. This area reaches from $0.000001042 to $0.0000005337, with $0.0000009500 starting higher-probability support.

2. Iost (IOST)

IOST‘s blockchain infrastructure is open-source and designed to be secure and scalable, all in the hope that it will serve as the backbone for online services in the future. One of the biggest challenges that IOST aims to resolve centres on how big companies may not be able to embrace blockchains in a customer-facing environment unless they are scalable. The Internet of Services Token is put forward as a way of tackling this problem.

IOST Price Analysis

At the time of writing, IOST is ranked the 134th cryptocurrency globally and the current price is US$0.02334. Let’s take a look at the chart below for price analysis:

Source: TradingView

IOST rallied 436% during Q3 2021 and almost set new all-time highs before selling off 78% into its January 2022 low.

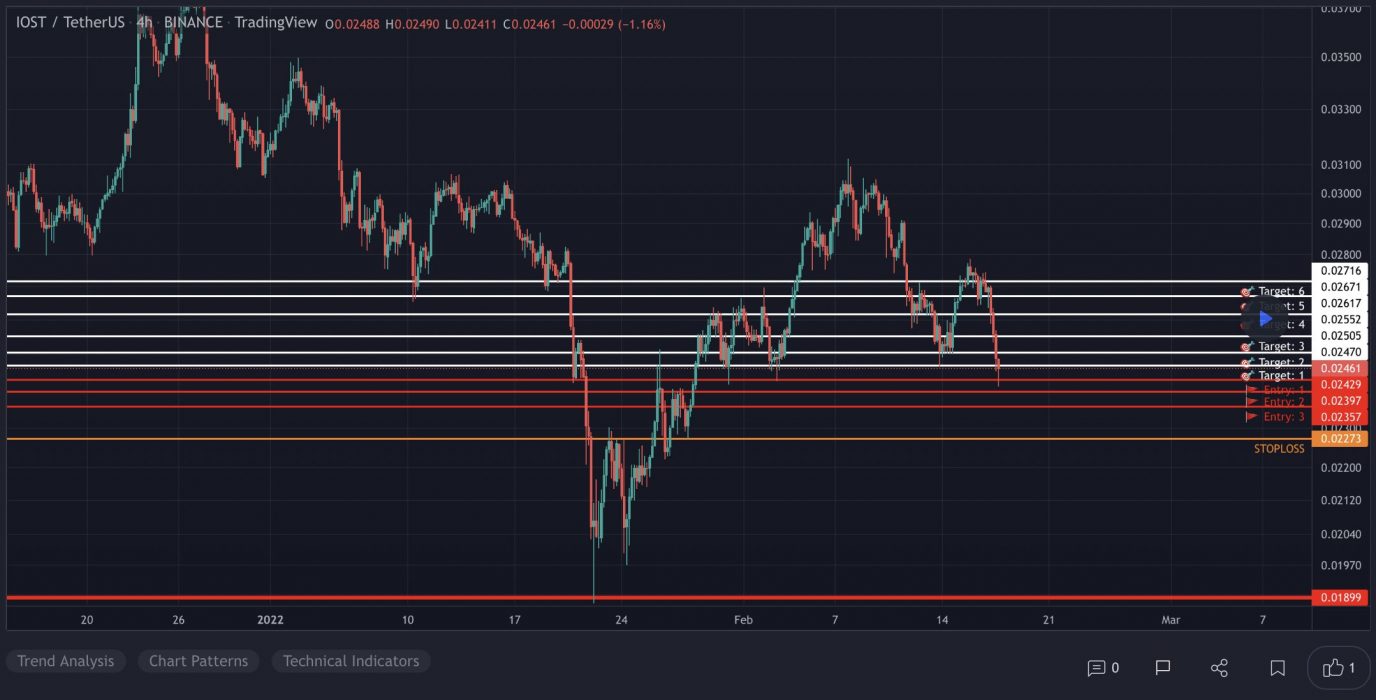
A retest of the 2022 yearly open, near $0.03125, started a new wave of selling in early February. The subsequent break of the February monthly open created a new area of resistance between $0.02459 and $0.02643 – an area that is also inefficiently traded and has confluence with the 9 and 18 EMAs.

If this resistance breaks, a move toward the 2021 yearly open might find resistance between $0.02874 and $0.03200. Any potential move through this resistance will likely find a ceiling near an inefficient higher-timeframe level at $0.03499.

Old support near $0.01889 created a sharp bullish reaction in late January. This region, down to $0.01774, could provide support again. 

However, a longer-term bottom is more likely to be found between $0.01427 and $0.00696, perhaps after Q1’s releases finalise, where higher-timeframe charts show an inefficiently traded area.

3. Swipe (SXP)

Swipe SXP is a platform that looks to form a bridge between the fiat and cryptocurrency worlds with its API that is designed to create global payment cards powered by its native SXP token. Swipe also has an on-chain product called Swipe Swap, an Automated Market Maker which is forked by Uniswap, SushiSwap and THORchain, and is powered by Swipechain. This ecosystem is powered by the Swipe Token SXP, which functions as the fuel for the Swipe Network, and is used for paying transaction fees and securing Swipechain through bonding and governance.

SXP Price Analysis

At the time of writing, SXP is ranked the 178th cryptocurrency globally and the current price is US$1.28. Let’s take a look at the chart below for price analysis:

Source: TradingView

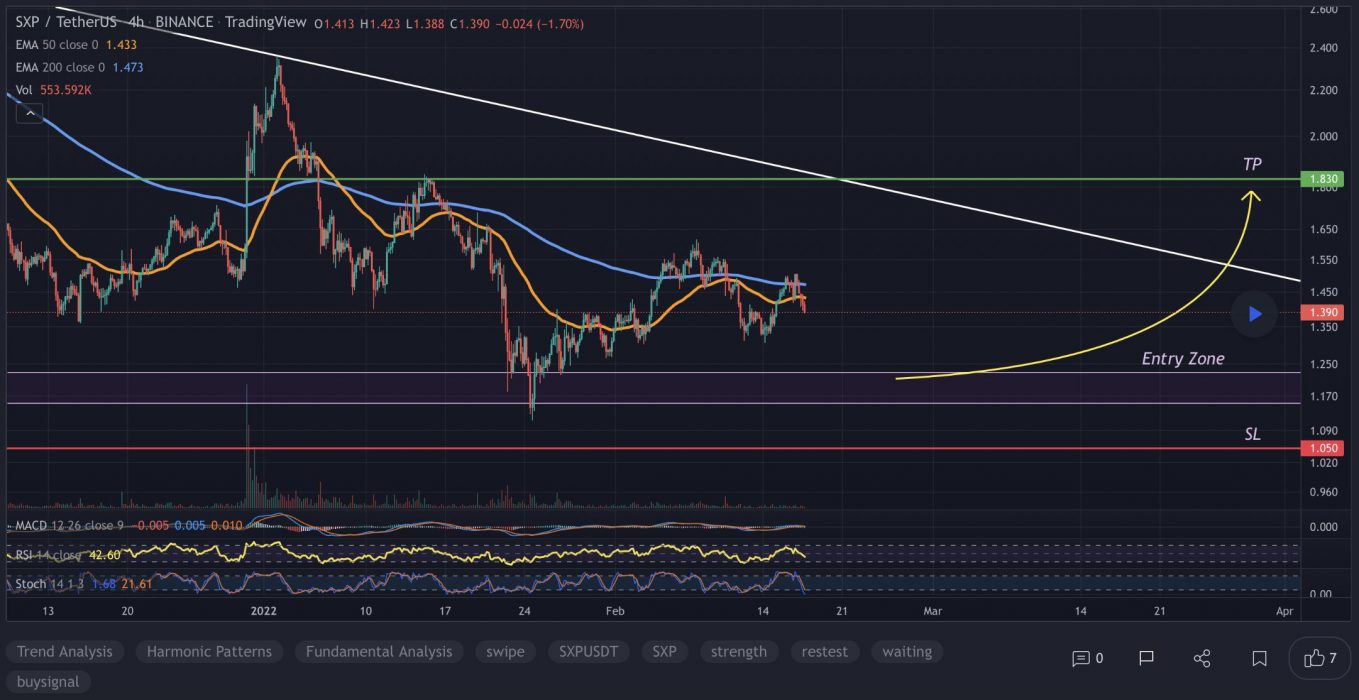
SXP retraced 81% from its May 2021 all-time high and is entering an area of possible higher-timeframe support.

Multiple resistance areas on the daily chart converge between $1.303 and $1.418, with the February monthly open and the 9 and 18 EMAs marking the middle of this zone. 

However, an inefficient area on higher timeframes that could offer support starts nearby at $1.244, although $1.203 and below may be a more sensitive area. This proximity of resistance and support might trigger consolidation in the short term.

This higher-timeframe possible support covers a wide area and could fill down to $0.742, where January 2021’s bullrun began. Bears may be taking profits in this area. Meanwhile, bulls might wait for signs of genuine demand (not just mild rallies from short-covering) to begin more significant accumulation.

A break of the current resistance might reach overlapping old consolidation ranges between $1.532 and $1.641. If this potential resistance breaks, the 2022 yearly open near $2.025 might mark the next possible resistance level. A move to this level could signify the start of a more extensive accumulation range or trend reversal.

Learn How to Trade Live!

Join Dave and The Crypto Den Crew and they’ll show you live on a webinar how to take your crypto trading to the next level.

Where to Buy or Trade Altcoins?

These coins have high liquidity on Binance Exchange, so that could help with trading on AUD/USDT/BTC pairs. And if you’re looking at buying and HODLing cryptos, then Swyftx Exchange is an easy-to-use popular choice in Australia.
Categories
1inch Network Cosmos Crypto News Gala Market Analysis Trading

Top 3 Coins to Watch Today: GALA, ATOM, 1INCH – February 21 Trading Analysis

Let’s take a closer look at today’s altcoins showing breakout signals. We’ll explain what the coin is, then dive into the trading charts and provide some analysis to help you decide.

1. Gala (GALA)

GALA aims to take the gaming industry in a different direction by giving players back control over their games. Gala Games’ mission is to make “blockchain games you’ll actually want to play”. The project wants to change the fact that players can spend hundreds of dollars on in-game assets, and countless hours playing the game, all of which could be taken away from them with the click of a button. It plans to reintroduce creative thinking into games by giving players control of the games and in-game assets with the help of blockchain technology.

GALA Price Analysis

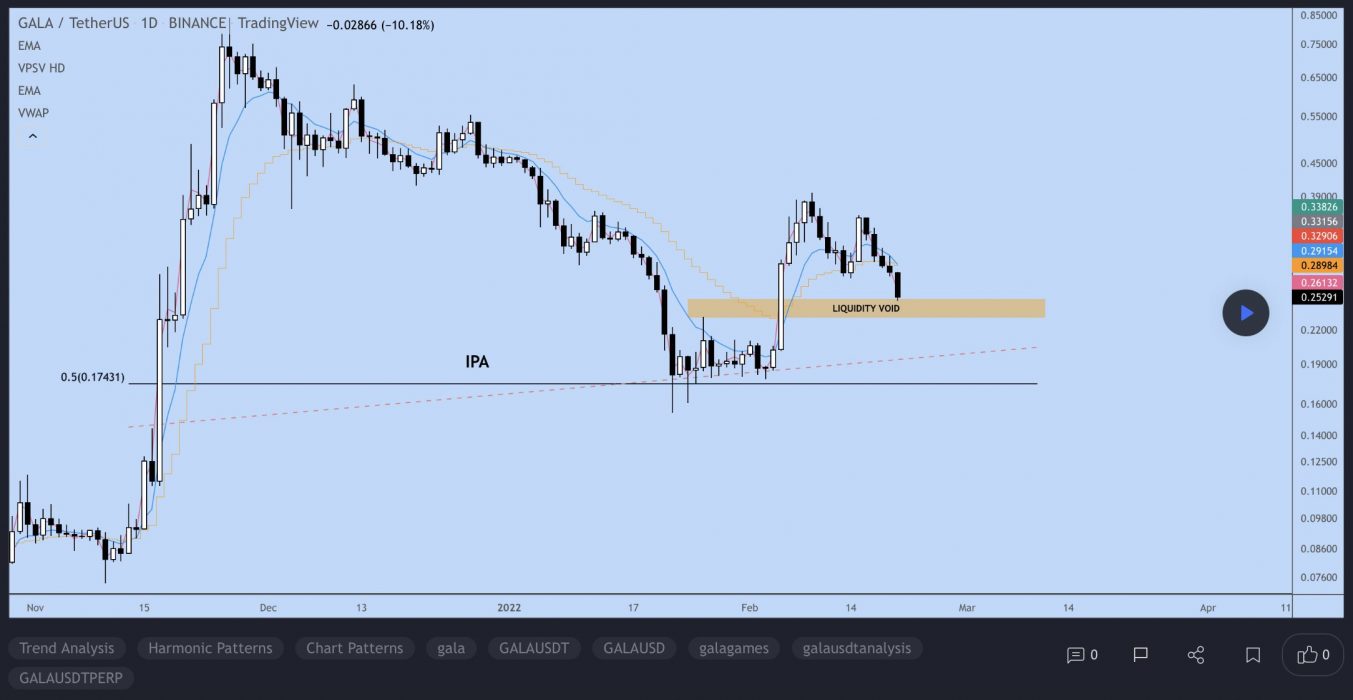
At the time of writing, GALA is ranked the 55th cryptocurrency globally and the current price is US$0.253. Let’s take a look at the chart below for price analysis:

Source: TradingView

After setting a low last month, GALA kicked off a bullish trend that rallied by 95% by early February to break the new monthly highs.

The following 45% plummet found support near $0.2476, sweeping under the 40 EMA into the 51.8% retracement level before bouncing to resistance beginning at $0.2630.

This area could continue to provide resistance, possibly causing a retracement to the 9 EMA and 18 EMA near $0.2812, where aggressive bulls might begin bidding. The level near $0.3040, which has confluence with the 40 EMA, may see more interest from bulls loading up for an attempt on probable resistance beginning near $0.3485. 

However, if Bitcoin continues its sideways trend, much lower prices could be seen. The old support near $0.2291 could provide at least a short-term bounce. If this level fails, the old highs near $0.2050 might also give support and see the start of a new bullish cycle after retesting these support levels.

2. Cosmos (ATOM)

Cosmos ATOM bills itself as a project that solves some of the “hardest problems” facing the blockchain industry. It aims to offer an antidote to “slow, expensive, unscalable and environmentally harmful” proof-of-work protocols, like those used by Bitcoin, by offering an ecosystem of connected blockchains. ATOM tokens are earned through a hybrid proof-of-stake algorithm and they help to keep the Cosmos Hub, the project’s flagship blockchain, secure. This cryptocurrency also has a role in the network’s governance.

ATOM Price Analysis

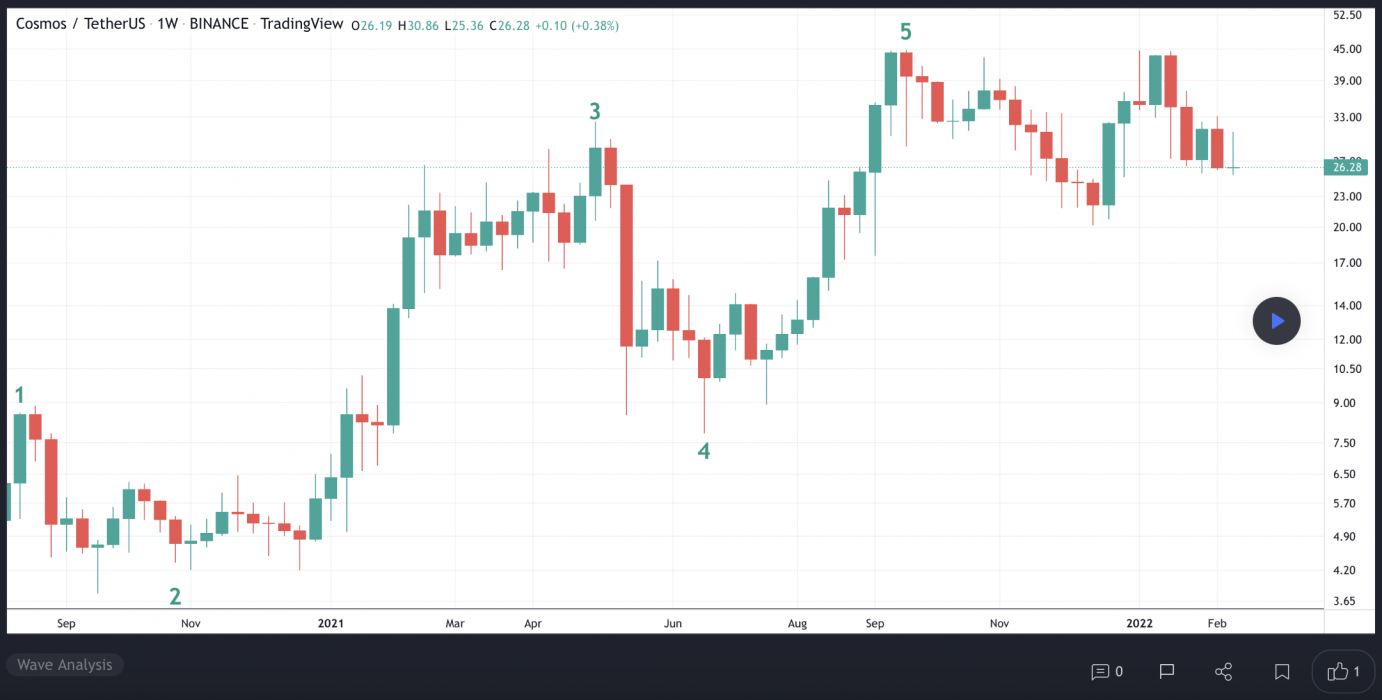
At the time of writing, ATOM is ranked the 20th cryptocurrency globally and the current price is US$26.12. Let’s take a look at the chart below for price analysis:

Source: TradingView

January provided respectable 55% gains for bulls who bought ATOM at the monthly open, with the price finding resistance near $41.52.

If bears take back control this month, the top of the former gap beginning at $24.66 may provide support for at least a short-term bounce. The top of the consolidation range starting near $23.58 is more likely to provide substantial support.

The most robust support is likely to be found in the overlapping consolidation ranges between $22.74 and $20.16, with a sharp slice through these levels possibly suggesting the end of the bull run.

The region from approximately $33.70 to the most recent swing high is likely to provide some resistance. The swing high provides a reasonable first target for a possible next leg up. 

If this high breaks, the 1.0 extension near $36.21 and the 2.0 extension near $42.90 may provide the next primary new high targets.

3. 1inch (1INCH)

1INCH is a decentralised exchange (DEX) aggregator, connecting several DEXes into one platform to allow its users to find the most efficient swapping routes across all platforms. In order for users to find the best price for a swap, they need to look at every exchange – DEX aggregators eliminate the need for manually checking, bringing efficiency to swapping on DEXes. 1inch has launched its 1INCH governance token, and the 1inch Network began to be governed by a decentralised autonomous organisation (DAO).

1INCH Price Analysis

At the time of writing, 1INCH is ranked the 99th cryptocurrency globally and the current price is US$1.49. Let’s take a look at the chart below for price analysis:

Source: TradingView

After breaking its Q4 highs, 1INCH began a range that has been whiplashing both bulls and bears.

Resistance beginning near $2.00 has held the price down for the second half of February, although bulls have shown some strength near the 9 and 18 EMAs. 

A quick push to $1.88, or into the zone beginning near $2.10, could give bulls the fuel to push through the nearby resistance. If this resistance breaks, the high near $2.17 provides a reasonable target. 

A break of this level could move further into uncharted territory with the nearest probable resistances projected around $2.28 and $2.40.

More patient bulls might be waiting far below the 40 EMA with bids near the higher-timeframe range’s 35% retracement, near $1.30.

Learn How to Trade Live!

Join Dave and The Crypto Den Crew and they’ll show you live on a webinar how to take your crypto trading to the next level.

Where to Buy or Trade Altcoins?

These coins have high liquidity on Binance Exchange, so that could help with trading on AUD/USDT/BTC pairs. And if you’re looking at buying and HODLing cryptos, then Swyftx Exchange is an easy-to-use popular choice in Australia.

Categories
Crypto News Market Analysis NEO Trading VeChain Zilliqa

Top 3 Coins to Watch Today: NEO, VET, ZIL – February 18 Trading Analysis

Let’s take a closer look at today’s altcoins showing breakout signals. We’ll explain what the coin is, then dive into the trading charts and provide some analysis to help you decide.

1. Neo (NEO)

NEO bills itself as a “rapidly growing and developing” ecosystem with the goal of becoming the foundation for the next generation of the internet – a new economy where digitised payments, identities and assets come together. As well as creating a worldwide community of developers who create new infrastructure for the network and lower barriers to entry, the team behind this project operates an EcoBoost initiative that’s designed to encourage people to build decentralised apps and smart contracts on its blockchain.

NEO Price Analysis

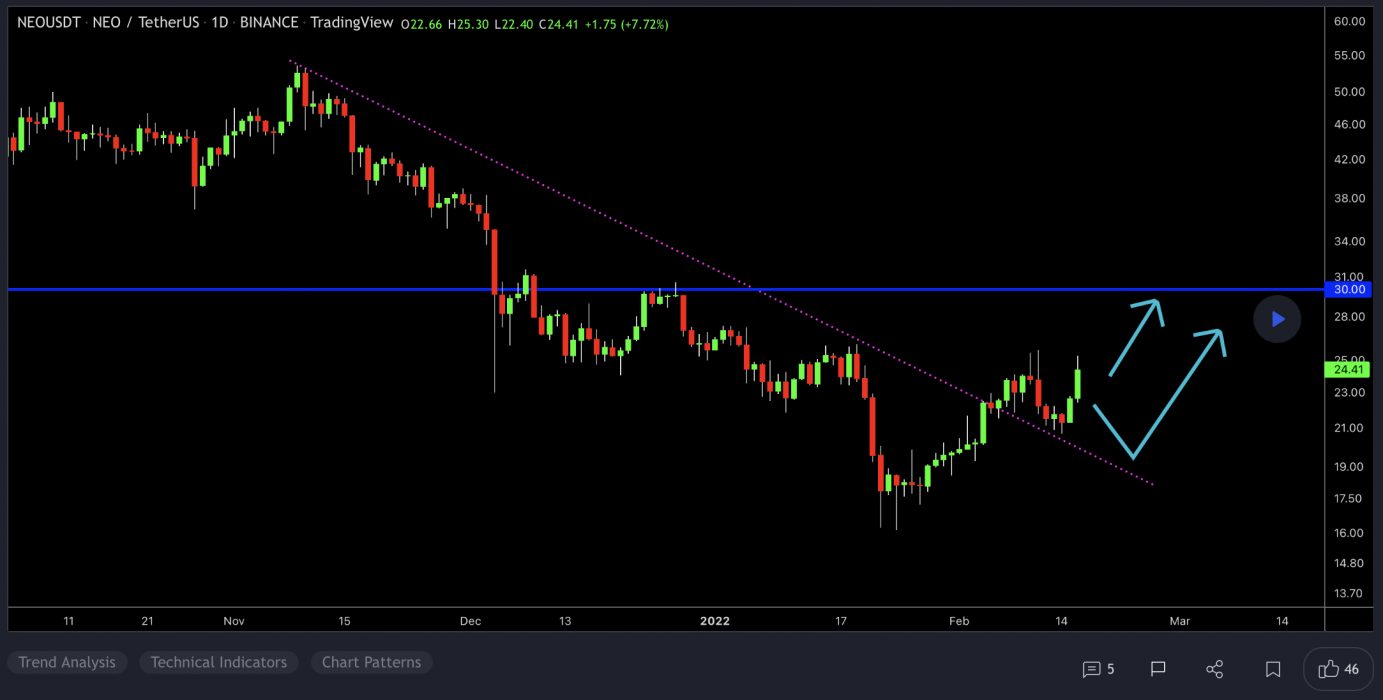
At the time of writing, NEO is ranked the 59th cryptocurrency globally and the current price is US$24.52. Let’s take a look at the chart below for price analysis:

Source: TradingView

After creating a second equal low during late January, NEO has gained nearly 15% into resistance that starts near $30.12.

Aggressive bulls looking for a continuation to the nearest cluster of relatively equal highs around $32.33 might look for bids near $21.86. More significant resistance rests above, near $26.15. A group of significant swing highs at $28.36 and $30.23 give possible targets if this resistance breaks.

A stop run on the recent low at $20.11 into possible support beginning near $19.23 might see stronger bidding. This area also has a confluence with the previous monthly low.

A bearish market shift could reach the swing low at $18.30 into possible support beginning near $16.84.

2. VeChain (VET)

VeChain VET is a blockchain-powered supply chain platform. VeChain aims to use distributed governance and Internet of Things (IoT) technology to create an ecosystem that solves some of the major problems with supply chain management. The platform uses two in-house tokens, VET and VTHO, to manage and create value based on its VeChainThor public blockchain. The idea is to boost the efficiency, traceability, and transparency of supply chains while reducing costs and placing more control in the hands of individual users.

VET Price Analysis

At the time of writing, VET is ranked the 39th cryptocurrency globally and the current price is US$0.05724. Let’s take a look at the chart below for price analysis:

Source: TradingView

VET‘s 70% move during late October ran into resistance near $0.1730, at the 27% extension of the Q3 swing.

An old high and the 18 EMA have provided support near $0.05933 and might give support again on a retest. This area also has confluence with the 50% and 61.8% retracements of November’s swing.

Just below, near $0.05393, the 61.8% retracement of the current Q4 swing might also mark an area of support. 

If the market remains bearish, $0.04962 is unlikely to be revisited but could see interest from bulls during any deeper retracement.

An area near $0.07018, at the 50% extension of the summer’s swing, could see some profit-taking if bulls break the current resistance near $0.06278. Above, old consolidations near $0.06425 and $0.06682 might also provide some resistance before another round of price discovery.

3. Zilliqa (ZIL)

Zilliqa ZIL is a public, permissionless blockchain designed to offer high throughput with the ability to complete thousands of transactions per second. It seeks to solve the issue of blockchain scalability and speed by employing sharding as a second-layer scaling solution. The platform is home to many decentralised applications, and as of October 2020 it also allows for staking and yield farming. The native utility token of Zilliqa, ZIL, is used to process transactions on the network and execute smart contracts.

ZIL Price Analysis

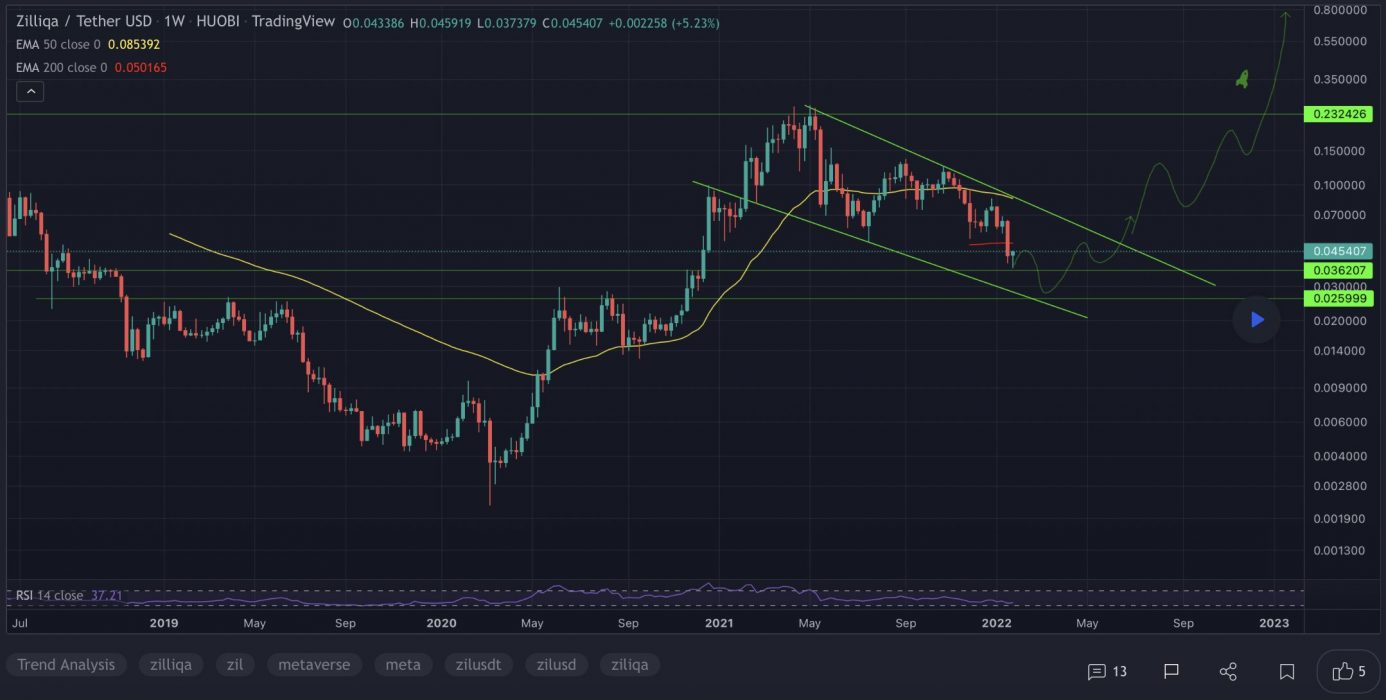
At the time of writing, ZIL is ranked the 110th cryptocurrency globally and the current price is US$0.0486. Let’s take a look at the chart below for price analysis:

Source: TradingView

ZIL‘s nearly 75% drop from its December highs found a low near $0.04538 in January before closing over a short-term high around $0.05372.

This daily close over the high could signal a shift in market structure that might reach probable resistance near $0.05233. A sustained bullish move may target the swing high at $0.05647. If this stop run occurs, a run beyond the high into probable resistance near $0.06188 and $0.06450 is possible.

Bulls could buy a retracement to possible support near $0.04589, just above the monthly open. A bearish turn in the marketplace may propel the price toward possible support near $0.04436. 

However, relatively equal lows near $0.04294 and $0.04124 provide an attractive target for bears if the market resumes its bearish trend. A run on these lows might find support between $0.04015 and $0.03966.

Learn How to Trade Live!

Join Dave and The Crypto Den Crew and they’ll show you live on a webinar how to take your crypto trading to the next level.

Where to Buy or Trade Altcoins?

These coins have high liquidity on Binance Exchange, so that could help with trading on AUD/USDT/BTC pairs. And if you’re looking at buying and HODLing cryptos, then Swyftx Exchange is an easy-to-use popular choice in Australia.
Categories
Crypto News Market Analysis Shiba Inu SushiSwap Trading TRON

Top 3 Coins to Watch Today: SHIB, TRX, SUSHI – February 17 Trading Analysis

Let’s take a closer look at today’s altcoins showing breakout signals. We’ll explain what the coin is, then dive into the trading charts and provide some analysis to help you decide.

1. Shiba Inu (SHIB)

Shiba Inu SHIB coin was created anonymously in August 2020 under the pseudonym “Ryoshi”. The meme coin quickly gained speed and value as a community of investors was drawn in by the cute charm of the coin, paired with headlines and tweets from personalities including Elon Musk and Vitalik Buterin.

SHIB Price Analysis

At the time of writing, SHIB is ranked the 14th cryptocurrency globally and the current price is US$0.00003041. Let’s take a look at the chart below for price analysis:

Source: TradingView

SHIB performed well during February, reaching over 55% from the first week of the month into the resistance near $0.00003432.

For the past several days, the price has been moving in a falling wedge and appears to be flipping old support near $0.00002842 to resistance. If this level breaks – perhaps due to the tempting daily equal lows below – the next support begins near $0.00002729.

Bulls entering at these levels could set their first target near the previous resistance near $0.00003380. Beyond this level, probable targets include the new monthly highs near $0.00003524 and the resistance above near $0.00003692.

A break of this resistance later this month could continue to the new highs near $0.00003722 and $0.00003854.

2. Tron (TRX)

Tron TRX is a blockchain-based operating system that aims to ensure this technology is suitable for daily use. Whereas Bitcoin can handle up to six transactions per second, and Ethereum up to 25, TRON claims that its network has a capacity for 2,000 TPS. This project is best described as a decentralised platform focused on content sharing and entertainment and to this end, one of its biggest acquisitions was the file-sharing service BitTorrent in 2018. Overall, TRON has divided its goals into six phases. These include delivering simple distributed file sharing, driving content creation through financial rewards.

TRX Price Analysis

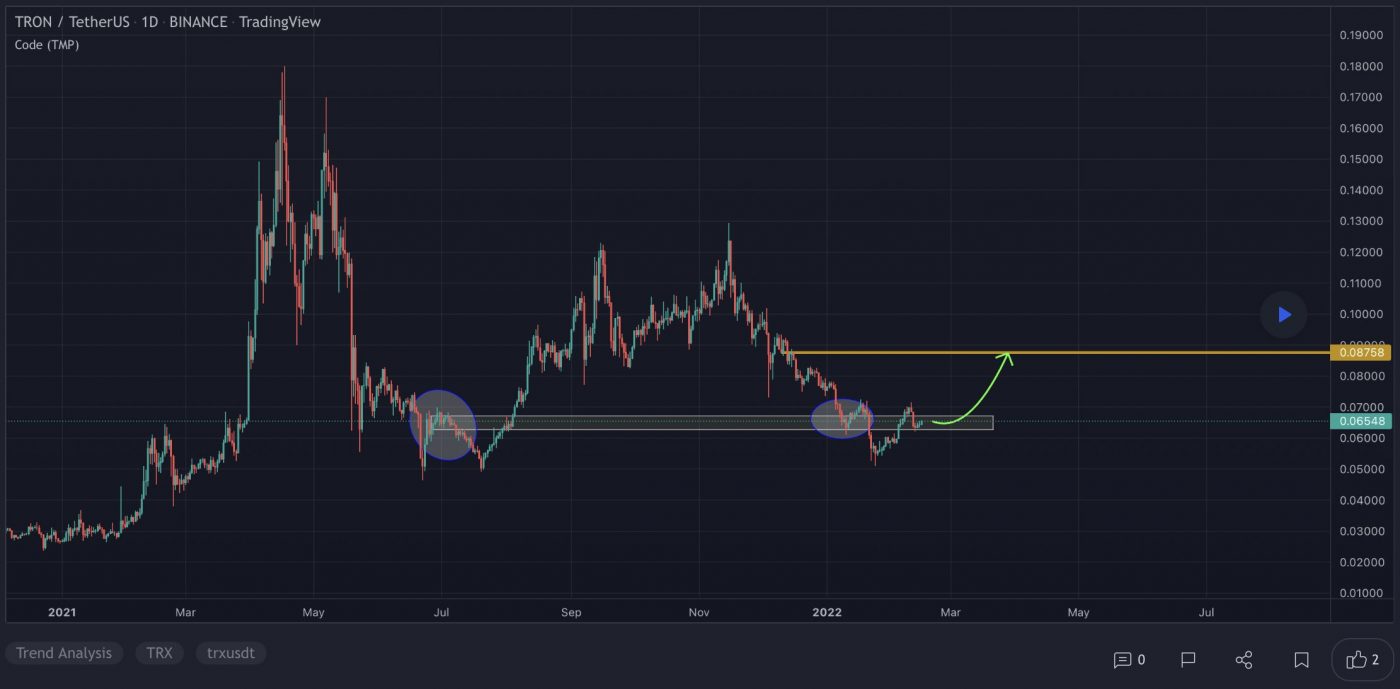
At the time of writing, TRX is ranked the 25th cryptocurrency globally and the current price is US$0.06582. Let’s take a look at the chart below for price analysis:

Source: TradingView

TRX accompanied the rest of the market during the January drop, falling nearly 43% from its mid-December high until it found a low early in February.

Price action formed a weekly support level near $0.05954, which has so far held up the price. The most recent swing low inside this range, near $0.05739, might be the target for any future stop runs. After this low, the swing low near $0.05629 and the gap beginning near $0.05155 mark possible higher-timeframe support.

The price is currently battling with significant higher-timeframe resistance levels, with the closest probable resistance resting near $0.06922, just over the previous monthly open. A sweep of the relatively equal highs above this resistance might find sellers near $0.07335 – but could reach as high as $0.07837.

3. SushiSwap (SUSHI)

SushiSwap SUSHI is an example of an automated market maker (AMM). An increasingly popular tool among cryptocurrency users, AMMs are decentralised exchanges that use smart contracts to create markets for any given pair of tokens. SushiSwap aims to diversify the AMM market and also add features not previously present on Uniswap, such as increased rewards for network participants via its in-house token, SUSHI.

SUSHI Price Analysis

At the time of writing, SUSHI is ranked the 123rd cryptocurrency globally and the current price is US$4.26. Let’s take a look at the chart below for price analysis:

Source: TradingView

After retracing nearly 55% from its December high, SUSHI set a low near $4.10 as it formed its current range.

Last week, the price swept highs near $4.30, which now also marks the previous monthly high. Relatively equal daily highs near $4.39 provide a reasonable target, although resistance beginning near $4.47 could cap the move. A break of this resistance is likely to target the swing high near $4.66 into higher-timeframe resistance beginning near $4.93.

The current area near $4.17 could provide support, although bulls may be more likely to buy near the price fractal near $4.06 if a retracement reaches this level. A break of this area could continue down to sweep the low near $3.89 into possible support beginning near $3.82.

Learn How to Trade Live!

Join Dave and The Crypto Den Crew and they’ll show you live on a webinar how to take your crypto trading to the next level.

Where to Buy or Trade Altcoins?

These coins have high liquidity on Binance Exchange, so that could help with trading on AUD/USDT/BTC pairs. And if you’re looking at buying and HODLing cryptos, then Swyftx Exchange is an easy-to-use popular choice in Australia.

Categories
Crypto News Decentraland dYdX Loopring Market Analysis Trading

Top 3 Coins to Watch Today: MANA, LRC, DYDX – February 16 Trading Analysis

Let’s take a closer look at today’s altcoins showing breakout signals. We’ll explain what the coin is, then dive into the trading charts and provide some analysis to help you decide.

1. Decentraland (MANA)

Decentraland MANA defines itself as a virtual reality platform powered by the Ethereum blockchain that allows users to create, experience, and monetise content and applications. In this virtual world, users purchase plots of land that they can later navigate, build on and monetise. Decentraland uses two tokens: MANA and LAND. MANA is an ERC-20 token that must be burned to acquire non-fungible ERC-721 LAND tokens. MANA tokens can also be used to pay for a range of avatars, wearables, names and more on the Decentraland marketplace.

MANA Price Analysis

At the time of writing, MANA is ranked the 31st cryptocurrency globally and the current price is US$3.18. Let’s take a look at the chart below for price analysis:

Source: TradingView

Like many other altcoins, MANA set a new all-time high during November 2021 before retracing 45% to the low at $2.50 last week.

Price broke through resistance near $2.88, which may mark an area of possible support on a retracement. If this support fails, bulls might also step in near $2.79. However, a drop this far increases the chances of a stop run to $2.70 and possibly into support near $2.65. For now, continuing bullish market conditions could help $2.90 become support.

The swing high around $3.25 gives bulls a reasonable first target, with $3.34 also likely to draw the price upward. Higher-timeframe resistance beginning near $3.42 or $3.45 could cap the move or trigger consolidations. If bullish market conditions continue, bulls might test probable resistance near new monthly highs around $3.50.

2. Loopring (LRC)

LRC is the Ethereum-based cryptocurrency token of Loopring, an open protocol designed for the building of decentralised crypto exchanges. Loopring’s purported goal is to combine centralised order matching with decentralised on-blockchain order settlement into a hybridised product that will take the best aspects of both centralised and decentralised exchanges.

LRC Price Analysis

At the time of writing, LRC is ranked the 70th cryptocurrency globally and the current price is US$0.983. Let’s take a look at the chart below for price analysis:

Source: TradingView

LRC lifted off last week, with the impulse sweeping the new swing highs into resistance up to $1.16.

If the price retraces now that it has taken highs, aggressive bulls could look for entries at the recently broken resistance between $0.9324 and $0.9150. A deeper retracement that fills the gap down to the monthly level at $0.8740 provides a better entry, with any quick drops near the monthly open at $0.8558 providing the most favourable entries.

Continuation through the current resistance around $1.18 is likely to explode through the remaining daily highs stacked up to $1.26. There’s no telling how far the price could go beyond these new monthly high prices.

3. Dydx (DYDX)

DYDX is a governance token that allows the dYdX community to truly govern the dYdX Layer 2 Protocol. By enabling shared control of the protocol, DYDX allows traders, liquidity providers and partners of dYdX to work collectively towards an enhanced protocol. DYDX enables a robust ecosystem around governance, rewards and staking, each designed to drive future growth and decentralisation of dYdX, resulting in a better experience for users.

DYDX Price Analysis

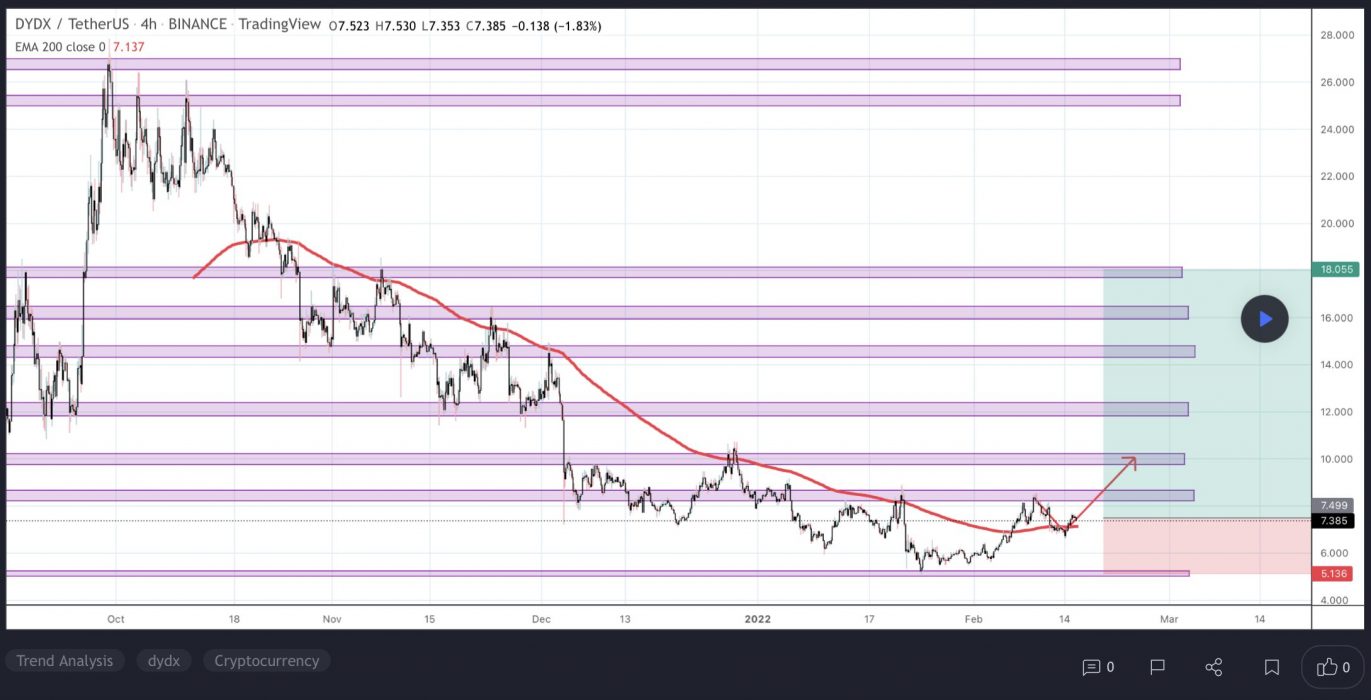
At the time of writing, DYDX is ranked the 134th cryptocurrency globally and the current price is US$7.39. Let’s take a look at the chart below for price analysis:

Source: TradingView

DYDX consolidates between $5.96 and $7.85 with the bulk of the volume concentrated in the lower half of the range. The price does not indicate a clear longer-term direction yet as stop orders build on both sides of the range.

Range traders will likely take profits or sell near $8.12. A stop run and swift rejection above $8.34 could provide a more favourable risk-to-reward entry for bears. An old 4h gap around $8.70 might cap this stop run.

Bulls will likely accumulate more long positions on a run below the relatively equal lows near $7.20. Little exists below the current range to identify precise support levels. However, the area between $7.00 and $6.80 could also give support during a deeper stop run.

If the price does break out decisively to the upside, the swing high at $7.90 provides a reasonable target. The highs and daily resistance levels between $8.57 and $9.10 may provide a second target.

Learn How to Trade Live!

Join Dave and The Crypto Den Crew and they’ll show you live on a webinar how to take your crypto trading to the next level.

Where to Buy or Trade Altcoins?

These coins have high liquidity on Binance Exchange, so that could help with trading on AUD/USDT/BTC pairs. And if you’re looking at buying and HODLing cryptos, then Swyftx Exchange is an easy-to-use popular choice in Australia.
Categories
Crypto News CUDOS Filecoin Harmony Market Analysis Trading

Top 3 Coins to Watch Today: FIL, ONE, CUDOS – February 15 Trading Analysis

Let’s take a closer look at today’s altcoins showing breakout signals. We’ll explain what the coin is, then dive into the trading charts and provide some analysis to help you decide.

1. Filecoin (FIL)

Filecoin FIL is a decentralised storage system that aims to “store humanity’s most important information”. The project was first described back in 2014 as an incentive layer for the Interplanetary File System (IPFS), a peer-to-peer storage network. Filecoin is an open protocol backed by a blockchain that records commitments made by the network’s participants, with transactions using FIL, the blockchain’s native currency. The blockchain is based on both proof-of-replication and proof-of-spacetime.

FIL Price Analysis

At the time of writing, FIL is ranked the 44th cryptocurrency globally and the current price is US$20.90. Let’s take a look at the chart below for price analysis:

Source: TradingView

FIL has retraced nearly 93% since its April 2021 high, with little higher-timeframe support below the current price.

After rejecting resistance at $26.21, the price is crossing below the February open. This area near the February open, between $20.46 and $20.97, might form a new resistance. 

A break through this level could reach near $21.88. A retest of possible higher-timeframe support near $19.23 could provide a bounce. However, if the price moves under $18.03 and retests it from below, higher timeframes show no remaining support below this region.

2. Harmony (ONE)

Harmony ONE is a blockchain platform designed to facilitate the creation and use of decentralised applications (DApps). The network aims to innovate the way decentralised applications work by focusing on random state sharding, which allows creating blocks in seconds. Harmony was expected to introduce cross-shard contracts and a cross-chain infrastructure by the end of 2021.

ONE Price Analysis

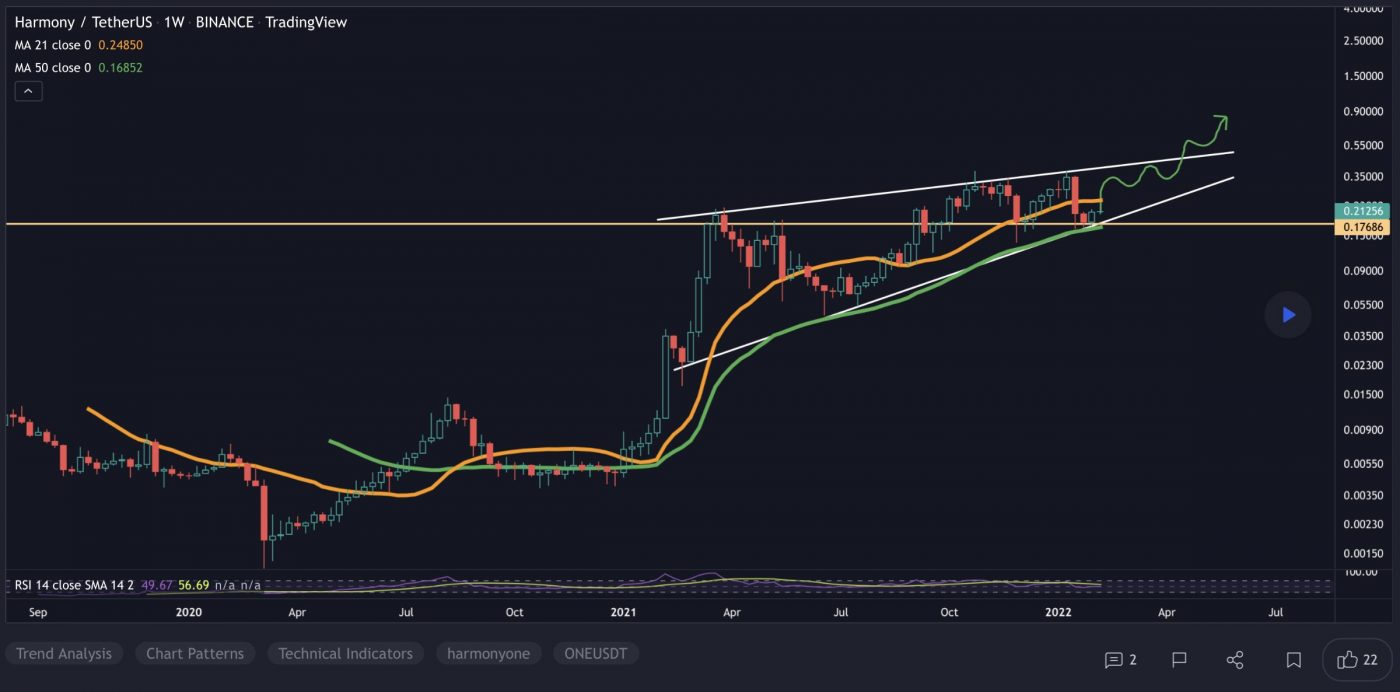
At the time of writing, ONE is ranked the 50th cryptocurrency globally and the current price is US$0.1855. Let’s take a look at the chart below for price analysis:

Source: TradingView

After a strong rally during the second half of 2021, ONE has ranged between $0.16326 and $0.38000.

The price is currently testing possible support, near $0.18317, for the third time. This area has confluence with the 61.8% retracement level of 2021’s bull run and the February monthly open. While it could provide support again, multiple retests of a level often lead to it breaking.

If this level breaks, $0.14879 might offer the next substantial support. This level supported the price during December 4’s crash and is approximately halfway between the 61.8% and 78.6% retracement levels of 2021’s bull run.

A more significant breakdown could reach between $0.11481 to $0.08465 – particularly near $0.09797 – and possibly mark a longer-term bottom. These levels are just below the 78.6% retracement level where the price accumulated for 2021’s bull run.

Just above the current price, the 18 EMA and an inefficiently traded area near $0.1970 may offer resistance. A break through this level could reach $0.2407, above the last significant swing high and the 2021 open. 

If market conditions turn much more bullish, higher timeframes suggest that bulls might take significant profits near $0.2910, which marks an old area of rejection.

3. Cudos (CUDOS)

CUDOS powers a decentralised computing network that will interoperate with multiple blockchain ecosystems to provide the following benefits: Trusted layer 1 validator network built on the Tendermint protocol – Wasm compatibility, for smart contracts to be deployed on CUDOS using next-generation languages so long as they compile to WebAssembly, ie, Golang, Rust, Java, etc; cross-chain or horizontal interoperability; the network’s Inter Blockchain Communication (IBC) integration, allowing Cudos Network smart contracts to interface with multiple networks; and 10x lower transaction and gas costs compared to those on PoW networks.

CUDOS Price Analysis

At the time of writing, CUDOS is ranked the 418th cryptocurrency globally and the current price is US$0.03007. Let’s take a look at the chart below for price analysis:

Source: TradingView

Since May, CUDOS ranged between approximately $0.04444 and $0.02320, with a 158% surge from the range lows between mid-October and mid-November.

The price retraced the Q4 breakout into possible support just under the 78.6% retracement, near $0.02407. The higher-timeframe chart suggests that this area and down to $0.01815 could offer support again.

At the 78.6% retracement and just above the February monthly open, $0.02785 offers closer possible support.

Just above the current price, overlaps on multiple timeframes suggest that $0.03201 may create strong resistance. However, the price could move as high as $0.038220 if this closer resistance gives way.

The price is currently entering an area of congested historical price action between $0.03335 and $0.02829. This zone is between the 61.8% and 78.6% retracement levels, which often mark an accumulation area. These factors, and the confluence with the 9, 18 and 40 EMAs, support the idea that price may consolidate in this region.

Learn How to Trade Live!

Join Dave and The Crypto Den Crew and they’ll show you live on a webinar how to take your crypto trading to the next level.

Where to Buy or Trade Altcoins?

These coins have high liquidity on Binance Exchange, so that could help with trading on AUD/USDT/BTC pairs. And if you’re looking at buying and HODLing cryptos, then Swyftx Exchange is an easy-to-use popular choice in Australia.
Categories
Cardano Crypto News Market Analysis Polygon Solana Trading

Top 3 Coins to Watch Today: MATIC, SOL, ADA – February 14 Trading Analysis

Let’s take a closer look at today’s altcoins showing breakout signals. We’ll explain what the coin is, then dive into the trading charts and provide some analysis to help you decide.

1. Polygon (MATIC)

Polygon MATIC is the first well-structured, easy-to-use platform for Ethereum scaling and infrastructure development. Its core component is Polygon SDK, a modular, flexible framework that supports building multiple types of applications. The MATIC token will continue to exist and will play an increasingly important role, securing the system and enabling governance.

MATIC Price Analysis

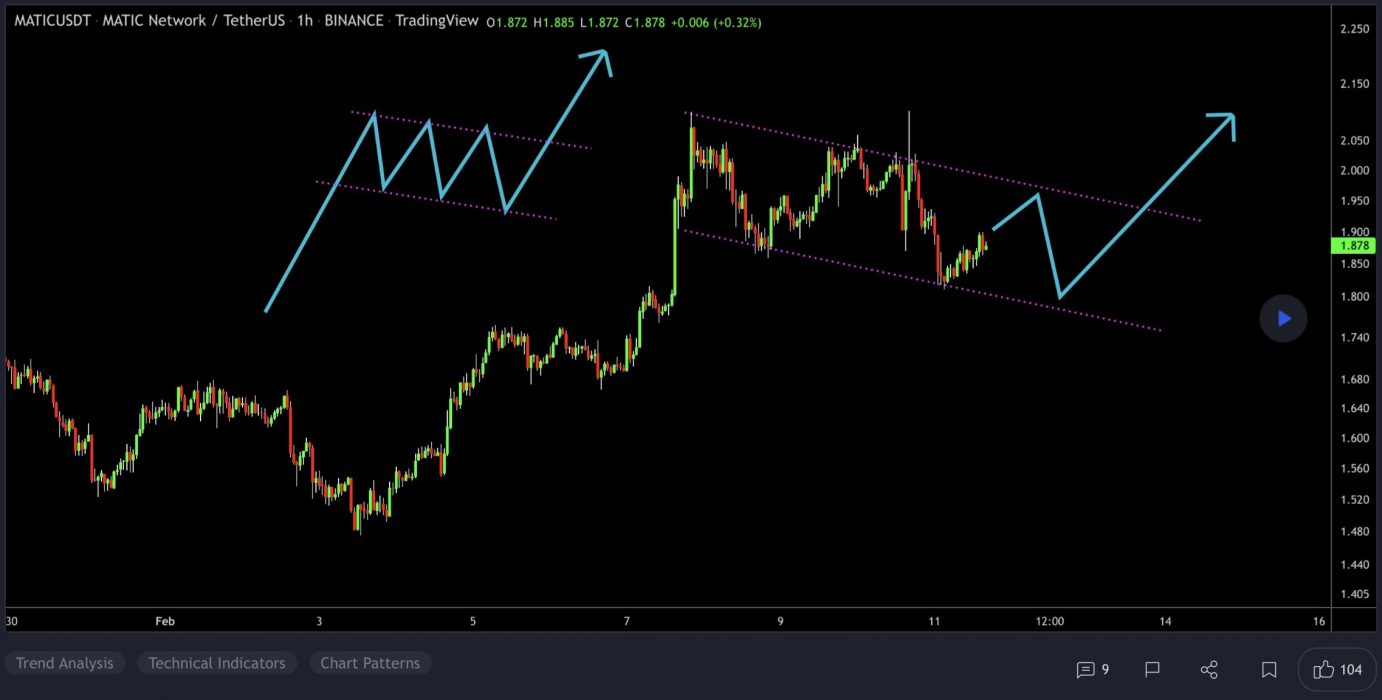
At the time of writing, MATIC is ranked the 16th cryptocurrency globally and the current price is US$1.68. Let’s take a look at the chart below for price analysis:

Source: TradingView

Since its January low, MATIC has been in a steady bullish trend – printing a 60% gain by early February. The price found support near $1.62, at the 78.6% retracement level, during mid-January’s decline.

Last week’s sharp impulse up might have marked the start of a new bullish swing. If so, higher timeframes suggest that $2.12 near the 61.8% retracement, and the 9, 18 and 40 EMAs, may see interest from bulls. The price could reach lower, near $1.57, and still find support.

Currently, the price is contesting a region between $1.80 and $1.61. Closes over this level could confirm it as new support, leading to a move higher.

However, bulls are contending with probable resistance near $1.77, while $1.84 is also likely to be sensitive with the nearest support and resistance this close together.

2. Solana (SOL)

Solana SOL is a highly functional open-source project that banks on blockchain technology’s permissionless nature to provide decentralised finance (DeFi) solutions. The Solana protocol is designed to facilitate decentralised app (DApp) creation. It aims to improve scalability by introducing a proof-of-history (PoH) consensus combined with the underlying proof-of-stake (PoS) consensus of the blockchain.

SOL Price Analysis

At the time of writing, SOL is ranked the 8th cryptocurrency globally and the current price is US$93.63. Let’s take a look at the chart below for price analysis:

Source: TradingView

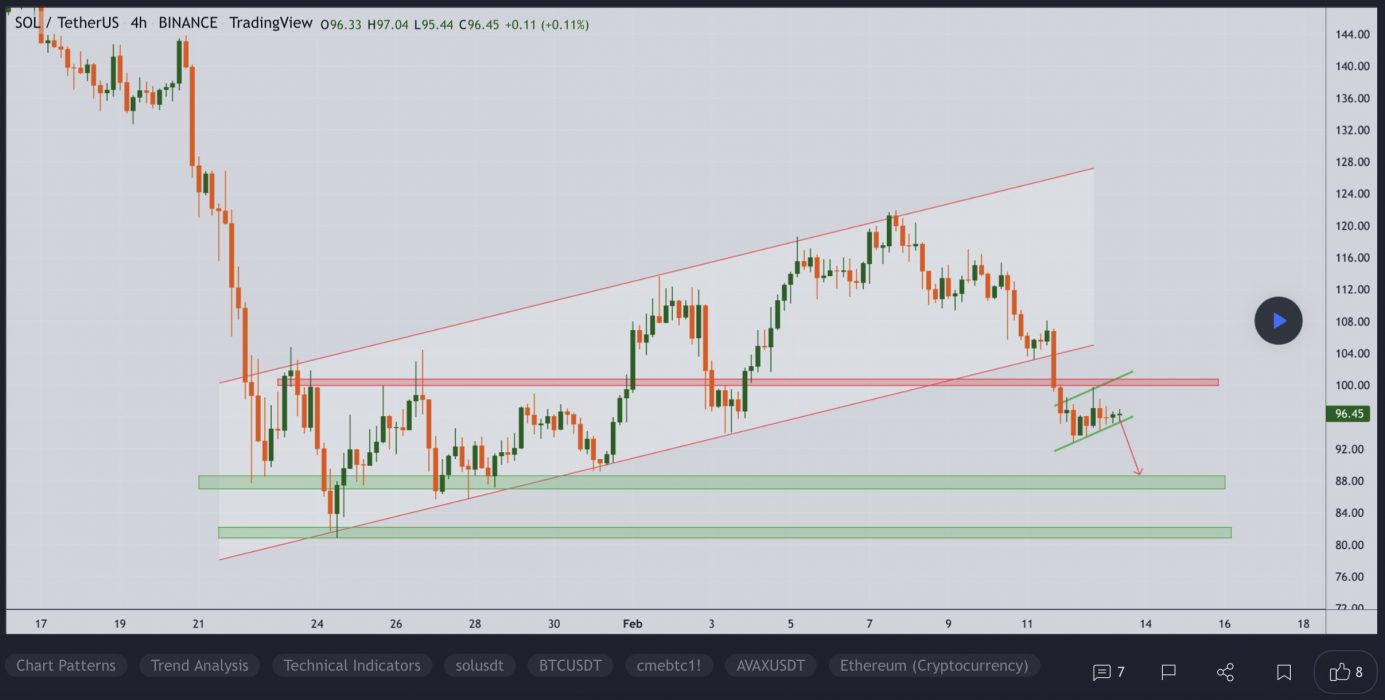
SOL retraced nearly 45% from its high before finding a low during last week. Since then, the price has been sweeping stops on both sides of its local range as the current consolidation sets up the next move.

Aggressive bulls might bid near $90.34, although a sweep of the stops near $86.61 could reach below the next swing low into possible support near $80.12. A continued downtrend may run into the weekly gap near $76.24.

Some bears may add more shorts near $98.87, although a push to $110.66 is reasonable. A daily candle close over the swing high near $128.04 could suggest that a longer-term trend reversal is in play, with bulls possibly entering on a retracement near $143.62 for monthly high prices.

3. Cardano (ADA)

Cardano ADA is a proof-of-stake blockchain platform whose stated goal is to allow “changemakers, innovators and visionaries” to bring about positive global change. The open-source project also aims to “redistribute power from unaccountable structures to the margins to individuals”, helping to create a society that is more secure, transparent, and fair. Cardano is used by agricultural companies to track fresh produce from field to fork, while other products built on the platform allow educational credentials to be stored in a tamper-proof way, and retailers to clamp down on counterfeit goods.

ADA Price Analysis

At the time of writing, ADA is ranked the 7th cryptocurrency globally and the current price is US$1.05. Let’s take a look at the chart below for price analysis:

Source: TradingView

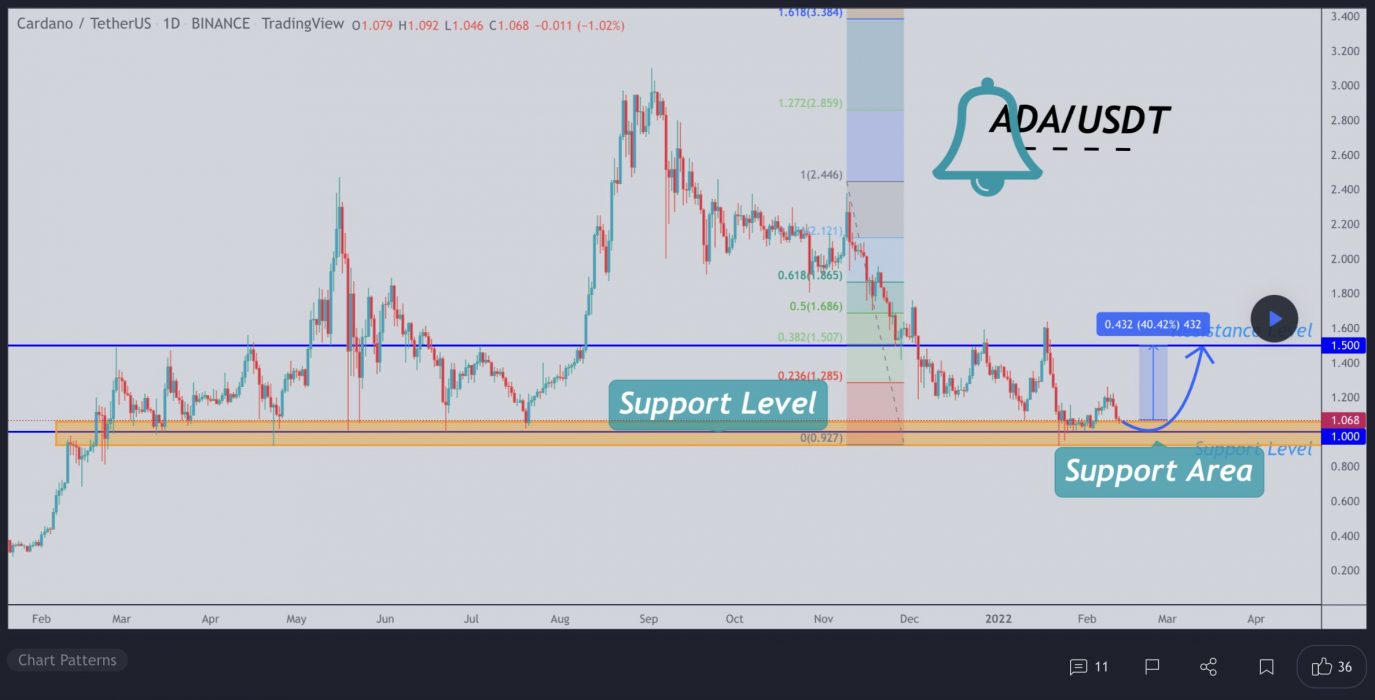
ADA‘s nearly 55% drop from its mid-January highs found a low near $1.05 last week before closing over a short-term high.

This daily close over the high could signal a shift in market structure that may reach probable resistance near $1.25. A sustained bullish move may target the swing high at $1.35. If this stop run occurs, a run beyond the high into probable resistance near $1.44 and $1.53 is possible.

Bulls could buy a retracement to possible support near $1.00, just above the monthly open. A bearish turn in the marketplace may propel the price toward possible support near $0.9625. 

However, relatively equal lows near $0.9218 and $0.9022 provide an attractive target for bears if the market resumes its bearish trend. A run on these lows might find support between $0.8647 and $0.8492.

Learn How to Trade Live!

Join Dave and The Crypto Den Crew and they’ll show you live on a webinar how to take your crypto trading to the next level.

Where to Buy or Trade Altcoins?

These coins have high liquidity on Binance Exchange, so that could help with trading on AUD/USDT/BTC pairs. And if you’re looking at buying and HODLing cryptos, then Swyftx Exchange is an easy-to-use popular choice in Australia.

Categories
Binance Coin Crypto News Market Analysis Ripple Tezos Trading

Top 3 Coins to Watch Today: XRP, BNB, XTZ – February 11 Trading Analysis

Let’s take a closer look at today’s altcoins showing breakout signals. We’ll explain what the coin is, then dive into the trading charts and provide some analysis to help you decide.

1. Ripple (XRP)

Ripple XRP is the currency that runs on a digital payment platform called RippleNet, on top of a distributed ledger database called XRP Ledger. While RippleNet is run by a company called Ripple, the XRP Ledger is open-source and not based on a blockchain, but rather the previously mentioned distributed ledger database.

XRP Price Analysis

At the time of writing, XRP is ranked the 6th cryptocurrency globally and the current price is US$0.8682. Let’s take a look at the chart below for price analysis:

Source: TradingView

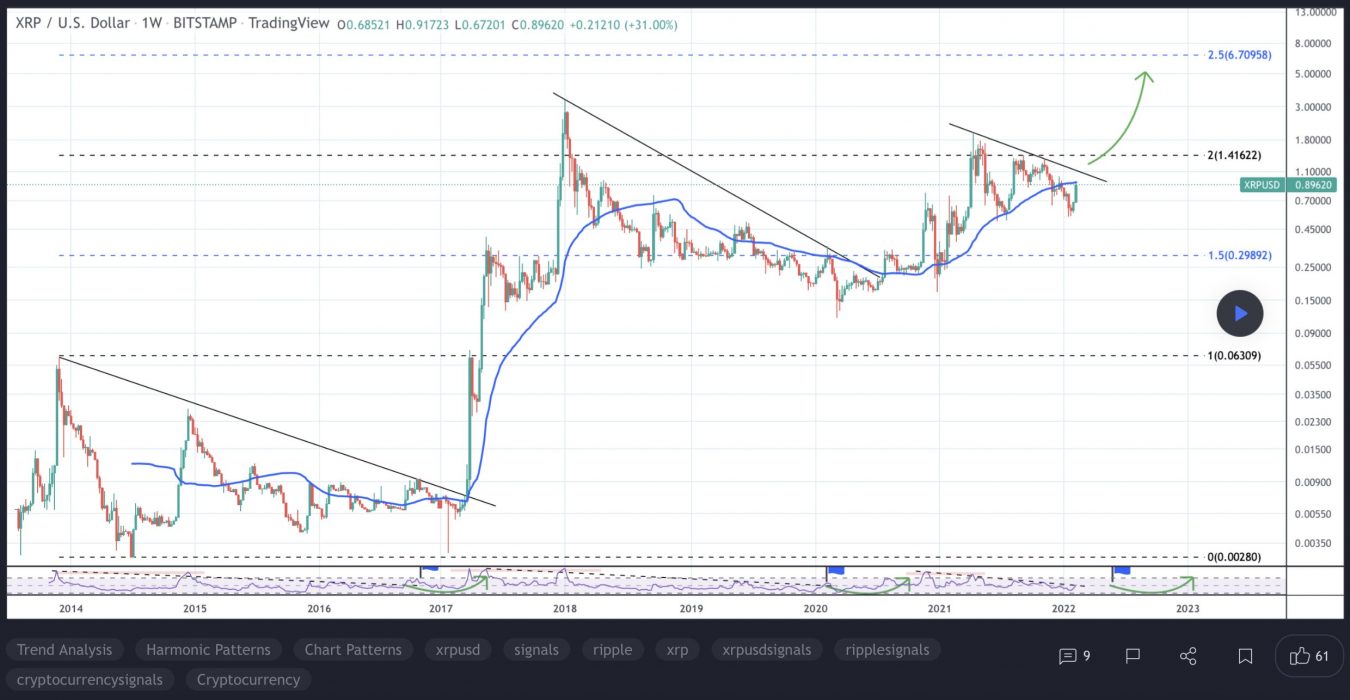
XRP printed some gains during last week before moving sideways for the rest of the month.

The price was in a downtrend, with the 9, 18 and 40 EMAs providing resistance on each attempt to rally. However, bulls are showing some interest at the 70.6% retracement, near $0.8372. If this level breaks, a move into possible support – just below the lows near $0.7552 – seems likely.

If the price does rally through the swing high at $0.9260 – perhaps triggered by a sudden surge in Bitcoin – bulls might find some resistance at the 61.8% retracement level near $0.9950. 

Overlapping swing highs and lows near $1.084 might provide the next target, where bears immediately forced the price down in late December.

More bullish market conditions could shift targets up near the midpoint of Q3’s consolidation, near $1.17, where higher timeframes show an inefficiently traded zone.

2. Binance Coin (BNB)

Binance BNB is the biggest cryptocurrency exchange globally, based on daily trading volume. Binance aims to bring cryptocurrency exchanges to the forefront of world financial activity. Aside from being the largest cryptocurrency exchange, Binance has launched a whole ecosystem of functionalities for its users. The Binance network includes the Binance Chain, Binance Smart Chain, Binance Academy, Trust Wallet, and Research projects, which all employ the powers of blockchain technology to bring new-age finance to the world. Binance Coin is an integral part of the successful functioning of many of the Binance sub-projects.

BNB Price Analysis

At the time of writing, BNB is ranked the 4th cryptocurrency globally and the current price is US$430.12. Let’s take a look at the chart below for price analysis:

Source: TradingView

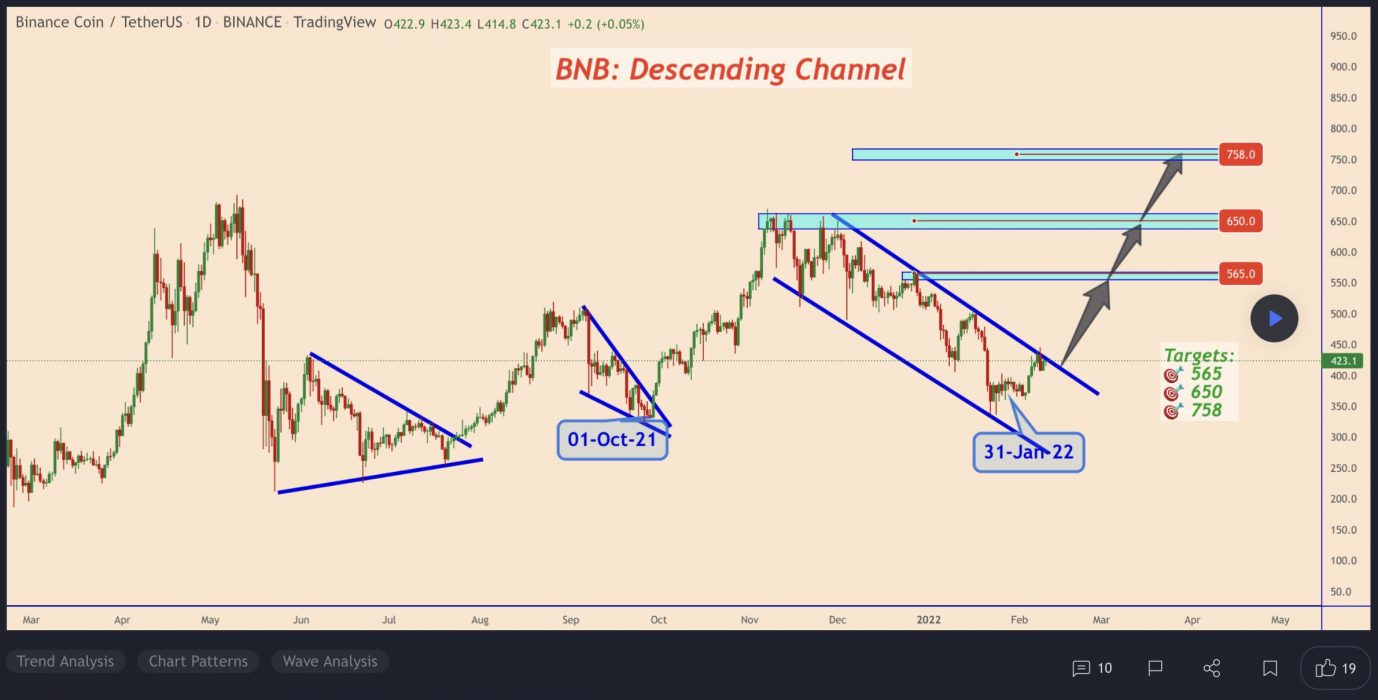
After a 30% decline during January, BNB has ranged between $370 and $445.

The recent price recovery was approaching probable resistance near $439, but could be aiming for stops above the relatively equal highs near $455. Continuation of the trend could target the daily gap near $476.

Aggressive bulls might add to positions near $422 and $417. Price action near $410 may be more likely to provide support – if it gets there – during any retracements.

Relatively equal lows clustered around $400 seem likely to be swept if the bearish trend resumes. If this move occurs, the price might find support at the significant higher-timeframe level near $385.

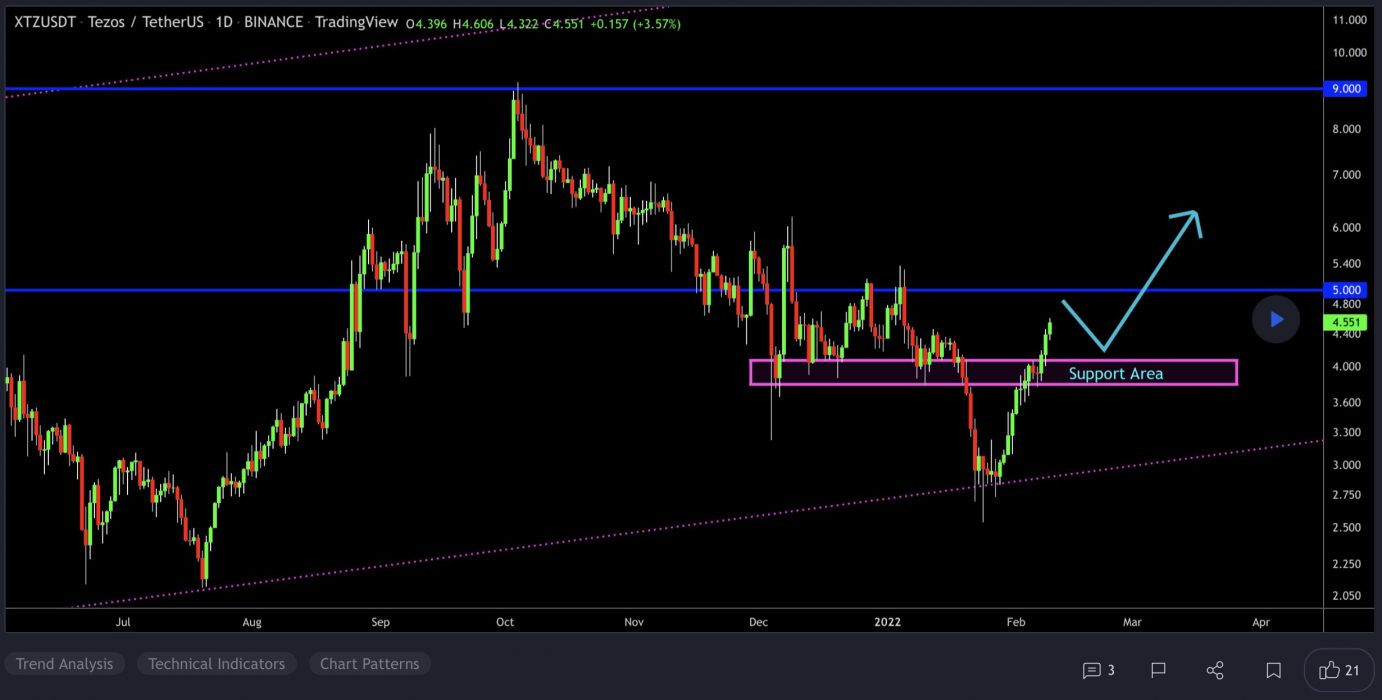
3. Tezos (XTZ)

Tezos XTZ is a blockchain network that’s based on smart contracts in a way that’s not too dissimilar to Ethereum. However, there’s a big difference: Tezos aims to offer infrastructure that is more advanced – meaning it can evolve and improve over time without any danger of a hard fork. This is something both Bitcoin and Ethereum have suffered since they were created. People who hold XTZ can vote on proposals for protocol upgrades that have been put forward by Tezos developers.

XTZ Price Analysis

At the time of writing, XTZ is ranked the 44th cryptocurrency globally and the current price is US$4.36. Let’s take a look at the chart below for price analysis:

Source: TradingView

XTZ‘s 59% drop since late December saw a second leg after last week’s market-wide drop ran the previous consolidation’s stops.

The level near $4.45 is providing some resistance. However, continuation through the monthly high at $4.60 is not out of the question. Aggressive bulls might bid in the current region near $4.88. 

If the price runs the recent swing low, bulls might bid in the gap near $4.23. A deeper retracement could reach near the mid-December level and a gap near $4.05. The region near $3.89 and $3.70 may also provide some support during a deeper retracement.

Learn How to Trade Live!

Join Dave and The Crypto Den Crew and they’ll show you live on a webinar how to take your crypto trading to the next level.

Where to Buy or Trade Altcoins?

These coins have high liquidity on Binance Exchange, so that could help with trading on AUD/USDT/BTC pairs. And if you’re looking at buying and HODLing cryptos, then Swyftx Exchange is an easy-to-use popular choice in Australia.