Categories
Crypto News Harmony Market Analysis SKALE Network Trading Zcash

Top 3 Coins to Watch Today: SKL, ONE, ZEC – July 18 Trading Analysis

Let’s take a closer look at today’s altcoins showing breakout signals. We’ll explain what the coin is, then dive into the trading charts and provide some analysis to help you decide.

1. SKALE Network (SKL)

Skale SKL is described as an elastic network that’s designed to bring scalability to Ethereum. As well as boosting transaction capacity, the decentralised project aims to reduce latency and ensure that payments can be made as cheaply as possible. SKALE Network is geared towards improving both the security and decentralisation of Ethereum-based apps. Token holders on the SKALE Network are incentivised and earn rewards by helping to improve the scalability and security of the platform by serving as validators.

SKL Price Analysis

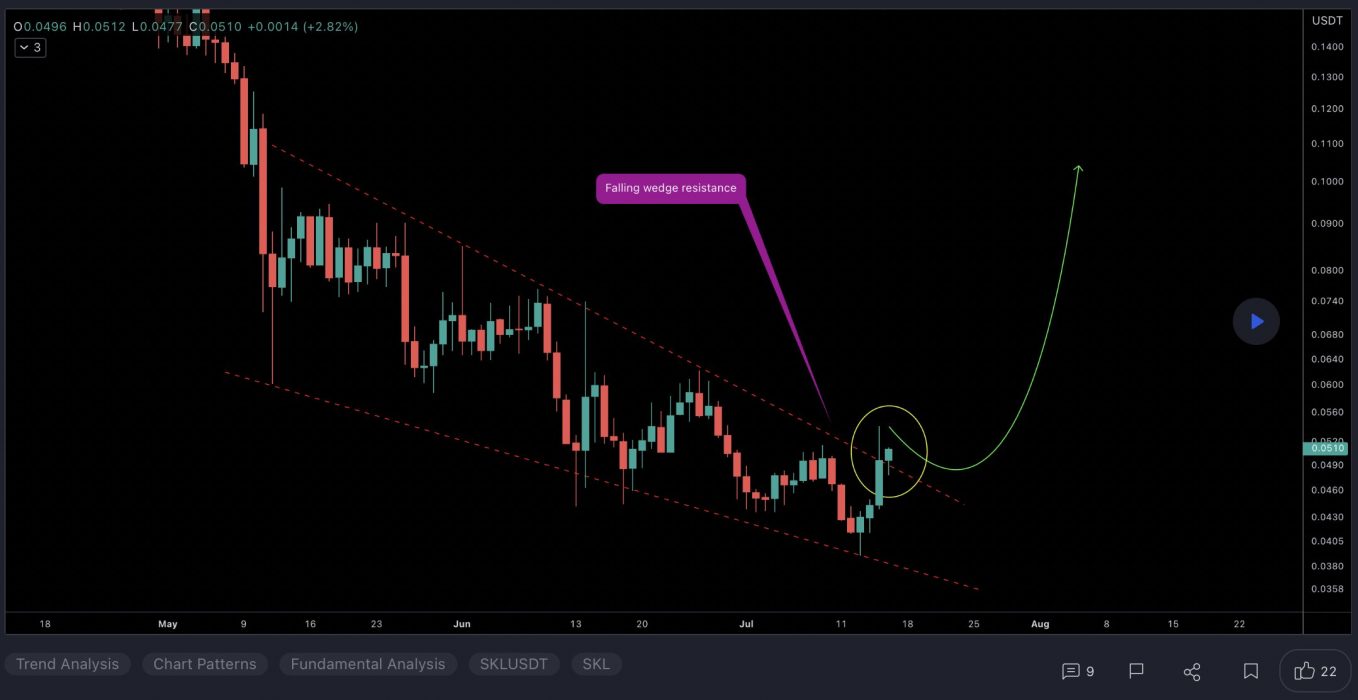
At the time of writing, SKL is ranked the 150th cryptocurrency globally and the current price is US$0.05101. Let’s take a look at the chart below for price analysis:
Source: TradingView

Since the beginning of Q2, SKL has been in a gentle downtrend. The future likely holds more stop runs and erratic volatility until the chart forms more substantial high-timeframe levels.

A retracement might uncover support near $0.05020, which is the daily high of the last swing low. The high of the wick beginning near $0.04671 may also provide support. However, bulls will likely remain wary of the current downtrend, making the low at $0.04130 the likely next bearish target.

Just above, the daily gap beginning near $0.05788 may provide resistance to bulls, possibly marking a future range high. A push through this level is likely to target the swing high near $0.06293 – perhaps running to probable resistance near $0.06544. Strength above this level might signal the start of a bullish trend, encouraging bulls to “buy the dip”.

2. Harmony (ONE)

Harmony ONE is a blockchain platform designed to facilitate the creation and use of decentralised applications (DApps). The network aims to innovate the way decentralised applications work by focusing on random state sharding, which allows creating blocks in seconds. Harmony was expected to introduce cross-shard contracts and a cross-chain infrastructure by the end of 2021.

ONE Price Analysis

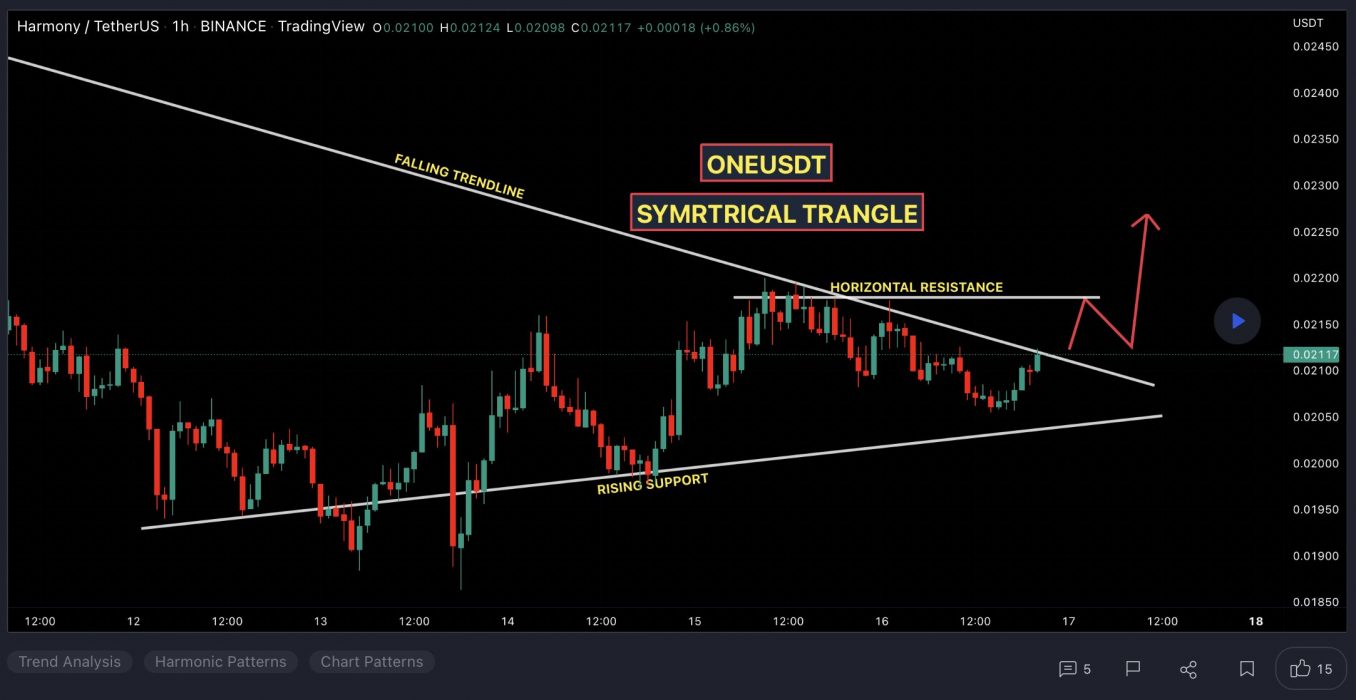
At the time of writing, ONE is ranked the 108th cryptocurrency globally and the current price is US$0.02152. Let’s take a look at the chart below for price analysis:
Source: TradingView

ONE bulls have had to endure a 85% drop since early Q2 until the price set a low and began a range in June.

Currently, the price is aggressively moving toward possible resistance, beginning near $0.02951. Stops above the swing high at $0.03325 might be the target before a downwards retracement. Multiple old lows mark this resistance, which is near the 78.6% retracement level of a recent significant bearish swing.

If the price continues through this high, it could be reaching for an inefficient area near $0.03742. Moving to this level would run bears’ stops above the swing high at the same level. A more substantial rally might reach an old swing high and inefficiently traded area between $0.03975 and $0.04038, which surrounds the yearly open.

If the price stays above the weekly low of $0.02095, this price could support a run above the $0.01935 swing high. Just below, at $0.01854, bulls might eye the consolidation high as more substantial support. This zone contains the 9 and 40 EMAs.

A deeper retracement might retest the accumulation area between $0.01725 and $0.01680. If this level breaks, bears may be targeting an inefficiently traded area on higher timeframes beginning near $0.01480. This area overlaps the 47% extension of a recent significant bearish swing.

3. Zcash (ZEC)

Zcash ZEC is a decentralised cryptocurrency focused on privacy and anonymity. It uses the zk-SNARK zero-knowledge proof technology that allows nodes on the network to verify transactions without revealing any sensitive information about those transactions. Zcash transactions, on the other hand, still have to be relayed via a public blockchain but, unlike pseudonymous cryptocurrencies, ZEC transactions by default do not reveal the sending and receiving addresses or the amount being sent.

ZEC Price Analysis

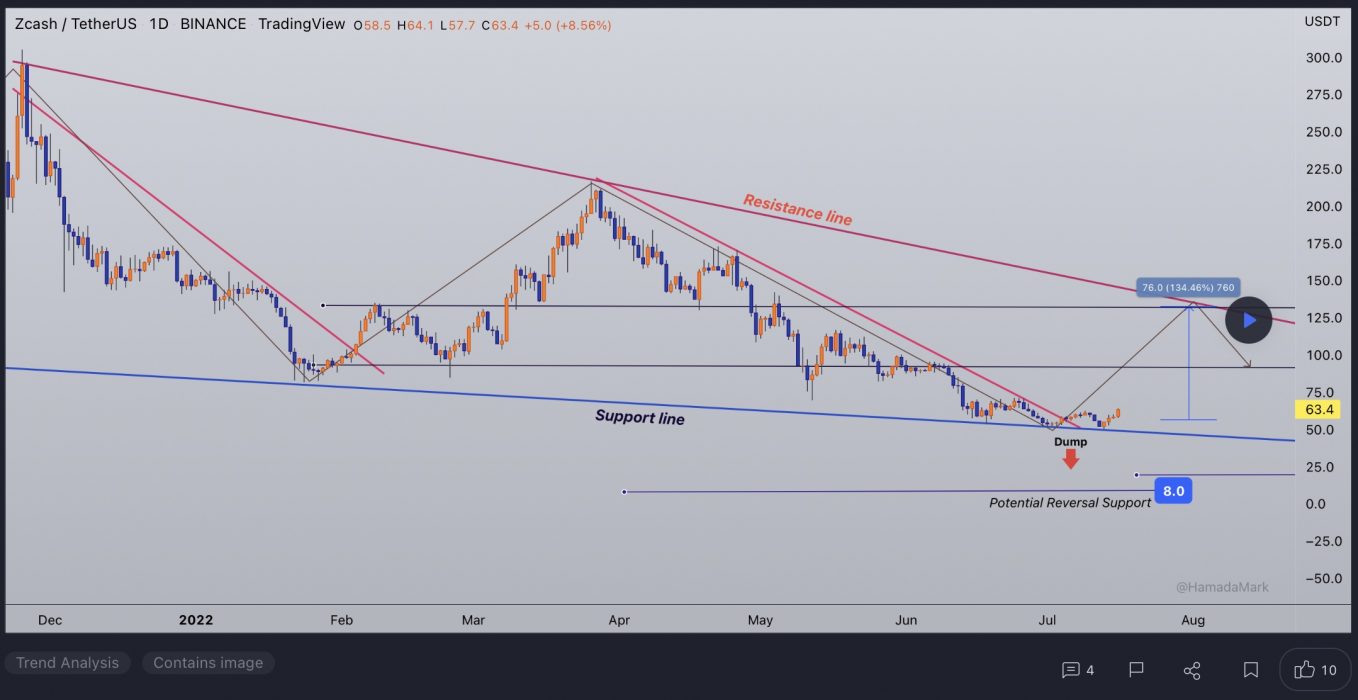
At the time of writing, ZEC is ranked the 52nd cryptocurrency globally and the current price is US$60.44. Let’s take a look at the chart below for price analysis:
Source: TradingView

ZEC‘s recent bearish flip of the 9, 18 and 40 EMAs may cause bulls to be less aggressive in bidding. However, possible support near $52.47 and $44.96 – between the 41.8% and 58.6% retracements – could see at least a short-term bounce. 

Last year’s long-term consolidation suggests that the areas near $83.23 may be more likely to cause a longer-term trend reversal. 

Bears are likely to add to their shorts at probable resistance beginning near $75.50, which has confluence with the 18 EMA. A fast break of this resistance could trigger more selling near $88.12, the start of the bearish move.

If an aggressive bullish move does appear, trapped buyers in the probable resistance beginning near $97.32 may provide a ceiling for this impulse.

Learn How to Trade Live!

Join Dave and The Crypto Den Crew and they’ll show you live on a webinar how to take your crypto trading to the next level.
Where to Buy or Trade Altcoins?

These coins have high liquidity on Binance Exchange, so that could help with trading on AUD/USDT/BTC pairs. And if you’re looking at buying and HODLing cryptos, then Swyftx Exchange is an easy-to-use popular choice in Australia.

Categories
Algorand Crypto News Fantom Market Analysis Trading Tranchess

Top 3 Coins to Watch Today: CHESS, ALGO, FTM – July 15 Trading Analysis

Let’s take a closer look at today’s altcoins showing breakout signals. We’ll explain what the coin is, then dive into the trading charts and provide some analysis to help you decide.

1. Tranchess (CHESS)

Tranchess CHESS is a yield-enhancing asset tracker with varied risk-return solutions. Tranchess provides a different risk/return matrix out of a single main fund that tracks a specific underlying asset. The name Tranchess was inspired by the game of chess, as well as the French word “Tranche”, which is often associated with tranche funds that cater to a different class of investors with varying risk appetite. Tranchess was launched on June 24, 2021. The project leverages on smart contracts, making it transparent and automated across processes.

CHESS Price Analysis

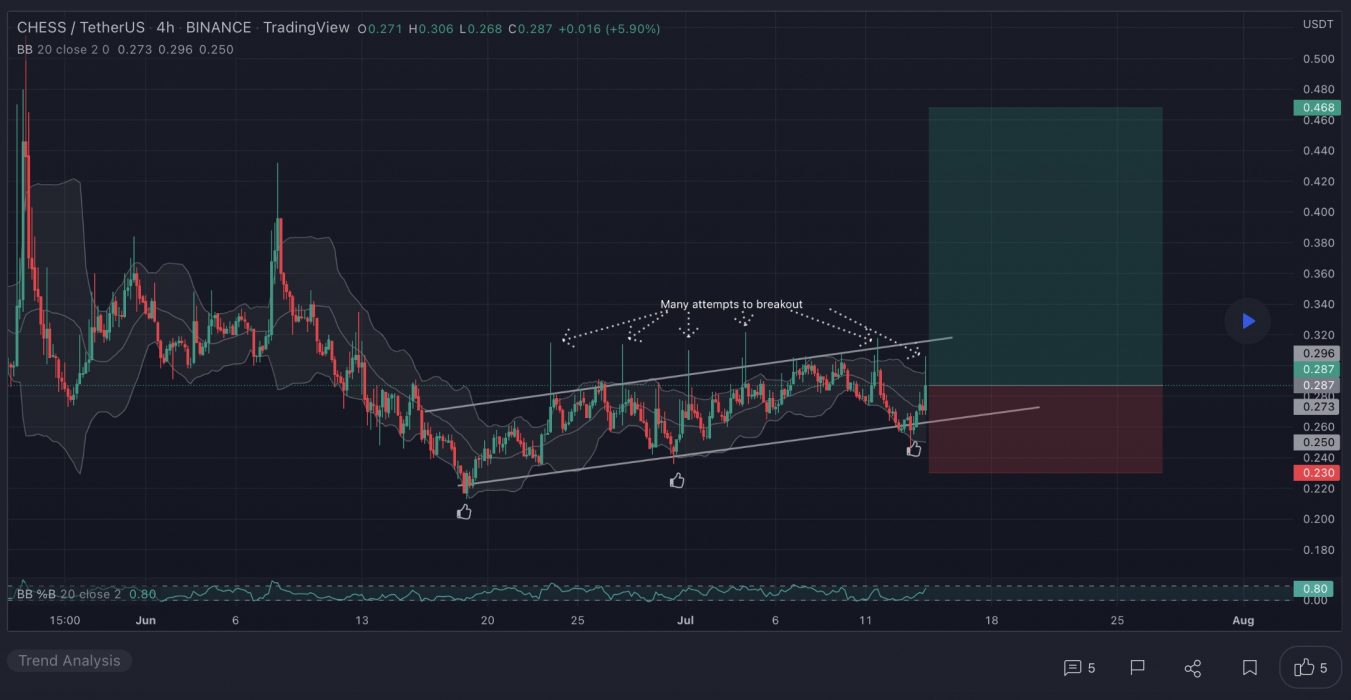
At the time of writing, CHESS is ranked the 548th cryptocurrency globally and the current price is US$0.2954. Let’s take a look at the chart below for price analysis:

Source: TradingView

CHESS dropped 85% from its early April swing high before beginning a consolidation range in mid-May.

Most trading occurred between the June monthly open and $0.2650. Here, relatively equal lows have formed under the oldest historical low, around $0.3570.

These lows might serve as a magnet for a stop run reaching near the last swing low, between $0.2162 and $0.2270. A continued move down could run more bulls’ stops below May’s low at $0.1840.

No historical price action exists under May’s low to pinpoint possible support. Round numbers suggest that $0.1535 could offer some support on an initial stop run under May’s low. 

Below this level, the 50% and 100% extensions (projected from two swings in the current range) overlap near $0.09240. This confluence could offer a weak hint at another possible support. Bulls should be highly cautious given the bearish chart and market conditions.

2. Algorand (ALGO)

The Algorand ALGO blockchain is a permissionless, pure proof-of-stake blockchain protocol. Unlike Proof-of-Work (PoW) blockchains, where the root block must be validated by randomly selected validators (using computing power), in the pure proof-of-stake approach all of the validators are known to one another and only have to agree on the next block in order to create a new block. Algorand was invented to speed up transactions and improve efficiency in response to the slow transaction times of Bitcoin and other blockchains.

ALGO Price Analysis

At the time of writing, ALGO is ranked the 28th cryptocurrency globally and the current price is US$0.3259. Let’s take a look at the chart below for price analysis:

Source: TradingView

After creating a second equal low during last month, ALGO gained nearly 20% into resistance that starts near $0.4522.

Swing traders looking for a continuation to the nearest cluster of relatively equal highs around $0.5312 might look for bids near $0.5736. More significant resistance rests above, near $0.6125. A group of significant swing highs at $0.6510 and $.6718 give possible targets if this resistance breaks.

A stop run on the recent low at $0.3033 into possible support beginning near $0.2630 might see stronger bidding. This area also has a confluence with the recent monthly lows.

3. Fantom (FTM)

Fantom FTM is a directed acyclic graph (DAG) smart contract platform providing decentralised finance (DeFi) services to developers using its own bespoke consensus algorithm. Together with its in-house token FTM, Fantom aims to solve problems associated with smart-contract platforms – specifically transaction speed, which developers say they have reduced to under two seconds.

FTM Price Analysis

At the time of writing, FTM is ranked the 63rd cryptocurrency globally and the current price is US$0.2499. Let’s take a look at the chart below for price analysis:

Source: TradingView

FTM‘s bounce during Q2 ran into resistance near the old monthly highs. This rejection created a set of relatively equal highs near $0.4167, possibly forming the next bullish leg’s target.

Currently, the price is testing possible support near the weekly open, around $0.2165. This level also has confluence with the 80.6% retracement of the current local range and the 18 and 40 EMAs. 

If this level fails to provide support, a zone from $0.1854 to $0.1723 might mark a possible swing low or consolidation area. This zone is between the 65.8% and 78.6% retracement of August 2021’s swing.

A more bearish tone in the market could propel the price lower. The lows, near $0.1470, may mark an area of possible support as well as a bearish target.

Learn How to Trade Live!

Join Dave and The Crypto Den Crew and they’ll show you live on a webinar how to take your crypto trading to the next level.

Where to Buy or Trade Altcoins?

These coins have high liquidity on Binance Exchange, so that could help with trading on AUD/USDT/BTC pairs. And if you’re looking at buying and HODLing cryptos, then Swyftx Exchange is an easy-to-use popular choice in Australia.

Categories
Aave Avalanche Crypto News Market Analysis Trading Voyager Token

Top 3 Coins to Watch Today: AVAX, VGX, AAVE – July 14 Trading Analysis

Let’s take a closer look at today’s altcoins showing breakout signals. We’ll explain what the coin is, then dive into the trading charts and provide some analysis to help you decide.

1. Avalanche (AVAX)

Avalanche AVAX is the fastest smart contracts platform in the blockchain industry, as measured by time-to-finality, and has the most validators securing its activity of any proof-of-stake protocol. Avalanche is also low-cost, and green. Any smart contract-enabled application can outperform its competition on Avalanche.

AVAX is the native token of Avalanche. It is a hard-capped, scarce asset that is used to pay for fees, secure the platform through staking, and provide a basic unit of account between the multiple subnets created on Avalanche.

AVAX Price Analysis

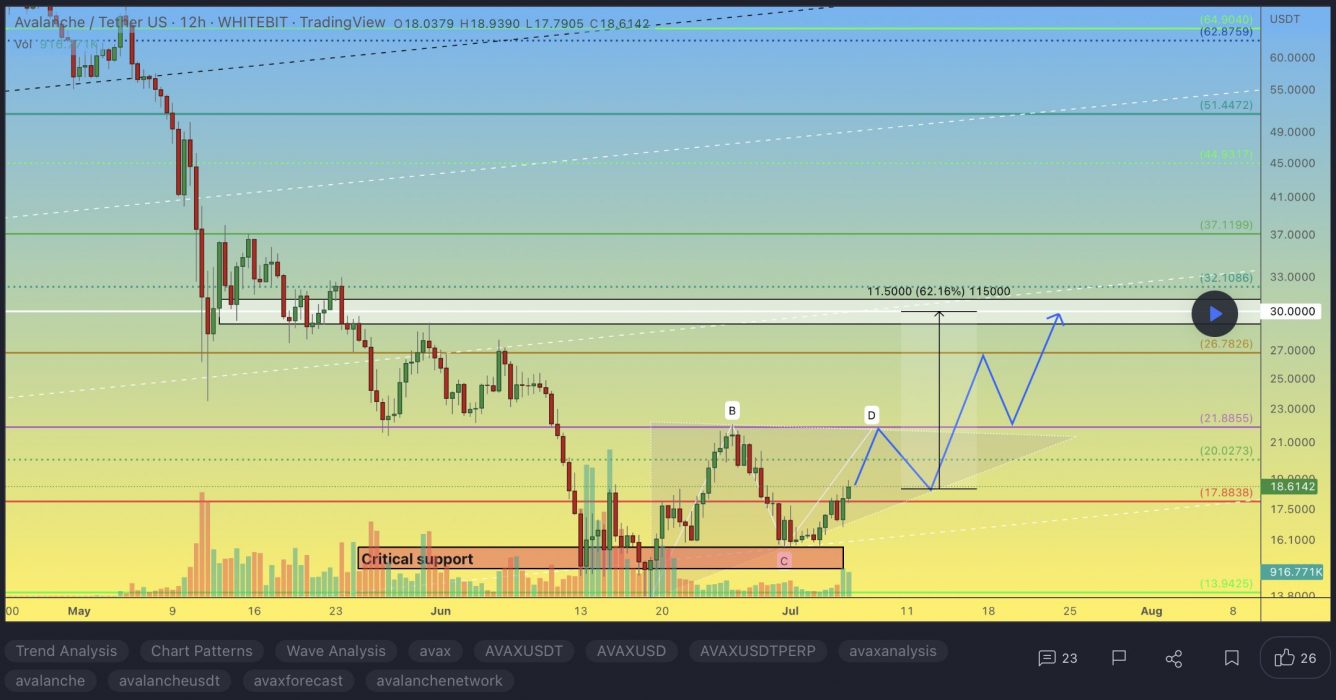
At the time of writing, AVAX is ranked the 16th cryptocurrency globally and the current price is US$17.88. Let’s take a look at the chart below for price analysis:

Source: TradingView

AVAX‘s gains in Q2 ended with an almost 80% retracement as the rest of the altcoin market dropped from early last month. Bulls stepped in near the 62.8% retracement of Q2’s move, creating a consolidation that ended with the bullish impulse to resistance near $25.30.

With the 9, 18 and 40 EMAs stacked bullish and a bullish higher-timeframe trend, it’s reasonable to anticipate retracement to possible support before further bullish expansion. 

Near the 40 EMA, a broad zone from $18.35 to $17.00 could see interest from bulls before further expansion. Bears might capitalise on any sharp moves down in Bitcoin, aiming for possible support near the 75% retracement, at $16.10, and potentially lower to a higher-timeframe support zone between $15.60 and $14.32.

If the higher-timeframe recovery trend resumes and the current resistance near $23.64 breaks, the wicks near $27.14 and the new monthly highs may see profit-taking.

2. Voyager Token (VGX)

Voyager Token VGX is a cryptocurrency broker that provides investors with a trusted and secure access point to crypto asset trading. Voyager is built to serve both retail and institutional investors with a nigh-instant solution for trading crypto assets. The native token of the brokerage, Voyager Token VGX, is used to reward users within the Voyager ecosystem. VGX also generates interest when held in the Voyager app, and offers cashback rewards and other services exclusive to Voyager users.

VGX Price Analysis

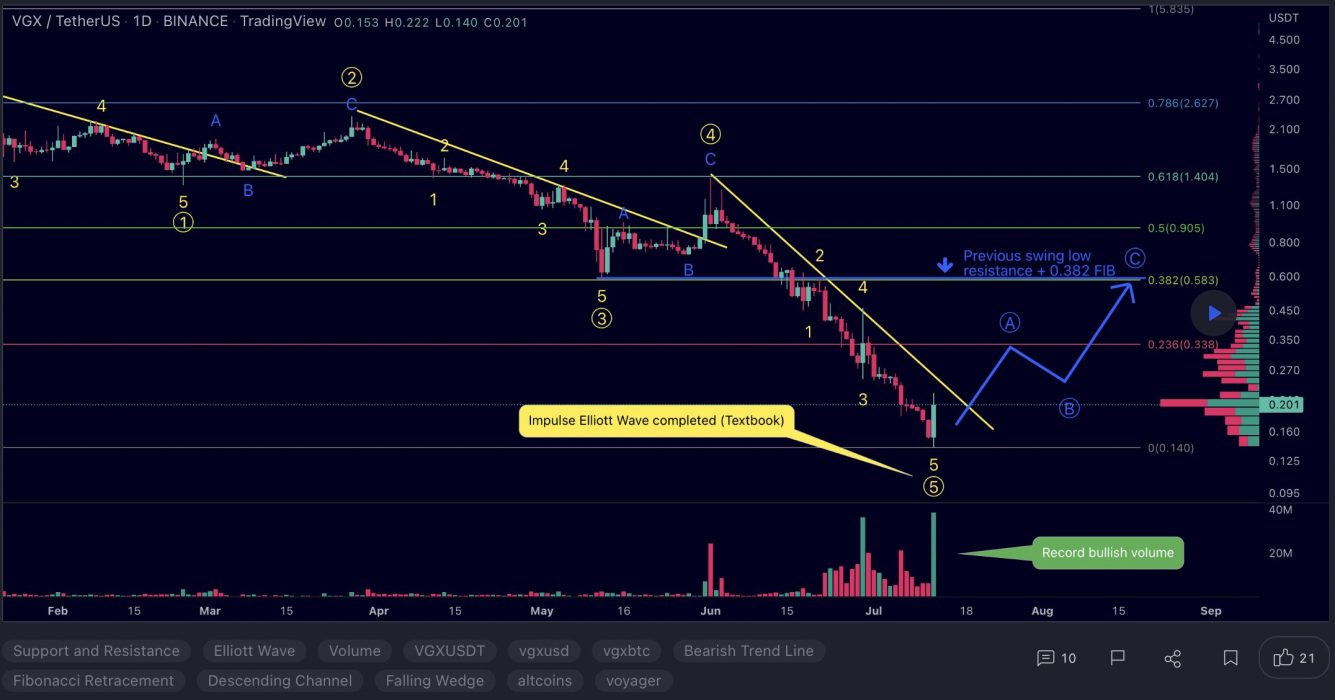
At the time of writing, VGX is ranked the 116th cryptocurrency globally and the current price is US$0.8333. Let’s take a look at the chart below for price analysis:

Source: TradingView

VGX set a high near $2.30 in Q1 before retracing nearly 83% to find a low near $0.4584. The price consolidated around this level before the strong bullish impulse during the past several weeks.

Probable resistance near $0.9771 is slowing the bullish advance down. However, another leg might target the last swing high at $1.24 and relatively equal highs at $1.36. Resistance near $1.55 could cap the move before the second swing high. Beyond these levels, little stands in the bulls’ way before reaching the swing high near $1.84.

A retracement before a move higher might find support in the daily gap near $0.7064, just above the monthly open. Relatively equal lows near $0.6295 could also provide support. A run-on stop at $0.5709 and $0.5084 might find support in the gap beginning near $0.4859 or a high-timeframe level near $0.4215.

3. Aave (AAVE)

AAVE is a decentralised finance protocol that allows people to lend and borrow crypto. Lenders earn interest by depositing digital assets into specially created liquidity pools. Borrowers can then use their crypto as collateral to take out a flash loan using this liquidity. AAVE provides holders with discounted fees on the platform, and it also serves as a governance token, giving owners a say in the future development of the protocol.

AAVE Price Analysis

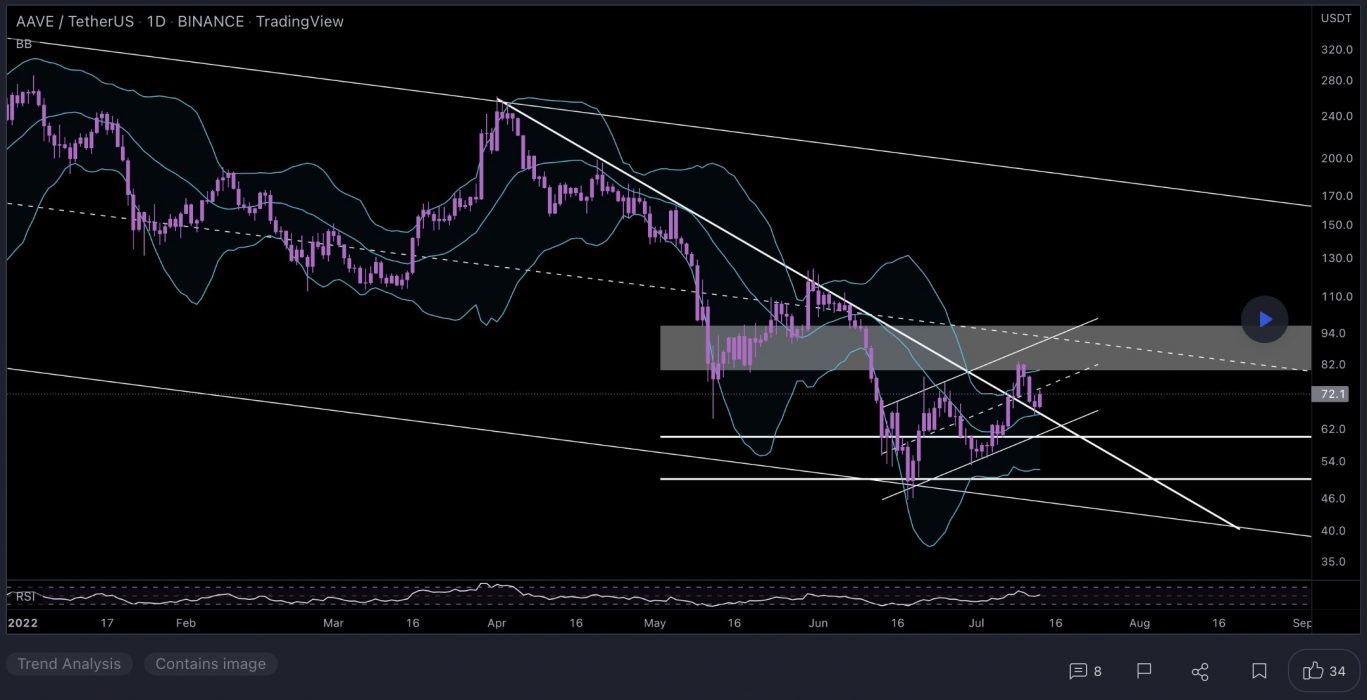
At the time of writing, AAVE is ranked the 44th cryptocurrency globally and the current price is US$76.70. Let’s take a look at the chart below for price analysis:

Source: TradingView

AAVE‘s strong downtrend that began during early April has retraced most of its Q2 move, recently sweeping lows near $66.25.

A sweep of the relatively equal lows near $62.87 into possible support around $58.12, combined with bullish market conditions, could be the catalyst that begins to form a bottom. If this level fails, bulls might buy the monthly gap’s low near $50.45.

The swing high near $82.10 may form resistance to any sudden pumps as holders unload some of their position. A more substantial move might sweep relatively swing highs into probable resistance near $96.82, potentially reaching up to the new monthly highs near $110 and $123.

Learn How to Trade Live!

Join Dave and The Crypto Den Crew and they’ll show you live on a webinar how to take your crypto trading to the next level.

Where to Buy or Trade Altcoins?

These coins have high liquidity on Binance Exchange, so that could help with trading on AUD/USDT/BTC pairs. And if you’re looking at buying and HODLing cryptos, then Swyftx Exchange is an easy-to-use popular choice in Australia.

Categories
Burger Swap Crypto News Market Analysis Mina Trading VeChain

Top 3 Coins to Watch Today: BURGER, VET, MINA – July 13 Trading Analysis

Let’s take a closer look at today’s altcoins showing breakout signals. We’ll explain what the coin is, then dive into the trading charts and provide some analysis to help you decide.

1. Burger Swap (BURGER)

BurgerSwap BURGER is one of the first democratised, decentralised automated market makers (AMMs) on the Binance Smart Chain (BSC). It was built without the control of any centralised authorities through the use of smart contracts. BURGER token staking allows any user to create proposals and influence the adjustment of transaction fees, block rewards, and other system parameters of the Burger Swap exchange via voting.

BURGER Price Analysis

At the time of writing, BURGER is ranked the 299th cryptocurrency globally and the current price is US$3.23. Let’s take a look at the chart below for price analysis:

Source: TradingView

After an 85% retracement from its May highs, BURGER found a temporary low near $0.8244. A recent move above $3.10 could be the first sign of a bullish shift but could also be a stop run before the next drop lower. 

If the market adopts a more bullish tone, the price could run through the most recent swing high. If this bounce occurs, it would likely find some resistance near $4.23, possibly reaching up to $5.74.

However, a move below the closest support near $2.85 makes stop runs on the swing lows near $2.55 and $2.34 likely. A confluence of several levels near $2.10 could provide a temporary bounce. Still, a sustained bearish market will likely target $3.42 and even $3.50.

2. VeChain (VET)

VeChain VET is a blockchain-powered supply chain platform. VeChain aims to use distributed governance and Internet of Things (IoT) technology to create an ecosystem that solves some of the major problems with supply chain management. The platform uses two in-house tokens, VET and VTHO, to manage and create value based on its VeChainThor public blockchain. The idea is to boost the efficiency, traceability and transparency of supply chains while reducing costs and placing more control in the hands of individual users.

VET Price Analysis

At the time of writing, VET is ranked the 31st cryptocurrency globally and the current price is US$0.02167. Let’s take a look at the chart below for price analysis:

Source: TradingView

VET‘s 50% move during late Q1 ran into resistance near $0.08240, at the 35% extension of the Q1 swing.

An old high and the 18 EMA have provided support near $0.02083 and may give support again on a retest. This area also has confluence with the 55% and 68.9% retracements of November’s swing.

Just below, near $0.01843, the 50.8% retracement of the current Q1 swing might also mark an area of support. 

If the market turns bearish, $0.01632 is unlikely to be revisited but could see interest from bulls during any deeper retracement.

An area near $0.02848, at the 50% extension of the last week swing, could see some profit-taking if bulls break the current resistance near $0.03378. Above, old consolidations near $0.03925 and $0.04272 may also provide some resistance before another round of price discovery.

3. Mina (MINA)

MINA Protocol is a minimal “succinct blockchain” built to curtail computational requirements in order to run DApps more efficiently. Mina has been described as the world’s lightest blockchain since its size is designed to remain constant despite growth in usage. Furthermore, it remains balanced in terms of security and decentralisation. The Mina network has a size of only 22 KB, minuscule when compared to Bitcoin’s 300 GB blockchain.

MINA Price Analysis

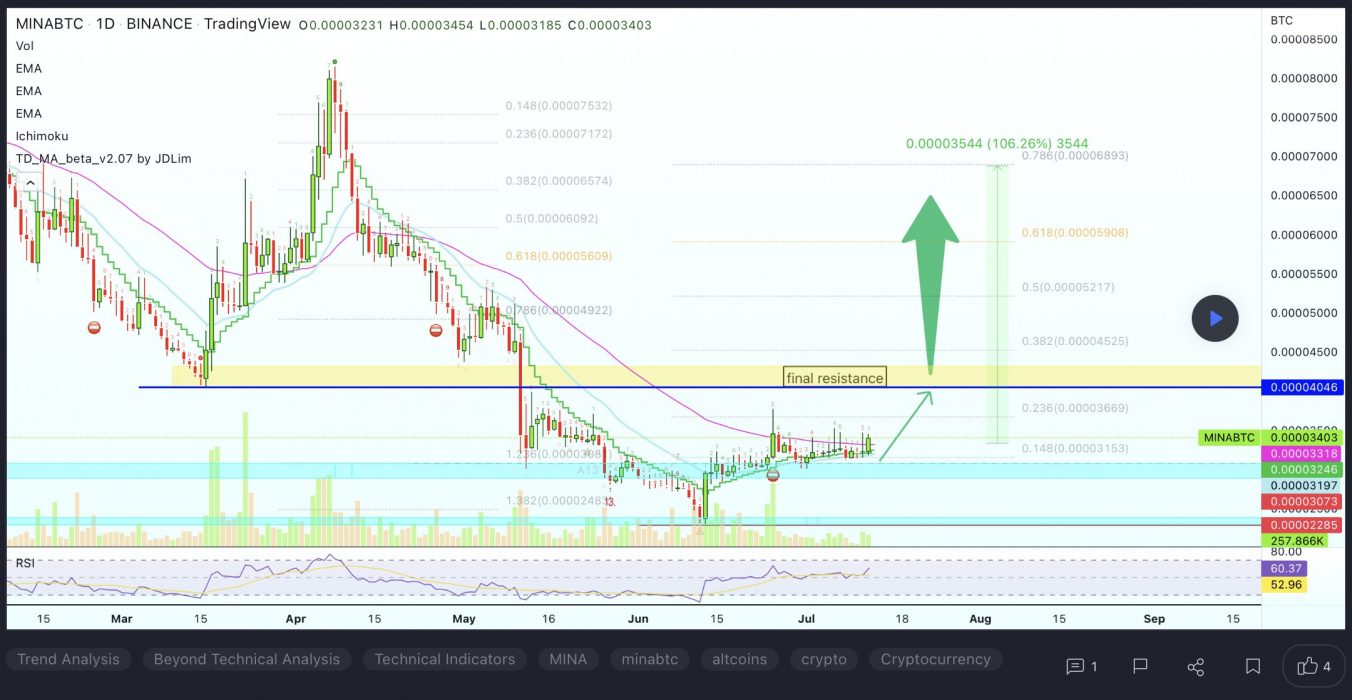
At the time of writing, MINA is ranked the 80th cryptocurrency globally and the current price is US$0.6470. Let’s take a look at the chart below for price analysis:

Source: TradingView

MINA‘s 85% pump during Q1 ran into resistance near $3.26. Since then, the price has been consolidating between $0.5248 and $1.12.

Just below the monthly open, $0.6139 is the first level likely to provide substantial support. If the price breaks down through this level, overlapping levels near $0.5972 may cap a run on the lows near $0.5746 and $0.5308.

The higher-timeframe analysis points to the area near $0.7389 as the next substantial resistance. Significant selling has been occurring here on the daily chart. If this level breaks, the swing highs near $0.7928 and $0.8750 may be the next targets.

Learn How to Trade Live!

Join Dave and The Crypto Den Crew and they’ll show you live on a webinar how to take your crypto trading to the next level.

Where to Buy or Trade Altcoins?

These coins have high liquidity on Binance Exchange, so that could help with trading on AUD/USDT/BTC pairs. And if you’re looking at buying and HODLing cryptos, then Swyftx Exchange is an easy-to-use popular choice in Australia.
Categories
CEEK VR Crypto News Filecoin GMT Token Market Analysis Trading

Top 3 Coins to Watch Today: CEEK, FIL, GMT – July 12 Trading Analysis

Let’s take a closer look at today’s altcoins showing breakout signals. We’ll explain what the coin is, then dive into the trading charts and provide some analysis to help you decide.

CEEK is an award-winning developer of premium social virtual and augmented reality experiences. Its mission is to empower creators with the tools needed to generate new revenue streams from their artistry digitally. Ceek is helping music artists, athletes, event creators and makers create content direct to fan experiences that drive long-term sustainable engagement within existing and emerging virtual worlds.

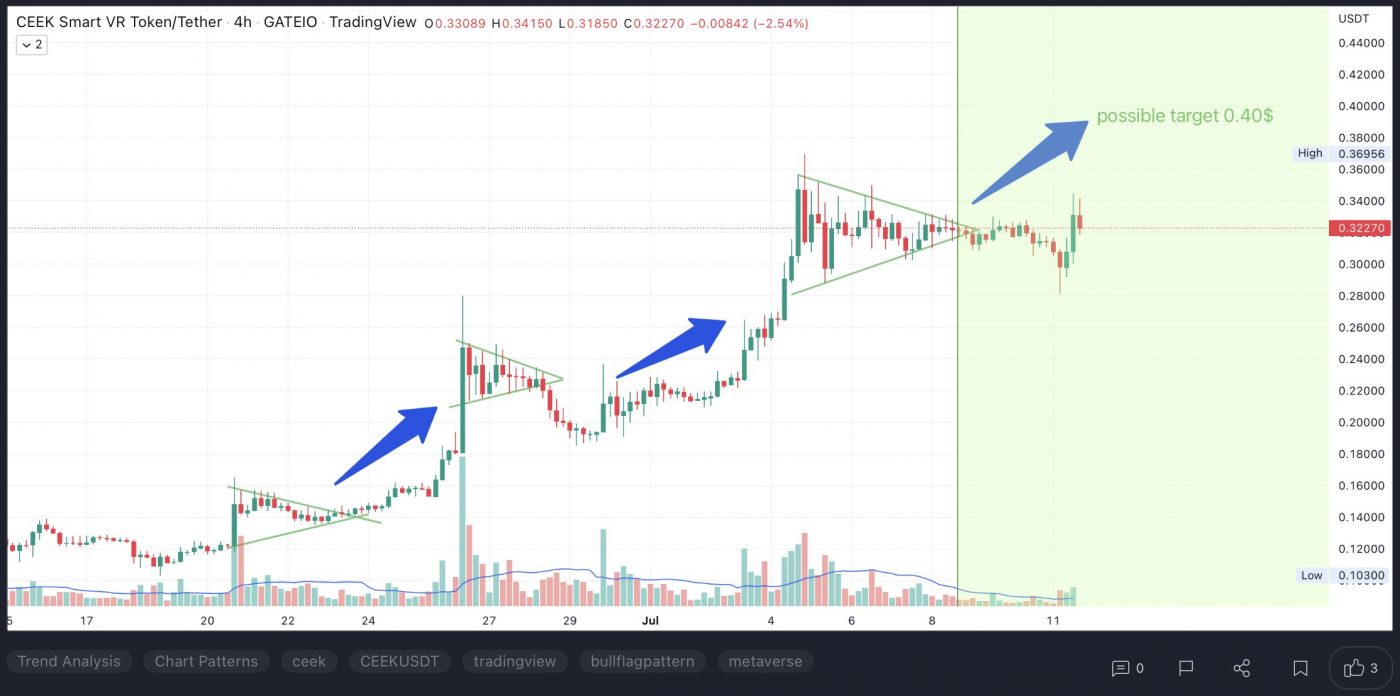
At the time of writing, CEEK is ranked the 106th cryptocurrency globally and the current price is US$0.3247. Let’s take a look at the chart below for price analysis:

Source: TradingView

CEEK has bounced 320% from its early June low and is now filling in an area of inefficient trading formed from April to June.

The price is testing possible support near $0.2889. This area shows inefficient trading on the daily chart. It also overlaps with old swing lows, an old swing high, and the low end of inefficient trading on the weekly chart.

If this level fails to hold, the price might resume its bearish trend. The consolidation near the June monthly open could provide a speedbump for bears. This zone is between the recent rally’s 61.8% and 78.6% retracements. It also shows inefficient trading on the weekly and daily charts. 

For now, an area near $0.3376 offers the closest resistance. This level overlaps with the recent swing high. It’s also near the top of an inefficiently traded area on the weekly chart.

If this level breaks, bulls may be targeting $0.3850 next. Here, the price broke down in late April from its consolidation. As it broke down, it formed an area of inefficient trading on the weekly and daily charts.

If the rally continues, $0.4445 might offer the next resistance. The 9, 18 and 40 EMAs flipped bearish near this level. It’s also near the midpoint of April’s consolidation range. This midpoint is near the 61.8% retracement of the late April and early May drop.

2. Filecoin (FIL)

Filecoin FIL is a decentralised storage system that aims to “store humanity’s most important information”. The project was first described back in 2014 as an incentive layer for the Interplanetary File System (IPFS), a peer-to-peer storage network. Filecoin is an open protocol backed by a blockchain that records commitments made by the network’s participants, with transactions using FIL, the blockchain’s native currency. The blockchain is based on both proof-of-replication and proof-of-space-time.

FIL Price Analysis

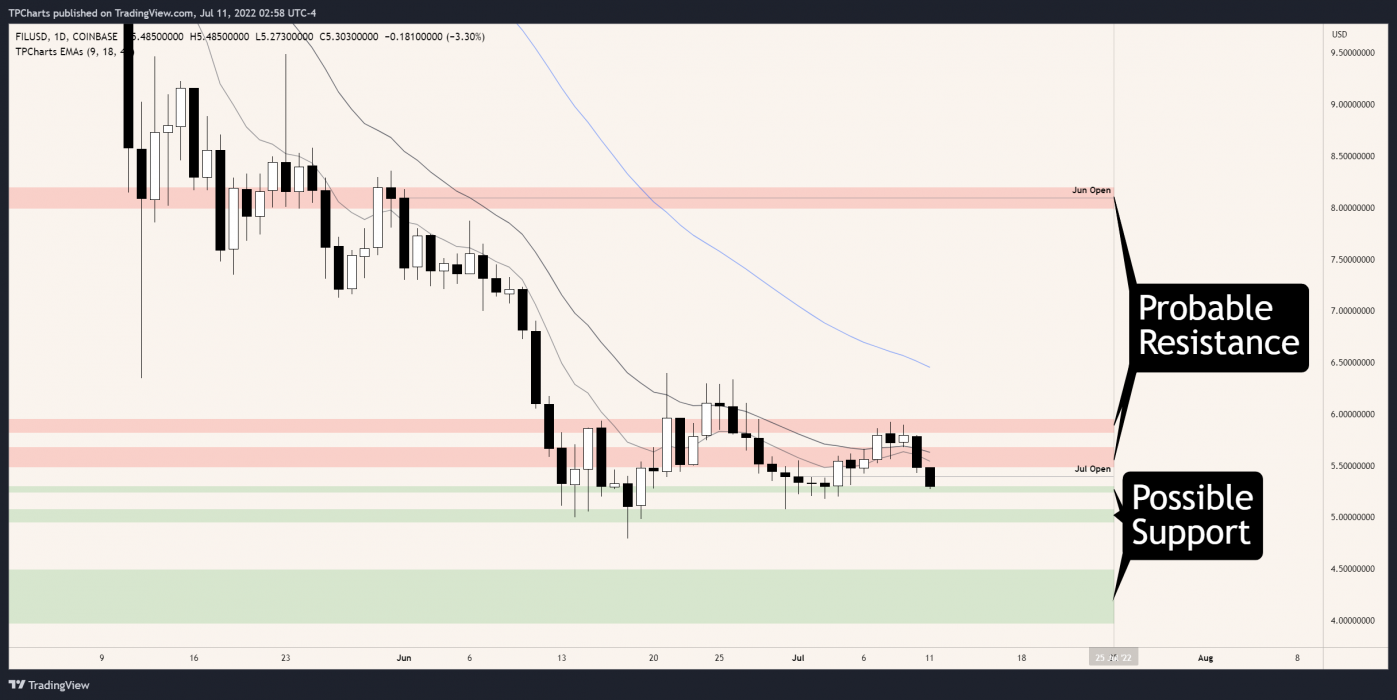
At the time of writing, FIL is ranked the 39th cryptocurrency globally and the current price is US$5.37. Let’s take a look at the chart below for price analysis:

Source: TradingView

FIL has dropped 83% from its April high. It found support near $5.080 before starting a consolidation range.

This level, near the lows, could continue to provide support. A year-long consolidation from 2019 to 2020 pivoted around this level many times. It’s also near the middle of the last down candle before 2020’s massive rally. A retest of this level would run bulls’ stops under swing lows formed in late June and early July.

The price is testing a closer area of possible support near $5.3010. Bulls rejected bears many times in early July at this level. It’s also in the upper part of June 18’s swing low candle.

The closest resistance is likely near $5.485. This area, up to $5.680, shows inefficient trading on the daily chart. It also contains the 9 and 18 EMAs.

If the price breaks through this level, it may aim for bears’ stops above $5.9250. Even if it doesn’t reach these stops, the area between $5.8210 and $5.9525 could provide a bearish setup. Here, bears rejected bulls near the bottom of an area of inefficient trading on the weekly chart.

If the market turns more bullish, a rally beginning in this range may be aiming for the June monthly open, near $7.990. This level is near the bottom of an area of inefficient trading on the monthly chart. The daily chart also shows that bears rejected bulls here before June’s drop.

3. STEPN (GMT)

Stepn GMT is a self-styled “Web3 lifestyle app” with GameFi elements on the Solana blockchain. It combines aspects of a play-to-earn game with a fitness app to create a new category called “move-to-earn”. Users buy NFT sneakers, which they can use to earn in-game currency while walking, running, or jogging. STEPN aims to revolutionise the market of fitness applications by incentivising millions of users to follow a healthier lifestyle. The app solves several problems like “proof of movement” – proving that users really exercised – and a functioning GPS system. Moreover, STEPN incentivises users financially and plans to introduce social rewards elements and successfully contribute to carbon neutrality. 

GMT Price Analysis

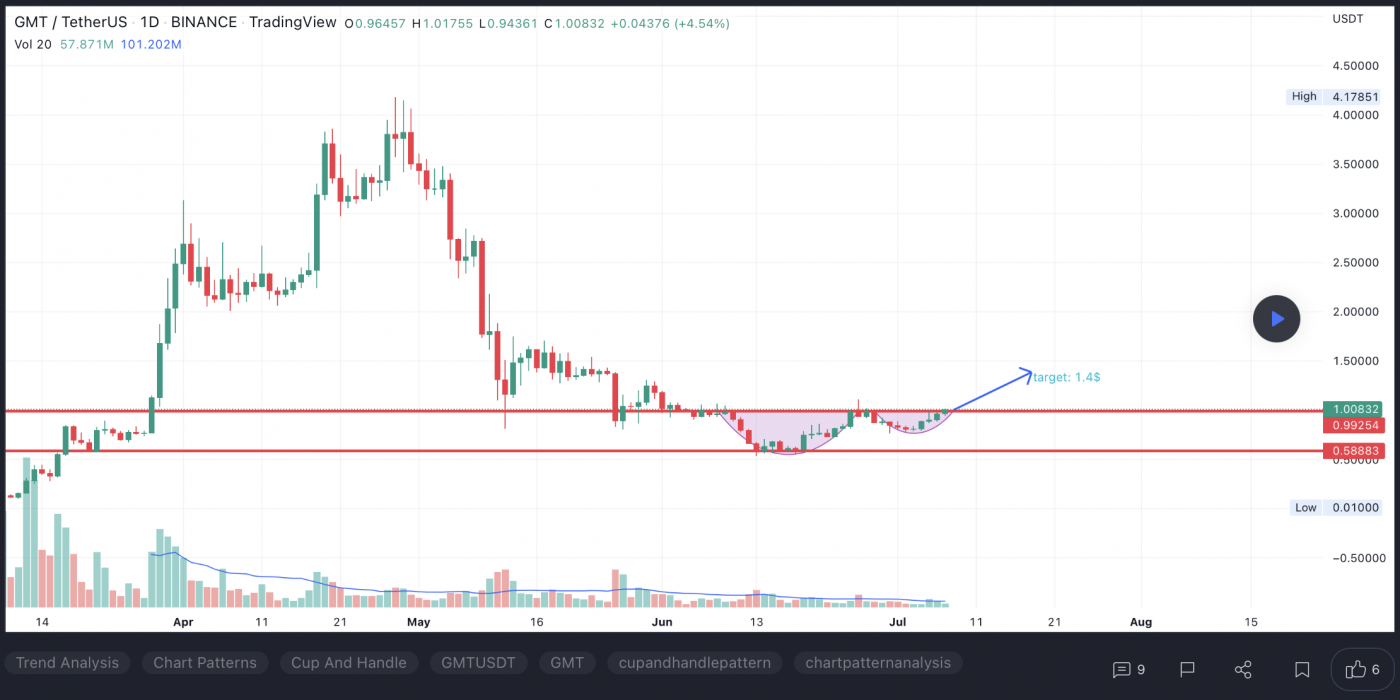
At the time of writing, GMT is ranked the 69th cryptocurrency globally and the current price is US$0.8755. Let’s take a look at the chart below for price analysis:

Source: TradingView

GMT has retraced much of 2022’s parabolic run. It dropped 87% from its April high before rallying in mid-June.

Bulls are testing $0.8718 to see if it can hold as support. This area shows inefficient trading on the daily chart. It’s also near the top of early July’s accumulation before the most recent rally.

Even if the price eventually moves higher, it may first drop under the July monthly open to an area near $0.8099. Bulls rejected bears in early July at this level. It also overlaps with an area of accumulation in late June.

If the market sees it as bearish, a retest of $0.9514 could prove this level as resistance. Bears already rejected bulls once here. This level also contains the 40 EMA and is inefficiently traded on the daily chart.

A break through this resistance could retest an old area of inefficient trading, near $1.0832. The target would likely be bulls’ stops above highs at $1.1130 and $1.0557. 

If the price reaches this level, it may go one step further and retest the June monthly open near $1.1651. This level is at the low end of inefficient trading on the monthly chart. It’s also the origin of early June’s sudden breakdown.

Yet, while the market remains bearish, traders may want to focus on bearish scenarios. Rejection from any resistance might reach near $0.6813. This area shows inefficient trading on the daily chart. Bulls also rejected bears here on the weekly chart before starting June’s rally.

Below this level, $0.5346 may be the next target if the bearish trend continues. This area shows inefficient trading on the daily and weekly charts. It’s also just below relative equal lows, formed in mid-June. Bulls’ stops under these lows offer attractive targets to bears.

Learn How to Trade Live!

Join Dave and The Crypto Den Crew and they’ll show you live on a webinar how to take your crypto trading to the next level.

Where to Buy or Trade Altcoins?

These coins have high liquidity on Binance Exchange, so that could help with trading on AUD/USDT/BTC pairs. And if you’re looking at buying and HODLing cryptos, then Swyftx Exchange is an easy-to-use popular choice in Australia.

Categories
ChainLink Crypto News ICP Market Analysis NEAR Protocol Trading

Top 3 Coins to Watch Today: NEAR, LINK, ICP – July 11 Trading Analysis

Let’s take a closer look at today’s altcoins showing breakout signals. We’ll explain what the coin is, then dive into the trading charts and provide some analysis to help you decide.

1. Near Protocol (NEAR)

NEAR Protocol is a decentralised application platform designed to make apps usable on the web. The network runs on a Proof-of-Stake (PoS) consensus mechanism called Nightshade, which aims to offer scalability and stable fees. NEAR uses human-readable account names, unlike the cryptographic wallet addresses common to Ethereum. NEAR also introduces unique solutions to scaling problems and has its own consensus mechanism, called “Doomslug”.

NEAR Price Analysis

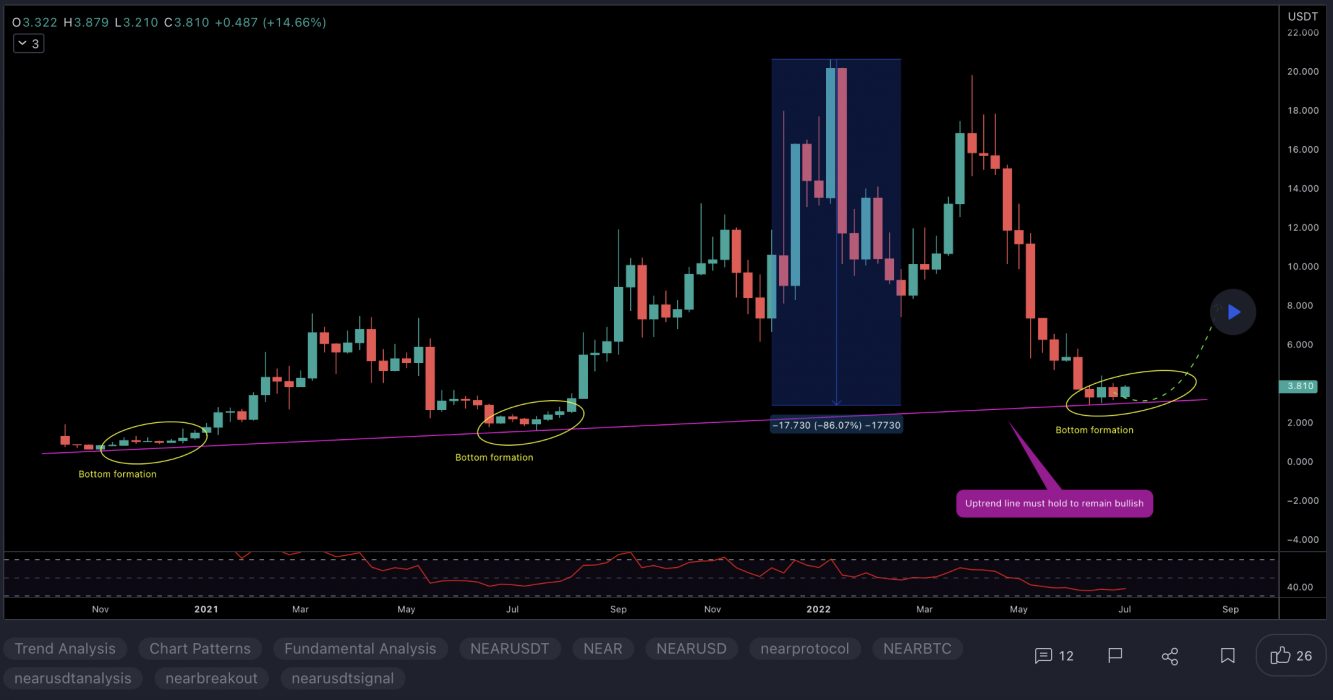
At the time of writing, NEAR is ranked the 25th cryptocurrency globally and the current price is US$3.57. Let’s take a look at the chart below for price analysis:

Source: TradingView

During Q2, NEAR retraced 70% from its highs to support at the retracement of around $3.09.

The price shifted market structure to run to the consolidation lows near $3.40, just under the monthly open. A continued bearish trend in the market may create support just below, between $3.00 and $2.76.  

On the other hand, if the current resistance breaks, the price may find resistance near $4.23 and $5.14, whereas mid-Q2 buyers might still be trapped in longs.

The Chainlink Network LINK is driven by a large open-source community of data providers, node operators, smart contract developers, researchers, security auditors, and more. The company focuses on ensuring that decentralised participation is guaranteed for all node operators and users looking to contribute to the network. Chainlink allows blockchains to securely interact with external data feeds, events, and payment methods, providing the critical off-chain information needed by complex smart contracts to become the dominant form of digital agreement.

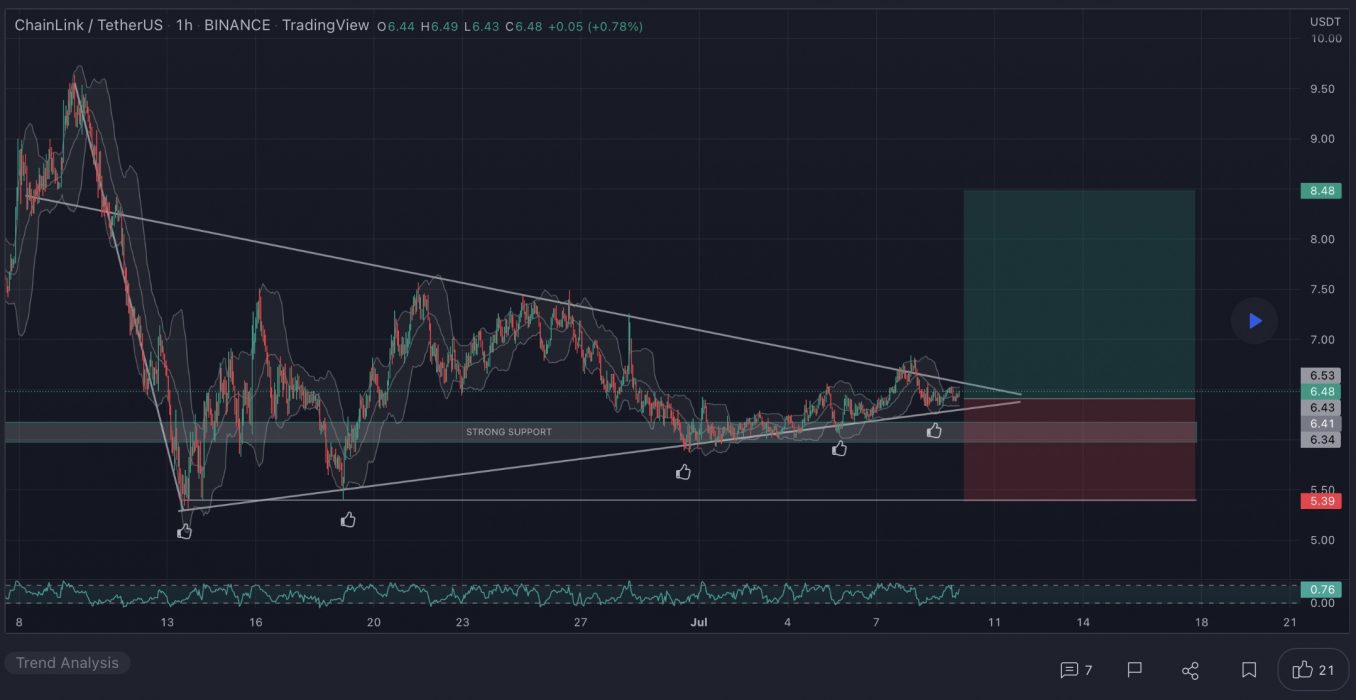
At the time of writing, LINK is ranked the 23rd cryptocurrency globally and the current price is US$6.20. Let’s take a look at the chart below for price analysis:

Source: TradingView

LINK‘s early Q2 trend retraced near $5.80 into the consolidation that began the impulse before bouncing to $8.92. This consolidation could provide support again, although bears would first have to push the price through possible support near $6.10.

The market’s structure may be shifting bearish, with $7.40 likely to provide some resistance if this is the case. A sustained bearish move could reach the swing low near $6.00 before finding support near $5.87.

However, the bullish higher-timeframe trend may prevail, with relatively equal highs near $7.27 potentially giving an attractive target to lure the price over the monthly open. If so, the price could reach for the midpoint of the Q1 wick near $9.18.

3. Internet Computer (ICP)

The Internet Computer ICP is the world’s first blockchain that runs at web speed with unbounded capacity. It also represents the third major blockchain innovation, alongside Bitcoin and Ethereum. The Internet Computer scales smart contract computation and data, runs them at web speed, processes and stores data efficiently, and provides powerful software frameworks to developers. By making this possible, it enables the complete re-imagination of software, providing a revolutionary new way to build tokenised internet services, pan-industry platforms, decentralised financial systems, and even traditional enterprise systems and websites.

ICP Price Analysis

At the time of writing, ICP is ranked the 34th cryptocurrency globally and the current price is US$6.51. Let’s take a look at the chart below for price analysis:

Source: TradingView

ICP has dropped 53% from its most recent Q2 high as it continues its nine-month downtrend. The edge of the recent swing’s lower candle bodies could provide the closest support, near $5.12. This level overlaps with the 100% extension of June’s opening rally.

Currently, the price is testing possible resistance near $7.00. This level has confluence with the 9 EMA. It is unclear if it will hold as resistance, but it’s reasonable to anticipate a run above bears’ stops at $7.30.

If the price breaks through this resistance, it may find its next resistance near $7.69. This level is near the midpoint of May 12’s swing low and the midpoint of an inefficiently traded area on the weekly chart.

A rally this high may reach slightly higher, near $8.32. This area formed the base of the June opening rally, shows inefficient trading on the daily chart, and is at the low end of May’s accumulation range.

Below, there is no historical price action to suggest possible support. The next downside targets may be near $4.70 and $3.95. These approximate levels are near the 150% and 200% extensions of June’s opening rally.

Learn How to Trade Live!

Join Dave and The Crypto Den Crew and they’ll show you live on a webinar how to take your crypto trading to the next level.

Where to Buy or Trade Altcoins?

These coins have high liquidity on Binance Exchange, so that could help with trading on AUD/USDT/BTC pairs. And if you’re looking at buying and HODLing cryptos, then Swyftx Exchange is an easy-to-use popular choice in Australia.

Categories
Avalanche Crypto News Decentraland Market Analysis Polygon Trading

Top 3 Coins to Watch Today: MANA, AVAX, MATIC – July 8 Trading Analysis

Let’s take a closer look at today’s altcoins showing breakout signals. We’ll explain what the coin is, then dive into the trading charts and provide some analysis to help you decide.

1. Decentraland (MANA)

Decentraland MANA defines itself as a virtual reality platform powered by the Ethereum blockchain that allows users to create, experience, and monetise content and applications. In this virtual world, users purchase plots of land that they can later navigate, build on and monetise. Decentraland uses two tokens: MANA and LAND. MANA is an ERC-20 token that must be burned to acquire non-fungible ERC-721 LAND tokens. MANA tokens can also be used to pay for a range of avatars, wearables, names and more on the Decentraland marketplace.

MANA Price Analysis

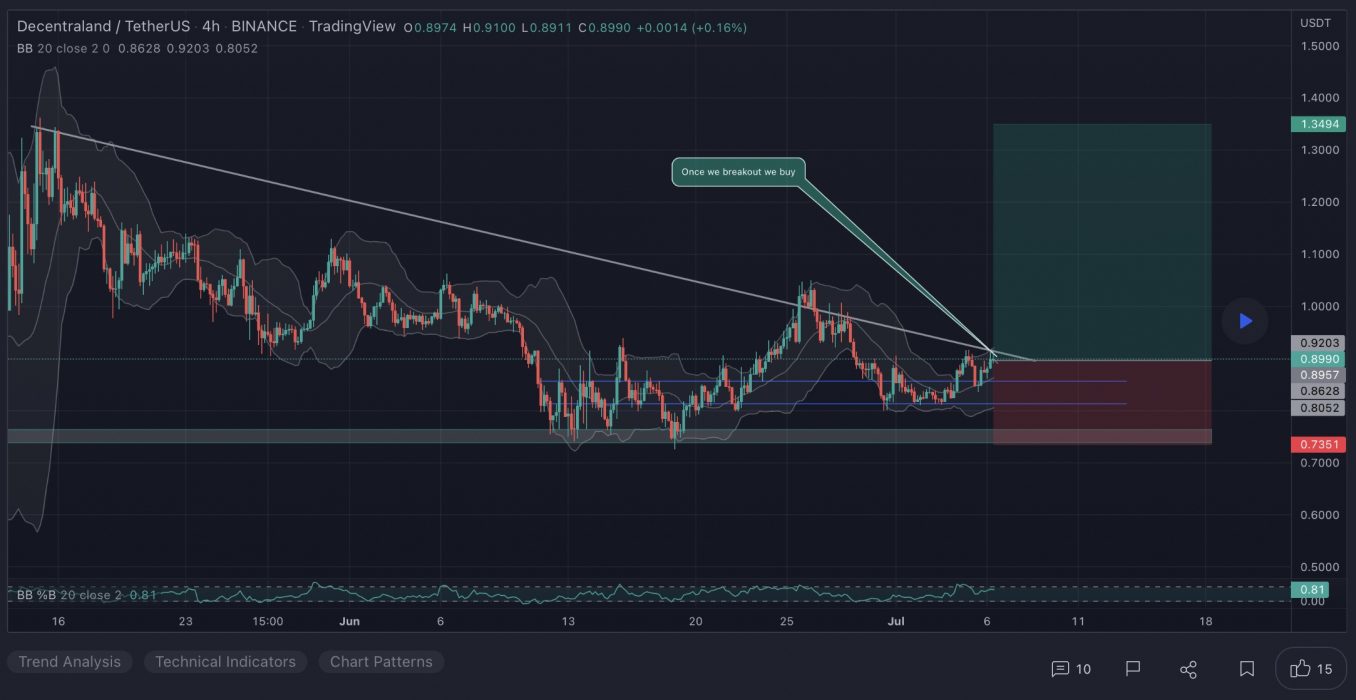
At the time of writing, MANA is ranked the 32nd cryptocurrency globally and the current price is US$0.9282. Let’s take a look at the chart below for price analysis:

Source: TradingView

Like many other altcoins, MANA set a high during Q1 and Q2 before retracing 70% to the low at $0.7330 last month.

The price broke through resistance near $0.9134, which may mark an area of possible support on a retracement. If this support fails, bulls might also step in near $0.8713. However, a drop this far increases the chances of a stop run to $0.8105 and possibly into support near $0.7825. For now, continuing recovery market conditions could help $0.7510 become support.

The swing high around $1.10 gives bulls a reasonable first target, with $1.18 also likely to draw the price upward. Higher-timeframe resistance beginning near $1.29 or $1.37 could cap the move or trigger consolidations. If bullish market conditions continue, bulls might test probable resistance near new monthly highs around $1.45.

2. Avalanche (AVAX)

Avalanche AVAX is the fastest smart contracts platform in the blockchain industry, as measured by time-to-finality, and has the most validators securing its activity of any proof-of-stake protocol. Avalanche is also low-cost, and green. Any smart contract-enabled application can outperform its competition on Avalanche. AVAX is the native token of Avalanche. It is a hard-capped, scarce asset that is used to pay for fees, secure the platform through staking, and provide a basic unit of account between the multiple subnets created on Avalanche.

AVAX Price Analysis

At the time of writing, AVAX is ranked the 15th cryptocurrency globally and the current price is US$20.16. Let’s take a look at the chart below for price analysis:

Source: TradingView

AVAX‘s gains in Q2 ended with an almost 75% retracement as the rest of the altcoin market dropped from early last month. Bulls stepped in near the 62.8% retracement of Q2’s move, creating a consolidation that ended with the bullish impulse to resistance near $30.35.

With the 9, 18 and 40 EMAs stacked bullish and a bullish higher-timeframe trend, it’s reasonable to anticipate retracement to possible support before further bullish expansion. 

Near the 40 EMA, a broad zone from $18.15 to $17.45 could see interest from bulls before further expansion. Bears might capitalise on any sharp moves down in Bitcoin, aiming for possible support near the 75% retracement, at $16.30, and potentially lower to a higher-timeframe support zone between $15.72 and $14.80.

If the higher-timeframe recovery trend resumes and the current resistance near $24.35 breaks, the wicks near $28.84 and the new monthly highs may see profit-taking.

3. Polygon (MATIC)

Polygon MATIC is the first well-structured, easy-to-use platform for Ethereum scaling and infrastructure development. Its core component is Polygon SDK, a modular, flexible framework that supports building multiple types of applications. The MATIC token will continue to exist and will play an increasingly important role in securing the system and enabling governance.

MATIC Price Analysis

At the time of writing, MATIC is ranked the 18th cryptocurrency globally and the current price is US$0.5669. Let’s take a look at the chart below for price analysis:

Source: TradingView

Since its Q1 highs, MATIC has been in a steady bearish trend, retracing nearly 75%. The price found support near $0.3820, at the 65.8% retracement level.

Last week’s sharp impulse up might have marked the start of a new trend. If so, higher timeframes suggest that $0.5139, near the 45.8% retracement and the 9, 18 and 40 EMAs, may see interest from bulls. The price could reach lower, near $0.4720, and still find support.

Currently, the price is contesting a region between $0.4539 and $0.4325. Closes over this level could confirm it as new support, leading to a move higher.

However, bulls are contending with probable resistance near $0.6931, while $0.7530 is also likely to be sensitive with the nearest support and resistance this close together.

Learn How to Trade Live!

Join Dave and The Crypto Den Crew and they’ll show you live on a webinar how to take your crypto trading to the next level.

Where to Buy or Trade Altcoins?

These coins have high liquidity on Binance Exchange, so that could help with trading on AUD/USDT/BTC pairs. And if you’re looking at buying and HODLing cryptos, then Swyftx Exchange is an easy-to-use popular choice in Australia.
Categories
Crypto News Enjin Coin Hedera Market Analysis Trading

Top 3 Coins to Watch Today: HBAR, CRO, ENJ – July 7 Trading Analysis

Let’s take a closer look at today’s altcoins showing breakout signals. We’ll explain what the coin is, then dive into the trading charts and provide some analysis to help you decide.

1. Hedera (HBAR)

Hedera Hashgraph HBAR is a public network that allows individuals and businesses to create powerful decentralised applications (DApps). It is designed to be a fairer, more efficient system that eliminates some of the limitations older blockchain-based platforms face, such as slow performance and instability. The HBAR token has a dual role within the Hedera public network.

HBAR Price Analysis

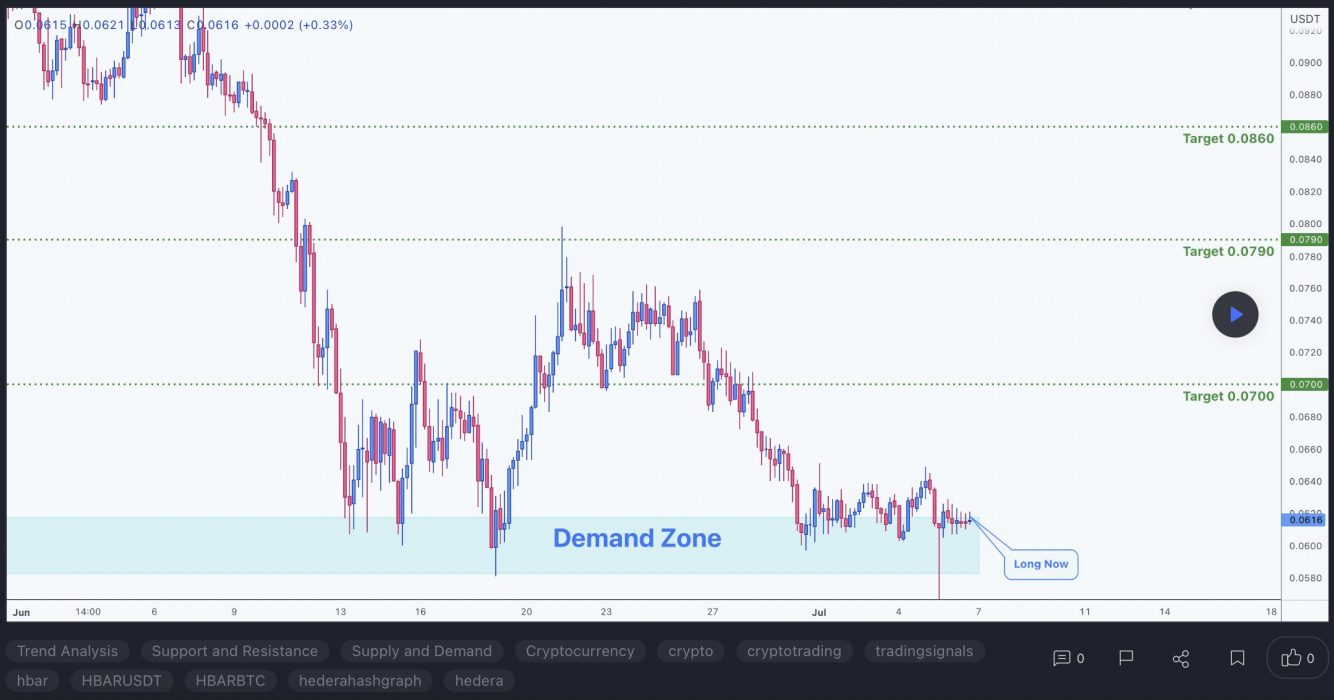
At the time of writing, HBAR is ranked the 38th cryptocurrency globally and the current price is US$0.06191. Let’s take a look at the chart below for price analysis:

Source: TradingView

HBAR‘s 55% Q1 run retraced almost to its origin, narrowly missing probable support near $0.6295 before bears swatted down the bounce near resistance around $0.07589.

With the daily gap between $0.05912 and $0.05750 almost filled in a single wick, the price may not need to revisit areas below this level. However, the safer entry is still in probable support between $0.05523 and $0.05100, which would also sweep the lows of last week’s bounce.

The relatively equal highs near $0.06954 provide a likely first target on lower timeframes. However, the resistance beginning at $0.07315 may initially suppress a further move up.

A clean break through this resistance will need to contend with the next resistance near $0.07692, under the last swing high. This swing high at $0.07950 gives a reasonable take-profit area before a possible move to the 1.0 extension near $0.08256.

2. Crypto Coin (CRO)

Crypto.com coin CRO is the native cryptocurrency token of Crypto.com Chain, a decentralised, open-source blockchain developed by the Crypto.com payment, trading and financial services company. Crypto.com Chain is one of the products in Crypto.com’s lineup of solutions designed to accelerate the global adoption of cryptocurrencies as a means of increasing personal control over money, safeguarding user data, and protecting users’ identities. The CRO blockchain serves primarily as a vehicle that powers the Crypto.com Pay mobile payments app.

CRO Price Analysis

At the time of writing, CRO is ranked the 22nd cryptocurrency globally and the current price is US$0.1174. Let’s take a look at the chart below for price analysis:

Source: TradingView

CRO has been trading sideways after Q1, reaching nearly 35% percent within a few weeks as it blasted through its old monthly highs.

This fast move left little compelling higher-timeframe support near the current price. A level near $0.1022, which has confluence with the 8 EMA and 127% extension of H2 2021’s swing, could provide support.

Further below, near $0.09231, 2021’s previous monthly high could also provide some support on a retest. The last consolidation before the breakout, near December’s open, might give the most substantial support. However, this would require significant retracement from the current price point.

While next targets are impossible to predict, extensions from Q1 2022’s move suggest that the 40% extension, near $0.1475, could provide some resistance. Above this level, the 48% extension near $0.1648 could also trigger bulls to take profits.

3. Enjin Coin (ENJ)

Enjin Coin ENJ is a project of Enjin, a company that provides an ecosystem of interconnected, blockchain-based gaming products. Enjin’s flagship offering is the Enjin Network, a social gaming platform through which users can create websites and clans, chat, and host virtual item stores. Enjin Coin is a digital store of value used to back the value of blockchain assets such as non-fungible tokens (NFTs).

ENJ Price Analysis

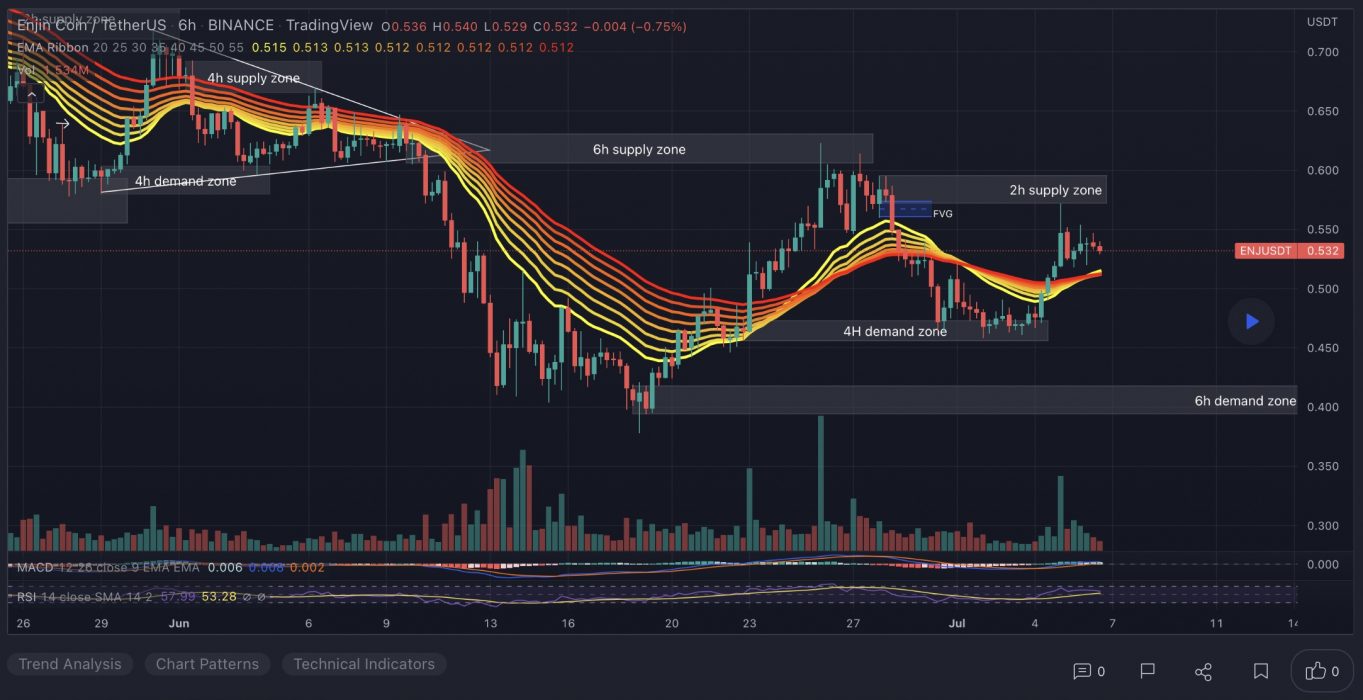
At the time of writing, ENJ is ranked the 75th cryptocurrency globally and the current price is US$0.5379. Let’s take a look at the chart below for price analysis:

Source: TradingView

ENJ spent Q2 ranging between 30% over and 23% below. The price is currently consolidating between adjacent resistance and support at $0.6045 with no clear higher-timeframe trend. A strong move over the monthly open could signal a run to resistance beginning near $0.6495. 

This move would likely target the swing high at $0.6912 and relatively equal highs near $0.7249. A sustained bullish trend could reach up to the monthly high near $0.7532.

Bulls may see a sweep of the relatively equal lows near $0.5142 as a chance to buy at a discount. If this level fails to hold, the next significant area for the price to find buyers is likely near the consolidation around $0.4835 and $0.4130.

Learn How to Trade Live!

Join Dave and The Crypto Den Crew and they’ll show you live on a webinar how to take your crypto trading to the next level.

Where to Buy or Trade Altcoins?

These coins have high liquidity on Binance Exchange, so that could help with trading on AUD/USDT/BTC pairs. And if you’re looking at buying and HODLing cryptos, then Swyftx Exchange is an easy-to-use popular choice in Australia.

Categories
Crypto News Market Analysis Ripple The Sandbox Trading TRON

Top 3 Coins to Watch Today: XRP, SAND, TRX – July 6 Trading Analysis

Let’s take a closer look at today’s altcoins showing breakout signals. We’ll explain what the coin is, then dive into the trading charts and provide some analysis to help you decide.

1. Ripple (XRP)

Ripple XRP is the currency that runs on a digital payment platform called RippleNet, on top of a distributed ledger database called XRP Ledger. While RippleNet is run by a company called Ripple, the XRP Ledger is open-source and not based on a blockchain, but rather the aforementioned distributed ledger database.

XRP Price Analysis

At the time of writing, XRP is ranked the 7th cryptocurrency globally and the current price is US$0.3249. Let’s take a look at the chart below for price analysis:

Source: TradingView

XRP printed some gains during Q1 and Q2 after moving sideways for the past few weeks. The price is in a downtrend, with the 9, 18 and 40 EMAs providing resistance on each attempt to rally.

However, bulls are showing some interest at the 80% retracement, near $0.3210. If this level breaks, a move into possible support – just below the lows near $0.2932 – seems likely.

If the price does rally through the swing high at $0.3755 – perhaps triggered by a sudden surge in Bitcoin – bulls might find some resistance at the 61.8% retracement level near $0.4050. 

Overlapping swing highs and lows near $0.4426 may provide the next target, where bears immediately forced the price down in late December.

More bullish market conditions could shift targets up near the midpoint of Q1’s consolidation, near $0.5032, where higher timeframes show an inefficiently traded zone.

2. The Sandbox (SAND)

The Sandbox SAND is a blockchain-based virtual world allowing users to create, build, buy and sell digital assets in the form of a game. By combining the powers of decentralised autonomous organisations (DAOs) and non-fungible tokens (NFTs), the Sandbox creates a decentralised platform for a thriving gaming community. The Sandbox employs the powers of blockchain technology by introducing the SAND utility token, which facilitates transactions on the platform.

SAND Price Analysis

At the time of writing, SAND is ranked the 34th cryptocurrency globally and the current price is US$1.19. Let’s take a look at the chart below for price analysis:

Source: TradingView

SAND‘s impressive gains during Q1 halted at $3.10 before retracing 85% of the move. This price action created several areas of possible higher-timeframe resistance in the process.

The price found resistance on its last swing upward near $1.27 – an area that could provide resistance again. If this swing high breaks, the price might find resistance near $1.40. If this area does provide resistance, it would suggest the formation of a higher-timeframe consolidation.

The fast move up left little higher-timeframe support. However, a vast zone between $0.9890 and $0.9146 has provided support before and could give support again on a retest. This zone is between the 71.8%-to-88.6% retracement levels of 2021 Q4’s parabolic move.

Continuation downward through this level, especially if the overall market remains bearish, could retrace most of Q2’s move to the next higher-timeframe support near $0.8645.

3. Tron (TRX)

Tron TRX is a blockchain-based operating system that aims to ensure this technology is suitable for daily use. Whereas Bitcoin can handle up to six transactions per second, and Ethereum up to 25, TRON claims that its network has a capacity for 2,000 TPS. This project is best described as a decentralised platform focused on content sharing and entertainment, and to this end, one of its biggest acquisitions was the file-sharing service BitTorrent in 2018. Overall, TRON has divided its goals into six phases. These include delivering simple distributed file sharing and driving content creation through financial rewards.

TRX Price Analysis

At the time of writing, TRX is ranked the 13th cryptocurrency globally and the current price is US$0.06821. Let’s take a look at the chart below for price analysis:

Source: TradingView

TRX accompanied the rest of the market during the Q2 drop, falling nearly 54% from mid-May until it found a low last week.

Price action formed a weekly support level near $0.06254, which has so far held up the price. The most recent swing low inside this range, near $0.06049, may be the target for any future stop runs. After this low, the swing low near $0.05689 and the gap beginning near $0.05126 mark possible higher-timeframe support.

The price is currently battling with significant higher-timeframe resistance levels, with the closest probable resistance resting near $0.08492, just over the previous monthly open. A sweep of the relatively equal highs above this resistance might find sellers near $0.09235 but could reach as high as $0.1093.

Learn How to Trade Live!

Join Dave and The Crypto Den Crew and they’ll show you live on a webinar how to take your crypto trading to the next level.

Where to Buy or Trade Altcoins?

These coins have high liquidity on Binance Exchange, so that could help with trading on AUD/USDT/BTC pairs. And if you’re looking at buying and HODLing cryptos, then Swyftx Exchange is an easy-to-use popular choice in Australia.
Categories
Alpha Finance Lab Crypto News Groestlcoin Market Analysis

Top 3 Coins to Watch Today: ALPHA, GRS, REI – July 5 Trading Analysis

Let’s take a closer look at today’s altcoins showing breakout signals. We’ll explain what the coin is, then dive into the trading charts and provide some analysis to help you decide.
1. Alpha Finance (ALPHA)

Alpha Finance Lab ALPHA is a cross-chain DeFi platform that looks to bring Alpha to users across a variety of different blockchains, including Binance Smart Chain (BSC) and Ethereum. The platform aims to produce an ecosystem of DeFi products that address unmet needs in the industry while remaining simple to use and access. ALPHA is the native utility token of the platform. Token holders can earn a share of network fees by staking ALPHA tokens to cover any default loans. Other use cases for the token include liquidity mining and governance voting.

ALPHA Price Analysis

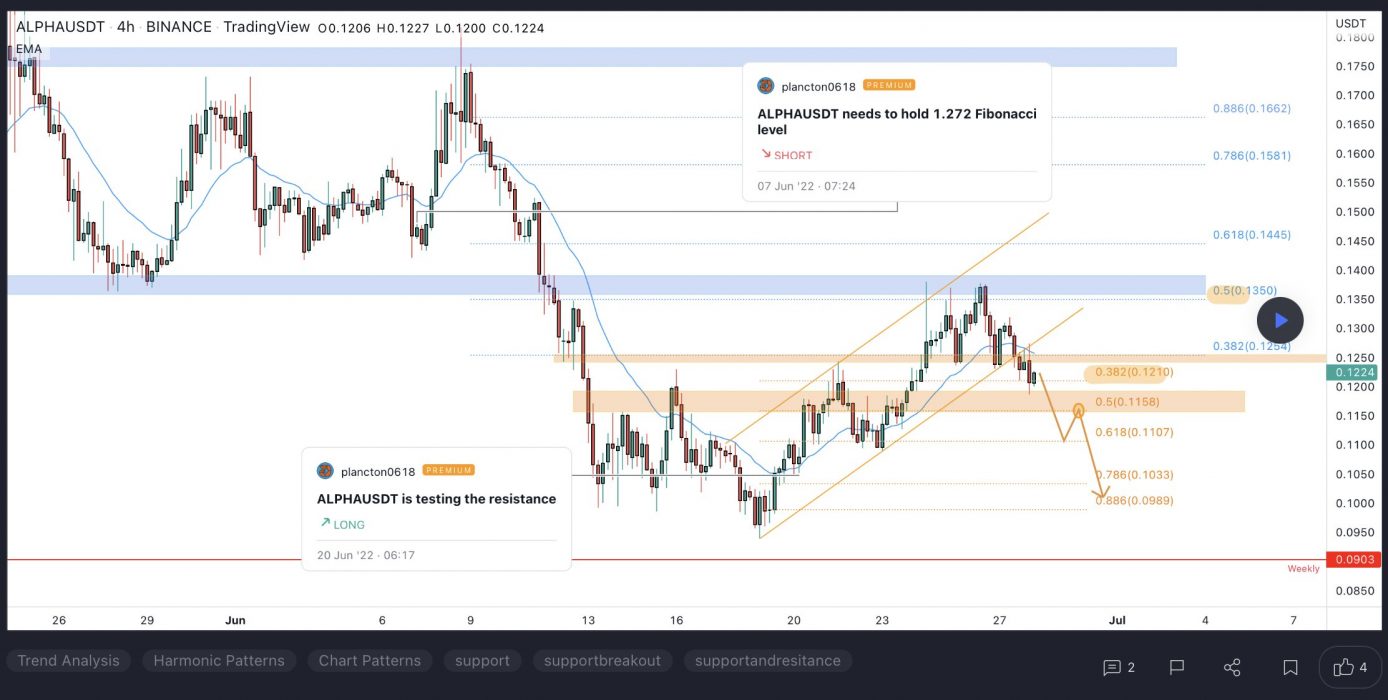
At the time of writing, ALPHA is ranked the 349th cryptocurrency globally and the current price is US$0.1157. Let’s take a look at the chart below for price analysis:

Source: TradingView

ALPHA dropped almost 87% from its April high by June 18, then saw a small rally. In the last week, the price has retraced before beginning consolidation near the 9 EMA.

The high of June 18’s swing low candle has given support near $0.1095. This level, just under the July monthly open, could continue to provide support.

The closest resistance is likely above June 26’s swing high, near $0.1232. This area showed inefficient trading before late June’s revisit.

A rally to this level could reach higher, to $0.1380. Relative equal highs provide an attractive target to bulls aiming for bears’ stops. This area also contains the 40 EMA, shows inefficient trading on the daily and weekly charts, and aligns with May’s consolidation lows.

A more sustained rally might reach higher to $0.1816. This is a significant swing high that started early June’s breakdown. The price is less likely to reach this high while market conditions remain bearish.

Since the larger market is bearish, traders should expect lower prices in the longer term. The weekly chart shows inefficient trading from $0.0960 to $0.0556. This general area may provide support for a longer-term bottom.

Inside this region, $0.0822 to $0.0800 shows inefficient trading on the daily chart. This level may be a sensitive bearish target, even if it doesn’t form a long-term bottom.

2. Groestlcoin (GRS)

Groestlcoin GRS is mined using the Groestl algorithm. Groestl was chosen as one of the five finalists of the NIST hash function competition. It uses the same S-box as AES in a custom construction. The cryptocurrency operates as open source software on a peer-to-peer model (transactions take place directly between the payer and payee). This means that no trusted intermediary, such a bank or PayPal, is required to verify the details of the sender and receiver. Rather, the transactions are verified by nodes (the network of computers/users spread globally) and recorded in an open ledger.

GRS Price Analysis

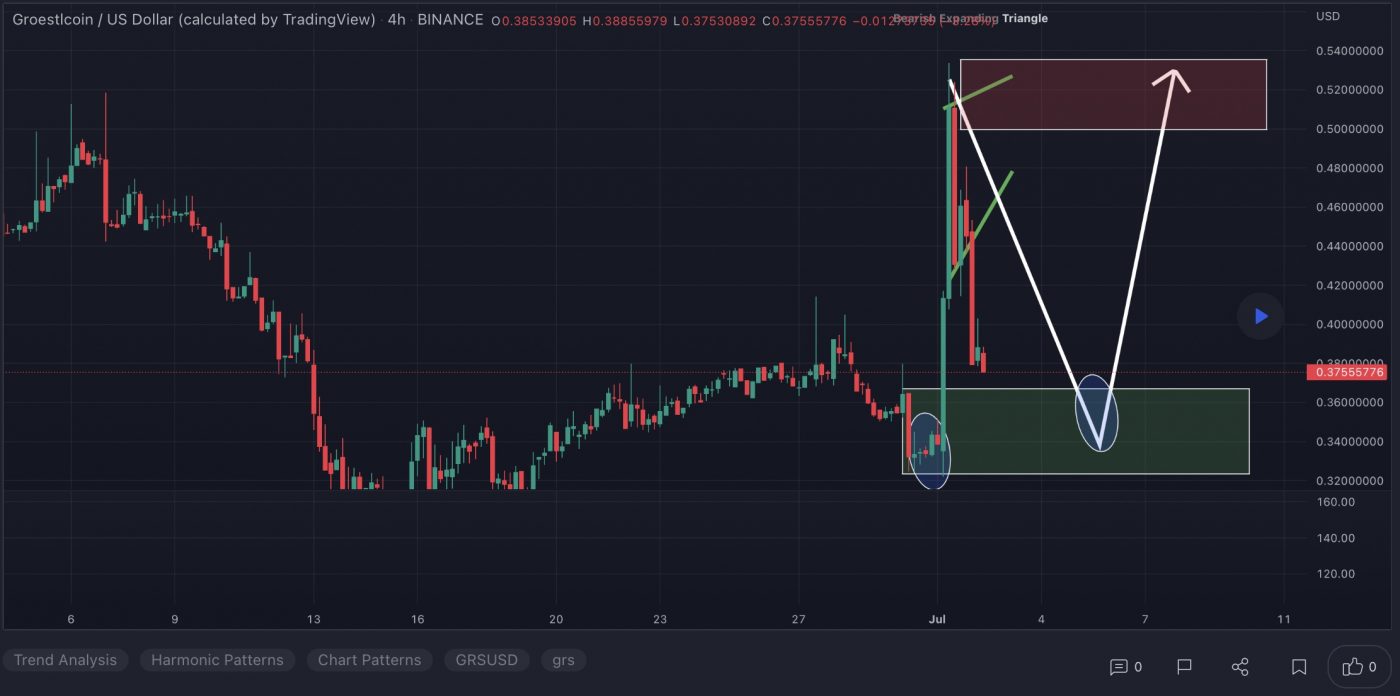
At the time of writing, GRS is ranked the 502nd cryptocurrency globally and the current price is US$0.3456. Let’s take a look at the chart below for price analysis:

Source: TradingView

GRS fell 66% from its April high before forming a range of fast, wild price moves.

An area near $0.3220 has provided support during three retests and could provide support again. Bulls may want to be cautious since many retests of a level increase the chance it will break. 

Still, this level marks the swing low that began July 1’s massive rally. A bounce could happen after the price takes bulls’ stops under this low.

A drop lower could tag a level near $0.2698. This level overlaps with swing highs at the top of the 2020-2021 bull run’s consolidation range.

Below, $0.2267 is also within striking range and could provide some support. This area, deeper in the old consolidation range, is the last point of significant accumulation before December 2020’s explosive rally.

Above, $0.4452 has provided resistance and could provide resistance again. Bears rejected bulls at this level on July 1, which overlaps with the June monthly open.

If the price breaks through this level, $0.5456 might be the next resistance. Moving to this level would run bears’ stops above relative equal swing highs. 

This level also shows inefficient trading on the monthly chart. It’s also near the final consolidation’s low before May 5’s sudden price collapse. Still, the market has shown no signs that a significant bullish reversal will come soon.

3. REI Network (REI)

REI Network was developed to better adapt to the development trend of the blockchain, and to achieve a lightweight, Ethereum-compatible, higher-performance, and no-fee blockchain framework. It is a new EVM-compatible public chain compared to GXChain 2.0, is development-friendly, lightweight and free, and thus can fully support the development of various types of on-chain dApps such as DeFi, GameFi, and Metaverse.

REI Price Analysis

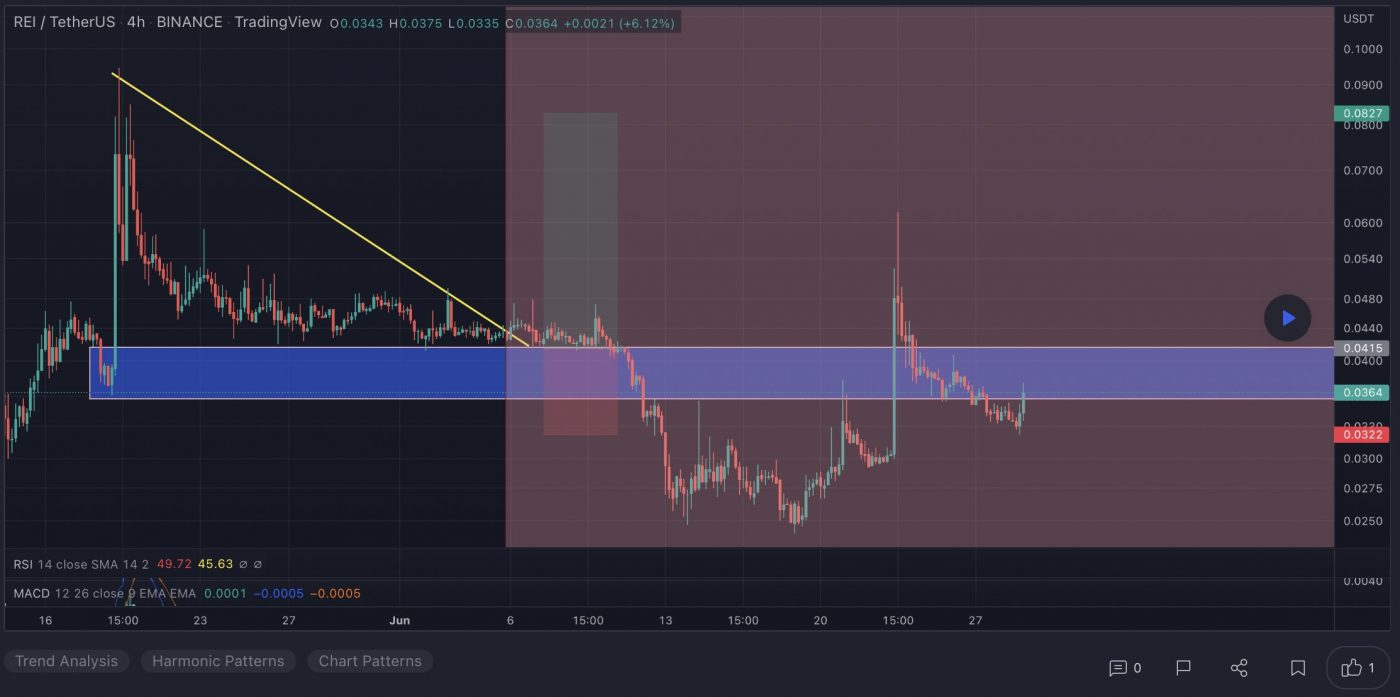
At the time of writing, REI is ranked the 445th cryptocurrency globally and the current price is US$0.03521. Let’s take a look at the chart below for price analysis:

Source: TradingView

REI had a sharp 89% drop over nine days, beginning on May 4. So far, the price has respected this drop’s low.

Under the July open, $0.03171 provided support during a retest on June 30 and could provide support again. 

This level is near the high of mid-June’s consolidation range, and a significant swing low’s candle body formed on May 12. Anticipation for next week’s hard fork could help the price hold this level as support.

The recent swing high suggests resistance near $0.03825. The 40 EMA is entering this level, and daily candle bodies show that bulls rejected bears in this area on June 23.

If the bulls break through this level, the next significant resistance may be near $0.04784. This level provided resistance during late May and early June’s trading. It’s also near the midpoint of bearish rejections on May 19 and June 23.

A much more significant rally could reach as high as $0.10218 – unlikely, unless the overall market turns more bullish. This area shows inefficient trading on higher-timeframe charts. It is near April’s consolidation lows that preceded the last significant breakdown.

The charts show very little below the current price to suggest possible support. A swing low near $0.02000, where May’s drop ended, could provide support again. 

Below this swing low, no historical price action indicates support. The current range’s 25% extensions could hint at $0.00750 to $0.00500 as an area of possible interest to bulls.

Learn How to Trade Live!

Join Dave and The Crypto Den Crew and they’ll show you live on a webinar how to take your crypto trading to the next level.

Where to Buy or Trade Altcoins?

These coins have high liquidity on Binance Exchange, so that could help with trading on AUD/USDT/BTC pairs. And if you’re looking at buying and HODLing cryptos, then Swyftx Exchange is an easy-to-use popular choice in Australia.