Categories
Crypto News Market Analysis Polkadot Trading Zcash

Top 3 Coins to Watch Today: DOT, GST, ZEC – June 3 Trading Analysis

Let’s take a closer look at today’s altcoins showing breakout signals. We’ll explain what the coin is, then dive into the trading charts and provide some analysis to help you decide.

1. Polkadot (DOT)

Polkadot DOT is an open-source sharding multichain protocol that facilitates the cross-chain transfer of any data or asset types, not just tokens, thereby making a wide range of blockchains interoperable with each other. Polkadot’s native DOT token serves three clear purposes: providing network governance and operations, and creating parachains by bonding. The Polkadot protocol connects public and private chains, permissionless networks, oracles and future technologies, allowing these independent blockchains to trustlessly share information and transactions through the Polkadot relay chain.

DOT Price Analysis

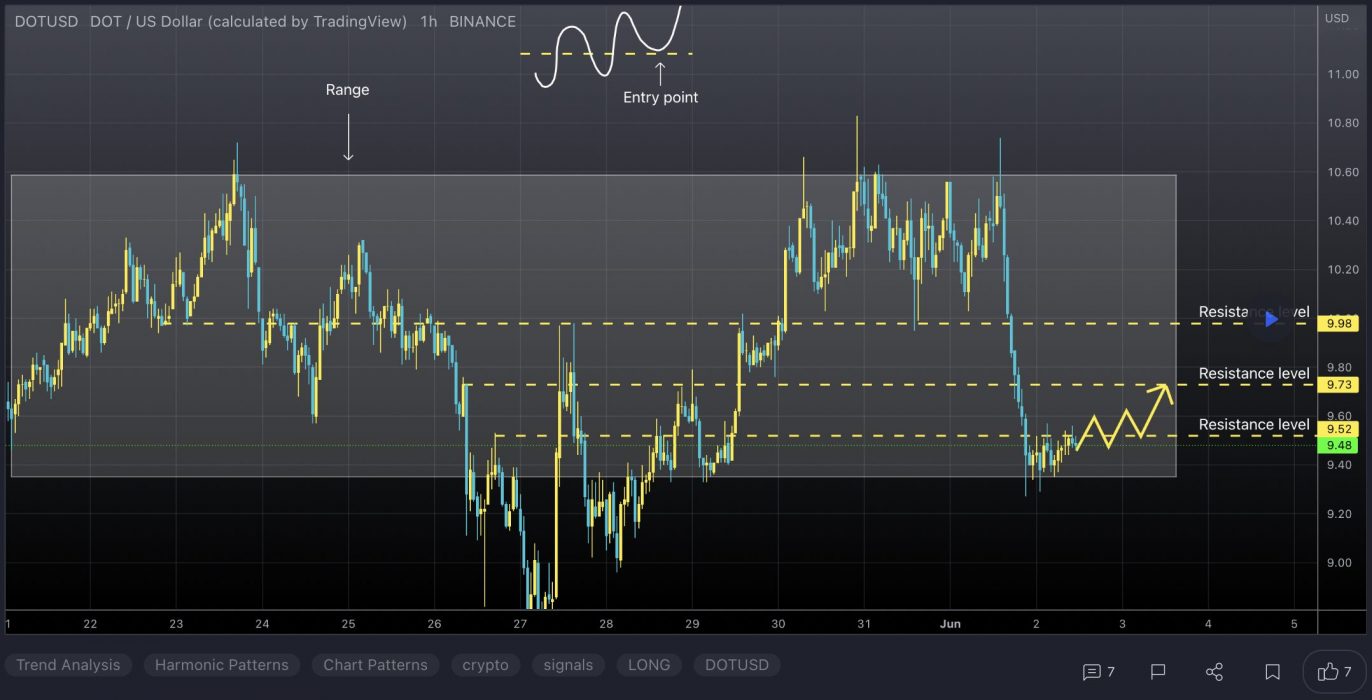
At the time of writing, DOT is ranked the 11th cryptocurrency globally and the current price is US$9.83. Let’s take a look at the chart below for price analysis:
Source: TradingView

DOT has retraced nearly 70% after Q1, showing little sign of interest from buyers.

May’s consolidation at possible support from $9.75 to $5.60 broke down with the rest of the market last month, turning this into likely resistance on future retests. This area now has confluence with the 9 and 18 EMAs.

If market conditions turn and this resistance breaks, an area near the midpoint of Q1 consolidation range, near $12.70, and the monthly high near $13.88 may see profit-taking from bulls.

The first test of possible support near $9.10 has showed some sensitivity. Still, continued bearishness in the market will likely cause a break of this level.

A break of this support might continue to drop to the next possible support near $8.70, running stops under the Q3 2021 swing low. If this level gives support and begins a consolidation forming a bottom, bulls might wait for a wick below to possible support from $8.25 to $7.96.

2. Green Satoshi Token (GST)

Green Satoshi Token GST is the game token of STEPN – a Web 3.0 lifestyle app with inbuilt fun social elements and gamification design. STEPN is the first move-to-earn NFT game where players earn GST tokens by walking, jogging and running outdoors while wearing NFT sneakers. GST tokens can also be used to level up and mint new sneakers, and players can sell/rent their NFT sneakers on the App Marketplace.

GST Price Analysis

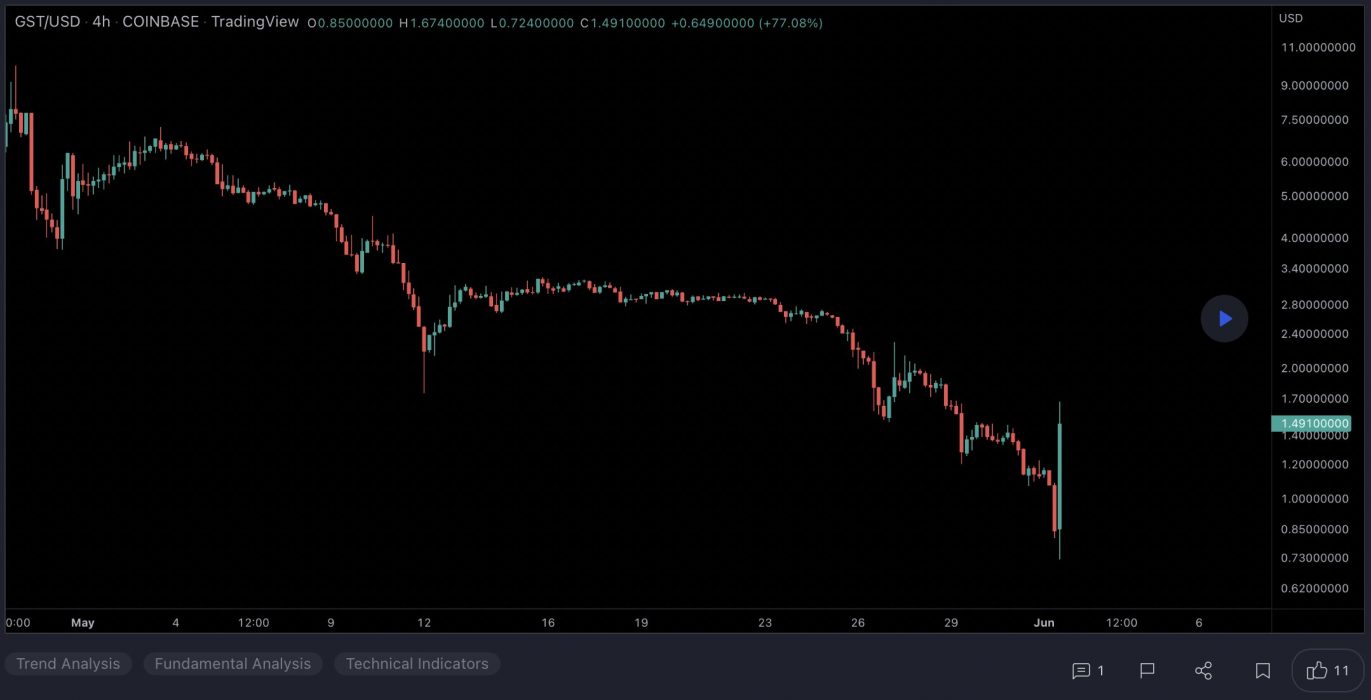
At the time of writing, GST is ranked the 356th cryptocurrency globally and the current price is US$0.9380. Let’s take a look at the chart below for price analysis:
Source: TradingView

GST has seen massive volatility recently as STEPN’s other coin, GMT, went on its parabolic run. GST’s price climbed 150% during April, dropped 80%, and is now retesting possible support.

Above the weekly open, $1.15 to $1.23 could provide resistance. Breaking through this resistance could reach near $1.30, which is approximately the midpoint of last month’s long upper wick. If the price breaks this level, last month’s high near $1.55 provides another reasonable target.

Bulls stepped in on each recent drop below $1.00. This level could provide support again and has confluence with the 18 EMA. A move below this level might see support near the 40 EMA and accumulation on the weekly, near $0.9061.

A more significant move down could target an old inefficiently traded area on the weekly between $0.8735 and $0.8267. The lower portion of this range, under $0.7681, may provide higher-probability support.

3. Zcash (ZEC)

Zcash ZEC is a decentralised cryptocurrency focused on privacy and anonymity. It uses the zk-SNARK zero-knowledge proof technology that allows nodes on the network to verify transactions without revealing any sensitive information about those transactions. Zcash transactions, on the other hand, still have to be relayed via a public blockchain, but unlike pseudonymous cryptocurrencies, ZEC transactions by default do not reveal the sending and receiving addresses or the amount being sent.

ZEC Price Analysis

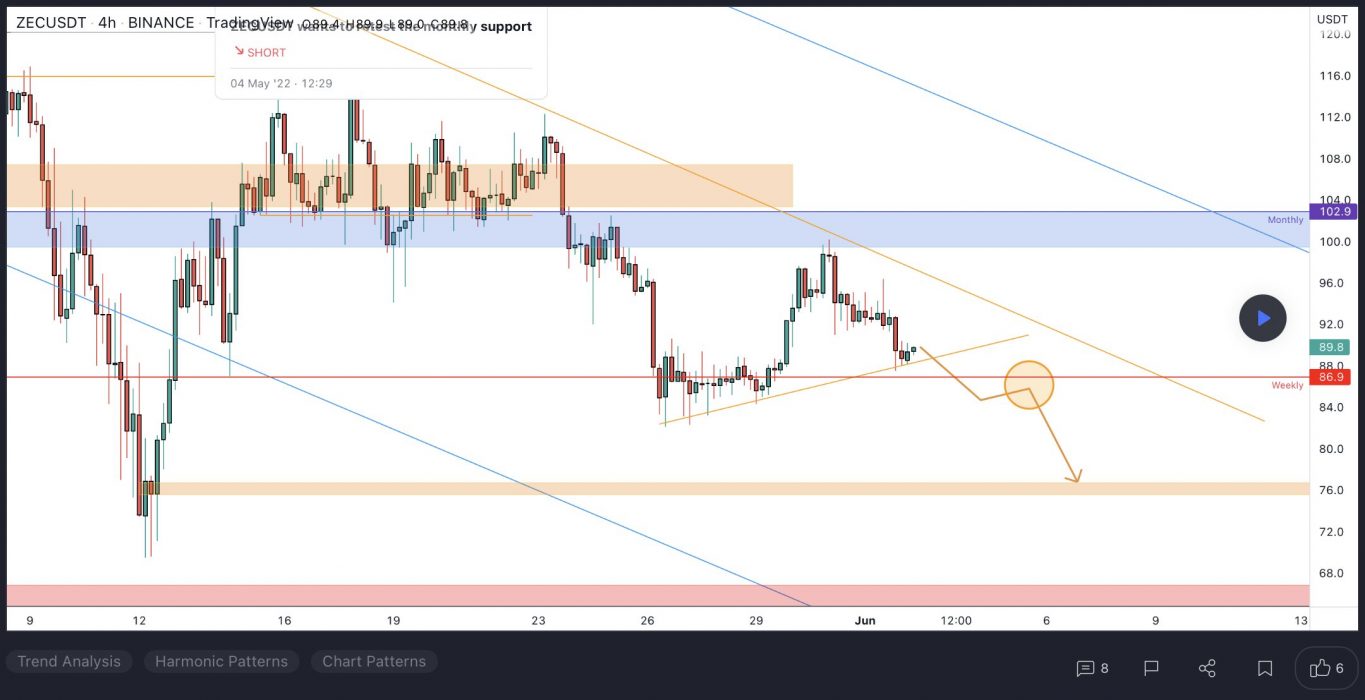
At the time of writing, ZEC is ranked the 44th cryptocurrency globally and the current price is US$89.85. Let’s take a look at the chart below for price analysis:
Source: TradingView

ZEC‘s recent bearish flip of the 9, 18 and 40 EMAs may cause bulls to be less aggressive in bidding. However, possible support near $86.47 and $82.96 – between the 41.8% and 58.6% retracements – could see at least a short-term bounce. 

Last year’s long-term consolidation suggests that the areas near $129.23 may be more likely to cause a longer-term trend reversal. 

Bears are likely to add to their shorts at probable resistance beginning near $120.50, which has confluence with the 18 EMA. A fast break of this resistance could trigger more selling near $136.12, the start of the bearish move.

If an aggressive bullish move does appear, trapped buyers in the probable resistance beginning near $145.32 might provide a ceiling for this impulse.

Learn How to Trade Live!

Join Dave and The Crypto Den Crew and they’ll show you live on a webinar how to take your crypto trading to the next level.

Where to Buy or Trade Altcoins?

These coins have high liquidity on Binance Exchange, so that could help with trading on AUD/USDT/BTC pairs. And if you’re looking at buying and HODLing cryptos, then Swyftx Exchange is an easy-to-use popular choice in Australia.

Categories
Aave Crypto News Dusk Network Market Analysis Trading WOO Network

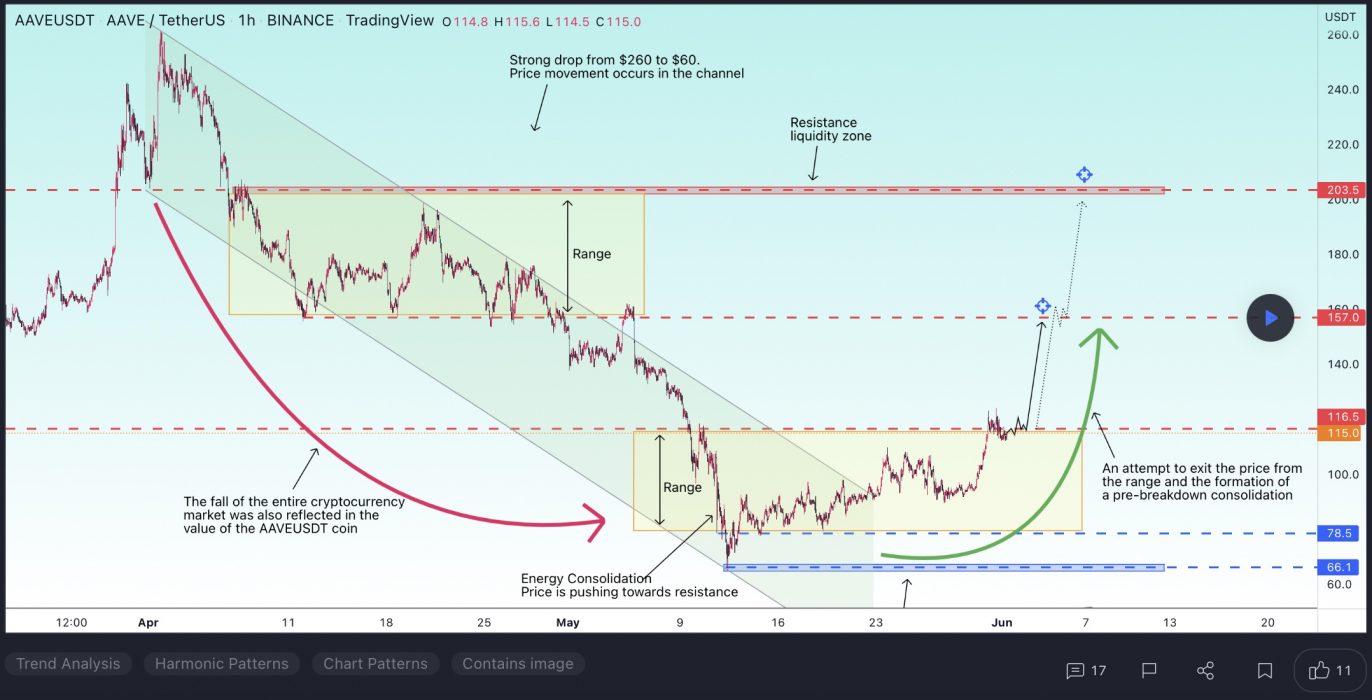
Top 3 Coins to Watch Today: AAVE, WOO, DUSK – June 2 Trading Analysis

Let’s take a closer look at today’s altcoins showing breakout signals. We’ll explain what the coin is, then dive into the trading charts and provide some analysis to help you decide.

1. Aave (AAVE)

AAVE is a decentralised finance protocol that allows people to lend and borrow crypto. Lenders earn interest by depositing digital assets into specially created liquidity pools. Borrowers can then use their crypto as collateral to take out a flash loan using this liquidity. AAVE provides holders with discounted fees on the platform, and it also serves as a governance token, giving owners a say in the future development of the protocol.

AAVE Price Analysis

At the time of writing, AAVE is ranked the 42nd cryptocurrency globally and the current price is US$111.09. Let’s take a look at the chart below for price analysis:

Source: TradingView

AAVE‘s strong downtrend that began during early April has retraced most of its Q2 move, recently sweeping lows near $80.25.

A sweep of the relatively equal lows near $104 into possible support around $95.12, combined with bullish market conditions, could be the catalyst that begins to form a bottom. If this level fails, bulls might buy the monthly gap’s low near $88.45.

The swing high near $130 may form resistance to any sudden pumps as holders unload some of their position. A more substantial move might sweep relatively swing highs into probable resistance near $142, potentially reaching up to the new monthly highs near $155 and $160.

2. WOO Network (WOO)

WOO Network is a deep liquidity network connecting traders, exchanges, institutions and DeFi platforms with democratised access to best-in-class liquidity and trading execution at lower or zero cost. WOO Token is used in the network’s CeFi and DeFi products for staking and fee discounts. Presently, a diverse set of products and services interfacing retail, institutions, CeFi and DeFi have been built. WOO X is a zero-fee trading platform providing professional and institutional traders with best-in-class liquidity and execution. It features fully customisable modules for workspace customisation.

WOO Price Analysis

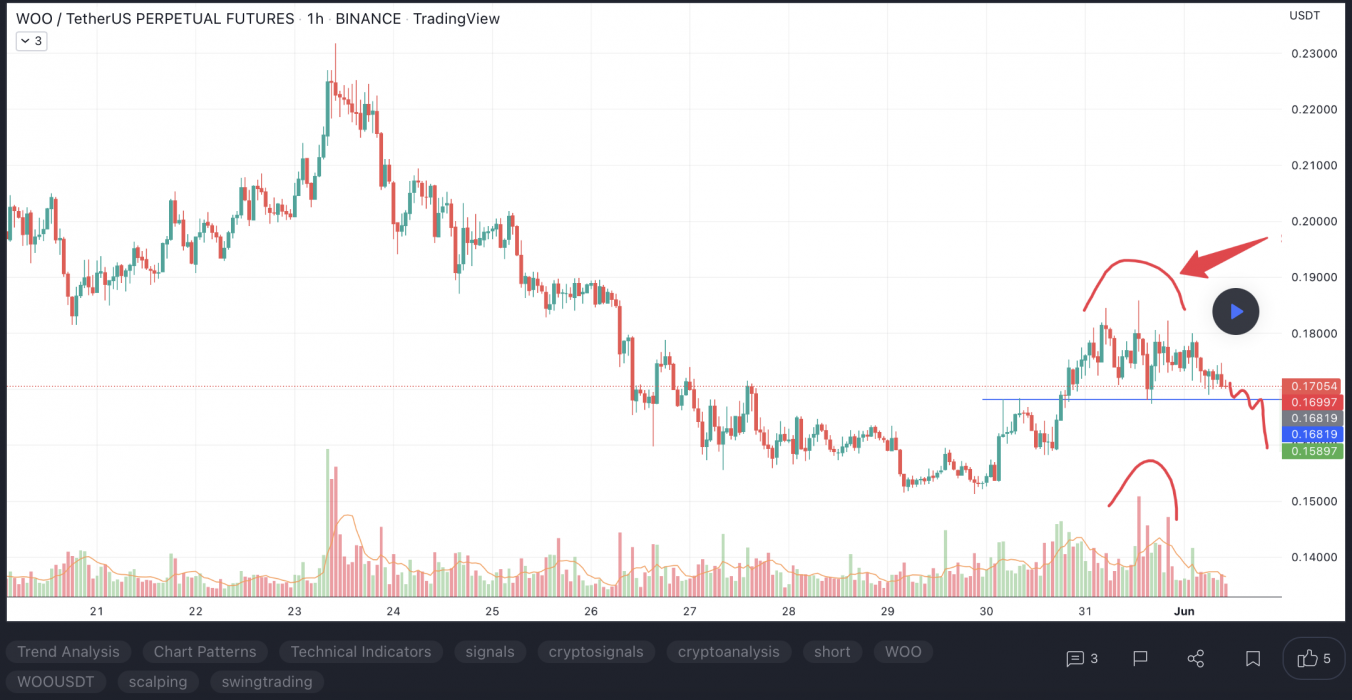
At the time of writing, WOO is ranked the 152nd cryptocurrency globally and the current price is US$0.1656. Let’s take a look at the chart below for price analysis:

Source: TradingView

WOO has retraced 80% from its Q1 highs and is currently challenging possible support near $0.1520, between the 71.8% and 78.6% retracement levels. 

If this level fails to provide support, the 78.6% retracement, near $0.1451, offers a strong draw for shorts with multiple daily swing lows and an inefficient area. 

Continued bearish conditions may cause this level to break, running all swing lows since Q1 2021 into the upper portion of an inefficient region starting near $0.1320. Near the midpoint and bottom of this region, lower timeframes show that $0.1280 and $0.1240 could also provide some sensitivity.

The low of early December’s consolidation, near $0.2517, and the 9 EMA may provide some resistance on any retracements. A continued rally – unlikely unless the overall market’s catalysts drastically shift – could reach over the 2021 open to $0.2927 and possibly $0.3400, where the daily chart shows a head-and-shoulders formation.

3. Dusk Network (DUSK)

Dusk Network describes itself as a blockchain for programmable and confidential securities, powered by Zero-Knowledge proofs and a novel Private PoS leader extraction-based consensus protocol. Dusk Network is a privacy blockchain for financial applications. It is a layer-1 blockchain that powers the Confidential Security Contract (XSC) standard and supports native confidential smart contracts.

DUSK Price Analysis

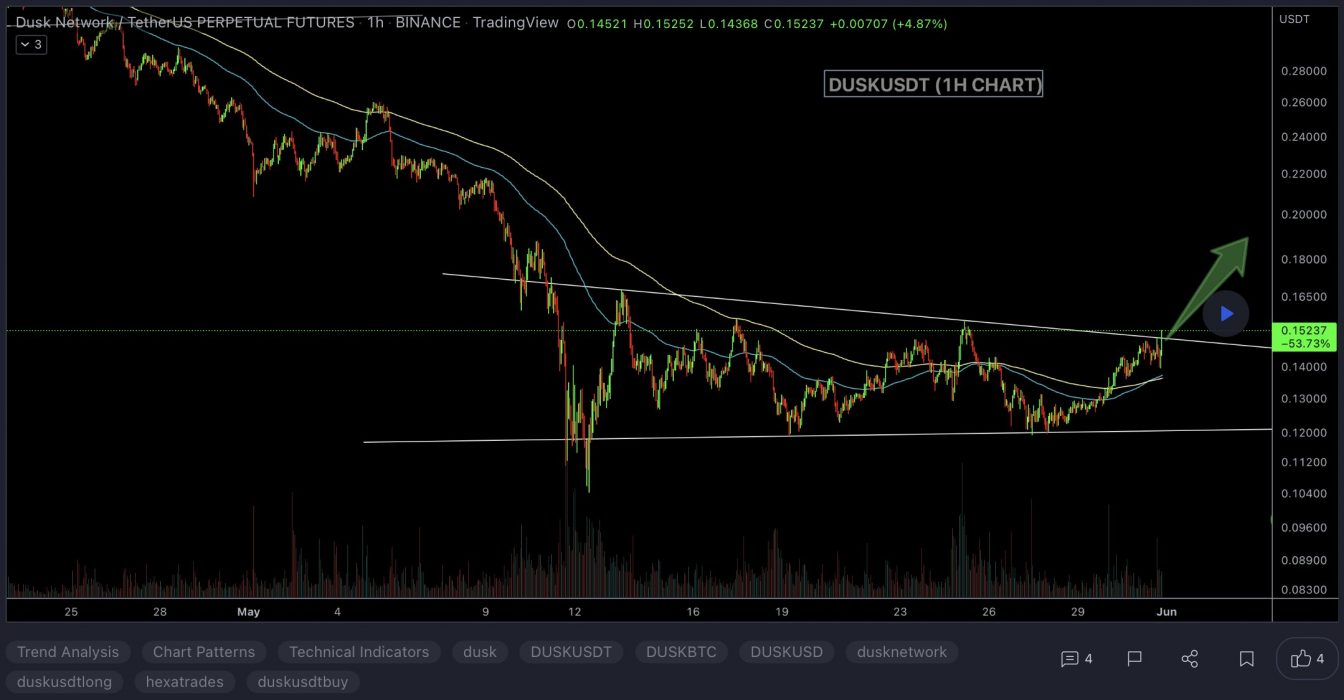
At the time of writing, DUSK is ranked the 394th cryptocurrency globally and the current price is US$0.1375. Let’s take a look at the chart below for price analysis:

Source: TradingView

DUSK shows signs of a more significant bearish reversal after a failed rally in March. An area near $0.2246, which has confluence with the 9 EMA and the most recent consolidation, is likely to provide resistance.

Possible support under a significant recent swing low and the 61.8% retracement, near $0.1285, may be the next bearish target. If this area fails to provide support, an area near $0.1165 may offer the next support and potentially a longer-term bottom. This area has confluence with the 78.6% retracement and the consolidation preceding the sharpest leg of H2’s rally.

If market conditions become more bullish and resistance near $0.1946 breaks, an area near the last down move’s midpoint, around $0.2357, could provide the next resistance. 

A more sustained move upward may retest the 2022 open near $0.2856. However, current market conditions reduce the probability of a significant rally.

Learn How to Trade Live!

Join Dave and The Crypto Den Crew and they’ll show you live on a webinar how to take your crypto trading to the next level.

Where to Buy or Trade Altcoins?

These coins have high liquidity on Binance Exchange, so that could help with trading on AUD/USDT/BTC pairs. And if you’re looking at buying and HODLing cryptos, then Swyftx Exchange is an easy-to-use popular choice in Australia.

Categories
Crypto News Market Analysis NEAR Protocol Trading VeChain Waves

Top 3 Coins to Watch Today: NEAR, VET, WAVES – June 1 Trading Analysis

Let’s take a closer look at today’s altcoins showing breakout signals. We’ll explain what the coin is, then dive into the trading charts and provide some analysis to help you decide.

1. Near Protocol (NEAR)

NEAR Protocol is a decentralised application platform designed to make apps usable on the web. The network runs on a Proof-of-Stake (PoS) consensus mechanism called Nightshade, which aims to offer scalability and stable fees. NEAR uses human-readable account names, unlike the cryptographic wallet addresses common to Ethereum. NEAR also introduces unique solutions to scaling problems and has its own consensus mechanism, called “Doomslug”.

NEAR Price Analysis

At the time of writing, NEAR is ranked the 20th cryptocurrency globally and the current price is US$6.08. Let’s take a look at the chart below for price analysis:

Source: TradingView

After its uptrend during Q1, NEAR has retraced 70% from its highs to support at the retracement of around $5.80.

The price shifted market structure to run to the consolidation lows near $6.40, just under the monthly open. A continued bearish trend in the market may create support just below, between $6.00 and $5.20.  

On the other hand, if the current resistance breaks, the price might find resistance near $8.33, whereas mid-Q1 buyers may still be trapped in longs.

2. VeChain (VET)

VeChain VET is a blockchain-powered supply chain platform. VeChain aims to use distributed governance and Internet of Things (IoT) technology to create an ecosystem that solves some of the major problems with supply chain management. The platform uses two in-house tokens, VET and VTHO, to manage and create value based on its VeChainThor public blockchain. The idea is to boost the efficiency, traceability, and transparency of supply chains while reducing costs and placing more control in the hands of individual users.

VET Price Analysis

At the time of writing, VET is ranked the 32nd cryptocurrency globally and the current price is US$0.03286. Let’s take a look at the chart below for price analysis:

Source: TradingView

VET‘s 68% move during late March ran into resistance near $0.08420, at the 30% extension of the Q1 swing.

An old high and the 18 EMA have provided support near $0.03083 and may give support again on a retest. This area also has confluence with the 51% and 63.8% retracements of November’s swing.

Just below, near $0.02943, the 56.8% retracement of the current Q1 swing might also mark an area of support. 

If the market turns bearish, $0.02572 is unlikely to be revisited but could see interest from bulls during any deeper retracement.

An area near $0.03948, at the 50% extension of the last week swing, could see some profit-taking if bulls break the current resistance near $0.04478. Above, old consolidations near $0.04825 and $0.05072 may also provide some resistance before another round of price discovery.

3. Waves (WAVES)

WAVES is a multi-purpose blockchain platform that supports various use cases, including decentralised applications (DApps) and smart contracts. The platform has undergone various changes and added new spin-off features to build on its original design. Waves’ native token is WAVES, an uncapped supply token used for standard payments such as block rewards. Waves initially set out to improve on the first blockchain platforms by increasing speed, utility, and user-friendliness.

WAVES Price Analysis

At the time of writing, WAVES is ranked the 60th cryptocurrency globally and the current price is US$8.67. Let’s take a look at the chart below for price analysis:

Source: TradingView

During April’s high, WAVES‘ slight drop marks the current range as a reasonable area to expect accumulation.

The recent bearish flip of the 9, 18 and 40 EMAs might cause bulls to be less aggressive in bidding. However, possible support near $7.12 and $6.35 – between the 41.8% and 50.6% retracements – could see at least a short-term bounce. 

Long-term consolidation suggests that the areas near $11.45 and $13.61 may be more likely to cause a longer-term trend reversal.

Bears are likely to add to their shorts at probable resistance beginning near $12.77, which has confluence with the 18 EMA. A fast break of this resistance could trigger more selling near $15.42, the start of the bearish move.

Learn How to Trade Live!

Join Dave and The Crypto Den Crew and they’ll show you live on a webinar how to take your crypto trading to the next level.

Where to Buy or Trade Altcoins?

These coins have high liquidity on Binance Exchange, so that could help with trading on AUD/USDT/BTC pairs. And if you’re looking at buying and HODLing cryptos, then Swyftx Exchange is an easy-to-use popular choice in Australia.
Categories
Crypto News DeFiChain Maple Market Analysis PlayDapp Trading

Top 3 Coins to Watch Today: DFI, MPL, PLA – May 31 Trading Analysis

Let’s take a closer look at today’s altcoins showing breakout signals. We’ll explain what the coin is, then dive into the trading charts and provide some analysis to help you decide.

1. DefiChain (DFI)

DeFiChain DFI is a blockchain platform built with the mission of maximising the full potential of DeFi within the Bitcoin (BTC) ecosystem. The software platform is supported by a distributed network of computers and is designed to facilitate fast and transparent transactions. The development team positions DeFiChain as an innovative blockchain project and offers solutions to problems like scalability, security, and decentralisation.

DFI Price Analysis

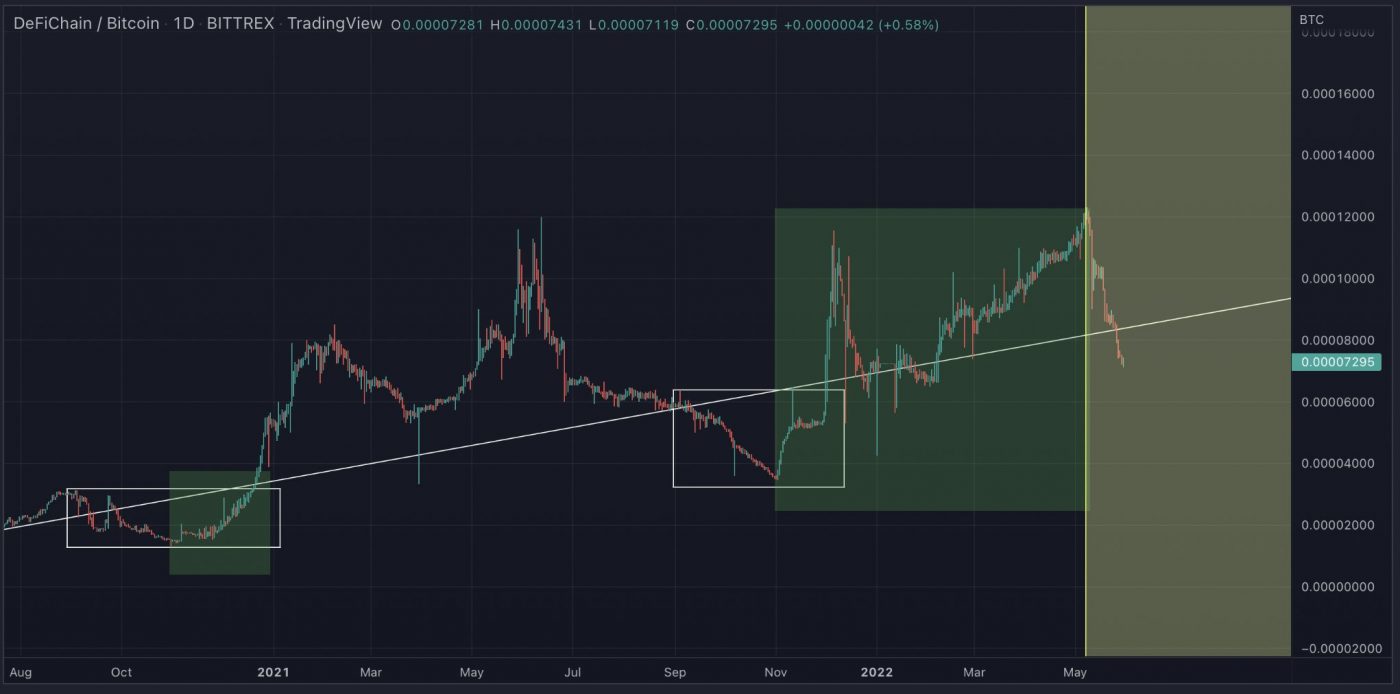
At the time of writing, DFI is ranked the 210th cryptocurrency globally and the current price is US$2.24. Let’s take a look at the chart below for price analysis:

Source: TradingView

DFI has dropped nearly 60% from its late-March high and is near the bottom of a high-timeframe range extending to the beginning of 2021.

The first high-probability resistance is near $2.3867. This area shows inefficient trading on the daily chart. It’s also near the low of January 2022’s rally. The 9 EMA recently passed through this area, and the 18 EMA will soon arrive.

A more substantial rally could reach up to $3.1593. This area overlaps with the 2022 yearly open, contains the 40 EMA, and shows inefficient trading on the weekly chart.

If the market becomes significantly more bullish, $3.735 to $4.0636 could see profit-taking by bulls. This area shows inefficient trading on the monthly chart and is where distribution occurred before May’s breakdown.

On lower timeframes, the price may have formed support near $2.1561. Traders looking for a short trade on the daily chart may want to watch this area for support. Here, the price created a swing low near an area of buying last September and November.

Bulls might also find support below, near $1.9327. This area has shown chaotic buying in the past, making exact support challenging to pinpoint. However, multiple weekly swing lows have formed in this area near the bottom of the current range. These lows show past demand by bulls while also providing bears with an attractive target.

Below this level, little price action exists to provide precise support. Near $1.0052, a large, inefficiently traded area on the monthly chart was also inefficiently traded on the weekly chart. This zone could provide sensitivity during a retest as bears take profits.

2. Maple (MPL)

Maple MPL is a decentralised corporate credit market offering borrowers transparent and efficient financing completed entirely on-chain. For liquidity providers, Maple offers a sustainable yield source through lending to diversified pools of crypto’s premium institutions. The Pool Delegates that manage these pools perform diligence and set terms with Borrowers. The protocol is governed by the Maple Token (MPL), which enables token holders to participate in governance, share in fee revenues, and stake insurance to Liquidity Pools.

MPL Price Analysis

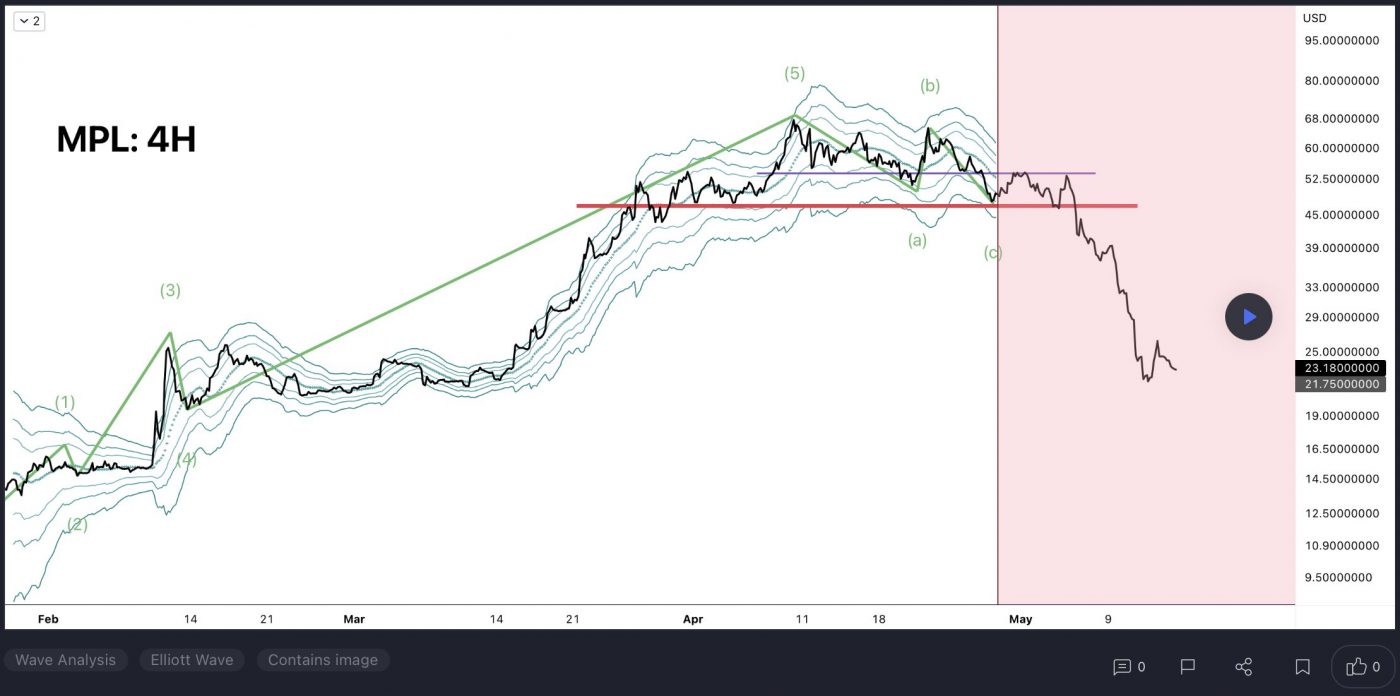
At the time of writing, MPL is ranked the 267th cryptocurrency globally and the current price is US$22.99. Let’s take a look at the chart below for price analysis:

Source: TradingView

MPL has retraced most of its 2022 rally, dropping nearly 70% into an area of old accumulation.

If the current early-week rally continues, $21.76 could provide support. This area formed a swing low on May 27 as the price created a triple-sweep formation, which sometimes suggests an incoming reversal.

Aggressive bulls buying at this level will need to be nimble since the closest resistance is just above, near $22.057. This area is inefficiently traded on the daily chart, contains the 9 EMA, and saw accumulation in March before the explosive run to all-time highs. A rally slightly higher might reach $23.64, near the recent consolidation range’s highs. 

A much more significant rally could retest an area of inefficient trading on the weekly chart, near $42.28, or slightly higher where bears rejected bulls and May’s trading opened, around $53.01. A rally this high is unlikely until the overall market has a more bullish catalyst.

The price still has a significant distance to drop. The next closest support might exist near $19.76, near the top of an area of inefficient trading on the weekly chart. 

Inefficient trading on the weekly chart and accumulation on the monthly chart near the 2022 yearly open, around $17.62, provides a stronger candidate for longer-term support.

3. PlayDapp (PLA)

PlayDapp PLA is an Ethereum token that powers PlayDapp, a blockchain gaming platform and NFT marketplace. PLA acts as the primary token for processing transactions on PlayDapp. Game developers can also receive PLA when users make in-game purchases. A digital asset is used within the PlayDapp Blockchain gaming ecosystem to purchase and trade NFT items within games and with the global C2C marketplace.

PLA Price Analysis

At the time of writing, PLA is ranked the 144th cryptocurrency globally and the current price is US$0.5492. Let’s take a look at the chart below for price analysis:

Source: TradingView

PLA dropped nearly 77% from its March high, forming a low in early May and retracing near the midpoint of its last impulsive move downward.

The price is testing possible resistance near $0.5422, where the 9 and 18 EMAs converge with an area of distribution on the daily chart.

If this level holds as resistance, aggressive bulls might watch $0.5320 as potential support. This area contains the recent lows and inefficient trading on the daily chart.

However, an old swing low and inefficient trading near $0.4629 has better odds of providing support for a more significant rally.

Below this region, exact support levels are ambiguous due to a lack of historical price action on exchange charts. An area between approximately $0.2500 and $0.2000 could provide support. Here, the price accumulated before a significant rally upward.

If the current resistance breaks, inefficient trading on the weekly chart and old swing lows near $0.6292 might act as a stronger resistance. A rally this high could poke slightly above, near $0.7010, where the monthly chart shows the low end of the range where October’s rally began.

Learn How to Trade Live!

Join Dave and The Crypto Den Crew and they’ll show you live on a webinar how to take your crypto trading to the next level.

Where to Buy or Trade Altcoins?

These coins have high liquidity on Binance Exchange, so that could help with trading on AUD/USDT/BTC pairs. And if you’re looking at buying and HODLing cryptos, then Swyftx Exchange is an easy-to-use popular choice in Australia.
Categories
Binance Coin Crypto News Loopring Market Analysis Solana Trading

Top 3 Coins to Watch Today: BNB, SOL, LRC – May 30 Trading Analysis

Let’s take a closer look at today’s altcoins showing breakout signals. We’ll explain what the coin is, then dive into the trading charts and provide some analysis to help you decide.

1. Binance Coin (BNB)

Binance BNB is the biggest cryptocurrency exchange globally, based on daily trading volume. Binance aims to bring cryptocurrency exchanges to the forefront of world financial activity. Aside from being the largest cryptocurrency exchange, Binance has launched a whole ecosystem of functionalities for its users. The Binance network includes the Binance Chain, Binance Smart Chain, Binance Academy, Trust Wallet, and Research projects, which all employ the powers of blockchain technology to bring new-age finance to the world. Binance Coin is an integral part of the successful functioning of many of the Binance sub-projects.

BNB Price Analysis

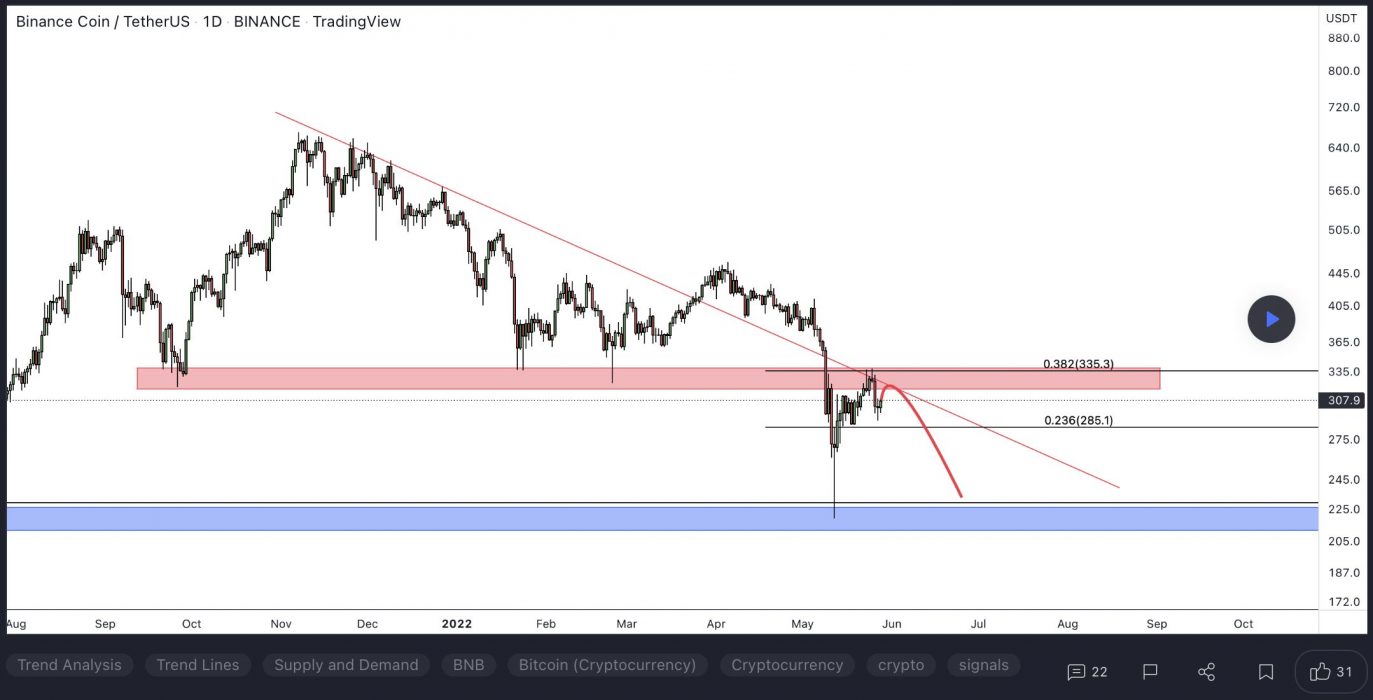
At the time of writing, BNB is ranked the 5th cryptocurrency globally and the current price is US$303.12. Let’s take a look at the chart below for price analysis:

Source: TradingView

After a 45% decline from early May, BNB has ranged between $280 and $335. The recent price recovery was approaching probable resistance near $340 but could be aiming for stops above the relatively equal highs near $356. Continuation of the trend could target the daily gap near $374.

Aggressive bulls might add to positions near $301 and $294. Price action near $390 may be more likely to provide support – if it gets there – during any retracements.

Relatively equal lows clustered around $285 seem likely to be swept if the bearish trend resumes. If this move occurs, the price might find support at the significant higher-timeframe level near $273.

2. Solana (SOL)

Solana SOL is a highly functional open-source project that banks on blockchain technology’s permissionless nature to provide decentralised finance (DeFi) solutions. The Solana protocol is designed to facilitate decentralised app (DApp) creation. It aims to improve scalability by introducing a proof-of-history (PoH) consensus combined with the underlying proof-of-stake (PoS) consensus of the blockchain.

SOL Price Analysis

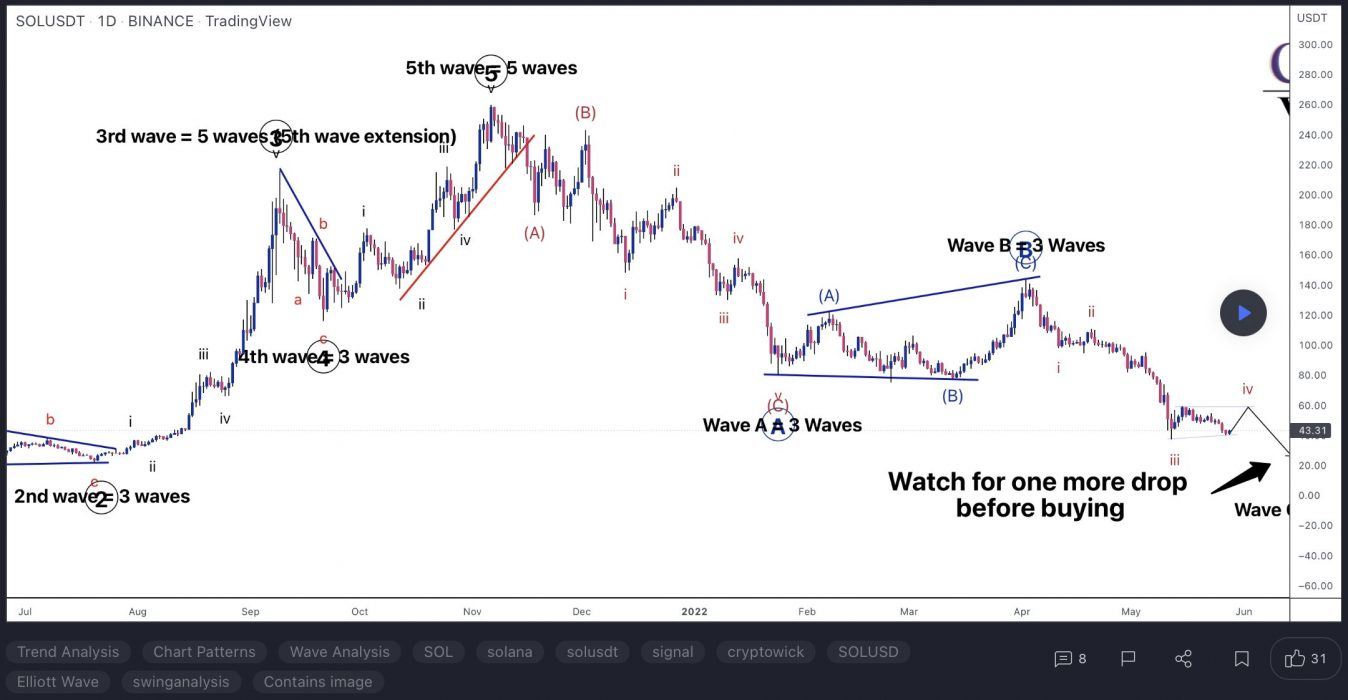
At the time of writing, SOL is ranked the 9th cryptocurrency globally and the current price is US$44.86. Let’s take a look at the chart below for price analysis:

Source: TradingView

SOL has retraced 85% from its April highs and reached possible support last week near $40.34. Resistance might begin near $58.34, which has confluence with the 9 and 18 EMAs.

A more substantial rally might reach near the swing high at $64.23 and the 40 EMA. This high is less likely to break if bears plan to continue the downtrend without a lengthier consolidation.

While not highly probable in the current market conditions, a more animated move upward could reach a wide resistance area between $67.42 and $70.94. This zone is where the last movement down accumulated positions before breaking down. 

Possible support rests near $40.34, which showed sensitivity on the last test. While it could provide support again, the higher-timeframe bearish trend is more likely to propel the price into an inefficient area between $38.10 and $36.54. If the price reaches this zone, the Q1 2021 swing high near $33.12 might mark a more sensitive level.

3. Loopring (LRC)

LRC is the Ethereum-based cryptocurrency token of Loopring, an open protocol designed for the building of decentralised crypto exchanges. Loopring’s purported goal is to combine centralised order matching with decentralised on-blockchain order settlement into a hybridised product that will take the best aspects of both centralised and decentralised exchanges.

LRC Price Analysis

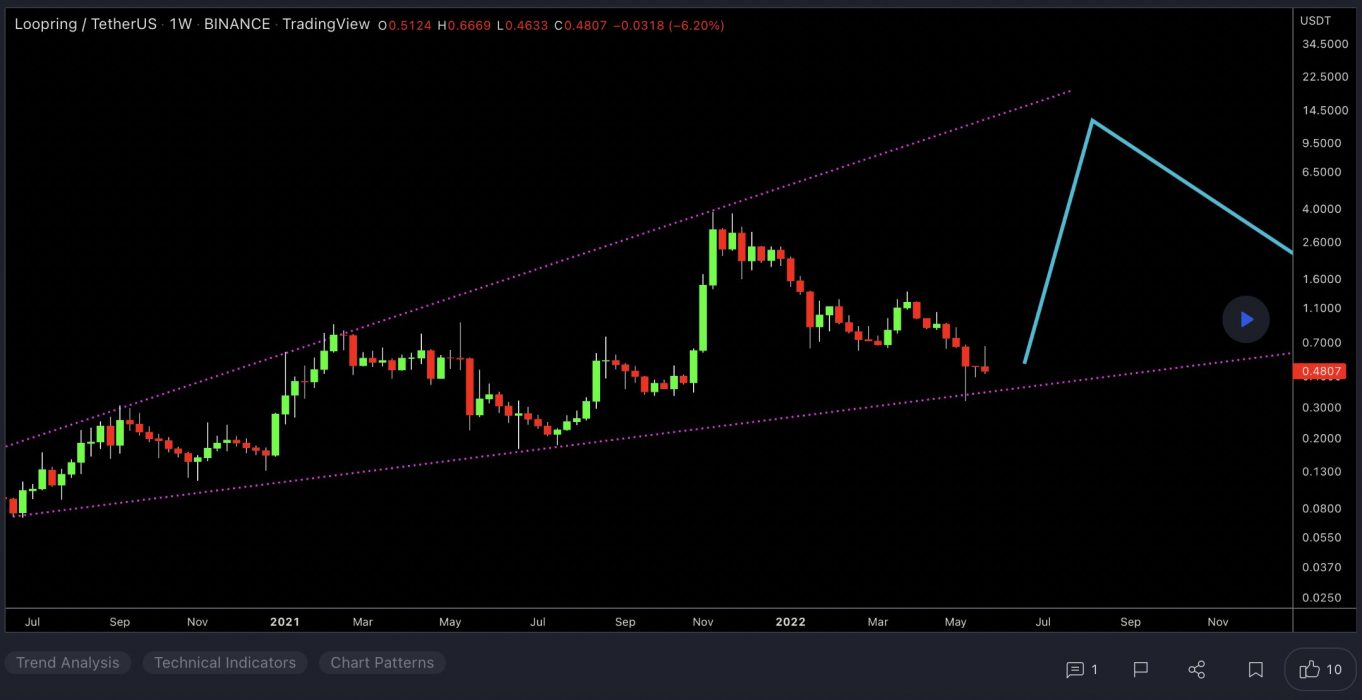
At the time of writing, LRC is ranked the 68th cryptocurrency globally and the current price is US$0.4885. Let’s take a look at the chart below for price analysis:

Source: TradingView

LRC lifted off last week, with the impulse sweeping the new swing highs into resistance up to $0.6534.

If the price retraces now that it has taken highs, aggressive bulls could look for entries at the recently broken resistance between $0.5106 and $0.4650. A deeper retracement that fills the gap down to the monthly level at $0.4460 provides a better entry, with any quick drops near the monthly open at $0.4058 providing the most favourable entries.

Continuation through the current resistance around $0.6419 is likely to explode through the remaining daily highs stacked up to $0.7328. There’s no telling how far the price could go beyond these new monthly high prices.

Learn How to Trade Live!

Join Dave and The Crypto Den Crew and they’ll show you live on a webinar how to take your crypto trading to the next level.

Where to Buy or Trade Altcoins?

These coins have high liquidity on Binance Exchange, so that could help with trading on AUD/USDT/BTC pairs. And if you’re looking at buying and HODLing cryptos, then Swyftx Exchange is an easy-to-use popular choice in Australia.
Categories
Avalanche Crypto News Kucoin Market Analysis Orion Protocol Trading

Top 3 Coins to Watch Today: ORN, KCS, AVAX – May 27 Trading Analysis

Let’s take a closer look at today’s altcoins showing breakout signals. We’ll explain what the coin is, then dive into the trading charts and provide some analysis to help you decide.

1. Orion Protocol (ORN)

Orion ORN aims to solve the difficulties in performing profitable transactions associated with the lack of liquidity on the majority of crypto exchanges. This is the case for both centralised and decentralised exchanges. Orion’s solution to this is to aggregate exchanges’ order books into one simple-to-use-and-understand terminal.

The Orion Protocol’s goal is to help users get the best returns out of their investments while also lowering the risks associated with using multiple exchanges.

ORN Price Analysis

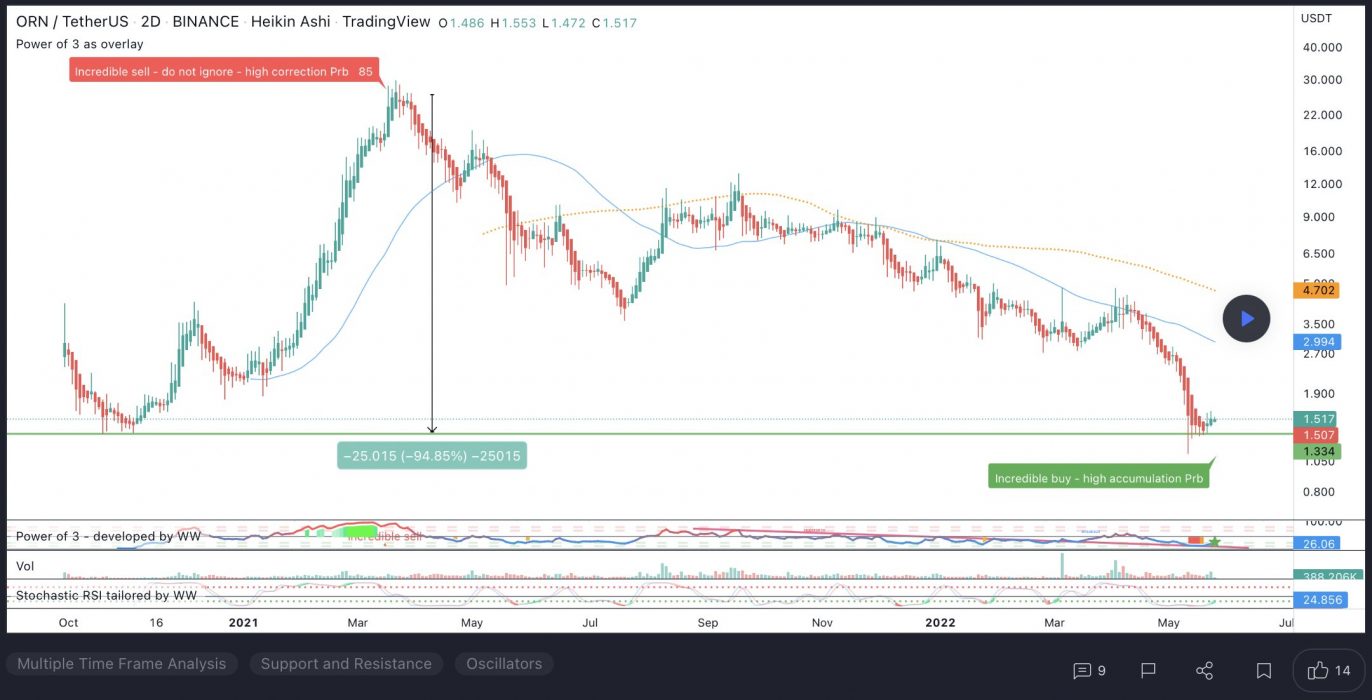
At the time of writing, ORN is ranked the 420th cryptocurrency globally and the current price is US$1.38. Let’s take a look at the chart below for price analysis:

Source: TradingView

After a 70% retracement from its March highs, ORN found a temporary low near $1.30. A recent move above $1.50 could be the first sign of a bullish shift – but could also signal a stop run before the next drop lower. 

If the market adopts a more bullish tone, the price could run through the most recent swing high. If this bounce occurs, it would likely find some resistance near $1.65, possibly reaching up to $1.86.

However, a move below the closest support near $1.26 makes stop runs on the swing lows near $1.22 and $1.20 likely. A confluence of several levels near $1.17 could provide a temporary bounce. Still, a sustained bearish market will likely target $1.15 and even $1.06.

2. KuCoin Token (KCS)

KCS is the native token of KuCoin, launched in 2017 as a profit-sharing token that allows traders to draw value from the exchange. It was issued as an ERC-20 token running on the Ethereum network and was supported by most Ethereum wallets. The total supply of KCS was set at 200 million, and there is a planned buyback and burn until just 100 million KCS remain. Sooner or later, as the KuCoin decentralised trading solution goes live, KCS will be the native asset of KuCoin’s decentralised financial services as well as the governance token of the KuCoin community in the future.

KCS Price Analysis

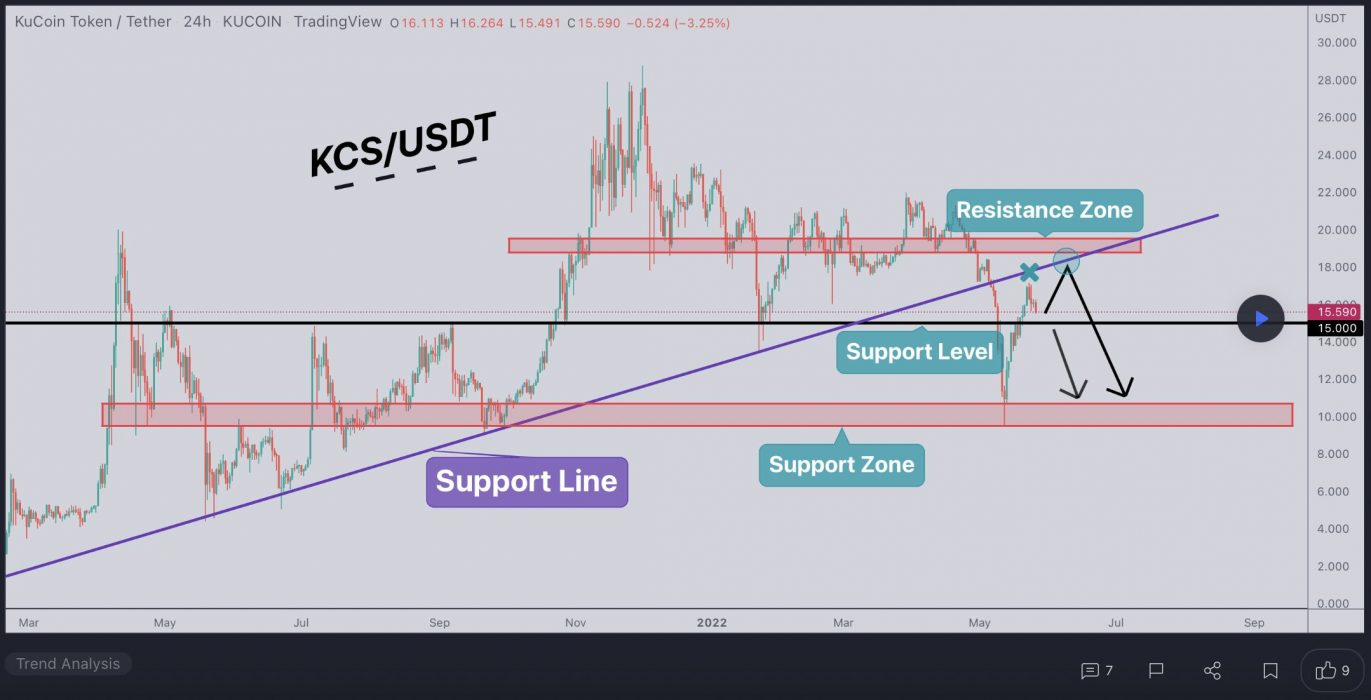
At the time of writing, KCS is ranked the 40th cryptocurrency globally and the current price is US$15.84. Let’s take a look at the chart below for price analysis:

Source: TradingView

KCS has been trading through a massive range during Q1, with the price showing mild bullishness during March.

Bulls bought near $12.20. The weekly level and daily gap near $13.90 could prompt buyers to step in again as the price challenges the swing high and resistance around $16.50. A strong move and acceptance above this level may reach for the swing highs at $18.75 and $19.66, which mark another area of resistance.

However, rejection from the current area may send the price down to retest support near $13.40. Relatively equal lows around $12.78 provide a rich target for a stop run. Sustained bearishness may reach the low near $11.90 and possibly as low as $11.14 into higher-timeframe support.

3. Avalanche (AVAX)

Avalanche AVAX is the fastest smart contracts platform in the blockchain industry, as measured by time-to-finality, and has the most validators securing its activity of any proof-of-stake protocol. Avalanche is blazingly fast, low-cost, and green. Any smart contract-enabled application can outperform its competition on Avalanche. AVAX is the native token of Avalanche. It is a hard-capped, scarce asset that is used to pay for fees, secure the platform through staking, and provide a basic unit of account between the multiple subnets created on Avalanche.

AVAX Price Analysis

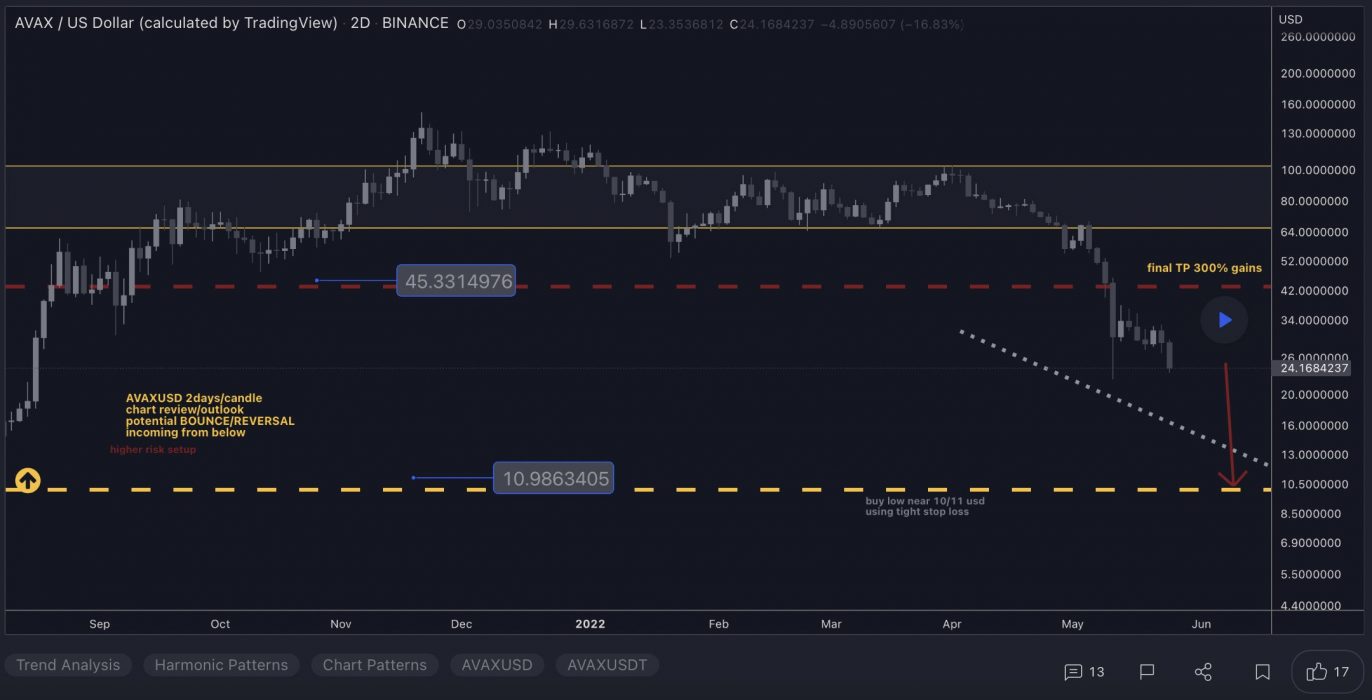
At the time of writing, AVAX is ranked the 14th cryptocurrency globally and the current price is US$24.99. Let’s take a look at the chart below for price analysis:

Source: TradingView

AVAX‘s gains during Q1 ended with an almost 69% retracement as the rest of the altcoin market dropped from early this month. Bulls stepped in near the 52.8% retracement of Q2’s move, creating a consolidation that ended with the bullish impulse to resistance near $44.35.

With the 9, 18 and 40 EMAs stacked bullish and a bullish higher-timeframe trend, it’s reasonable to anticipate retracement to possible support before further bullish expansion. 

Near the 40 EMA, a broad zone from $35.15 to $29.45 could see interest from bulls before further expansion. Bears might capitalise on any sharp moves down in Bitcoin, aiming for possible support near the 70% retracement, at $23.70, and potentially lower to a higher-timeframe support zone between $21.42 and $20.80.

If the higher-timeframe recovery trend resumes and the current resistance near $37.35 breaks, the wicks near $49.84 and the new monthly highs may see profit-taking.

Learn How to Trade Live!

Join Dave and The Crypto Den Crew and they’ll show you live on a webinar how to take your crypto trading to the next level.

Where to Buy or Trade Altcoins?

These coins have high liquidity on Binance Exchange, so that could help with trading on AUD/USDT/BTC pairs. And if you’re looking at buying and HODLing cryptos, then Swyftx Exchange is an easy-to-use popular choice in Australia.

Categories
Crypto News Dash Market Analysis Stellar Trading Uniswap

Top 3 Coins to Watch Today: XLM, DASH, UNI – May 26 Trading Analysis

Let’s take a closer look at today’s altcoins showing breakout signals. We’ll explain what the coin is, then dive into the trading charts and provide some analysis to help you decide.

1. Stellar (XLM)

Stellar XLM is an open network that allows money to be moved and stored. When it was released, the goal was boosting financial inclusion by reaching the world’s unbanked – but soon after, its priorities shifted to helping financial firms connect with one another through blockchain technology. The network’s native token, lumens, serves as a bridge that makes it less expensive to trade assets across borders. All of this aims to challenge existing payment providers who often charge high fees for a similar service.

XLM Price Analysis

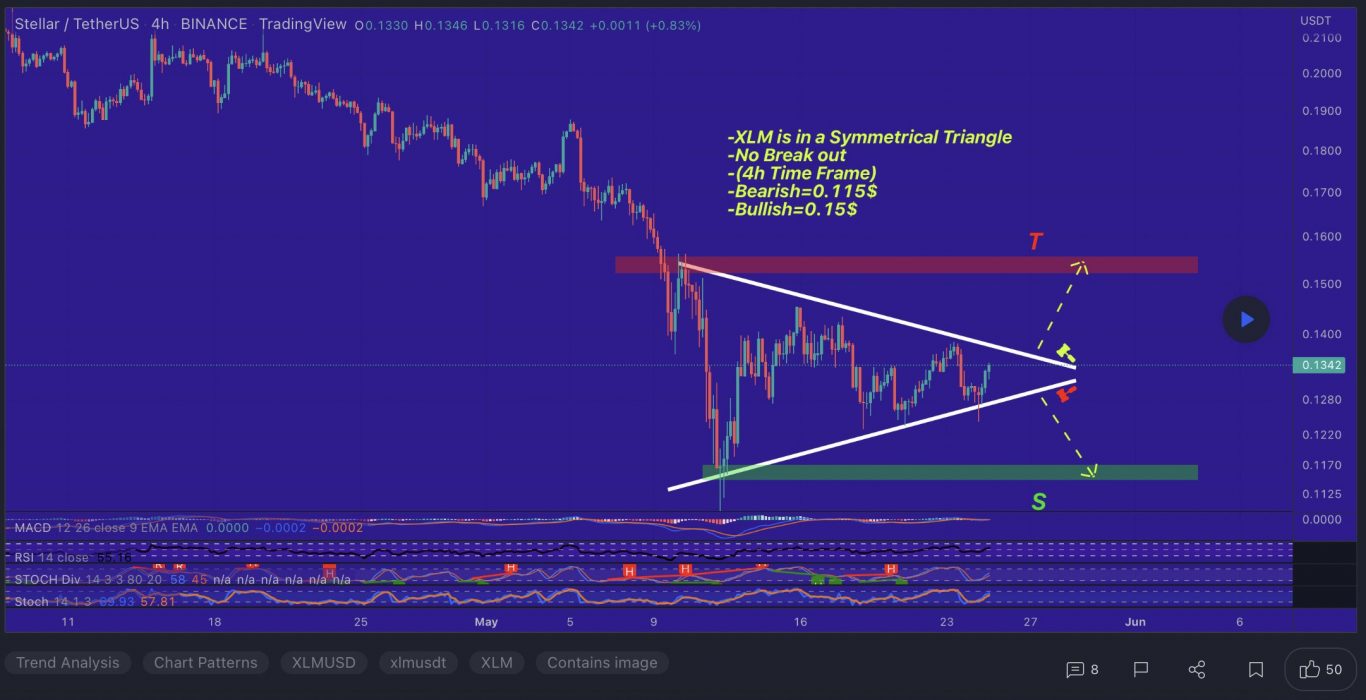
At the time of writing, XLM is ranked the 27th cryptocurrency globally and the current price is US$0.1340. Let’s take a look at the chart below for price analysis:

Source: TradingView

XLM set a high near $0.2457 in Q1 before retracing nearly 65% to find a low near $0.1258. The price consolidated around this level before the strong bullish impulse over the past several days.

Probable resistance near $0.1570 is slowing the bullish advance down. However, another leg might target the last swing high at $0.1624 and relatively equal highs at $0.1750. Resistance near $0.1859 could cap the move before the second swing high. Beyond these levels, little stands in the bulls’ way before reaching the swing high near $0.2156.

A retracement before a move higher might find support in the daily gap near $0.1210, just above the weekly open. Relatively equal lows near $0.1165 could also provide support. Run-on stops at $0.1100 and $0.1074 might find support in the gap beginning near $0.1012.

2. Dash (DASH)

Dash is an open-source blockchain and cryptocurrency focused on offering a fast, cheap global payments network that is decentralised in nature. According to the project’s white paper, Dash seeks to improve on Bitcoin by providing stronger privacy and faster transactions. Dash’s governance system, or treasury, distributes 10% of the block rewards for the development of the project in a competitive and decentralised way.

DASH Price Analysis

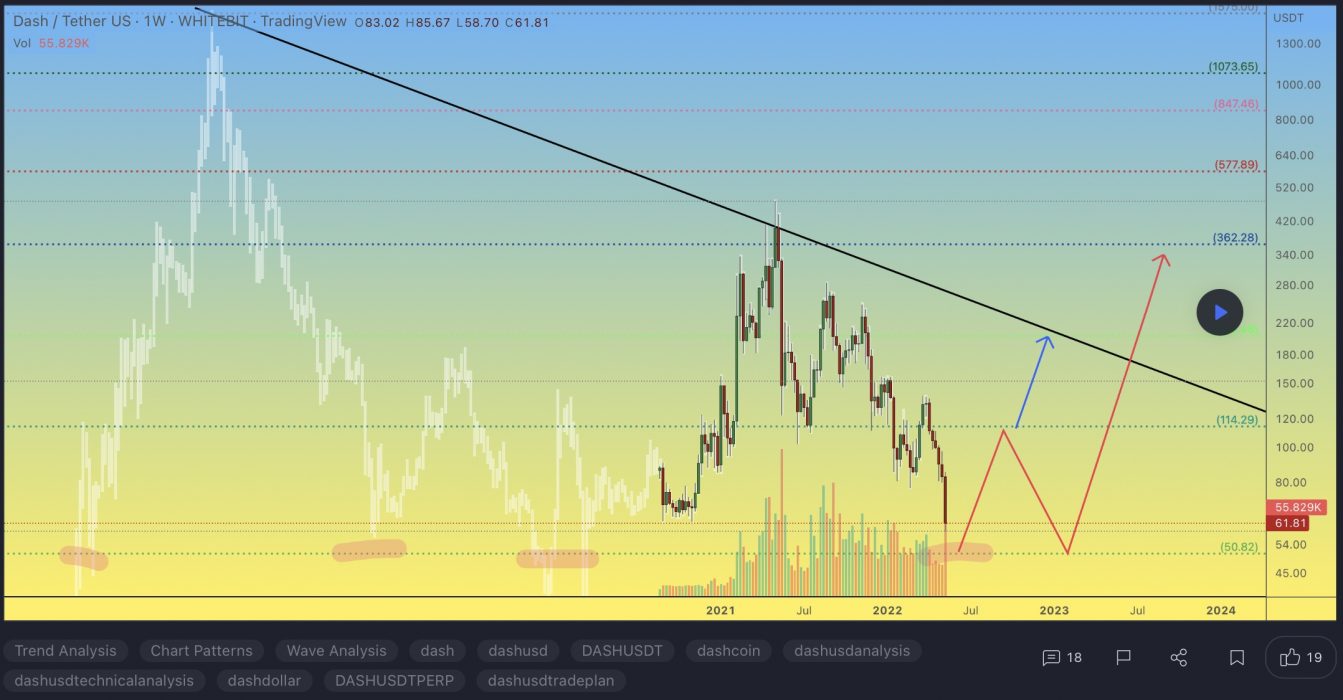
At the time of writing, DASH is ranked the 70th cryptocurrency globally and the current price is US$62.03. Let’s take a look at the chart below for price analysis:

Source: TradingView

During April, DASH retraced over 40% before finding support near $53.13. Consolidation above this level has created a series of relatively equal lows, which are likely to be swept before any longer-term bullish trend begins. 

In the shorter term, the price might establish support near $60.50 before running the swing high at $73.88. If this bullish move occurs, the price could reach resistance near the weekly open around $79.43, and may even sweep the swing high near $84.22.

Some support might exist at the daily gap near $55.12. A move this low would also fill the monthly gap and set the stage for a possible bullish reversal.

3. Uniswap (UNI)

Uniswap UNI is a popular decentralised trading protocol known for its role in facilitating the automated trading of decentralised finance (DeFi) tokens. Uniswap aims to keep token trading automated and completely open to anyone who holds tokens while improving the efficiency of trading versus that on traditional exchanges. Uniswap creates more efficiency by solving liquidity issues with automated solutions, avoiding the problems that plagued the first decentralised exchanges.

UNI Price Analysis

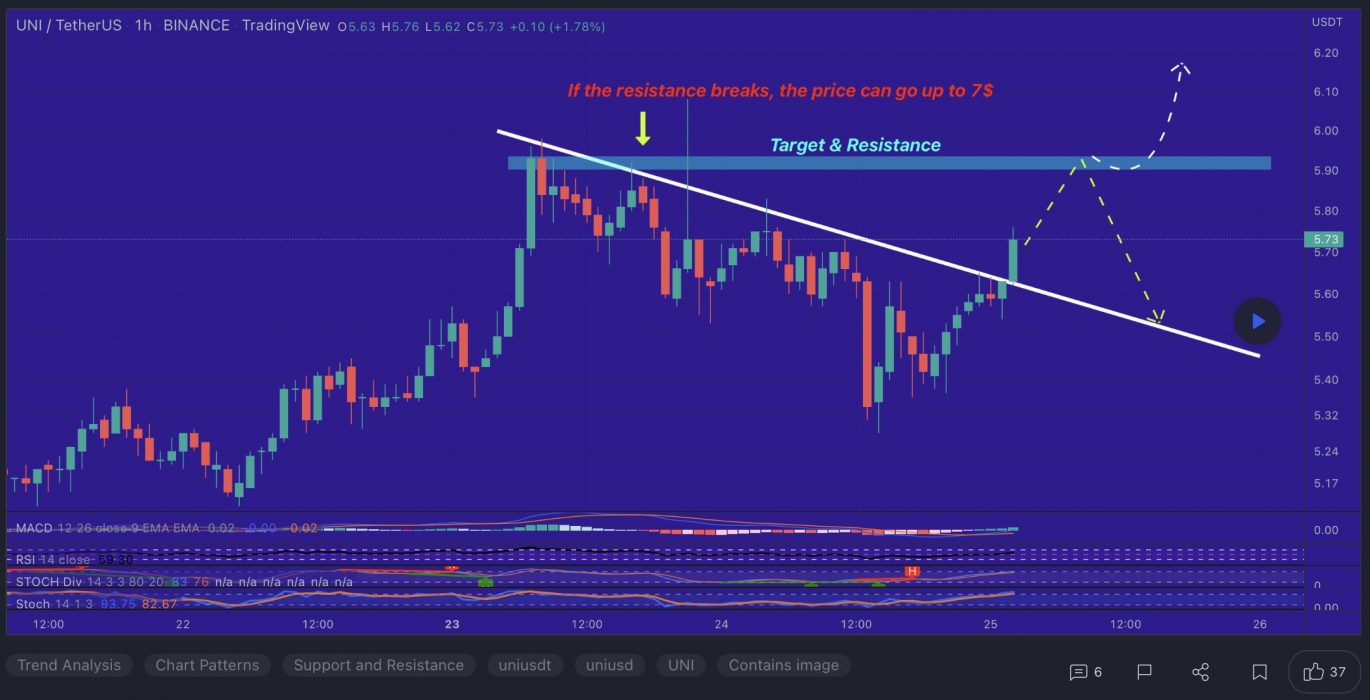
At the time of writing, UNI is ranked the 23rd cryptocurrency globally and the current price is US$5.50. Let’s take a look at the chart below for price analysis:

Source: TradingView

UNI‘s 70% retracement from its March highs set a low near $4.87 during its consolidation that began in early May.

Relatively equal highs near $7.56 could be the current target if the price breaks through resistance beginning near $8.87. Bullish continuation might reach through the next significant swing high near $9.26 into the daily gap near $10.59.

If bullish strength continues, the zones just below the monthly open near $11.88 and $12.45 could halt any retracement. 

A bearish shift in the market might seek the relatively equal lows near $5.33 into possible support near $5.00. If this down move occurs, the swing low near $4.90 and possible support near $4.32 may be the primary objective.

Learn How to Trade Live!

Join Dave and The Crypto Den Crew and they’ll show you live on a webinar how to take your crypto trading to the next level.

Where to Buy or Trade Altcoins?

These coins have high liquidity on Binance Exchange, so that could help with trading on AUD/USDT/BTC pairs. And if you’re looking at buying and HODLing cryptos, then Swyftx Exchange is an easy-to-use popular choice in Australia.

Categories
Cardano Crypto News Fantom Market Analysis Tezos Trading

Top 3 Coins to Watch Today: ADA, FTM, XTZ – May 25 Trading Analysis

Let’s take a closer look at today’s altcoins showing breakout signals. We’ll explain what the coin is, then dive into the trading charts and provide some analysis to help you decide.

1. Cardano (ADA)

Cardano ADA is a proof-of-stake blockchain platform whose stated goal is to allow “changemakers, innovators, and visionaries” to bring about positive global change. The open-source project also aims to “redistribute power from unaccountable structures to the margins to individuals”, helping to create a society that is more secure, transparent, and fair. Cardano is used by agricultural companies to track fresh produce from field to fork, while other products built on the platform allow educational credentials to be stored in a tamper-proof way, and retailers to clamp down on counterfeit goods.

ADA Price Analysis

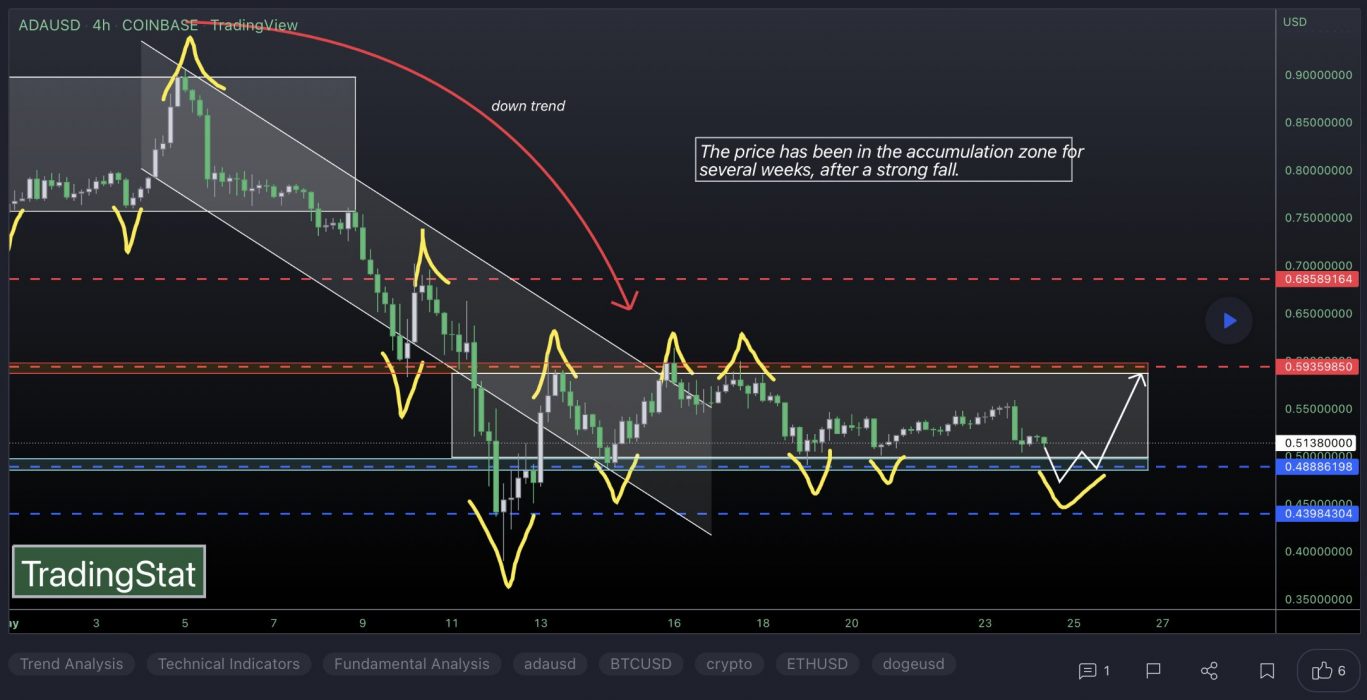
At the time of writing, ADA is ranked the 8th cryptocurrency globally and the current price is US$0.5086. Let’s take a look at the chart below for price analysis:

Source: TradingView

ADA‘s near 60% drop after Q1 found a low near $0.4635 during mid-May before closing over a short-term high.

This daily close over the high could signal a shift in market structure that may reach probable resistance near $0.6015. A sustained bullish move may target the swing high at $0.6422. If this stop run occurs, a run beyond the high into probable resistance near $0.7110 and $0.7519 is possible.

Bulls could buy a retracement to possible support near $0.4845, just above the weekly open. A bearish turn in the marketplace may propel the price toward possible support near $0.4425. 

However, relatively equal lows near $0.4157 and $0.4022 provide an attractive target for bears if the market resumes its bearish trend. A run on these lows might find support between $0.3847 and $0.3752.

2. Fantom (FTM)

Fantom FTM is a directed acyclic graph (DAG) smart contract platform providing decentralised finance (DeFi) services to developers using its own bespoke consensus algorithm. Together with its in-house token FTM, Fantom aims to solve problems associated with smart-contract platforms – specifically transaction speed, which developers say they have reduced to under two seconds.

FTM Price Analysis

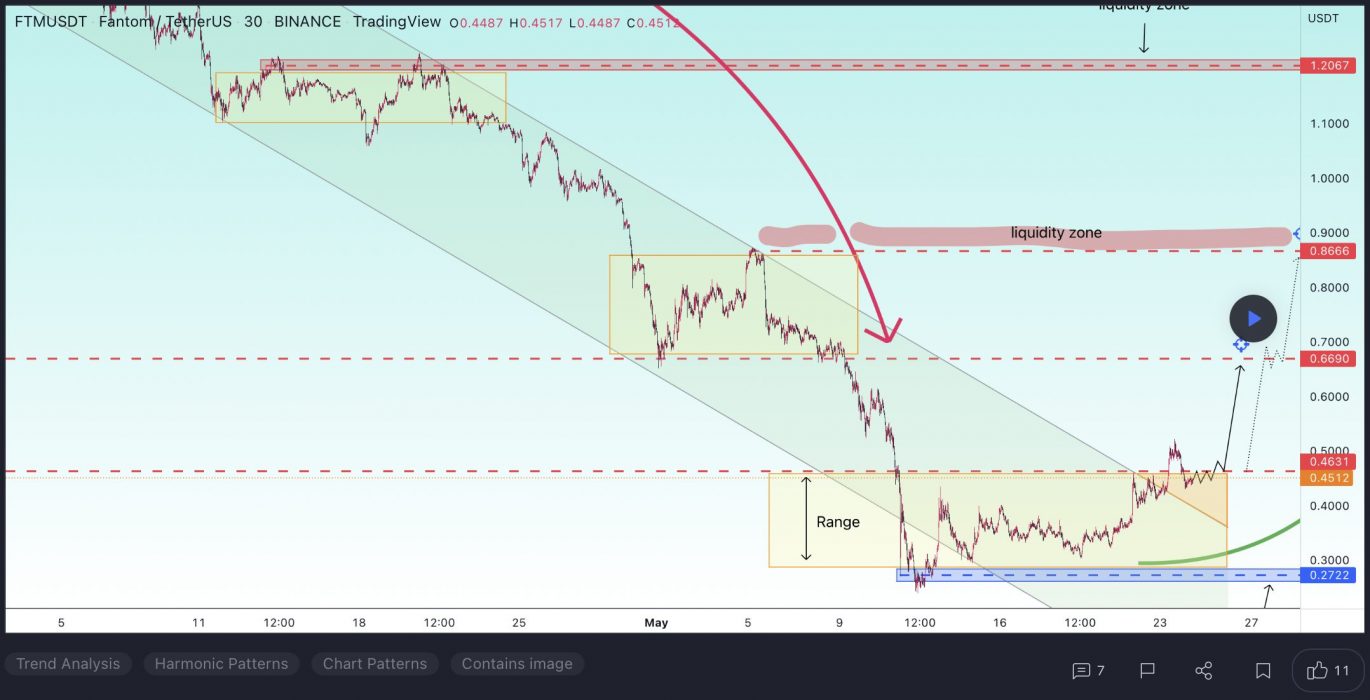
At the time of writing, FTM is ranked the 50th cryptocurrency globally and the current price is US$0.4108. Let’s take a look at the chart below for price analysis:

Source: TradingView

FTM‘s bounce during Q1 ran into resistance near the old monthly highs. This rejection created a set of relatively equal highs near $1.62, possibly forming the next bullish leg’s target.

Currently, the price is testing possible support near the weekly open, around $0.4011. This level also has confluence with the 80.6% retracement of the current local range and the 18 and 40 EMAs. 

If this level fails to provide support, a zone from $0.3834 to $0.3530 might mark a possible swing low or consolidation area. This zone is between the 65.8% and 78.6% retracement of early August’s swing.

A more bearish tone in the market could propel the price lower. The lows, near $0.3230, might mark an area of possible support as well as a bearish target.

3. Tezos (XTZ)

Tezos XTZ is a blockchain network that’s based on smart contracts in a way that’s not too dissimilar to Ethereum. However, there’s a big difference: Tezos aims to offer infrastructure that is more advanced – meaning it can evolve and improve over time without any danger of a hard fork. This is something both Bitcoin and Ethereum have suffered since they were created. People who hold XTZ can vote on proposals for protocol upgrades that have been put forward by Tezos developers.

XTZ Price Analysis

At the time of writing, XTZ is ranked the 37th cryptocurrency globally and the current price is US$2.05. Let’s take a look at the chart below for price analysis:

Source: TradingView

XTZ‘s 70% drop since late March saw a second leg after last month’s market-wide drop ran the previous consolidation’s stops.

The level near $2.50 is providing some resistance. However, continuation through the monthly high at $2.32 is not out of the question. Aggressive bulls might bid in the current region near $2.00. 

If the price runs the recent swing low, bulls might bid in the gap near $1.92. A deeper retracement could reach near the early monthly level and a gap near $1.86. The region near $1.80 and $1.73 may also provide some support during a deeper retracement.

Learn How to Trade Live!

Join Dave and The Crypto Den Crew and they’ll show you live on a webinar how to take your crypto trading to the next level.

Where to Buy or Trade Altcoins?

These coins have high liquidity on Binance Exchange, so that could help with trading on AUD/USDT/BTC pairs. And if you’re looking at buying and HODLing cryptos, then Swyftx Exchange is an easy-to-use popular choice in Australia.

Categories
Crypto News Kava Market Analysis Trading UFO Gaming Victoria VR

Top 3 Coins to Watch Today: KAVA, UFO, VR – May 24 Trading Analysis

Let’s take a closer look at today’s altcoins showing breakout signals. We’ll explain what the coin is, then dive into the trading charts and provide some analysis to help you decide.

1. Kava.io (KAVA)

KAVA is a cross-chain DeFi lending platform that allows users to borrow USDX stablecoins and deposit a variety of cryptocurrencies to begin earning a yield. The Kava DeFi hub operates as a decentralised bank for digital assets, allowing users to access a range of decentralised financial services, including its native USD-pegged stablecoin, USDX, as well as synthetics and derivatives. Through Kava, users are able to borrow USDX tokens by depositing collateral, effectively leveraging their exposure to crypto-assets.

KAVA Price Analysis

At the time of writing, KAVA is ranked the 85th cryptocurrency globally and the current price is US$2.83. Let’s take a look at the chart below for price analysis:

Source: TradingView

KAVA dropped 75% during the May crash, running bulls’ stops below a significant swing low at $2.109 and almost reaching bulls’ stops near $1.123.

The price has bounced and might have created support near $2.611. This level is near the upper portion of last week’s consolidation and the 9 EMA. 

If this level breaks, bulls might look to $2.039 as the next possible support. The monthly chart shows inefficient trading at this level, which is at the base of the recent rally and could require another test.

An inefficiently traded area on the daily chart from $3.020 to $3.342 may offer some resistance. This area overlaps with the February and March consolidation low and contains the 40 EMA.

If bulls break through this level, $3.528 to $4.066 may be the next target. This zone is inefficiently traded on the weekly chart, overlaps with the 2022 yearly open, and borders the bottom of April’s last rally before the price plunged.

A more bullish market might target bears’ stops at relatively equal swing highs and an old area of monthly rejection near $5.655. 

However, the market is currently bearish. This bearishness increases the odds that the price could first visit possible support near $1.292. Here, bulls have stops under a significant swing low, and the monthly chart shows inefficient trading.

2. UFO Gaming (UFO)

UFO Gaming UFO is a decentralised gaming platform with play-to-earn elements, NFTs, and DeFi functionality such as staking. Its first game is Super Galactic, an RPG/arcade action game with its own NFT collection combined with an auto battler. UFO Gaming is built on Ethereum, but its games are integrated with Immutable X, a layer-two scaling solution for NFT projects on Ethereum. UFO Gaming has sealed several high-impact partnerships with projects such as Kadena, Merit Circle, Citizen X, Polygon and ShibaSwap.

UFO Price Analysis

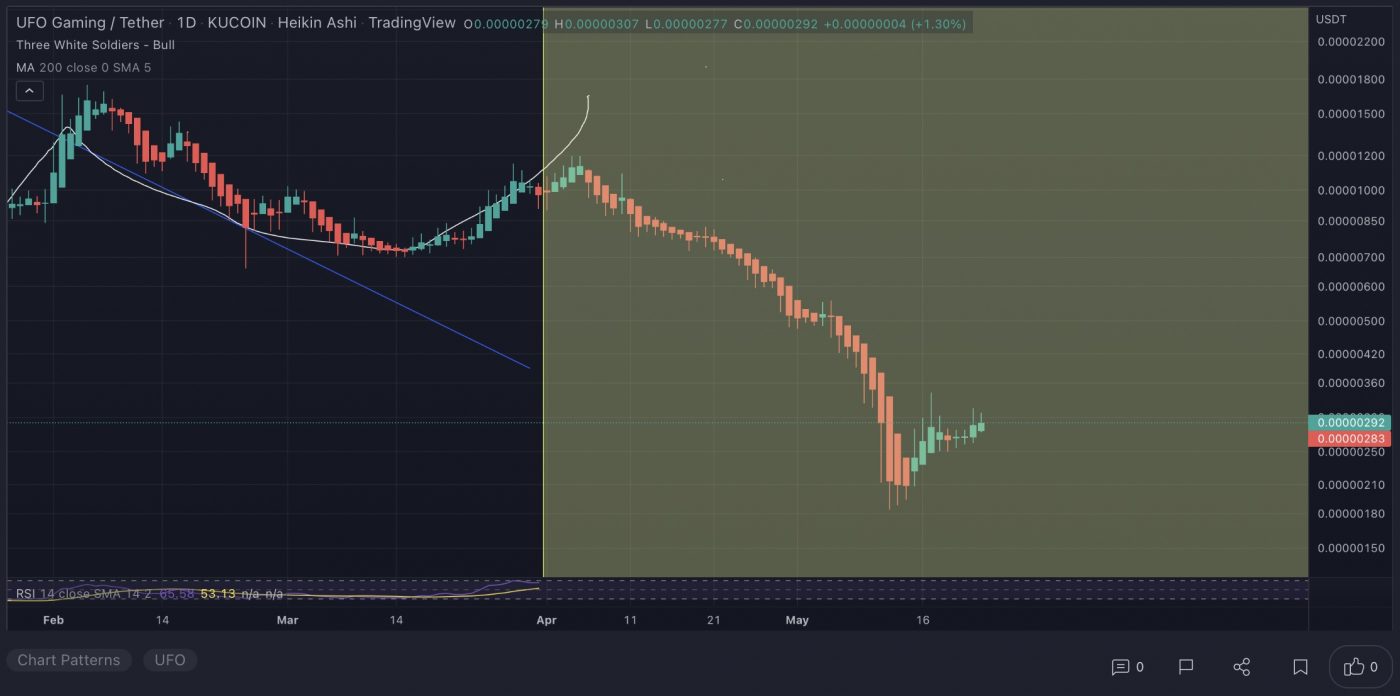
At the time of writing, UFO is ranked the 350th cryptocurrency globally and the current price is US$0.000002829. Let’s take a look at the chart below for price analysis:

Source: TradingView

UFO has dropped 84% from its April high, running bulls’ stops below relatively equal lows near $0.000002088.

An inefficiently traded area on the daily chart, from $0.000002458 to $0.000002178, might provide support during a retest. Bulls may see a retest of this level around May 25’s staking dApp launch as traders take profits with the news.

However, the strong bearish trend might make bulls wary of a run under the recent swing low. Bulls could watch for signs of support down to approximately $0.000001557, which saw accumulation before a strong rally in August 2021.

Below this level, $0.000001030 may provide the next notable support. This level saw significant buying in June before 2021’s bull run.

The price might find its first high probability resistance between $0.000003775 and $0.000004023. This area is in the upper half of the most recent swing and shows inefficient trading on the daily chart.

Above this resistance, April’s fast drop may require re-trading. Price action varies across exchanges, making accurate prices impossible to determine. Traders could watch for resistance in an area that shows inefficient trading from near the $0.000007120 swing low up to approximately $0.000008786.

3. Victoria VR (VR)

Victoria VR is a blockchain-based MMORPG in Virtual Reality with Realistic Graphics built on Unreal Engine, created and owned by its users. The whole world is built to be a universal platform for all virtual realities, games, and decentralised applications, collectively creating a Metaverse – a shared virtual realm, the 3D internet. In the Victoria VR World, there will be games, quests, never-ending adventure, virtual galleries, and The Big Market VR where you can exchange NFTs in 3D! In addition, users will be rewarded for each of their activities in the VR world.

VR Price Analysis

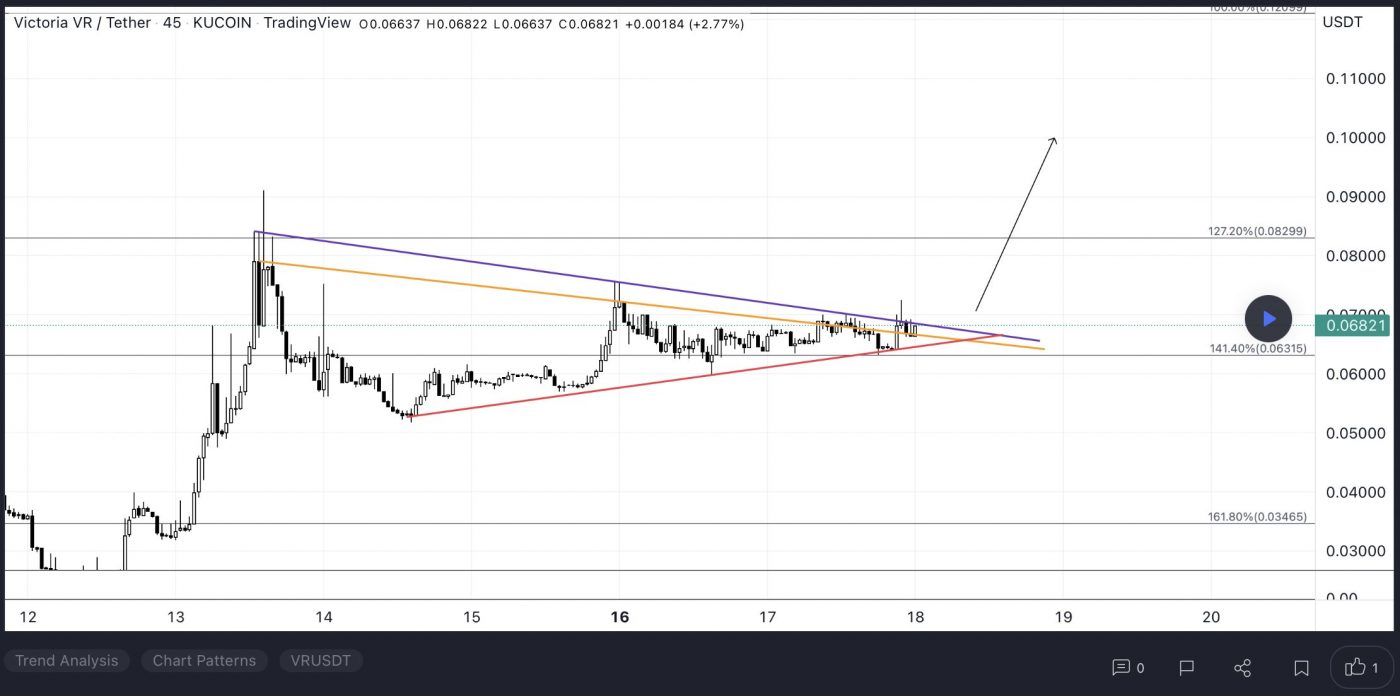
At the time of writing, VR is ranked the 443rd cryptocurrency globally and the current price is US$0.05974. Let’s take a look at the chart below for price analysis:

Source: TradingView

VR has dropped 91% from its March high as it searches for a bottom.

A test of $0.02232 led to a sharp 308% rally over two days. This rally may have created support between $0.05500 and $0.03990, where the daily chart shows inefficient trading.

However, the chart shows a strong bearish bias on higher timeframes. Bulls might be cautious, concerned about a run under the recent swing low at $0.02232. Under this low, there is no historical price action to give precise support levels.

An inefficiently traded area on the daily chart near $0.08764 rejected the price and might provide resistance again. This level has confluence with the 40 EMA.

A rally through this high may reach the next inefficiently traded area, near $0.10109. This level is near the May monthly open.

If the market turns significantly more bullish, the price could reach the late-April consolidation near $0.14148. A rally to this level might try to test inefficient trading on the weekly chart, near $0.16752. The upper portion of this zone has confluence with March-to-May’s 61.8% retracement.

Learn How to Trade Live!

Join Dave and The Crypto Den Crew and they’ll show you live on a webinar how to take your crypto trading to the next level.

Where to Buy or Trade Altcoins?

These coins have high liquidity on Binance Exchange, so that could help with trading on AUD/USDT/BTC pairs. And if you’re looking at buying and HODLing cryptos, then Swyftx Exchange is an easy-to-use popular choice in Australia.
Categories
Ankr Crypto News Curve DAO Token Market Analysis Trading Verge

Top 3 Coins to Watch Today: XVG, ANKR, CRV – May 23 Trading Analysis

Let’s take a closer look at today’s altcoins showing breakout signals. We’ll explain what the coin is, then dive into the trading charts and provide some analysis to help you decide.

1. Verge (XVG)

Verge XVG is a privacy-focused cryptocurrency and blockchain that seeks to offer a fast, efficient, decentralised payments network that improves on the original Bitcoin blockchain. It includes additional privacy features including integrating the anonymity network Tor into its wallet, called Verge Pay, and providing the option of sending transactions to stealth addresses. The project describes itself as community-driven, relying on volunteers and priding itself on being open-source.

XVG Price Analysis

At the time of writing, XVG is ranked the 302nd cryptocurrency globally and the current price is US$0.005272. Let’s take a look at the chart below for price analysis:

Source: TradingView

XVG has retraced nearly 80% from its Q1 highs and appears poised to continue its downtrend. If Monday’s trading fails to reach $0.006071, resistance might begin just above the current price at $0.005635. 

Just above this level rests higher-timeframe resistance from $0.006399 to $0.007132. Inside this broad zone, $0.007509 is an inefficiently traded area, and $0.007817, the monthly open, might offer the most sensitivity.

A more significant rally would likely find resistance between $0.008050 and $0.008355, where the monthly chart shows inefficient trading. However, the current bear market decreases the probability of a rally reaching this far.

The quarterly chart shows a broad zone of possible support near $0.005107. Inside this zone, $0.004856 – near the 90% extension of the last retracement upward – offers a higher probability for a bounce or bottom. This level is near the midpoint of Q4 2021’s massive rally. 

However, the swing low at $0.004352 and an inefficiently traded area below, inside late 2019’s consolidation, offers an attractive target for bears. Bulls should be cautious with entries until the trend flips bullish.

2. Ankr (ANKR)

ANKR originated as a solution that utilises shared resources in order to provide easy and affordable blockchain node hosting solutions, and has since built a marketplace for container-based cloud services through the usage of shared resources. It is a platform that enables the sharing economy, where any customer can access resources at a more affordable rate, while also providing enterprises with the ability to monetise their spare computing power. It is unique in the way that it is the first to use trusted hardware, and this ensures a high level of security.

ANKR Price Analysis

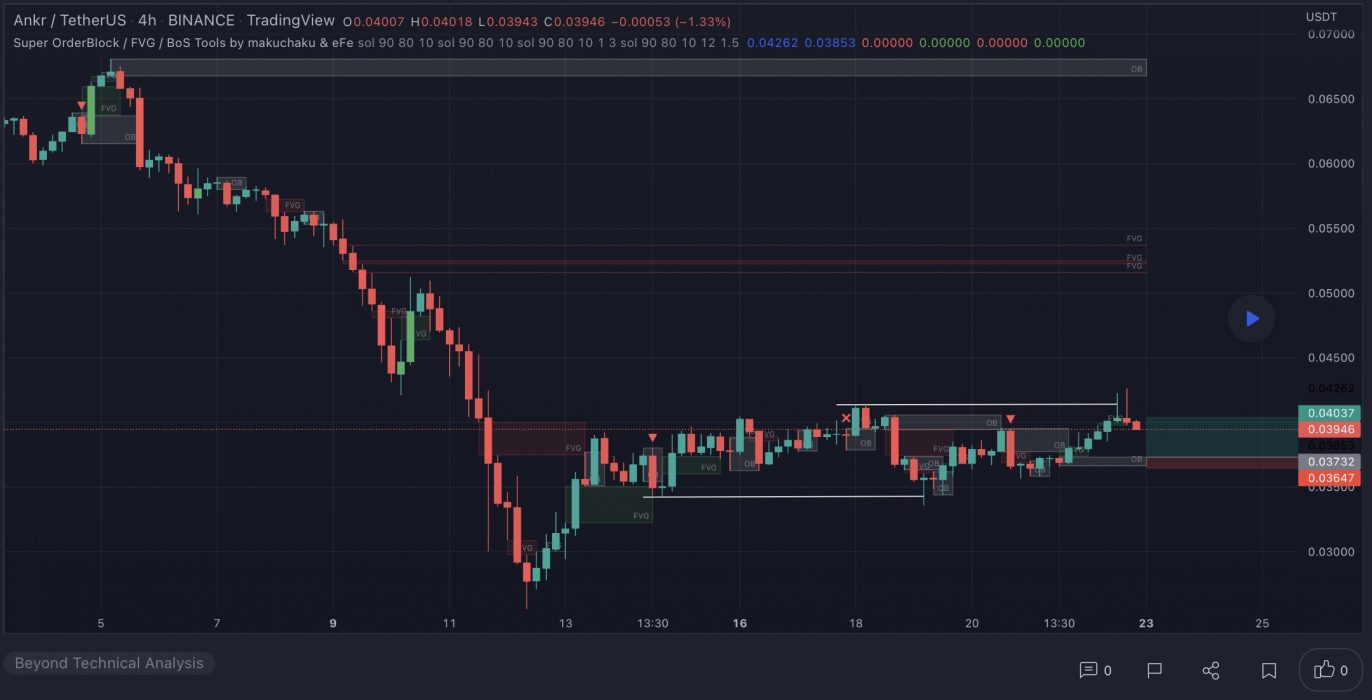
At the time of writing, ANKR is ranked the 14th cryptocurrency globally and the current price is US$0.04024. Let’s take a look at the chart below for price analysis:

Source: TradingView

ANKR continues to set monthly lows in its downward trend. Support might be found in the daily gap above the monthly open near $0.03695, though a deeper retracement is likely to target the relatively equal lows into support near $0.03225. 

The daily gap near $0.03066 could also provide support. However, another gap inside the down candles, around $0.02732, provides the highest chances of solid support while offering a high risk-reward entry.

There is currently no resistance overhead since the price is in discovery. Extensions hint at the areas around $0.04995 and $0.05463 as reasonable take-profit zones.

3. Curve DAO Token (CRV)

Curve CRV is a decentralised exchange for stablecoins that uses an automated market maker (AMM) to manage liquidity. Curve has gained considerable attention by following its remit as an AMM specifically for stablecoin trading. The launch of the DAO and CRV token brought in further profitability, given CRV’s use for governance, as it is awarded to users based on liquidity commitment and length of ownership. The explosion in DeFi trading has ensured Curve’s longevity, with AMMs turning over huge amounts of liquidity and associated user profits.

CRV Price Analysis

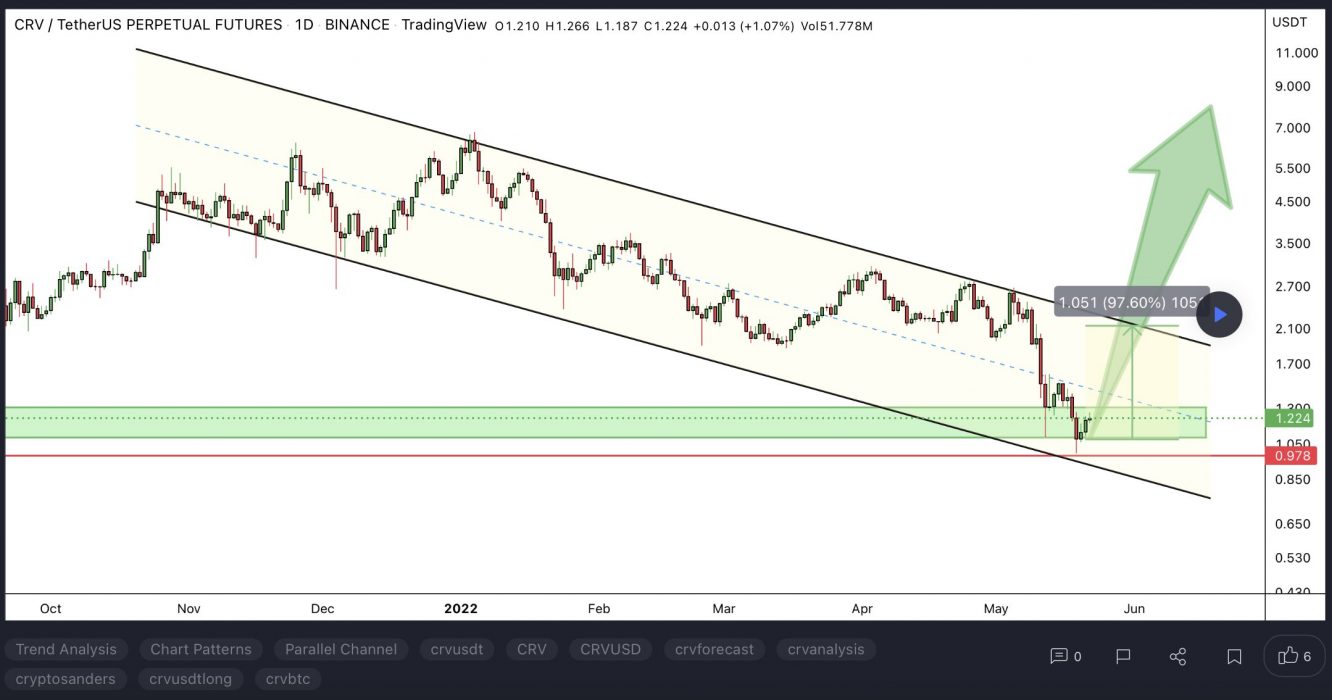
At the time of writing, CRV is ranked the 80th cryptocurrency globally and the current price is US$1.24. Let’s take a look at the chart below for price analysis:

Source: TradingView

Last week, traders enjoyed 20% gains at CRV‘s peak before the price confirmed stiff resistance beginning at $1.30.

The 1-Day chart shows that support may be forming between $1.15 and $1.05, near the weekly open. Aggressive bulls could enter in this area, although safer entries may be found much further below near $1.00 and $0.9781 after a sweep of the current consolidation’s swing lows.

The last swing high near $1.38 provides a likely first target if the price does bounce from this region. Beyond this swing high, the 1.0 extension near $1.47 and the 2.0 extension near $1.60 and $1.72 may provide the next major targets.

Learn How to Trade Live!

Join Dave and The Crypto Den Crew and they’ll show you live on a webinar how to take your crypto trading to the next level.

Where to Buy or Trade Altcoins?

These coins have high liquidity on Binance Exchange, so that could help with trading on AUD/USDT/BTC pairs. And if you’re looking at buying and HODLing cryptos, then Swyftx Exchange is an easy-to-use popular choice in Australia.