Categories
Binance Crypto News Market Analysis Swyftx Trading

Hive Surged +65% in a Single Day Amid CryptoPlug On The Block Event

Hive is trading in an uptrend, like many other Altcoins. The cryptocurrency HIVE just went up +65% in a single day by breaking a falling wedge pattern with strong buying volume on multiple exchanges and surges over +92% in a week.

What is HIVE?

Hive is a decentralised information sharing network with an accompanying blockchain-based financial ledger built on the Delegated Proof of Stake (DPoS) protocol. Hive supports many different types of information sharing applications. Myriad dapps, APIs and front-ends contribute to a general and straightforward accessibility of data, transactions and records, so that this existing diversity and utility ensure that the ecosystem is welcoming to content creators, consumers, investors and builders.

HIVE Price Analysis

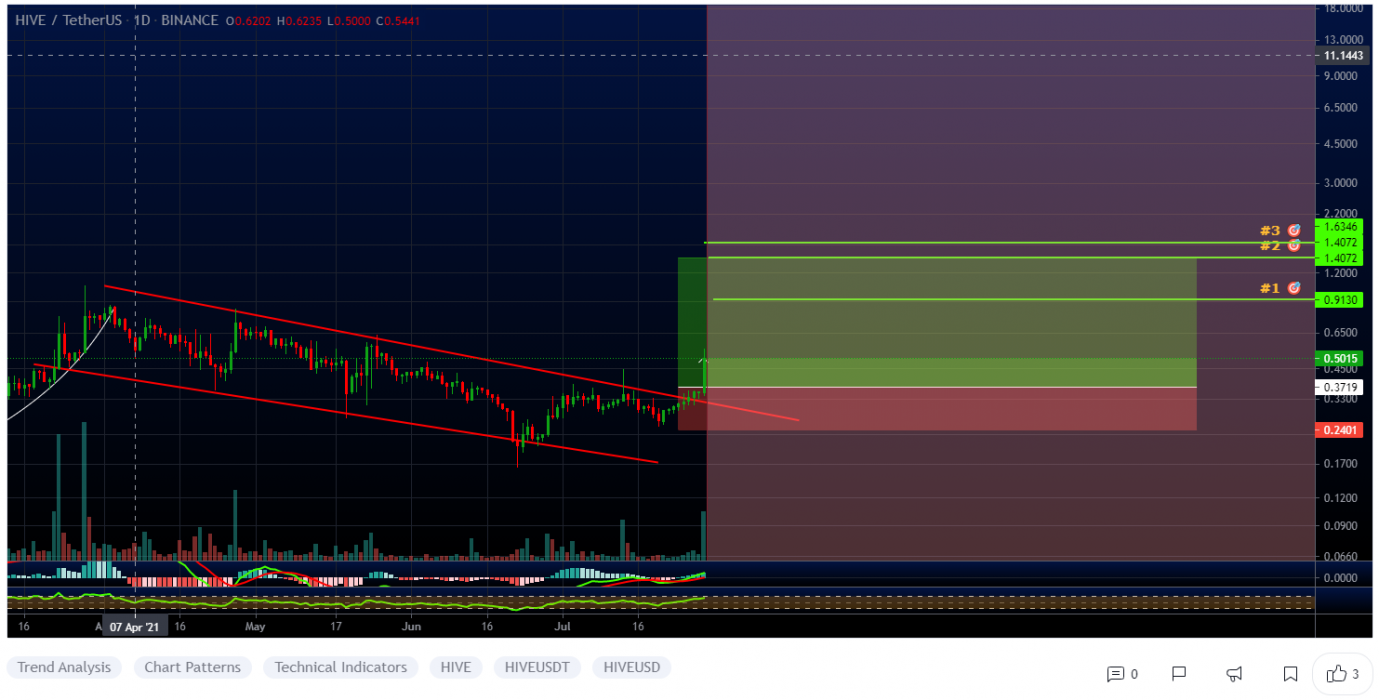
At the time of writing, HIVE is ranked 154th cryptocurrency globally and the current price is A$0.6775. This represents a +92% increase since July 23, 2021 (seven days ago), as shown in the chart below.
Source: TradingView

After looking at the above 1-Day candle chart, we can clearly see that HIVE was trading inside the falling wedge pattern on the HIVE/USDT pair. The first resistance was on the A$0.4755 price levels which HIVE broke with a strong bullish trend buying volume and is now heading towards the previous monthly high price at A$0.7428. Seeing that many Altcoins are holding a strong position this week after the recent bitcoin price recovery, HIVE may continue to increase in the uptrend if traders keep buying with high volume.

The chart seems to be in an cup and handle pattern, and the crypto market looks to be gearing up for something big again. First target is based on a fib, second is the cut and handle pattern, and the third is the golden fib.

“The Falling Wedge is a bullish pattern that begins wide at the top and contracts as prices move lower. This price action forms a cone that slopes down as the reaction highs and reaction lows converge.”

What Do the Technical Indicators Say?

TradingView indicators (on the one-day window) mainly suggest HIVE as a Strong Buy, except the Oscillators which indicate HIVE as a Neutral.

So Why Did HIVE Breakout?

General market sentiment seems to suggest cryptos are hopefully turning back bull run season after recent massive price corrections. Another reason for this sudden pump in price could be whales secretly buying HIVE for the next Altcoins rally. Recent news was also announced regarding CryptoPlug on the Block Event.

Where to Buy or Trade HIVE?

Hive has high liquidity on the Binance exchange, which could help for trading HIVE/BTC or HIVE/USDT pairs. Instead, if you’re looking at buying and HODLing cryptos, then Swyftx Exchange is a popular choice in Australia. However, you can also buy these coins from different exchanges listed on Coinmarketcap.

Categories
Binance ChainLink Crypto News Market Analysis Swyftx Trading

Top 3 Coins To Watch Today: LINK, DEGO, FTM July 29 Trading Analysis

Let’s take a closer look at today’s altcoins showing breakout signals. We’ll explain what the coin is, then dive into the trading charts and provide some analysis to help you decide.

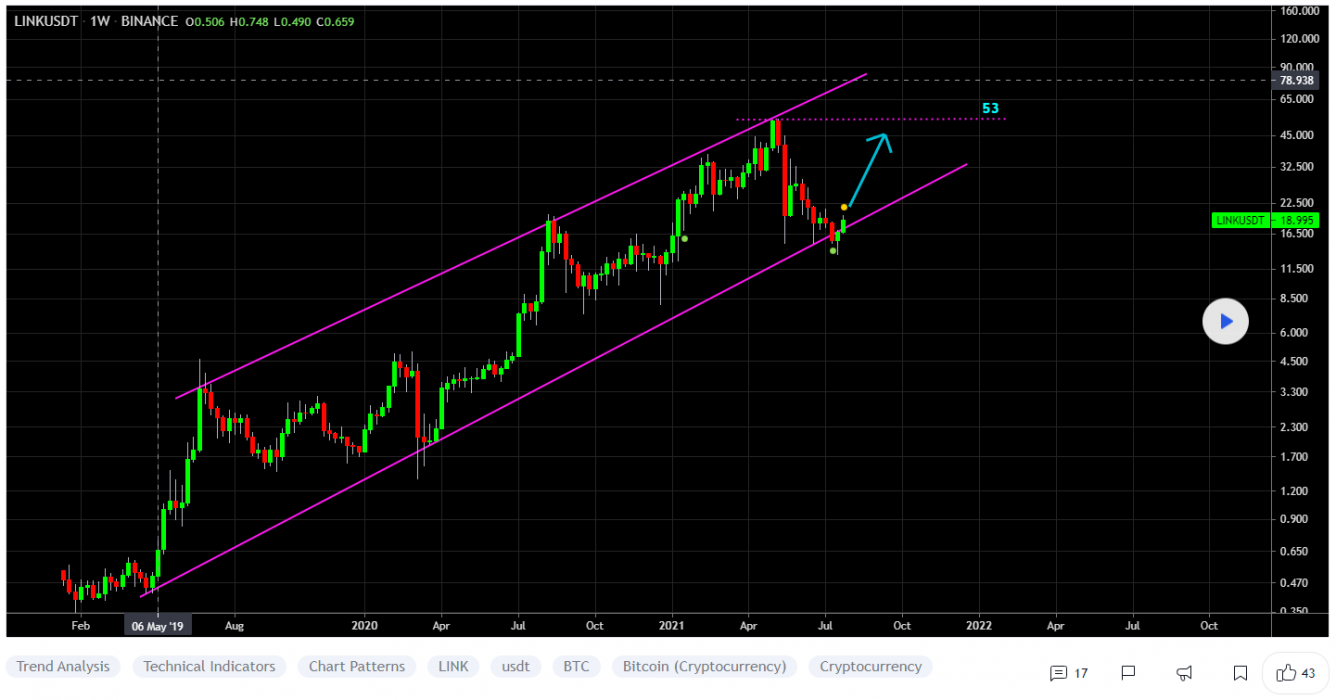
1. Chainlink (LINK)

The Chainlink Network LINK is driven by a large open-source community of data providers, node operators, smart contract developers, researchers, security auditors, and more. The company focuses on ensuring that decentralized participation is guaranteed for all node operators and users looking to contribute to the network. Chainlink allows blockchains to securely interact with external data feeds, events, and payment methods, providing the critical off-chain information needed by complex smart contracts to become the dominant form of digital agreement.

LINK Price Analysis

At the time of writing, LINK is ranked the 14th cryptocurrency globally and the current price is A$26.18. Let’s take a look at the chart below for price analysis:

Source: TradingView

LINK during Q2 provided respectable 210% gains for bulls who bought at April’s monthly open, with the price finding resistance near A$24.74

If bulls take back control this week, the top of the former gap begins at A$22.14 may provide support for at least a short-term bounce. The top of the consolidation range starting near A$20.32 is more likely to provide substantial support.

The most robust support is likely to be found in the overlapping consolidation ranges between A$18.23 and A$17.46, with a sharp slice through these levels possibly suggesting the end of the bull run.

The region from approximately A$29.81 to the most recent swing high is likely to provide some resistance. The swing high provides a reasonable first target for a possible next leg up. 

If this high breaks, the 1.0 extension near A$33.27 and the 2.0 extension near A$38.72 may provide the next primary targets.

2. Dego Finance (DEGO)

Dego Finance DEGO is a decentralized ecosystem that offers a diverse combination of the non-fungible token (NFT) and decentralized finance (DeFi) tools. It is an independent, open NFT ecosystem. Any user is allowed to launch an NFT and initiate mining, auctions, and trading, covering the entire lifecycle of the product. Dego’s NFT protocol is a cross-chain, second-layer infrastructure for Blockchain projects that can be leveraged for user acquisition and token distribution.

DEGO Price Analysis

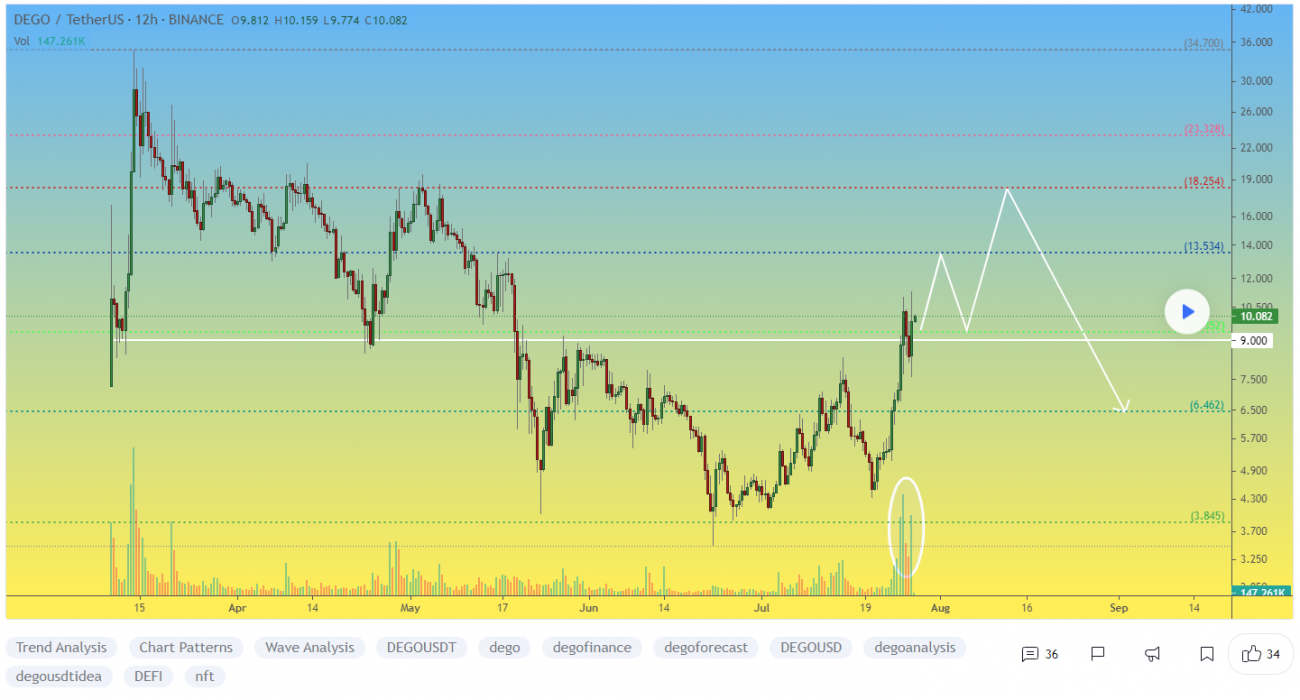
At the time of writing, DEGO is ranked the 319th cryptocurrency globally and the current price is A$13.43. Let’s take a look at the chart below for price analysis:

Source: TradingView

This month’s bulls enjoyed 190% gains at DEGO’s peak before the price confirmed stiff resistance beginning at A$14.37

The 12-hour chart shows that support may be forming between A$9.57 and A$8.89, near the weekly open. 

Aggressive bulls could enter in this area, although safer entries may be found much further below near A$8.12 and A$7.56 after a sweep of the current consolidation’s swing lows.

The last swing high near A$16.37 provides a likely first target if the price does bounce from this region. Beyond this swing high, the 1.0 extension near A$19.64 and the 2.0 extension near A$23.85 may provide the next major targets

3. Fantom (FTM)

Fantom FTM is a directed acyclic graph (DAG) smart contract platform providing decentralized finance (DeFi) services to developers using its own bespoke consensus algorithm. Together with its in-house token FTM, Fantom aims to solve problems associated with smart-contract platforms, specifically transaction speed, which developers say they have reduced to under two seconds.

FTM Price Analysis

At the time of writing, FTM is ranked the 99th cryptocurrency globally and the current price is A$0.304. Let’s take a look at the chart below for price analysis:

Source: TradingView

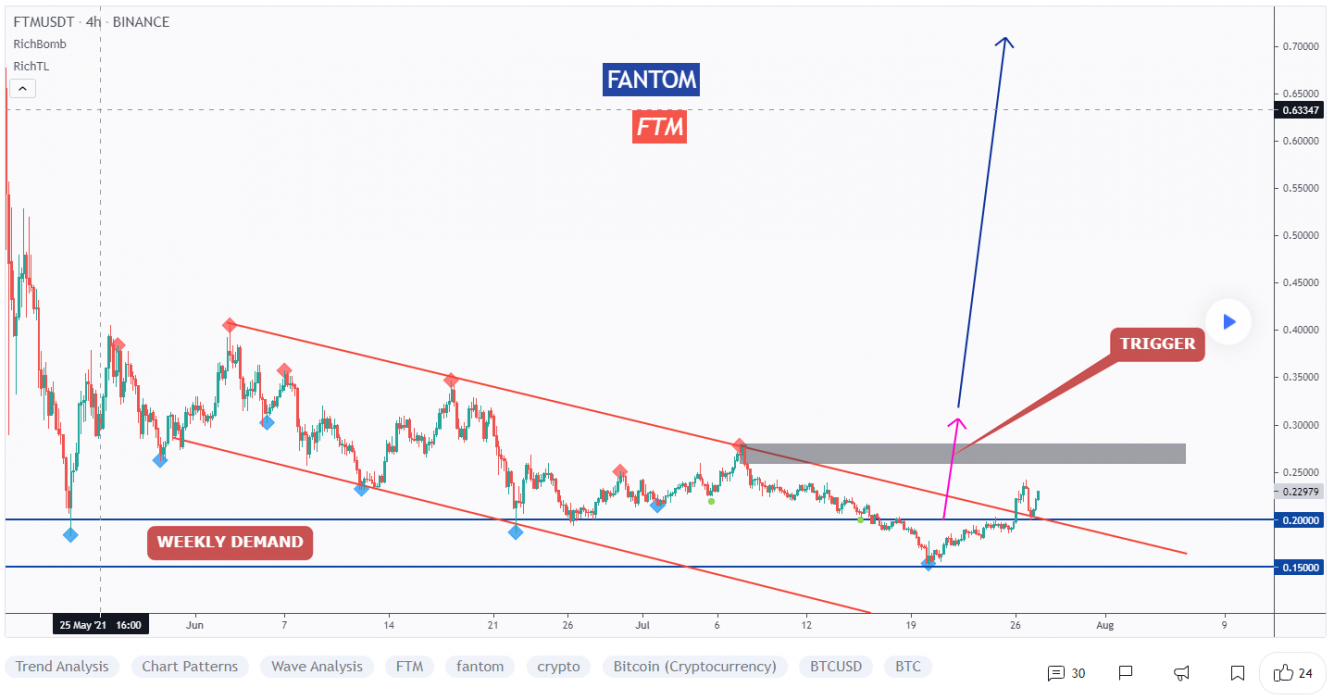
FTM’s 75% last week run retraced almost to its origin, narrowly missing probable support near A$0.2755 before bears swatted down the bounce near resistance around A$0.2587.

With the daily gap between A$0.2344 and A$0.2173 almost filled in a single wick, the price may not need to revisit areas below this level. However, the safer entry is still in probable support between A$0.1925 and A$0.1847, which would also sweep the lows of last week’s bounce.

The relatively equal highs near A$0.3569 provide a likely first target on lower timeframes. However, the resistance beginning at A$0.3741 may initially suppress a further move up.

A clean break through this resistance will need to contend with the next resistance near A$0.3958 under the last swing high. This swing high at A$0.4316 gives a reasonable take-profit area before a possible move to the 1.0 extension near A$0.4833.

Where to Buy or Trade Altcoins?

These coins have high liquidity on Binance Exchange, so that could help with trading on AUD/USDT/BTC pairs. And if you’re looking at buying and HODLing cryptos, then Swyftx Exchange is an easy-to-use popular choice in Australia. However, you can also buy these coins from different exchanges listed on Coinmarketcap.


Categories
Binance Crypto Exchange Regulation Trading

Crypto Exchanges Are Reducing Leveraged Trading Amid Regulation Pressure

The CEOs of two major crypto exchanges have announced they will be lowering their maximum leverage limit for futures trades. These moves were made amid an impending regulatory storm.

Both FTX and Binance have lowered their maximum leverage limits for futures trading to 20 times leverage. The announcements follow the duly expected release of a new regulatory framework to be implemented by the US Securities and Exchange Commission (SEC) by July 28.

Binance previously had a maximum leverage and margin on Bitcoin (BTC) against Tether (USDT) contracts to 125 times leverage. At that level, a 100 USDT collateral deposit on Binance Futures will allow users to hold 12,500 USDT in BTC.

Binance’s new rule states that new users with registered futures accounts of less than 30 days will not be allowed to open positions with leverage exceeding 20 times. However, leverage limits for new users will gradually increase after one month from registration.

The harsh reality of leveraged trading is that the majority of people who trade in those markets lose out, especially in volatile markets like cryptocurrencies. So not only do you lose your initial investment, but also any additional collateral you may have posted to keep the position open. For many who are new to the crypto market, leveraged trades could put a big hole in the bank.

Binance also recently stopped support for its stock tokens following a slap on the wrist from the Hong Kong SEC. Exchanges are likely worried about the regulatory screws tightening. Huobi has since also suspended the service to Chinese users.

Is Leverage to Blame for Market Volatility?

A July 23 New York Times article also criticised high-leverage trading in crypto as risky. The article implied impending regulatory moves against high-leverage margin trading, citing Timothy Massad, a former US SEC chairman.

Binance CEO Changpeng Zhao acknowledged that “volatility is amplified by the leverage”, according to the NYT article. But FTX CEO Sam Bankman counters by saying: “Nearly every crypto derivatives exchange allows it, and nearly every one will say the same thing: It’s a tiny fraction of volume and positions […] It’s also not what chiefly contributes to volatility.”

This is business as usual for crypto – a market that is known to be highly volatile and exposed to high levels of product leverage on these exchanges. [It’s] a perfect recipe for liquidations that can cut both ways depending on sharp spot movements to the up or downside.

Ryan Todd, research analyst, The Block

Binance De-Risking Operations Ahead of Regulatory Clampdown?

Binance has implemented various changes and has stayed abreast with regulatory requirements as they come up. With regulation becoming clearer, exchanges are trying to not get caught off guard while providing infrastructure for their clients.

Binance Australia is assisting its customers in one such way by partnering with Australian startup Koinly to assist its Aussie customers with crypto tax reporting.

Categories
Binance Crypto News Market Analysis Solana Swyftx Theta Trading

Top 3 Coins To Watch Today: SOL, THETA, HBAR July 28 Trading Analysis

Let’s take a closer look at today’s altcoins showing breakout signals. We’ll explain what the coin is, then dive into the trading charts and provide some analysis to help you decide.

1. Solana (SOL)

Solana SOL is a highly functional open source project that banks on blockchain technology’s permissionless nature to provide decentralised finance (DeFi) solutions. The Solana protocol is designed to facilitate decentralised app (DApp) creation. It aims to improve scalability by introducing a proof-of-history (PoH) consensus combined with the underlying proof-of-stake (PoS) consensus of the blockchain.

SOL Price Analysis

At the time of writing, SOL is ranked the 15th cryptocurrency globally and the current price is A$38.22. Let’s take a look at the chart below for price analysis:

Source: TradingView

After a 250% run during May, SOL has been consolidating in a gap near A$35.28 from the past few weeks.

A sweep of the lows may have created support around A$28.55, which could give aggressive bulls a chance to get on board at the range lows. If the retracement continues, the price may find support near the gaps around A$27.94 and A$25.77.

The relatively equal daily highs at A$42.83 provide a potential first target. A break of the resistance near A$44.67 might reach resistance near A$48.00 and a sweep of the last high near A$53.42. 

If the price leaves the current low near A$45.87 intact, a bullish breakout from the current consolidation range could reach the extensions near A$56.37 and A$58.44.

2. Theta Network (THETA)

Theta Network THETA is a blockchain powered network purpose-built for video streaming. Launched in March 2019, the Theta mainnet operates as a decentralised network in which users share bandwidth and computing resources on a peer-to-peer (P2P) basis. Theta features its own native cryptocurrency token, THETA, which performs various governance tasks within the network, and counts Google, Binance, Blockchain ventures, Gumi, Sony Europe and Samsung as Enterprise validators, along with a Guardian network of thousands of community-run guardian nodes.

THETA Price Analysis

At the time of writing, THETA is ranked the 20th cryptocurrency globally and the current price is A$7.71. Let’s take a look at the chart below for price analysis:

Source: TradingView

Last week we saw 95% gains for THETA, but the bull run might not be over yet.

Resistance near A$7.80 is pinning the price down as it accumulates on an old monthly level near A$5.89. A sweep of this consolidation range could reach probable support near A$4.67, giving bulls a better risk-reward entry.

The last high at A$12.71 and a May high at A$16.87 are probable first targets. The area between A$11.27 and A$13.45 may provide some resistance, with extensions suggesting that A$14.35 may be a likely area of contention.

A break of this resistance could run as high as the extension at A$17.85 during this move.

3. Hedera Hashgraph (HBAR)

Hedera Hashgraph HBAR is a public network that allows individuals and businesses to create powerful decentralised applications (DApps). It is designed to be a fairer, more efficient system that eliminates some of the limitations that older blockchain-based platforms face, such as slow performance and instability. Unlike most other cryptocurrency platforms, Hedera Hashgraph isn’t built on top of a conventional blockchain. Instead, it introduces a completely novel type of distributed ledger technology known as a Hashgraph.

HBAR Price Analysis

At the time of writing, HBAR is ranked the 51th cryptocurrency globally and the current price is A$0.2702. Let’s take a look at the chart below for price analysis:

Source: TradingView

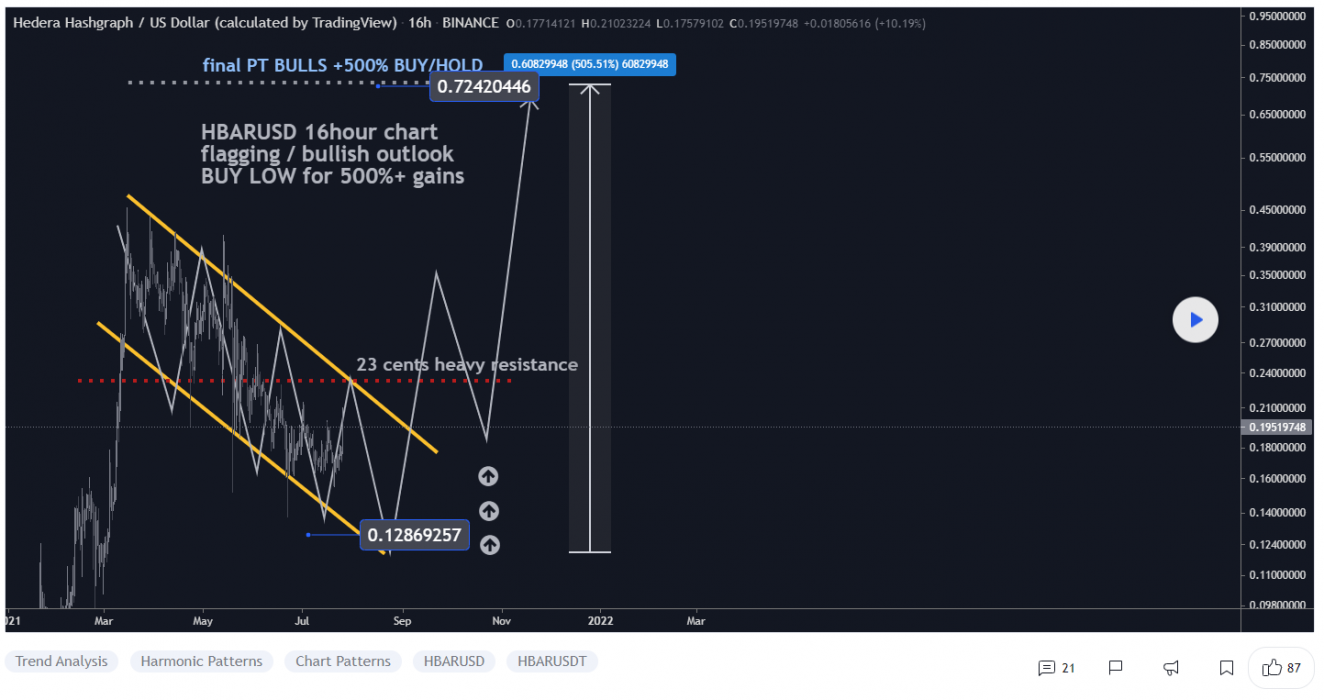
HBAR bears saw 48% retracement during July as the price approaches resistance from a weekly gap beginning at A$0.2855.

Support may have formed last weekend near A$0.2547, which would be confirmed by a strong move above this level and provide a probable area for entries. A gap beginning at A$0.2485 may also offer support if tested, along with the last movement’s base starting at A$0.2267.

Old overlapping levels and a previous move’s 2.0 extension make A$0.3541 to A$0.3862 a likely resistance area. If the price retraces near A$0.4017 before piercing this level to form a new 1.0 extension, an old monthly high near A$0.4325 may be the next target.

Where to Buy or Trade Altcoins?

These coins have high liquidity on Binance Exchange, so that could help with trading on AUD/USDT/BTC pairs. And if you’re looking at buying and HODLing cryptos, then Swyftx Exchange is an easy-to-use popular choice in Australia. However, you can also buy these coins from different exchanges listed on Coinmarketcap.

Categories
Binance Crypto News Market Analysis Swyftx Trading

Top 3 Coins To Watch Today: ETNA, EXRD, KAVA July 27 Trading Analysis

Let’s take a closer look at today’s altcoins showing breakout signals. We’ll explain what the coin is, then dive into the trading charts and provide some analysis to help you decide.

1. ETNA Network (ETNA)

ETNA Network is a one-stop shop for all things DeFi, NFTs and gaming. ETNA’s NFT Factory is an all-in-one marketplace and factory, the first NFT marketplace that facilitates spot trading of supported assets. The factory allows creators to easily mint digital assets and showcase them to collectors.

ETNA Price Analysis

At the time of writing, ETNA is ranked the 1278th cryptocurrency globally and the current price is A$0.3007. Let’s take a look at the chart below for price analysis:

Source: TradingView

NOTE: this coin is charted against the BNB pair

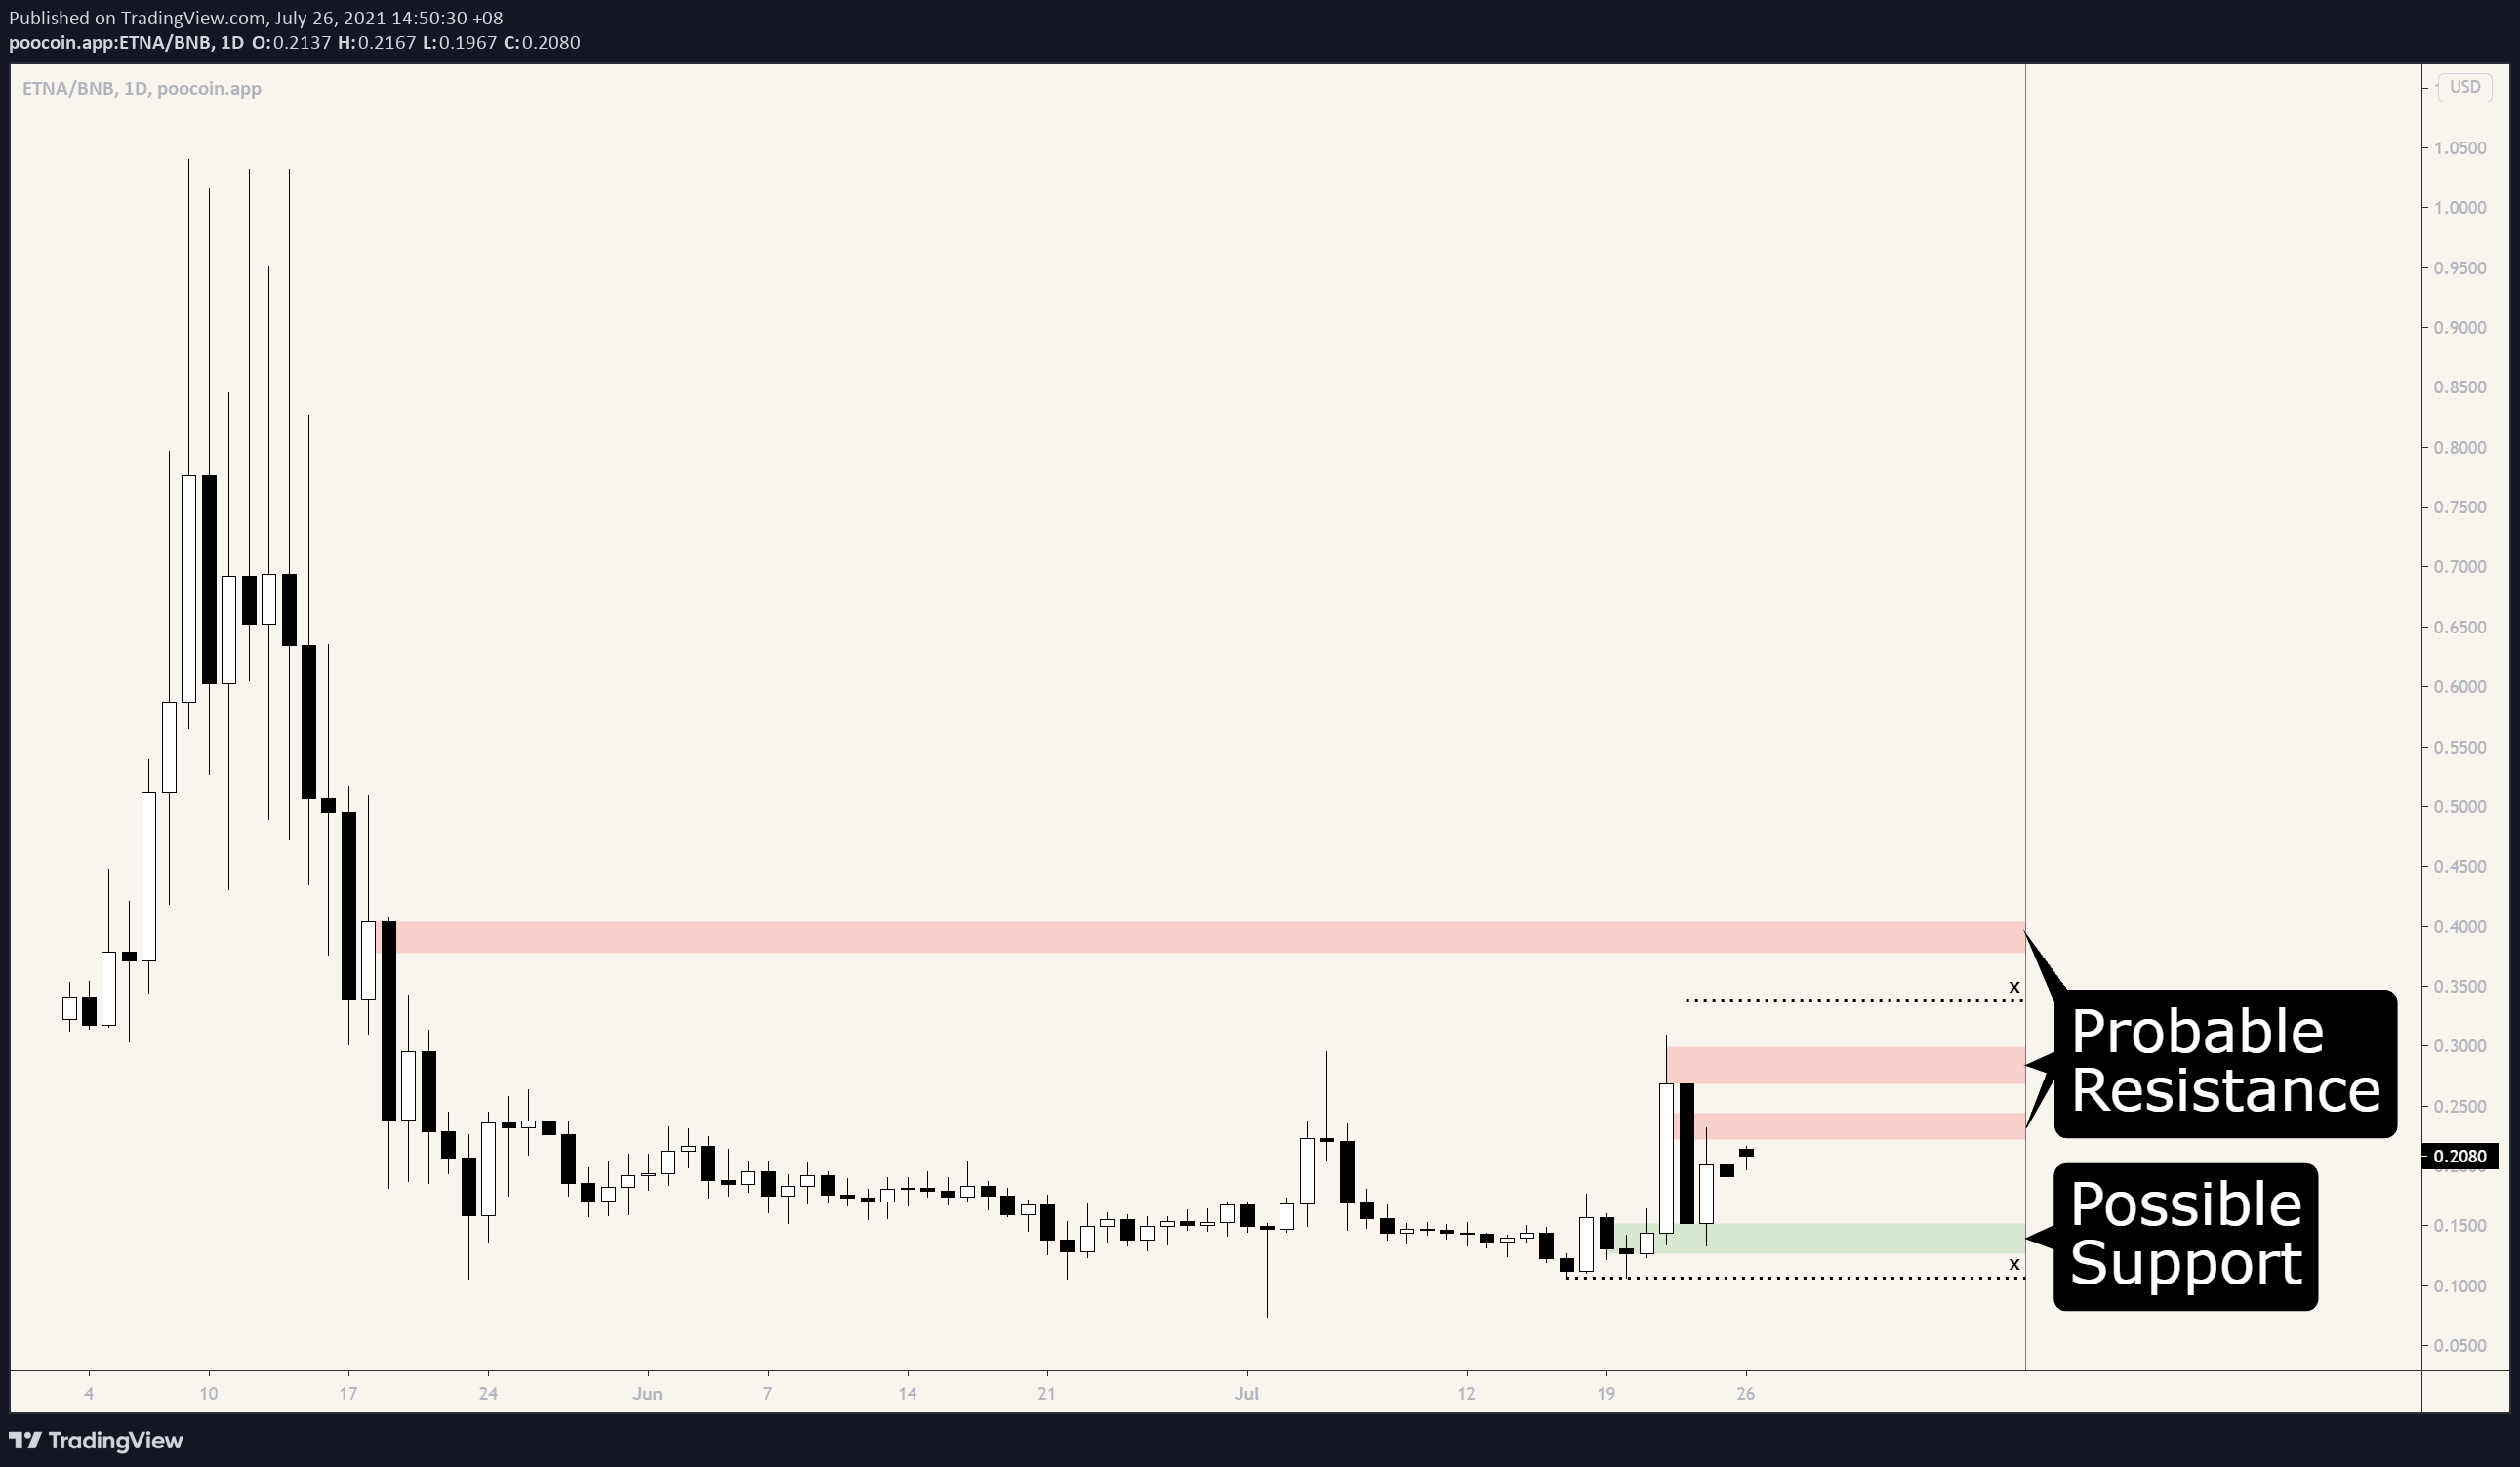
After a stunning 92% drop since early May, ETNA seems to have entered an accumulation phase.

The last few days have found resistance in the weekly level near A0$.2223, which may continue to hold the price down. The daily chart also shows resistance near A$0.2689, while the swing high at A$0.3375 gives a likely target if this resistance fails. A run above this level may reach the weekly gap with a high near A$0.3781.

The consolidation around A$0.1723 has provided support and could do so again. However, relatively equal daily lows near A$0.1561 give a tempting target for bears. Below this level, little exists to provide explicit support on the chart.

2. Radix (EXRD)

Radix EXRD is the first layer-one protocol specifically built to serve DeFi. Decentralised finance applications are currently built on protocols that are not fit for purpose, leading to congestion, hacks and developer frustration. Radix changes this by introducing a scalable, secure-by-design, composable platform with a DeFi-specific build environment to make it easy to build and launch scalable DeFi.

EXRD Price Analysis

At the time of writing, EXRD is ranked the 274th cryptocurrency globally and the current price is A$0.1992. Let’s take a look at the chart below for price analysis:

Source: TradingView

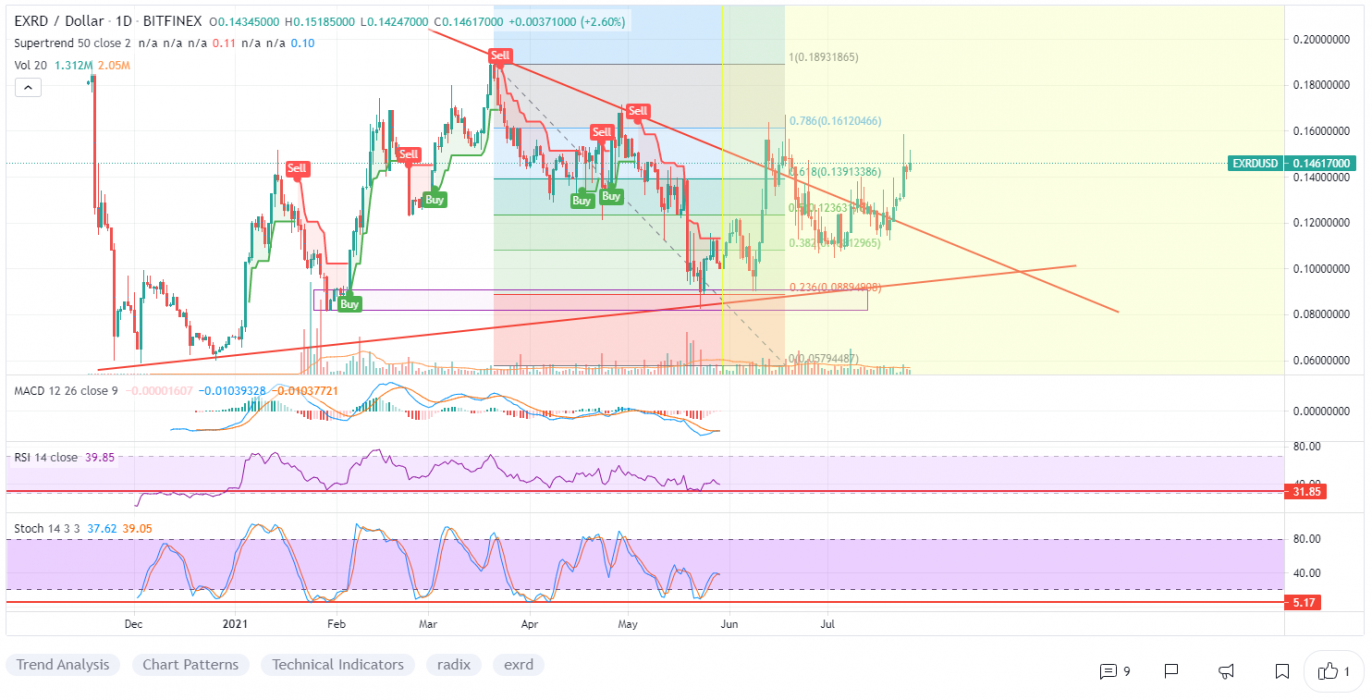
EXRD‘s nearly 57% drop since late March found a low in late May, with price action now trending upward through a higher-timeframe range.

The area beginning near A$0.2155 has provided strong resistance and may do so again. However, relatively equal highs near A$0.2389 offer a tempting target for bulls. A run of these highs may reach up into the daily gap near A$0.2437.

Aggressive bulls might add to their positions near A$0.1854. If the price breaks through this level, it may be reaching for the cluster of swing lows near A$0.1594 and A$0.1422. A more substantial move down may run stops below the relatively equal January and May lows, around A$0.1169, into the daily gap at this level.

3. Kava.io (KAVA)

Kava is a cross-chain DeFi lending platform that allows users to borrow USDX stablecoins and deposit a variety of cryptocurrencies to begin earning a yield. In addition to Kava’s USDX stablecoin, the Kava blockchain also includes the native KAVA token. This is a utility token used for voting on governance proposals and also functions as a reserve currency for when the system is undercollateralised.

KAVA Price Analysis

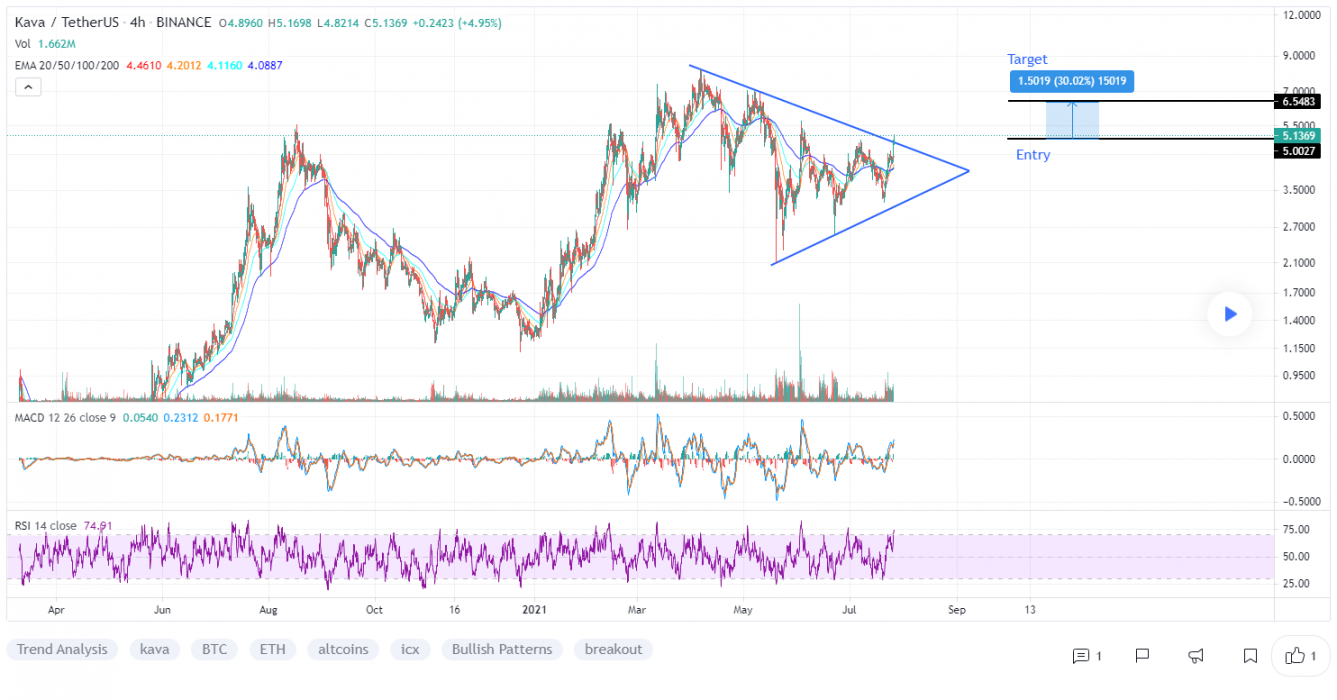
At the time of writing, KAVA is ranked the 114th cryptocurrency globally and the current price is A$6.12. Let’s take a look at the chart below for price analysis:

Source: TradingView

KAVA has been trading through a massive range since April, with the price showing mild bullishness during July.

Bulls bought at the level near A$4.28. The weekly level and daily gap near A$5.73 could prompt buyers to step in again as the price challenges the swing high and resistance around A$6.75. A strong move and acceptance above this level may reach for the swing highs at A$8.72 and A$9.99, which marks another area of resistance.

However, rejection from the current area may send the price down to retest support near A$4.81. Relatively equal lows around A$4.28 provide a rich target for a stop run. Sustained bearishness may reach the low near A$3.47 and possibly as low as A$2.86 into higher-timeframe support.

Where to Buy or Trade Altcoins?

These three coins have high liquidity on Binance Exchange, so that could help with trading on AUD/USDT/BTC pairs. And if you’re looking at buying and HODLing cryptos, then Swyftx Exchange is an easy-to-use popular choice in Australia. However, you can also buy these coins from different exchanges listed on Coinmarketcap.
Categories
Binance Crypto News Market Analysis Swyftx Trading

Venus XVS Surged +54% in a Single Day amid XVS listed on Poloniex Defi Innovation Zone

Venus XVS is trading in an uptrend, like many other Altcoins. The cryptocurrency XVS just went up +54% in a single day by breaking a falling wedge pattern with strong buying volume on multiple exchanges and surges over +86% in a week.

What is XVS?

Venus XVS is an algorithmic money market and synthetic stablecoin protocol launched exclusively on Binance Smart Chain (BSC). The protocol introduces simple-to-use crypto-asset lending and borrowing solution to the decentralized finance (DeFi) ecosystem, enabling users to directly borrow against collateral at high speed while losing less to transaction fees. The governance of the protocol is entirely controlled by XVS community members, since the Venus founders, team members, and other advisors do have any XVS token allocations.

XVS Price Analysis

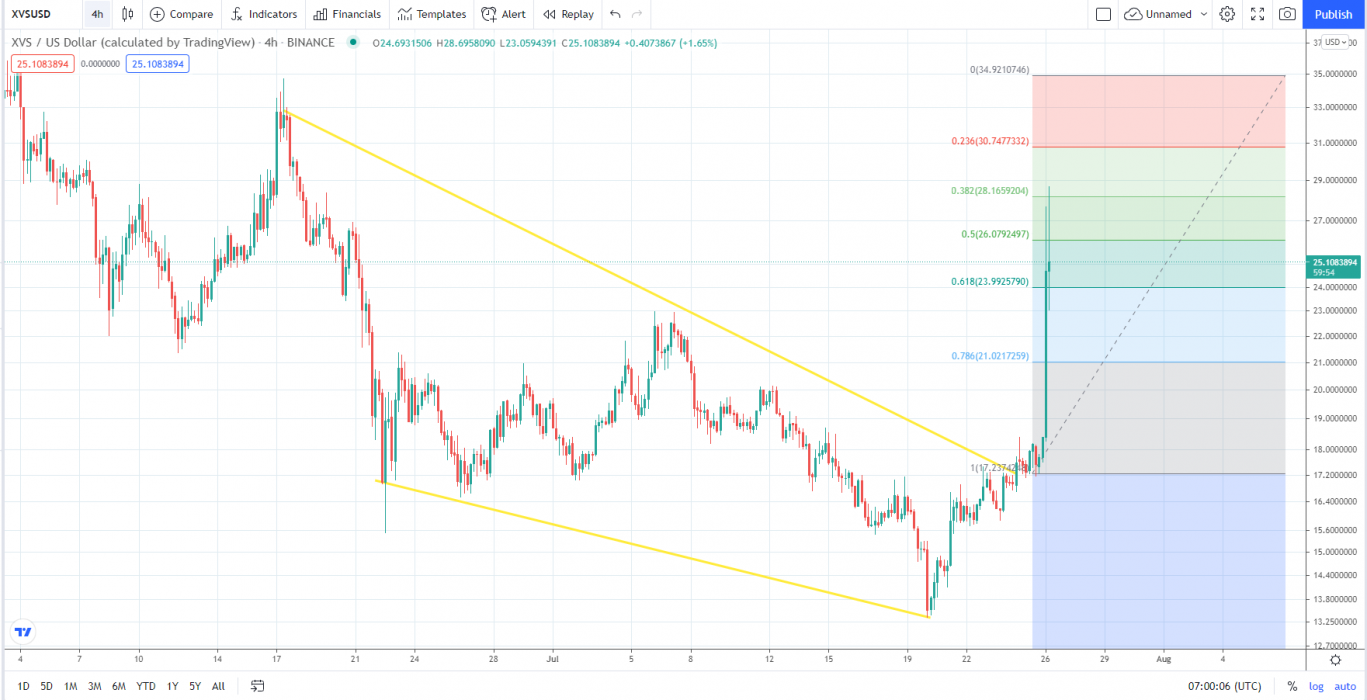
At the time of writing, XVS is ranked 137th cryptocurrency globally and the current price is A$34.08. This represents a +86% increase since July 20, 2021 (seven days ago), as shown in the chart below.

Source: TradingView

After looking at the above 4-Hour candle chart, we can clearly see that XVS was trading inside the falling wedge pattern on the XVS/USDT pair. The first resistance was on the A$25.64 price levels which XVS broke with a strong bullish trend buying volume and is now heading towards the previous monthly high price at A$45.38 Seeing that many Altcoins are holding a strong position this week after the recent bitcoin price recovery with 14% in a day XVS might continue to increase in the uptrend if traders keep buying with high volume.

“The Falling Wedge is a bullish pattern that begins wide at the top and contracts as prices move lower. This price action forms a cone that slopes down as the reaction highs and reaction lows converge.”

What Do The Technical Indicators Say?

TradingView indicators (on the one-day window) mainly suggest XVS as a Buy.

So Why Did XVS Breakout?

General market sentiment seems to suggest cryptos are hopefully turning back bull run season after recent massive price corrections. Another reason for this sudden pump in price could be whales secretly buying XVS for the next Altcoins rally. Recent news was also announced regarding Poloniex Listing XVS Coin on its DeFi Innovation Zone.

Where to Buy or Trade XVS?

Venus XVS has high liquidity on the Binance exchange which could help for trading XVS/BTC or XVS/USDT pairs. Instead, if you’re looking at buying and HODLing cryptos, then Swyftx Exchange is a popular choice in Australia.

Categories
Binance Crypto News DigiByte EOS Market Analysis Ripple Swyftx Trading

Top 3 Coins To Watch Today: EOS, XRP, DGB July 26 Trading Analysis

Let’s take a closer look at today’s altcoins showing breakout signals. We’ll explain what the coin is, then dive into the trading charts and provide some analysis to help you decide.

1. Electro Optical System (EOS)

EOS is a platform that’s designed to allow developers to build decentralized apps DApps. The project’s goal is relatively simple: to make it as straightforward as possible for programmers to embrace blockchain technology and ensure that the network is easier to use than rivals. As a result, tools and a range of educational resources are provided to support developers who want to build functional apps quickly. EOS also aims to improve the experience for users and businesses. While the project tries to deliver greater security and less friction for consumers, it also vies to unlock flexibility and compliance for enterprises.

EOS Price Analysis

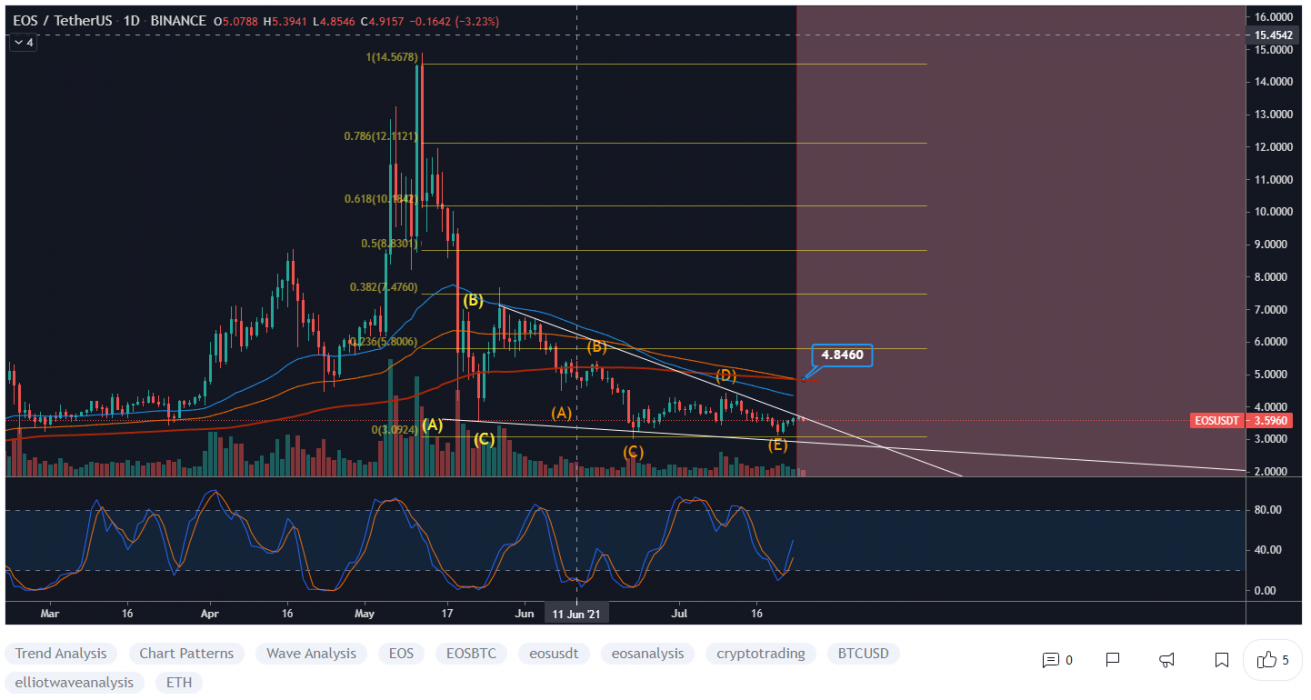
At the time of writing, EOS is ranked the 28th cryptocurrency globally and the current price is A$4.87. Let’s take a look at the chart below for price analysis:

Source: TradingView

EOS marines continue pushing the price higher, printing nearly 45% gains during the end of July.

The consolidation near A$4.75 is likely to provide support as the price continues exploring new highs. However, a set of relatively equal lows near A$4.38 provides a tempting target for a stop run into probable support near A$4.15.

A decidedly bearish shift in the market could reach probable support near A$3.85.

Almost no resistance lies overhead, although low-timeframe traders can use the resistance below recent highs near A$5.20 as a first target. Beyond this level, extensions near A$5.88, A$6.15, and A$6.45 give reasonable higher-timeframe targets.

2. Ripple (XRP)

Ripple XRP is the currency that runs on a digital payment platform called RippleNet, which is on top of a distributed ledger database called XRP Ledger. While RippleNet is run by a company called Ripple, the XRP Ledger is open-source and is not based on blockchain, but rather the previously mentioned distributed ledger database.

XRP Price Analysis

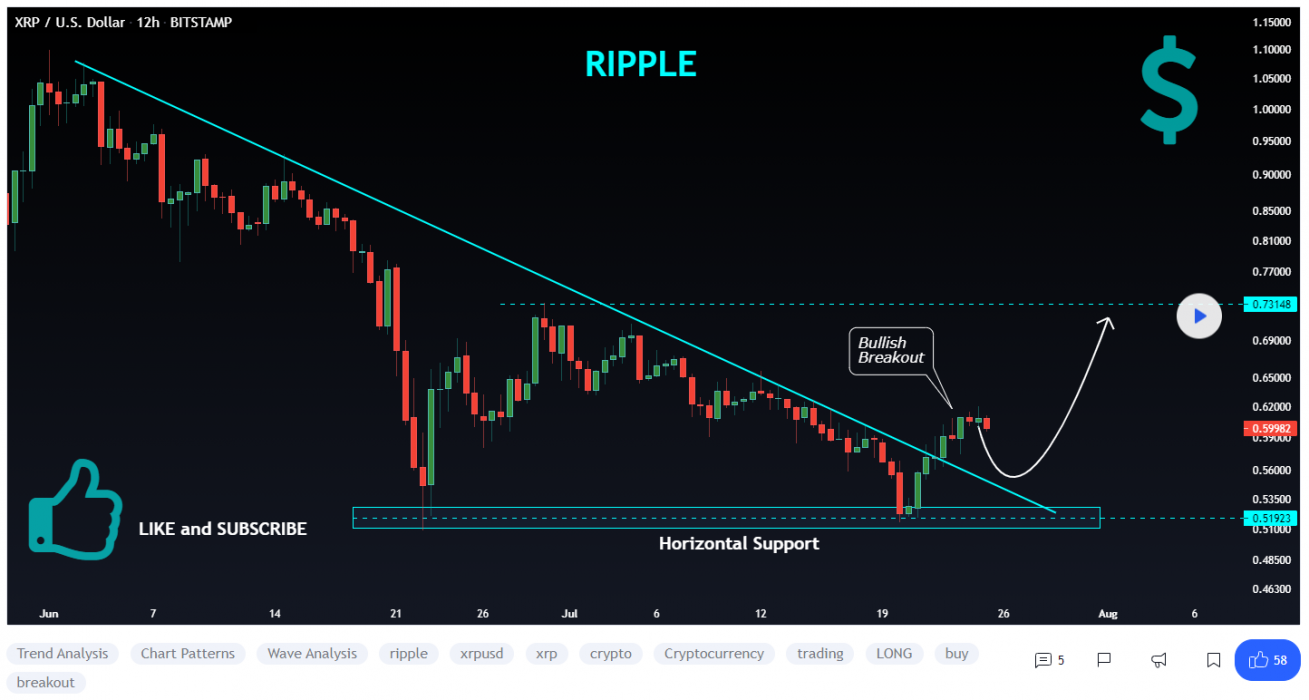
At the time of writing, XRP is ranked the 6th cryptocurrency globally and the current price is A$0.811. Let’s take a look at the chart below for price analysis:

Source: TradingView

XRP retraced 45% during July before finding support near A$0.5937. The following bounce encountered resistance at the daily gap near A$0.6328.

Bulls might wait for a sweep of the local lows into support near A$0.7344 before stepping in. A move to this level could reach into the higher timeframe gap down to A$0.6936. 

In the most bearish scenario, a significant turn in the market could push the price down to the consolidation near A$0.6422.

The local resistance is near A$0.9855 and the relatively equal swing highs give a reasonable first target. Just above, layered resistance near A$1.18 and A$1.27 could slow bulls down as they push the price towards the significant swing high at A$1.45.

3. DigiByte (DGB)

DigiByte DGB is an open-source blockchain and asset creation platform. Development began in October 2013 and the genesis block of its DGB token was mined in January 2014 as a fork of Bitcoin. A longstanding public blockchain and cryptocurrency, DigiByte uses five different algorithms to improve security, and originally aimed to improve on the Bitcoin blockchain’s security, capacity, and transaction speed. DigiByte consists of three layers: a smart contract “App Store,” a public ledger, and the core protocol featuring nodes communicating to relay transactions.

DGB Price Analysis

At the time of writing, DGB is ranked the 89th cryptocurrency globally and the current price is A$0.05837. Let’s take a look at the chart below for price analysis:

Source: TradingView

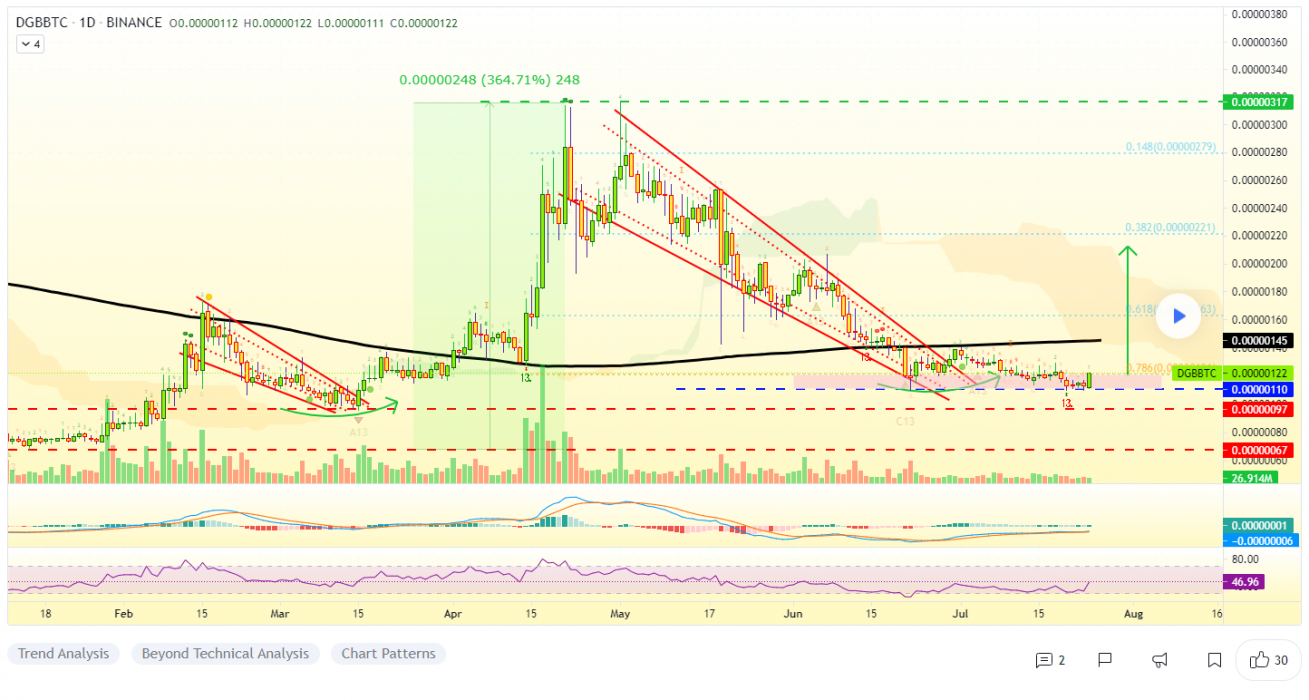
DGB bears have retraced over 145% since June, with little resistance above to end the current price discovery.

The price may find support near A$0.04655. Still, aggressive bulls should be wary of a potential stop run under the monthly open into support near A$0.04371. The area around A$0.04015 should provide strong support if the price reaches this low.

The air above the current price is thin, but the level near A$0.0695 could potentially provide some resistance in the short term. Extensions reaching near A$0.0784 and A$0.0872 make reasonable take-profit zones if the bullish trend continues.

Where to Buy or Trade Altcoins?

These three coins have high liquidity on Binance Exchange, so that could help with trading on AUD/USDT/BTC pairs. And if you’re looking at buying and HODLing cryptos, then Swyftx Exchange is an easy-to-use popular choice in Australia.

Categories
Binance Crypto News Initial Coin Offering Market Analysis Trading

Coin98 Surges +1850% Amid listing on Binance Launchpad – C98 Breakout Analysis

After the launch of Coin98 on Binance Launchpad, C98 took a strong Breakout with +1850% gains in a single day. Let’s take a quick look at C98, price analysis, and possible reasons for the recent breakout.

What is Coin98?

Coin98 is a decentralized finance (DeFi) solution that allows users access to cross-chain swaps, staking, and yield farming. The Coin98 exchange describes itself as a multi-chain liquidity aggregator that supports assets across a variety of blockchains, including but not limited to Ethereum, Binance Smart Chain, Solana, and Tron. Coin98 also has a wallet amongst its offerings, which supports over 20 networks on both its mobile and desktop platforms.

C98 Price Analysis

At the time of writing, C98 is ranked 2549th cryptocurrency globally and the current price is A$1.41. This is a +1268% increase since the launch of its ICO at Binance Launchpad on (23rd July 2021). Have a look at the chart below for price analysis.

Source: Binance Charts

After the launch of Coin98 on Binance Launchpad, It pumped up to A$1.75 having +1850% gains in just a few minutes and the initial opening price of C98 was A$0.0958 at Binance Exchange with many different trading pairs like C98/BTC, C98/USDT, and C98/BUSD.

Currently, C98 is trading at A$1.45 price levels after breaking out the squeeze resistance in its sideways trend & now heading towards its all-time high price.

What do the technical indicators say?

The Coin98 TradingView indicators (on the 1 day) mainly indicate C98 as a strong buy, except the Oscillators which indicate C98 as a neutral.

So Why did Coin98 Breakout?

After the C98 opening at Binance Launchpad, mostly ICO’s pumps after going live on exchange for trade and, General market sentiment seems to suggest cryptos are hopefully turning back bull run season after recent massive price corrections. and then the suggested start of the Altcoins season could have contributed to the recent breakout. It could also be contributed to some recent news of Binance Listing.

Where to Buy or Trade Coin98?

Coin98 has the highest liquidity on Binance Exchange so that would help for trading C98/BTC, C98/BUSD, or C98/USDT pairs. However, you can also buy C98 from different exchanges listed on Coinmarketcap.
Categories
Binance Crypto News Market Analysis Trading

Dexe Surged +118% in a Single Day as Binance adds USDT Trading pair for Dexe

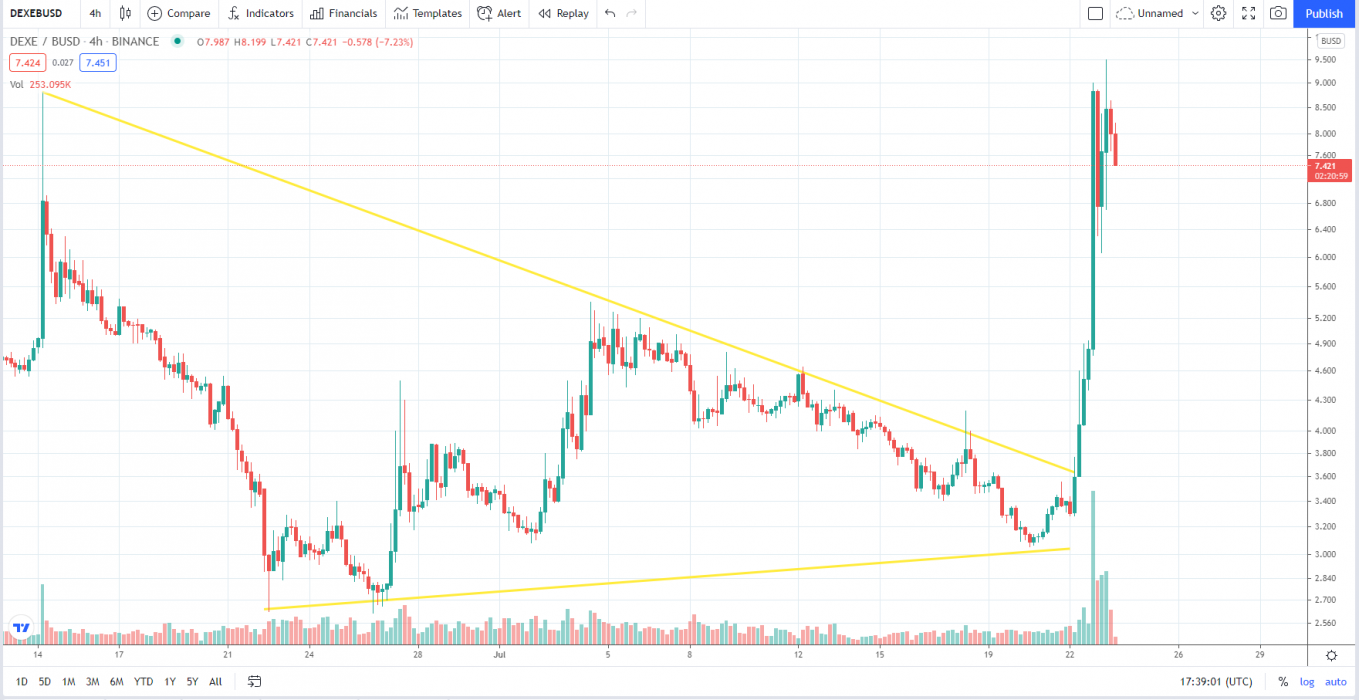
Dexe is trading in an uptrend, like many other Altcoins. The cryptocurrency DEXE just went up +118% in a single day by breaking a falling wedge pattern with strong buying volume on multiple exchanges and surges over +168% in a week.

What is Dexe?

The DeXe token DEXE claims to enable the open and permissionless system. Following protocol rules and contributing resources facilitates consensus among participants, automatic buyback and distribution among insurance vaults, farming rewards among token holders, and burning of tokens for a percentage of traders’ rewards.

Dexe Price Analysis

At the time of writing, DEXE is ranked 554th cryptocurrency globally and the current price is A$10.44. This represents a +168% increase since July 17, 2021 (seven days ago), as shown in the chart below.

Source: TradingView

After looking at the above 4-Hour candle chart, we can clearly see that Dexe was trading inside the falling wedge pattern on the DEXE/BUSD pair. The first resistance was on the A$5.22 price levels which Dexe broke with a strong bullish trend buying volume and is now heading towards the previous monthly high price at A$17.84. Seeing that many Altcoins are holding a strong position this week after the recent bitcoin crash recovery, Dexe might continue to increase in the uptrend if traders keep buying with high volume.

“The Falling Wedge is a bullish pattern that begins wide at the top and contracts as prices move lower. This price action forms a cone that slopes down as the reaction highs and reaction lows converge.”

What Do The Technical Indicators Say?

TradingView indicators (on the one-day window) mainly suggest DEXE as a Neutral.

So Why Did Dexe Breakout?

General market sentiment seems to suggest cryptos are hopefully turning back bull run season after recent massive price corrections. Another reason for this sudden pump in price could be whales secretly buying Dexe for the next Altcoins rally. Recent news was also announced regarding Binance adding DEXE/USDT trading pair.

If you have conducted extensive due diligence and like the concept of the project, and you feel it can create long-term token holder value, investing in some DEXE coin may be a good move. In addition, if you want to be part of the DeXe DAO, holding DEXE tokens is a must.

Where To Buy or Trade Dexe?

Dexe coin has high liquidity on the Binance exchange, which could help for trading DEXE/ETH or DEXE/USDT pairs. However, you can also buy Dexe tokens from other multiple crypto exchanges.


Categories
Binance Crypto News Market Analysis Solana Swyftx Trading

Top 3 Coins To Watch Today: SKL, SOL, CHR July 23 Trading Analysis

Let’s take a closer look at today’s altcoins showing breakout signals. We’ll explain what the coin is, then dive into the trading charts and provide some analysis to help you decide.

1. SKALE Network (SKL)

Skale SKL is described as an elastic network that’s designed to bring scalability to Ethereum. As well as boosting transaction capacity, the decentralized project aims to reduce latency and ensure that payments can be made as cheaply as possible. SKALE Network is geared towards improving both the security and decentralization of Ethereum-based apps. Token holders on the SKALE Network are incentivized and earn rewards by helping to improve the scalability and security of the platform by serving as validators.

SKL Price Analysis

At the time of writing, SKL is ranked the 130th cryptocurrency globally and the current price is A$0.2661 Let’s take a look at the chart below for price analysis:

Source: TradingView

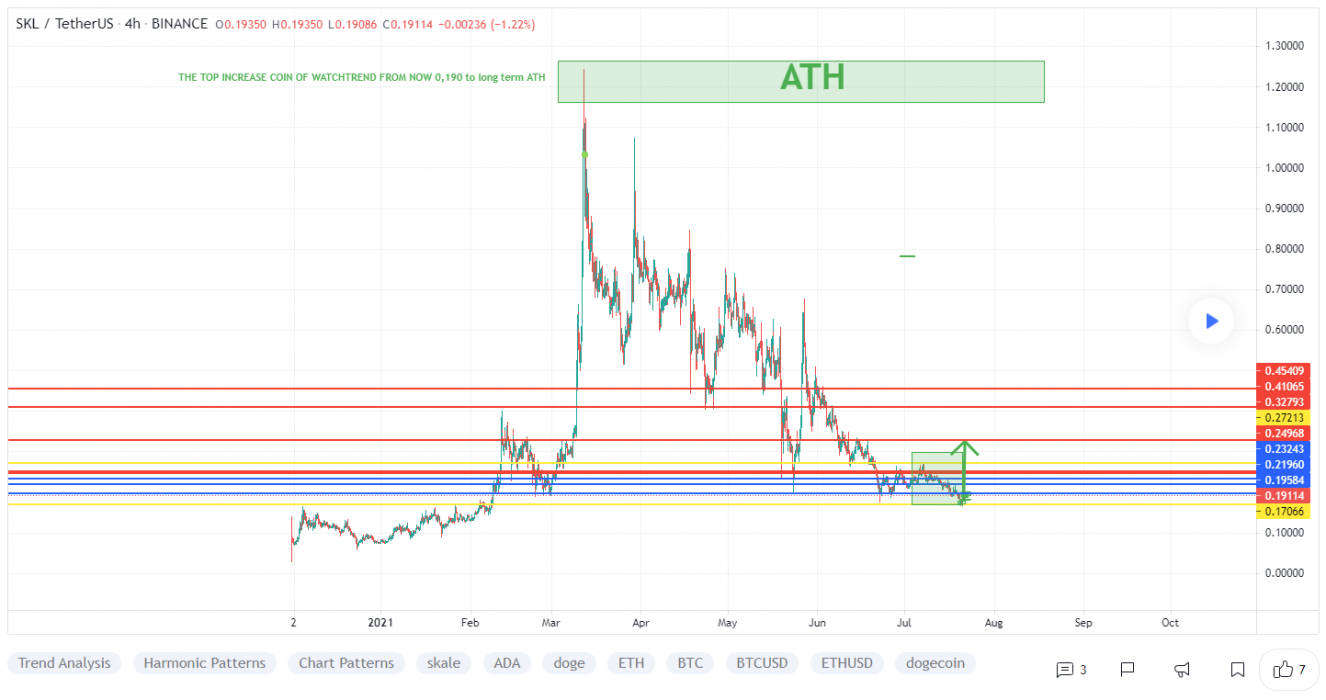
Since the beginning of July, SKL has been in a gentle downtrend. The future likely holds more stop runs and erratic volatility until the chart forms more substantial high-timeframe levels.

A retracement might uncover support near A$0.2538, which is the daily high of the last swing low. The high of the wick beginning near A$0.2471 may also provide support. However, bulls will likely remain wary of the current downtrend, making the low at A$0.2214 likely to be the next bearish target.

Just above, the daily gap beginning near A$0.3288 may provide resistance to bulls, possibly marking a future range high. A push through this level is likely to target the swing high near A$0.3593 – perhaps running to probable resistance near A$0.3844. Strength above this level might signal the start of a bullish trend, encouraging bulls to “buy the dip.”

2. Solana (SOL)

Solana SOL is a highly functional open source project that banks on blockchain technology’s permissionless nature to provide decentralized finance (DeFi) solutions. The Solana protocol is designed to facilitate decentralized app (DApp) creation. It aims to improve scalability by introducing a proof-of-history (PoH) consensus combined with the underlying proof-of-stake (PoS) consensus of the blockchain.

SOL Price Analysis

At the time of writing, SOL is ranked the 14th cryptocurrency globally and the current price is A$37.70. Let’s take a look at the chart below for price analysis:

Source: TradingView

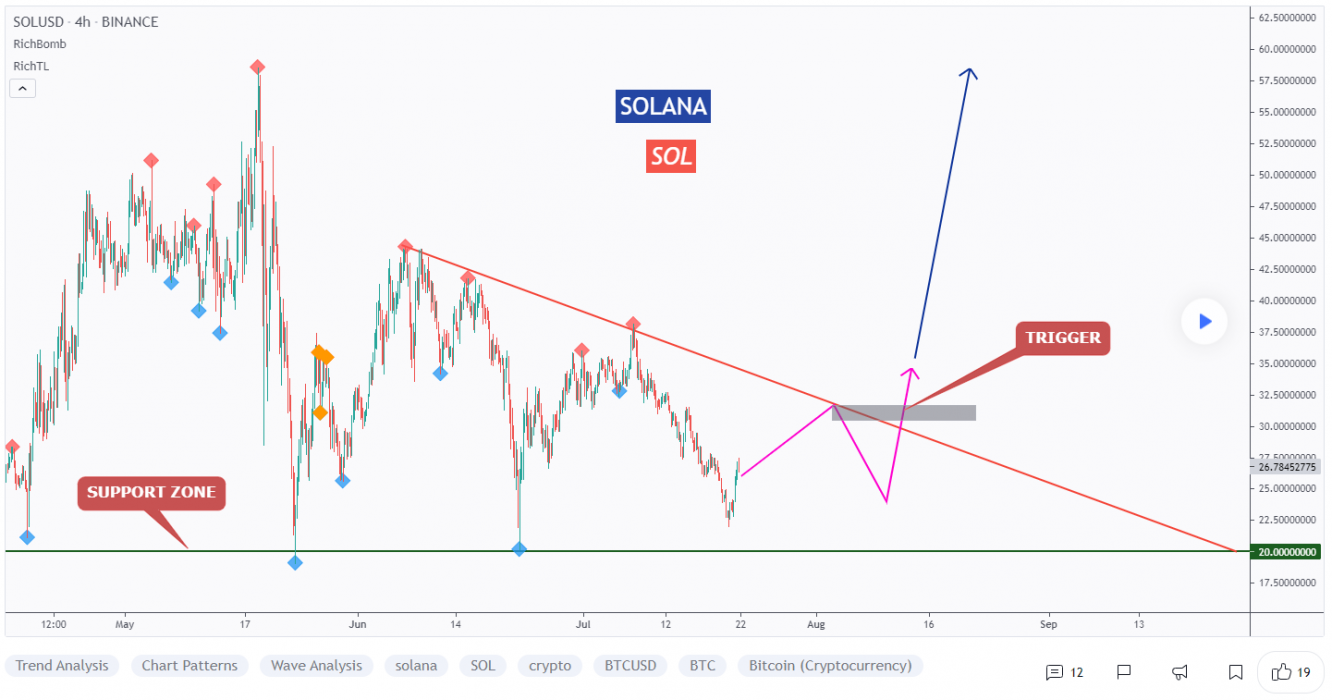
July 11th 125% bullish weekly candle has since bled near 85%, with the SOL finding a low near A$32.54 in mid-July.

Bulls are buying each drop into support near A$35.82, with higher lows forming each time. However, the equal lows near A$33.14 create an attractive target for a stop run. Still, bulls might buy this dip near possible support beginning at A$31.66.

Just over the July monthly open, A$45.73 marks the beginning of a probable resistance zone. A breakthrough in this area might target the equal highs near A$47.95 before running into possible resistance near A$49.89.

A sustained move upward – perhaps from a market-wide bullish shift – could reach the swing high near A$53.68 before encountering probable resistance near A$56.88.

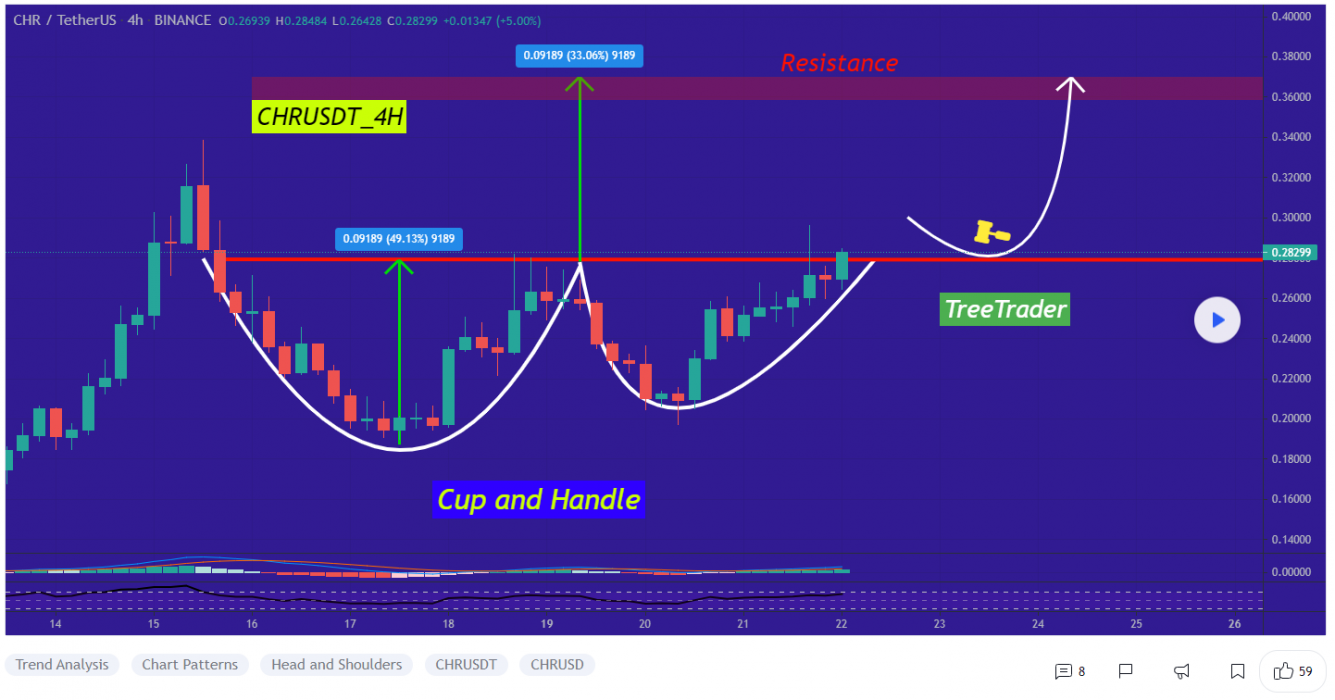
3. Chromia (CHR)

Chromia CHR is an open-source public blockchain conceived of by Swedish company Chromaway AB. The Chroma token (CHR) was launched in May of 2019. The technology behind the Chromia blockchain is adapted from an earlier technology called ‘Postchain’, a solution provided by Chromaway AB for enterprise clients. Chromia is a standalone Layer-1 blockchain and EVM compatible Layer-2 enhancement for Binance Smart Chain and Ethereum.

CHR Price Analysis

At the time of writing, CHR is ranked the 189th cryptocurrency globally and the current price is A$0.3902. Let’s take a look at the chart below for price analysis:

Source: TradingView

During the third week of July, CHR dumped over 62% before finding support near A$0.2688. Consolidation above this level has created a series of relatively equal lows, which are likely to be swept before any longer-term bullish trend begins. 

In the shorter term, the price might establish support near A$0.3588 before running the swing high at A$0.4055. If this bullish move occurs, the price could reach resistance near the May monthly open around A$0.5571 and even sweep the swing high near A$0.5746.

Some support might exist at the daily gap near A$0.2338 A move this low would also fill the June monthly gap and set the stage for a possible bullish reversal.

Where to Buy or Trade Altcoins?

These three coins have high liquidity on Binance Exchange, so that could help with trading on AUD/USDT/BTC pairs. And if you’re looking at buying and HODLing cryptos, then Swyftx Exchange is an easy-to-use popular choice in Australia.