Categories
Aave Chiliz Crypto News Market Analysis Trading VeChain

Top 3 Coins to Watch Today: CHZ, VET, AAVE – March 31 Trading Analysis

Let’s take a closer look at today’s altcoins showing breakout signals. We’ll explain what the coin is, then dive into the trading charts and provide some analysis to help you decide.

1. Chiliz (CHZ)

Chiliz CHZ is the leading digital currency for sports and entertainment, powering the world’s first blockchain-based fan engagement and rewards platform, Socios.com. Here, fans can purchase and trade branded fan tokens as well as having the ability to participate, influence, and vote in club-focused surveys and polls. Founded in Malta in 2018, the company’s vision is to bridge the gap between active and passive fans, providing millions of sports fanatics with a fan token that acts as a tokenised share of influence.

CHZ Price Analysis

At the time of writing, CHZ is ranked the 64th cryptocurrency globally and the current price is US$0.3092. Let’s take a look at the chart below for price analysis:

Source: TradingView

CHZ‘s stunning rally to $0.5350 plummeted over 70% after December to sweep consolidation lows at $0.2155. This could set the stage for a new bullish cycle to begin. 

The price is currently balancing around the January monthly open. A quick stop run into support beginning near $0.2732 could set the stage for a move into the daily gap beginning near $0.2605, potentially reaching resistance near $0.2437.

A sweep of the highs near $0.3258, followed by a sharp sell-off, could hint that bulls are preparing to run the swing high near $0.3547. This run could find the next resistance around $0.3836 in the candle wick that created the monthly high. If the market remains bullish, the price will likely reach into possible resistance near $0.4128.

2. VeChain (VET)

VeChain VET is a blockchain-powered supply chain platform. VeChain aims to use distributed governance and Internet of Things (IoT) technology to create an ecosystem that solves some of the major problems with supply chain management. The platform uses two in-house tokens, VET and VTHO, to manage and create value based on its VeChainThor public blockchain. The idea is to boost the efficiency, traceability, and transparency of supply chains while reducing costs and placing more control in the hands of individual users.

VET Price Analysis

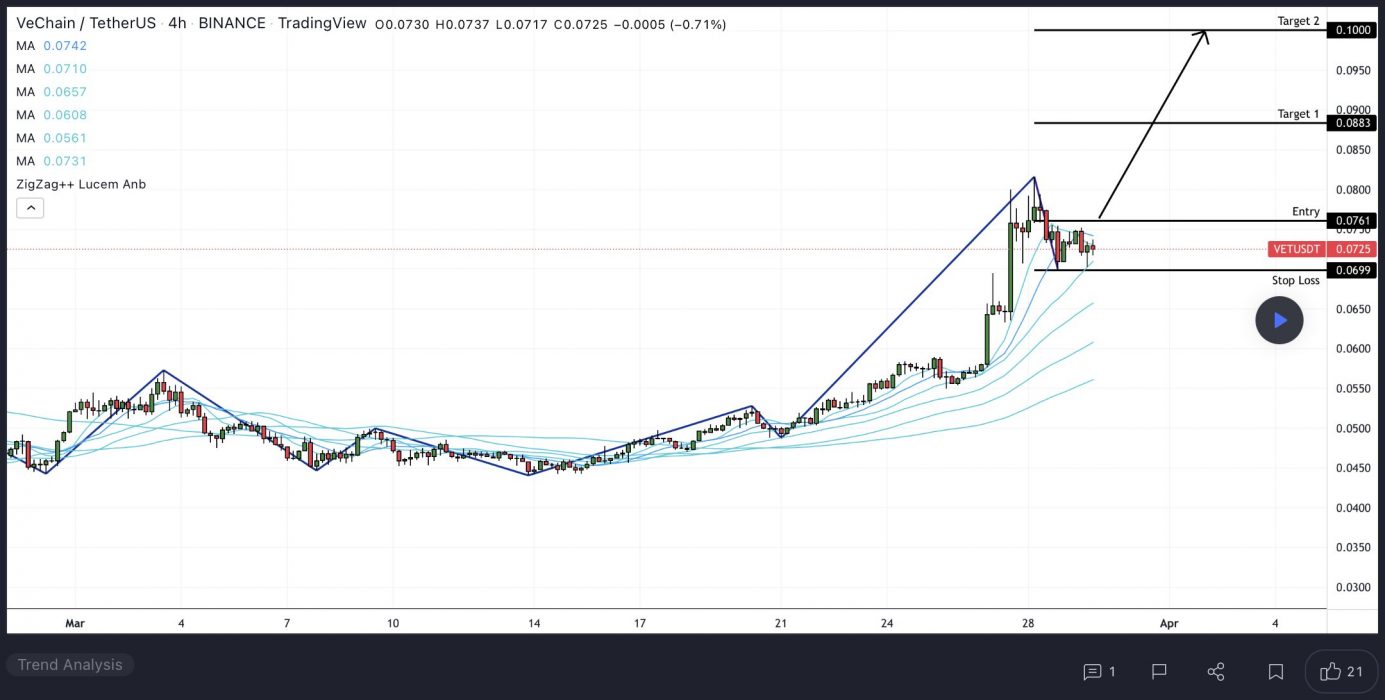
At the time of writing, VET is ranked the 34th cryptocurrency globally and the current price is US$0.08355. Let’s take a look at the chart below for price analysis:
Source: TradingView

VET‘s 45% move during last week ran into resistance near $0.08420, at the 27% extension of the Q1 swing.

An old high and the 18 EMA have provided support near $0.06833 and might give support again on a retest. This area also has confluence with the 50% and 62.8% retracements of November’s swing.

Just below, near $0.06493, the 55.8% retracement of the current Q4 swing might also mark an area of support. 

If the market turns bearish, $0.06172 is unlikely to be revisited but could see interest from bulls during any deeper retracement.

An area near $0.09018, at the 50% extension of the summer’s swing, could see some profit-taking if bulls break the current resistance near $0.09378. Above, old consolidations near $0.09525 and $0.09872 may also provide some resistance before another round of price discovery.

3. Aave (AAVE)

AAVE is a decentralised finance protocol that allows people to lend and borrow crypto. Lenders earn interest by depositing digital assets into specially created liquidity pools. Borrowers can then use their crypto as collateral to take out a flash loan using this liquidity. AAVE provides holders with discounted fees on the platform, and it also serves as a governance token – giving owners a say in the future development of the protocol.

AAVE Price Analysis

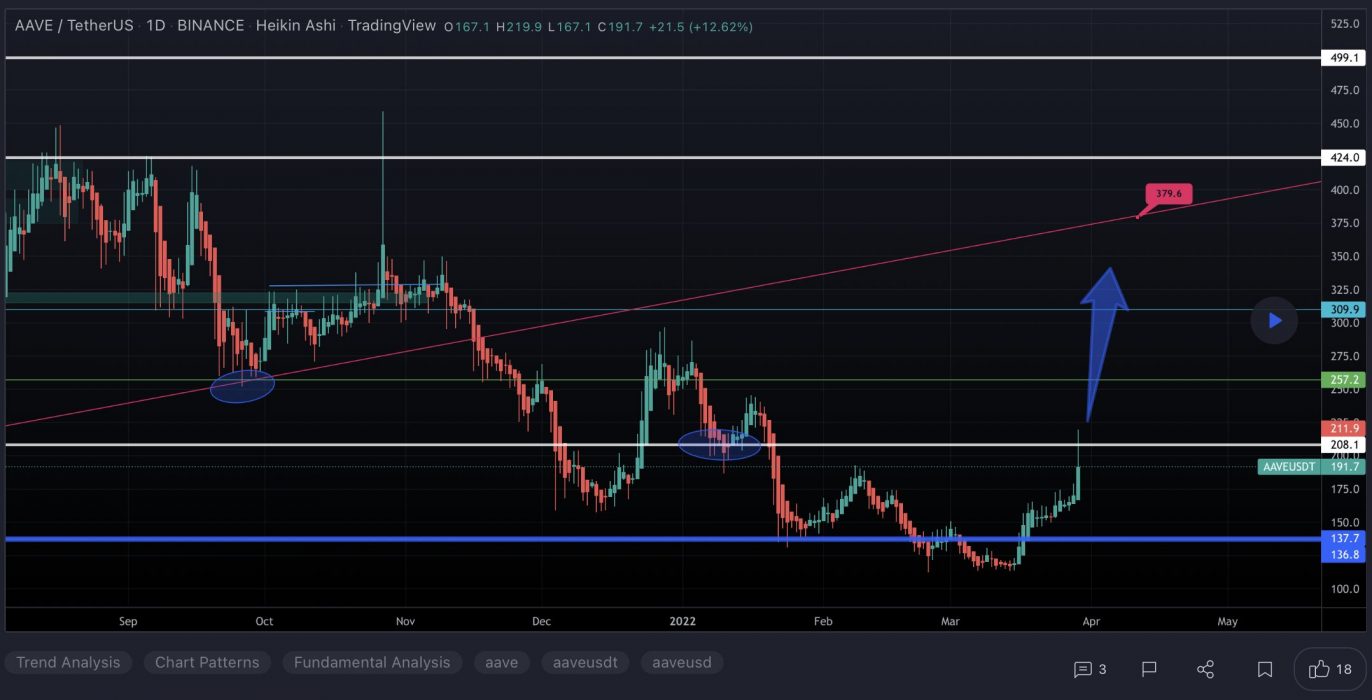
At the time of writing, AAVE is ranked the 48th cryptocurrency globally and the current price is US$229.86. Let’s take a look at the chart below for price analysis:
Source: TradingView

AAVE‘s strong downtrend that began during mid-January has retraced most of its Q1 move, recently sweeping lows near $160.

A sweep of the relatively equal lows near $217 into possible support around $210, combined with bullish market conditions, could be the catalyst that begins to form a bottom. If this level fails, bulls might buy the monthly gap’s low near $198.

The swing high near $248 may form resistance to any sudden pumps as holders unload some of their position. A more substantial move might sweep relatively swing highs into probable resistance near $256, potentially reaching up to the new monthly high near $265 and $280.

Learn How to Trade Live!

Join Dave and The Crypto Den Crew and they’ll show you live on a webinar how to take your crypto trading to the next level.

Where to Buy or Trade Altcoins?

These coins have high liquidity on Binance Exchange, so that could help with trading on AUD/USDT/BTC pairs. And if you’re looking at buying and HODLing cryptos, then Swyftx Exchange is an easy-to-use popular choice in Australia.

Categories
COTI Crypto News Market Analysis Stratis Tezos Trading

Top 3 Coins to Watch Today: XTZ, STRAX, COTI – March 30 Trading Analysis

Let’s take a closer look at today’s altcoins showing breakout signals. We’ll explain what the coin is, then dive into the trading charts and provide some analysis to help you decide.

1. Tezos (XTZ)

Tezos XTZ is a blockchain network that’s based on smart contracts in a way that’s not too dissimilar to Ethereum. However, there’s a big difference: Tezos aims to offer infrastructure that is more advanced – meaning it can evolve and improve over time without any danger of a hard fork. This is something both Bitcoin and Ethereum have suffered since they were created. People who hold XTZ can vote on proposals for protocol upgrades that have been put forward by Tezos developers.

XTZ Price Analysis

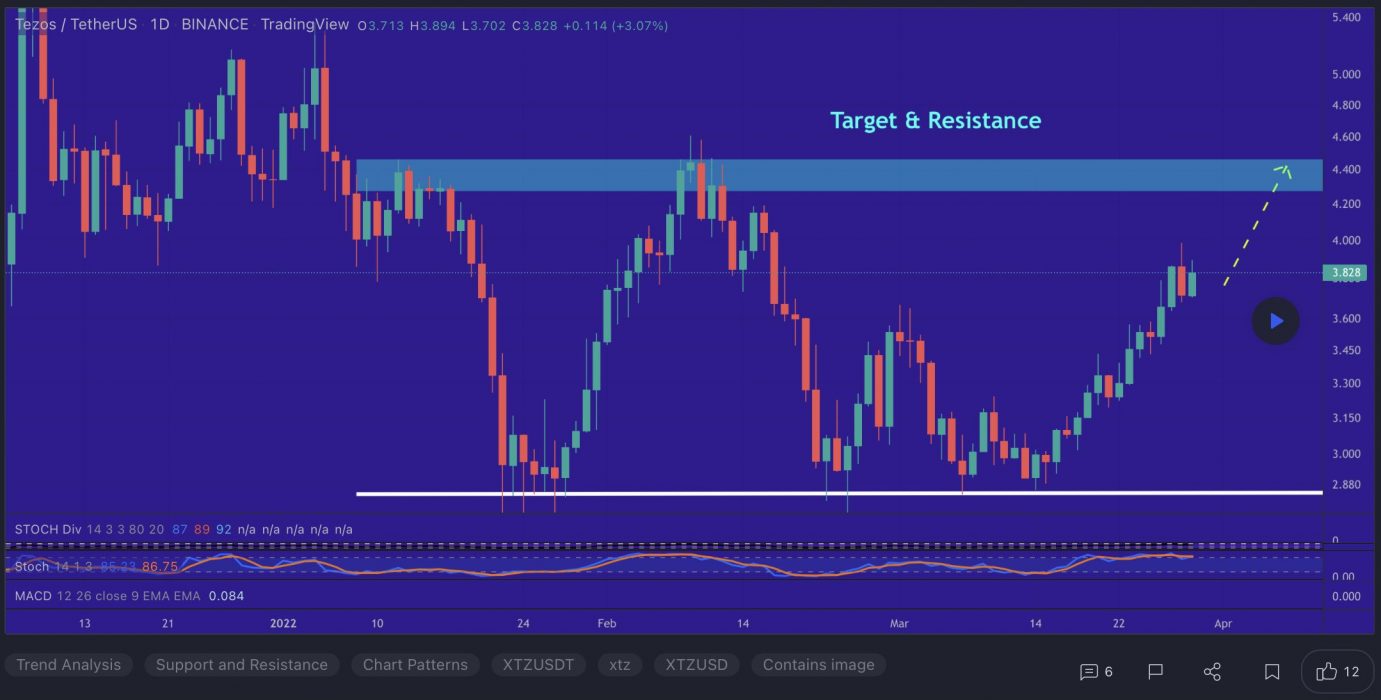
At the time of writing, XTZ is ranked the 46th cryptocurrency globally and the current price is US$3.82. Let’s take a look at the chart below for price analysis:

Source: TradingView

XTZ‘s 65% drop since late December saw a second leg after last month’s market-wide drop ran the previous consolidation’s stops.

The level near $4.10 is providing some resistance. However, continuation through the monthly high at $4.32 is not out of the question. Aggressive bulls might bid in the current region near $4.58. 

If the price runs the recent swing low, bulls might bid in the gap near $3.70. A deeper retracement could reach near the early-February level and a gap near $3.57. The region near $3.49 and $3.40 may also provide some support during a deeper retracement.

2. Stratis (STRAX)

Stratis STRAX is a blockchain-as-a-service platform that offers several products and services for enterprises, including launching private sidechains, running full nodes, developing and deploying smart contracts, an initial coin offering platform, and a proof-of-identity application. The company also provides cryptocurrency wallets and blockchain consulting services. Stratis operates its own blockchain powered by a native token, STRAX.

STRAX Price Analysis

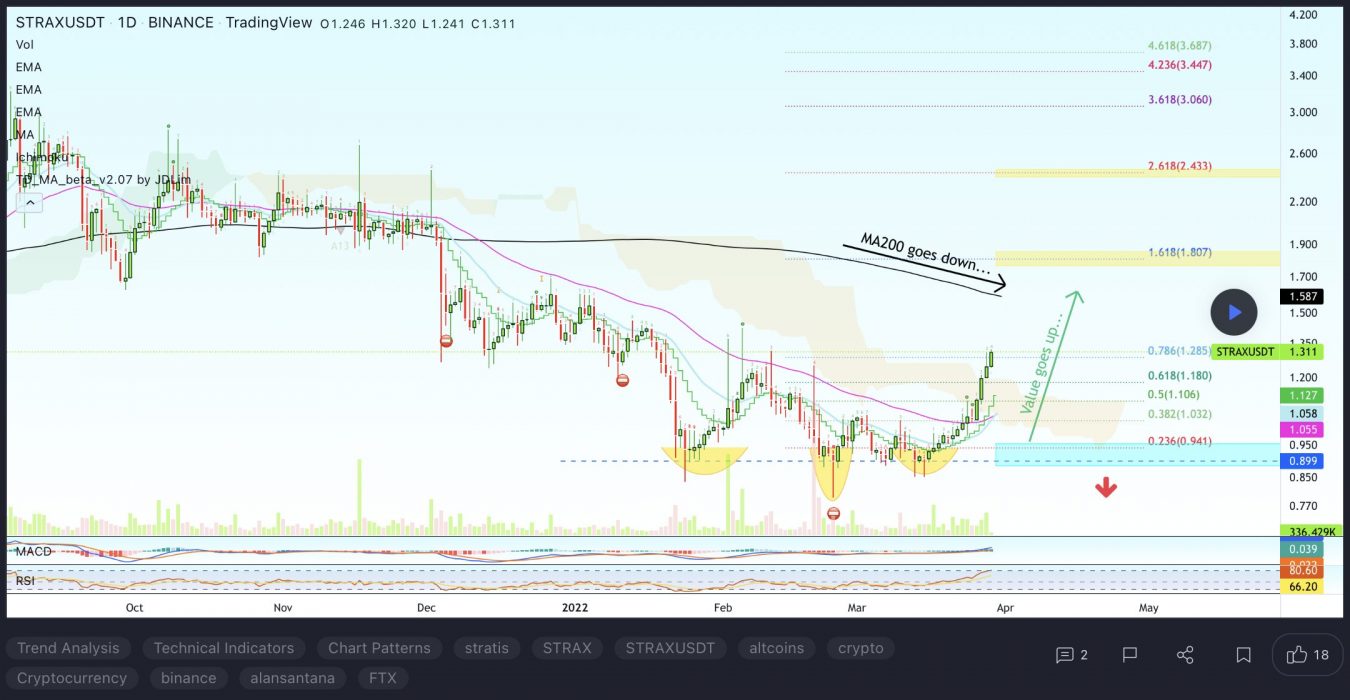
At the time of writing, STRAX is ranked the 290th cryptocurrency globally and the current price is US$1.27. Let’s take a look at the chart below for price analysis:

Source: TradingView

Since its rally in H1 2021, STRAX has been in a massive range between approximately $2.50 and $1.20. Long upper wicks during the second half of 2021 show distribution, while the daily chart shows a bearish trend since January.

The price is currently around the 79.6% retracement, near $1.30. This level has seen interest from bulls since July 2021. It might provide support again for a short-term bounce.

The closest resistance may be at $1.42, near the 9, 18 and 40 EMAs. If the price breaks this level, bulls might target the old swing high near $1.59, another old swing high and inefficiently traded area near $1.72, and the consolidation around $1.80.

However, repeated tests of a level, plus the higher-timeframe downtrend, may cause an eventual breakdown of the current support near $1.20. If this occurs, old swing lows near $1.12 – particularly an inefficient region starting near $0.9877 – may be the bearish target and the subsequent support.

3. Coti (COTI)

COTI markets itself as the first enterprise-grade fintech platform that empowers organisations to build their own payment solutions as well as digitise any currency to save time as well as money. COTI is one of the world’s first blockchain protocols that is optimised for decentralised payments and designed for use by merchants, governments, payment DApps, and stablecoin issuers. The ecosystem has a DAG-based blockchain, proof-of-trust consensus algorithm, multiDAG, GTS (Global Trust System), a universal payment solution, and a payment gateway.

COTI Price Analysis

At the time of writing, COTI is ranked the 180th cryptocurrency globally and the current price is US$0.2896. Let’s take a look at the chart below for price analysis:

Source: TradingView

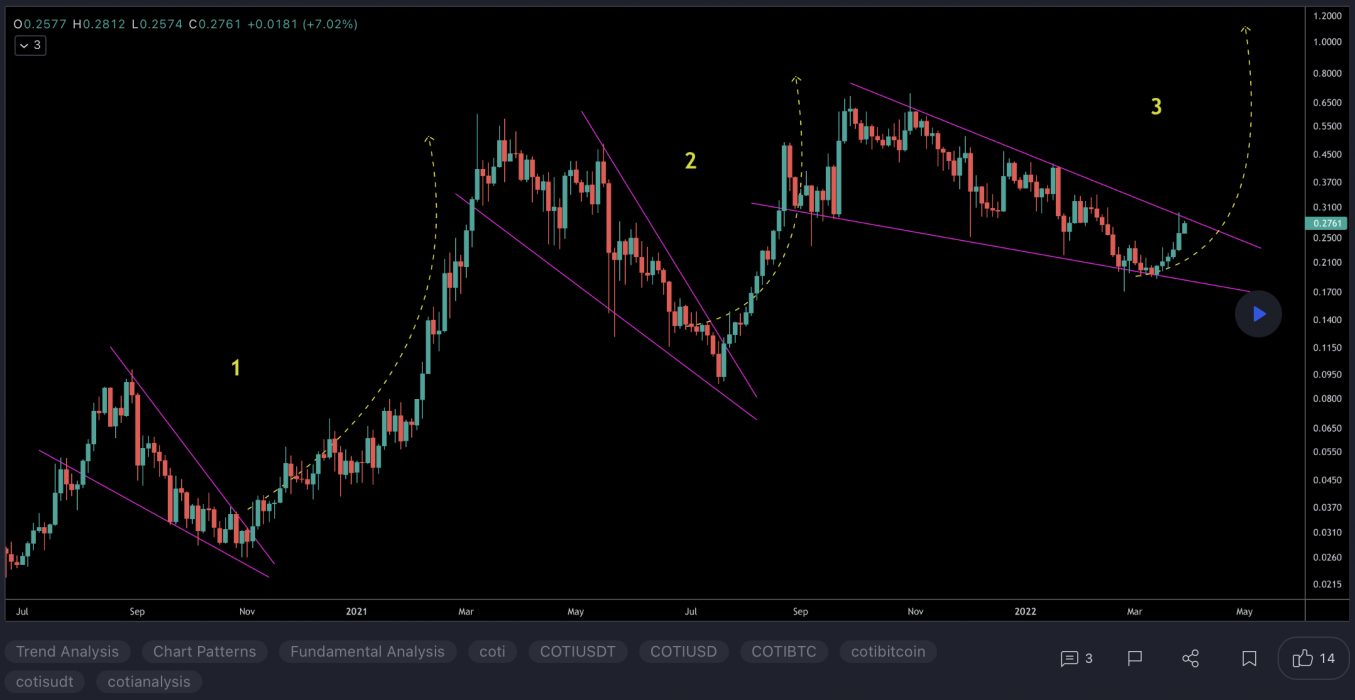
COTI‘s rally during H2 2021 broke down in early November and has since been in a bearish trend on the daily chart. The price recently swept lows below a contested area at $0.1952, which prompted a rally during the last week into resistance at the 40 EMA near $0.2988. 

It remains to be seen whether this contested area from $0.2603 to $0.2252 can support a retest.

Unless the overall market turns bullish, a bearish continuation to possible support near $0.2165 – just under the 79.6% retracement level – seems likely. This area has sparked multiple consolidations.

A break of this level might continue to possible support near $0.1599, where the H2 2021 rally began accumulating before its run.

If the market continues its rally, breaking through resistance near the 2021 yearly open, the macro range highs near $0.3913 might provide the next resistance.

Learn How to Trade Live!

Join Dave and The Crypto Den Crew and they’ll show you live on a webinar how to take your crypto trading to the next level.

Where to Buy or Trade Altcoins?

These coins have high liquidity on Binance Exchange, so that could help with trading on AUD/USDT/BTC pairs. And if you’re looking at buying and HODLing cryptos, then Swyftx Exchange is an easy-to-use popular choice in Australia.

Categories
Crypto News EOS Harmony Market Analysis Trading WAX

Top 3 Coins to Watch Today: EOS, ONE, WAX – March 29 Trading Analysis

Let’s take a closer look at today’s altcoins showing breakout signals. We’ll explain what the coin is, then dive into the trading charts and provide some analysis to help you decide.

1. Eos (EOS)

EOS is a platform designed to allow developers to build decentralised apps. The project’s goal is relatively simple: to make it as straightforward as possible for programmers to embrace blockchain technology and ensure the network is easier to use than rivals. As a result, tools and a range of educational resources are provided to support developers who want to build functional apps quickly. EOS also aims to improve the experience for users and businesses. While the project tries to deliver greater security and less friction for consumers, it also vies to unlock flexibility and compliance for enterprises.

EOS Price Analysis

At the time of writing, EOS is ranked the 49th cryptocurrency globally and the current price is US$2.96. Let’s take a look at the chart below for price analysis:

Source: TradingView

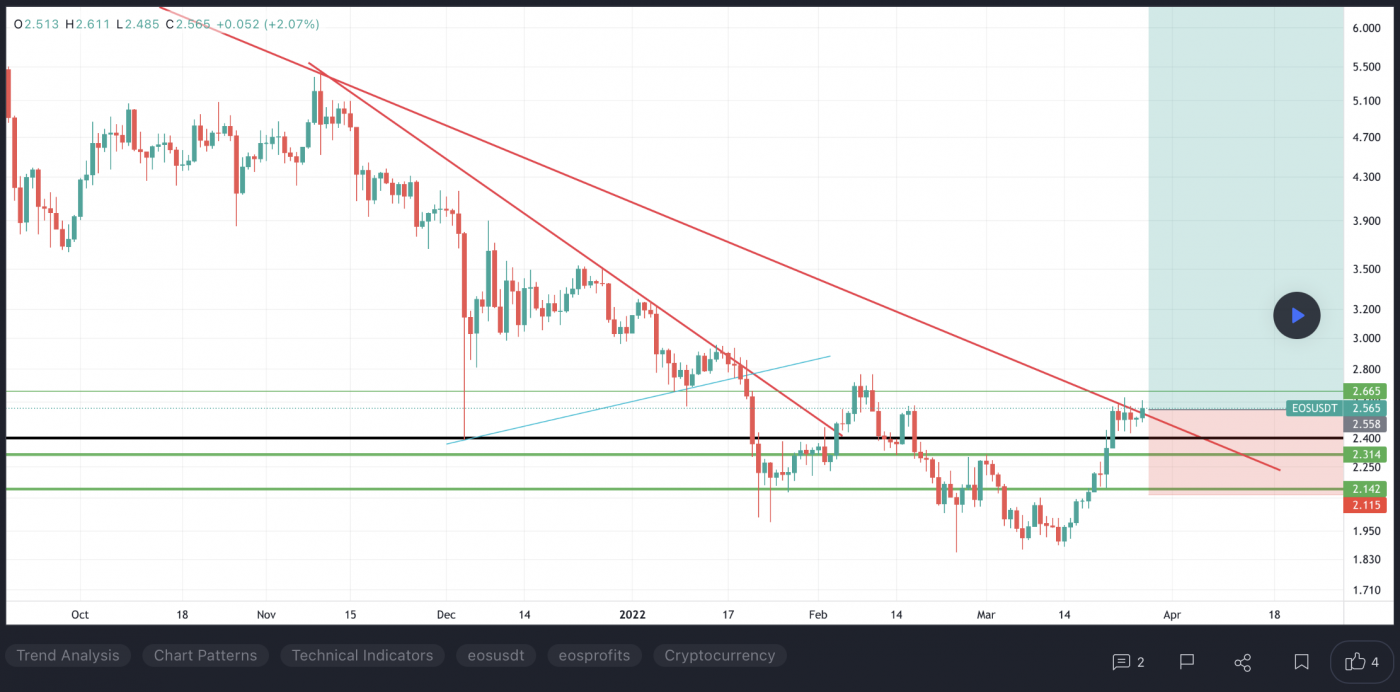
Early September began a bearish trend for EOS, which dropped 71% before setting a low near $1.86 in late February.

After a several-week accumulation and running stops below the December 2021 swing low, mid-March began a bullish rally that climbed 58% by March 28, reaching the 2022 yearly open.

The old 2021 lows, near $3.27, could mark a resistance area. If this is the start of a larger bullish market cycle, bulls might take their next profits near $4.31 – an inefficient area near November’s breakdown. Another potential resistance is near $5.06, which saw multiple rejections during distribution before November’s breakdown.

An area of old consolidation from $2.95 to $2.57 could provide the next bullish setup before any continuation upward. This area contains the last swing high before late February’s stop run. A drop just below, near $2.34, is also reasonable. This level is near the March monthly open and 40 EMA.

If the bearish trend resumes, bulls might find the next higher-timeframe support between $1.70 and $1.21. This region, especially under $1.42, was inefficiently traded and has not been revisited since 2018.

2. Harmony (ONE)

Harmony ONE is a blockchain platform designed to facilitate the creation and use of decentralised applications (DApps). The network aims to innovate the way decentralised applications work by focusing on random state sharding, which allows creating blocks in seconds. Harmony was expected to introduce cross-shard contracts and a cross-chain infrastructure by the end of 2021.

ONE Price Analysis

At the time of writing, ONE is ranked the 59th cryptocurrency globally and the current price is US$0.1688. Let’s take a look at the chart below for price analysis:

Source: TradingView

ONE bulls have had to endure a 71% drop since early January until the price set a low and began a range in late February.

Currently, the price is aggressively moving toward possible resistance, beginning near $0.1711. Stops above the swing high at $0.1735 might be the target before a downwards retracement. Multiple old lows mark this resistance, which is near the 78.6% retracement level of a recent significant bearish swing.

If the price continues through this high, it could be reaching for an inefficient area near $0.1972. Moving to this level would run bears’ stops above the swing high at the same level. A more substantial rally might reach an old swing high and inefficiently traded area between $0.2275 and $0.2538, which surrounds the 2022 yearly open.

If the price stays above Monday’s low of $0.1595, this price could support a run above the $0.1735 swing high. Just below, at $0.1554, bulls might eye the consolidation high as more substantial support. This zone contains the 9 and 40 EMAs.

A deeper retracement might retest the accumulation area between $0.1425 and $0.1280. If this level breaks, bears may be targeting an inefficiently traded area on higher timeframes beginning near $0.0980. This area overlaps the 27% extension of a recent significant bearish swing.

3. Wax (WAXP)

WAXP is a purpose-built blockchain, released in 2017, that is designed to make e-commerce transactions faster, simpler and safer for every party involved. The WAX blockchain uses delegated proof-of-stake (DPoS) as its consensus mechanism. It is fully compatible with EOS. The custom features and the incentive mechanisms developed by WAX are intended to optimise the blockchain’s utility specifically for use in e-commerce, with the goal of encouraging voting on proposals.

WAX Price Analysis

At the time of writing, WAX is ranked the 114th cryptocurrency globally and the current price is US$0.3528. Let’s take a look at the chart below for price analysis:

Source: TradingView

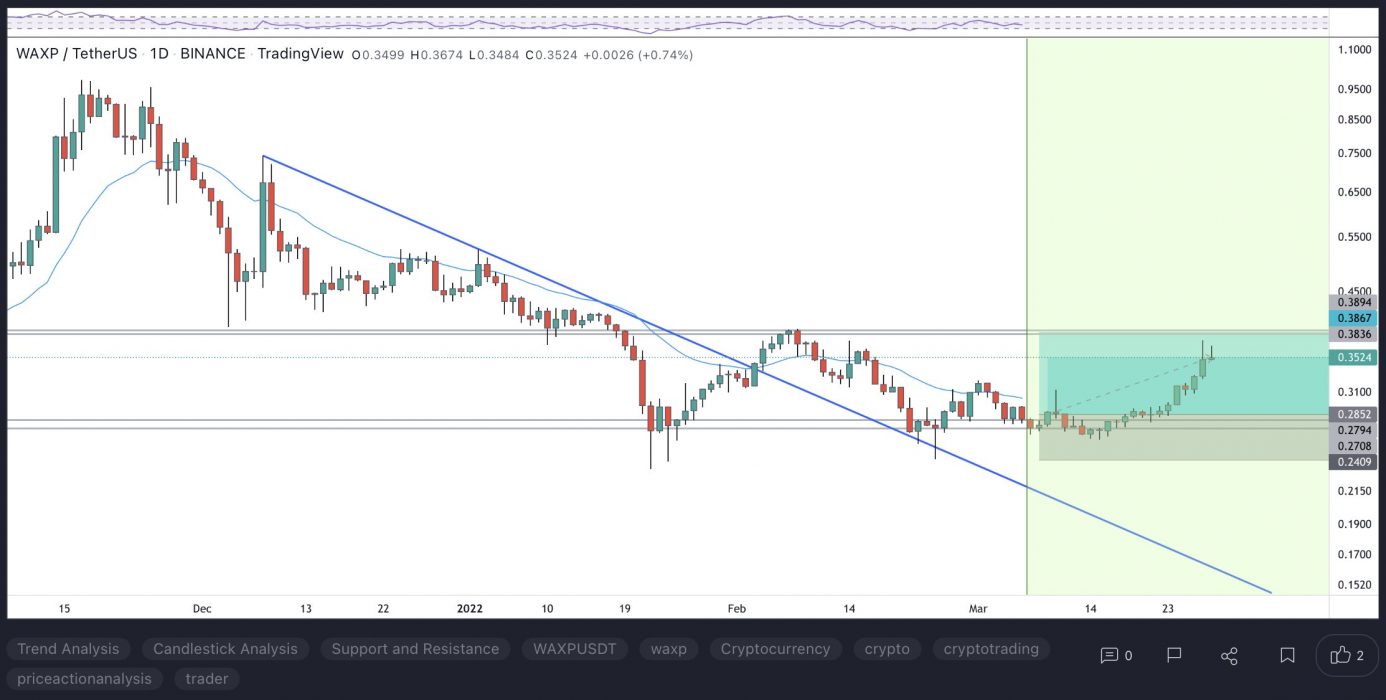
WAX finished its 76% retracement from November’s euphoric high to January’s low as it found support between $0.2712 and $0.2417.

This level could provide support again, although bulls anticipating continuation might watch for closer setups in possible support between $0.3403 and $0.2960. This region marks the high of an accumulation range on higher timeframes, and its low end contains the added confluence of the 9, 18 and 40 EMAs and the March open.

The swing high and small inefficiently traded area near $0.3834 could be the first target of this rally. Continuation through this level might reach resistance near the low of the late December consolidation range and 2022 yearly open, near $0.4230. A more sustained rally will likely run for the relatively equal highs around $0.5268.

If the bearish trend resumes, bears may take profits – although the price could continue lower – between $0.2188 and $0.1723. This level is below multiple old swing lows, an appealing target for bears, and contains the last accumulation area before August’s explosive rally to new all-time highs.

Learn How to Trade Live!

Join Dave and The Crypto Den Crew and they’ll show you live on a webinar how to take your crypto trading to the next level.

Where to Buy or Trade Altcoins?

These coins have high liquidity on Binance Exchange, so that could help with trading on AUD/USDT/BTC pairs. And if you’re looking at buying and HODLing cryptos, then Swyftx Exchange is an easy-to-use popular choice in Australia.
Categories
Basic Attention Token Chiliz Loopring Market Analysis Mirror Protocol The Crypto Den Trading

TradeRoom: Our Weekly Crypto Trades Analysis – Mar 28, 2022

Welcome to this weekly series from the TradeRoom. My name is Dave and I’m the founder of The Crypto Den, an Australian-based crypto trading and education community aiming to give you the knowledge to take your trading game to the next level.

Crypto Market Outlook

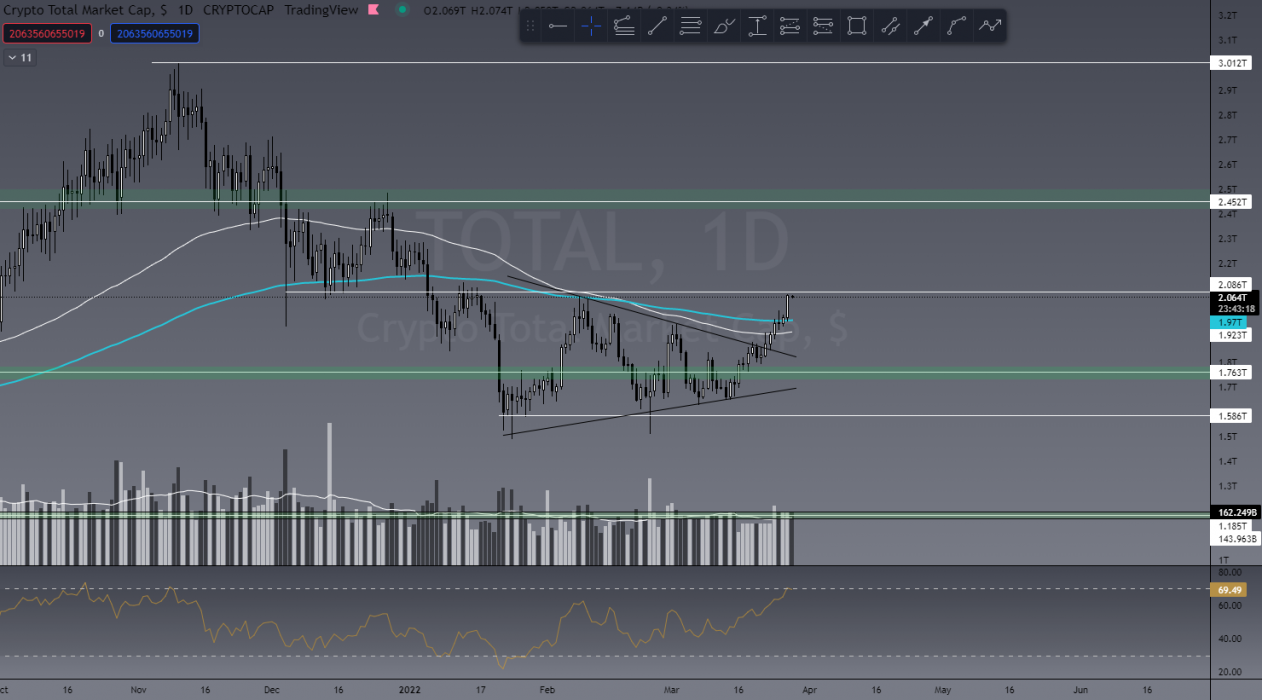
Finally, after two months of a choppy sideways market, we have movement! The TOTAL cap and BTC have chosen the 30% chance of an upside breakout with the TOTAL sitting just above US$2 trillion. This is the first solid change in market structure we’ve seen in months, and we’re now above the daily 200 EMA. Still some work to do, though! Let’s take a closer look.

TOTAL market cap

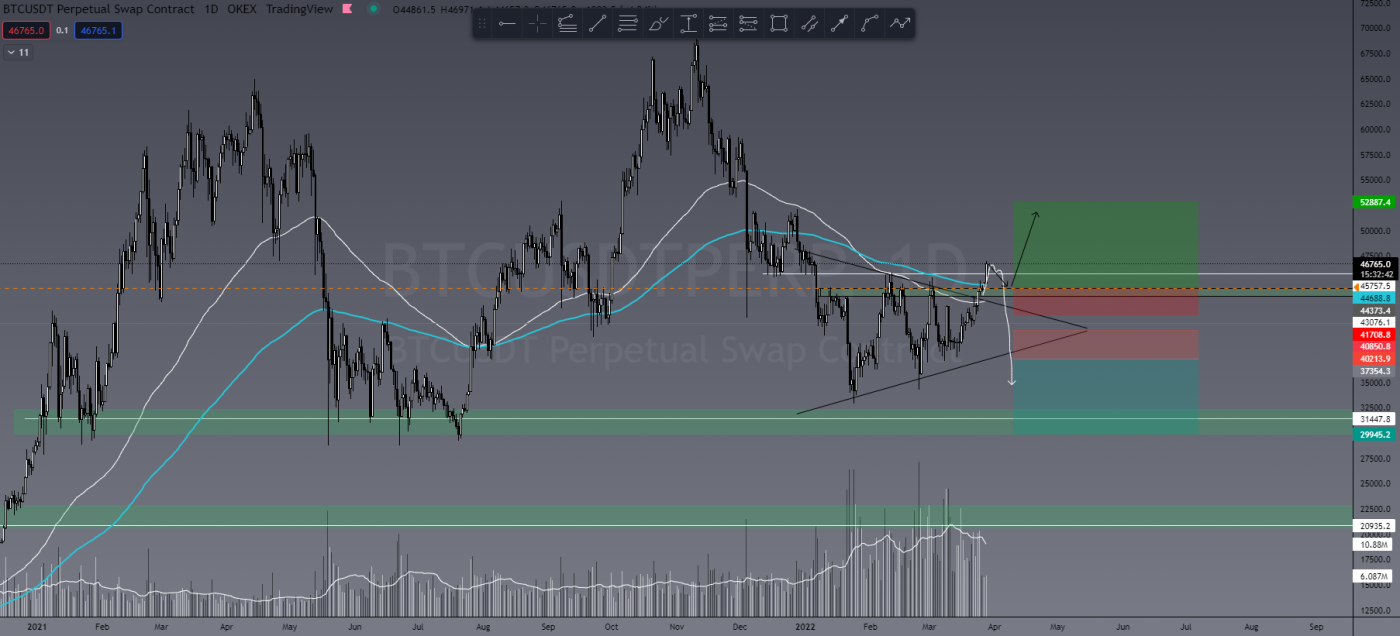
For a BTC long trade, I’ll be waiting for a pullback to enter. What I want to see here is a confirmed and clear S&R flip. What I’m cautious of is a bull trap (something like the white arrow line happening), which is why we wait for confirmation. A test on support followed by some positive candlestick analysis and maintaining price action above that 200 EMA on the daily will support this. This is what SAFE traders do. We don’t just ape into a pump and hope for moon.

BTC/USDT

If this push fails, you can see I have a game plan ready either way and this will also be the case for any ALT trades.


This Week’s Trades

CHZ/USDT

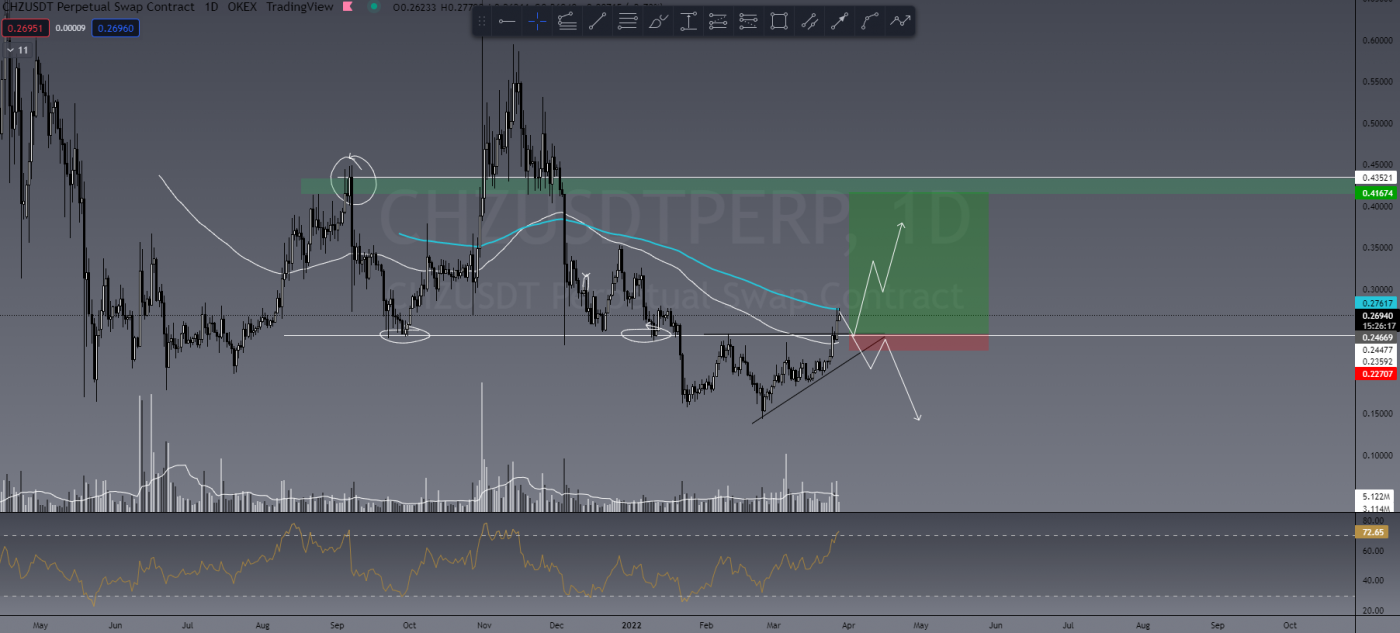
Currently being held up on the daily 200 EMA, I see opportunity for CHZ to pull back and confirm an S&R flip for a long entry. Again, a positive change in market structure is great – we just need that first confirmation.

BAT/USDT

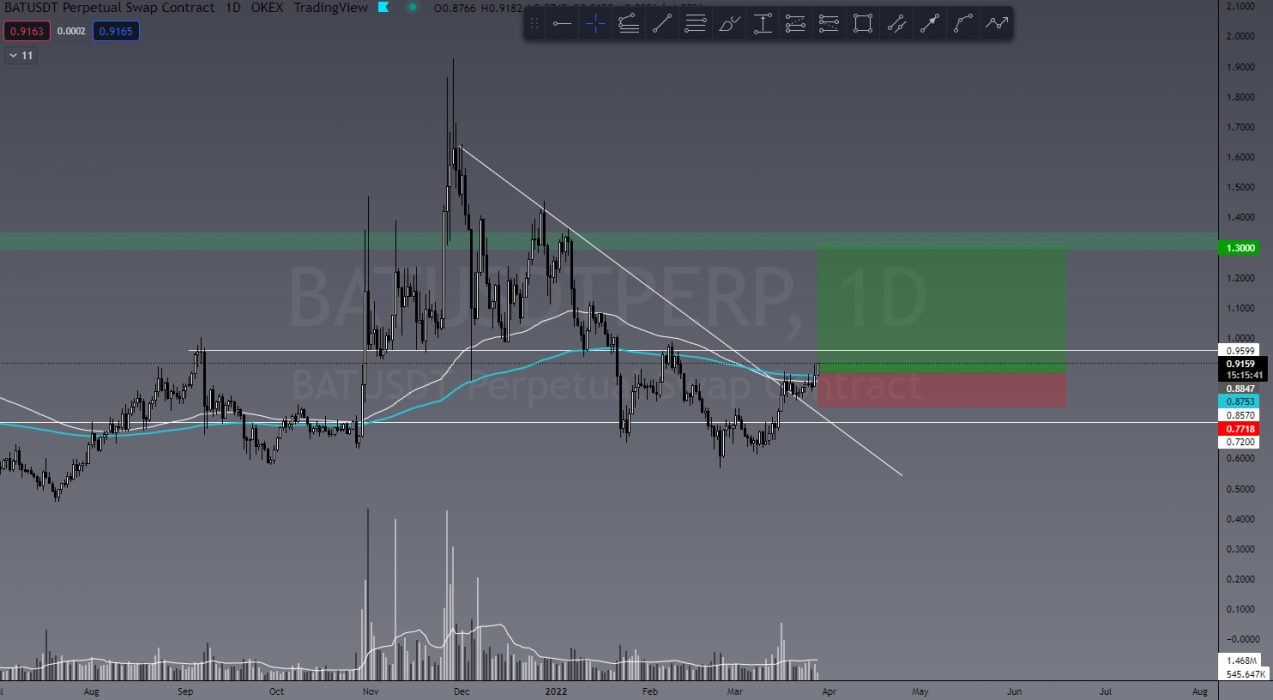
BAT has broken out of a four-month downtrend and tested it positively with a nice bounce. If BTC price action continues, BAT could see a decent 50% pump. Like all coins at the moment, there are still some walls to push through but the risk to reward ratio (R:R) on this trade looks good. I’d expect this to play well with a big green candle above US$1.00.

BAT/USDT

MIR/USDT

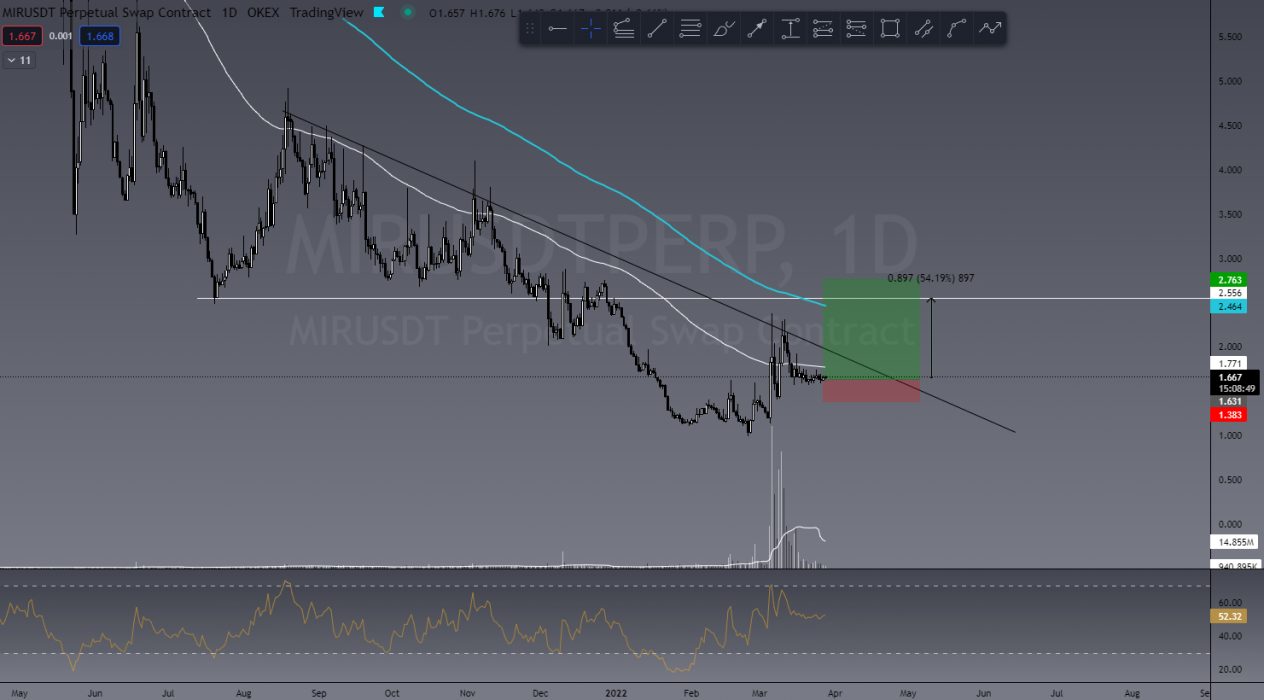
Quite an aggressive trade getting in long here before a breakout, but the R:R is pretty good. MIR is lagging behind the pack and a 50% pump isn’t out of the question.

MIR/USDT

LRC/USDT

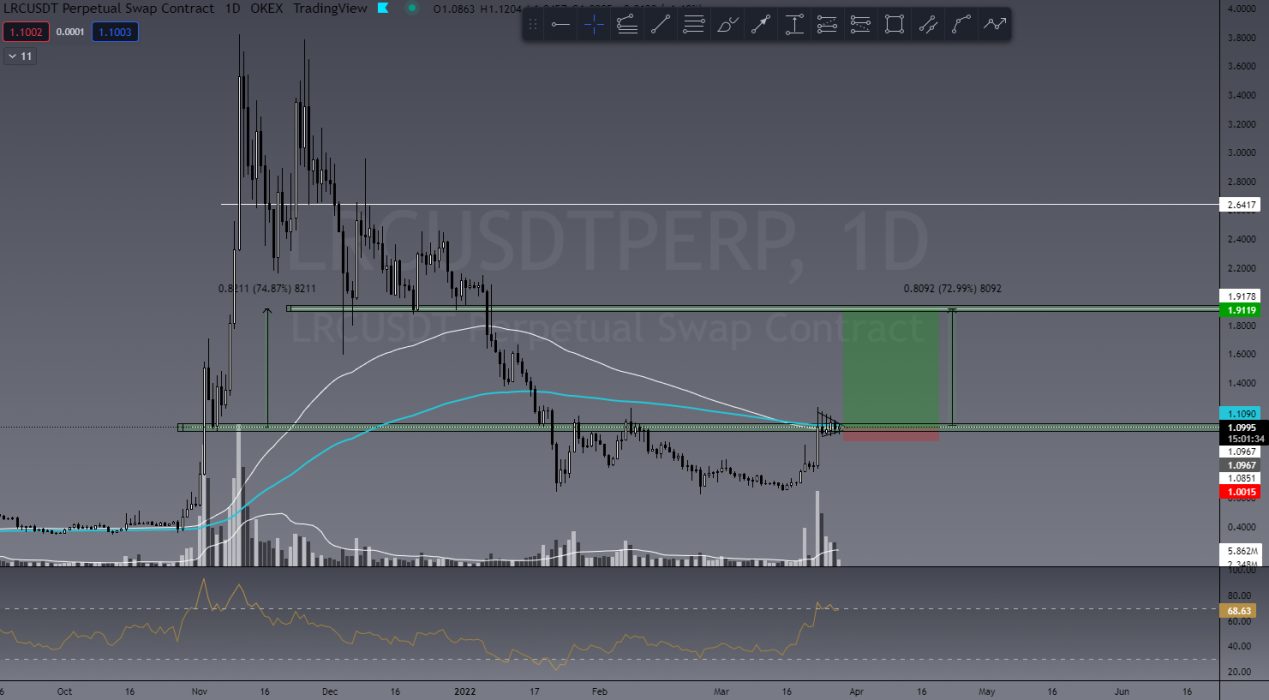
LRC is forming a bullish pennant right on the 100 and 200 daily EMA, as well as daily resistance. A breakout here and there’s potential for 70%! If you look left, you can see LRC did 70% over only four days back in November 2021.

LRC/USDT

Introducing TCD’s New Social Platform

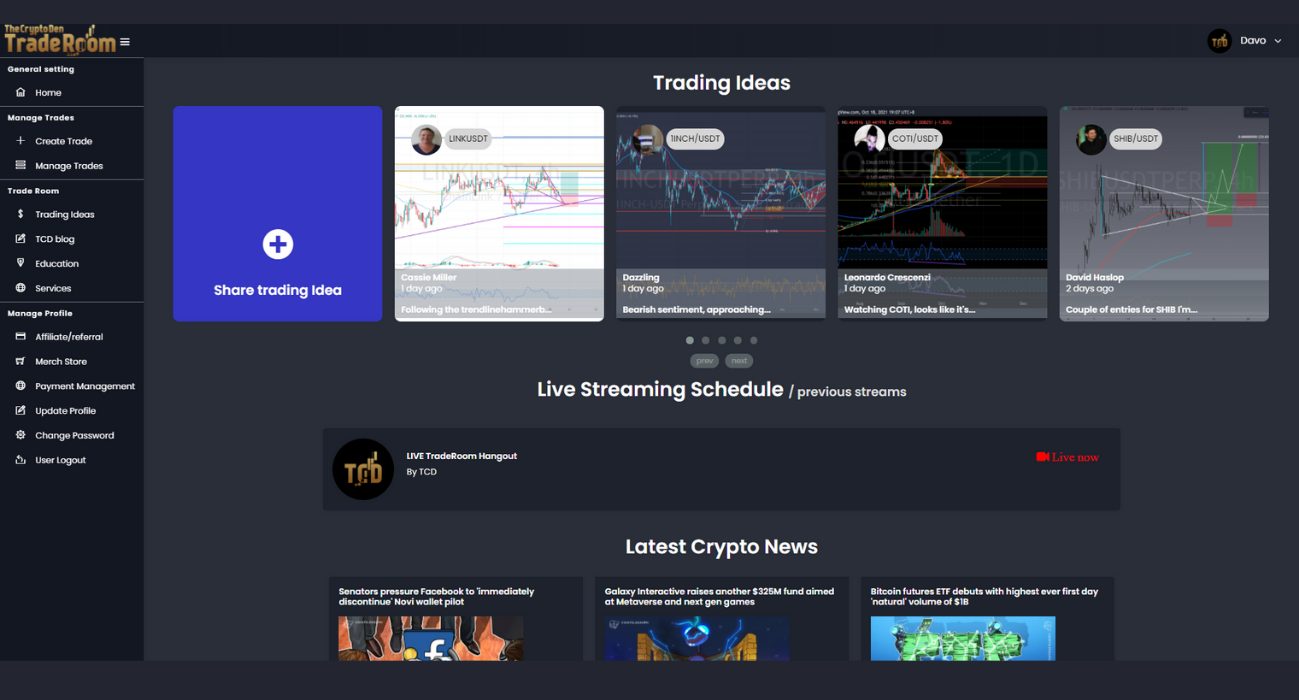
The Crypto Den now has a FREE purpose-built social platform to share investment ideas, trade chat, connect to like-minded people, share info and more, without the censorship of Facebook. The platform is designed for those more focused on the investment/profitable side of the crypto world.


Are You a Trader?

Invite to Join our TradeRoom

If you’d like to become a better trader, you’re invited to join our TradeRoom where we share daily charts and market analysis. In our community we strongly encourage and teach correct risk management strategies to keep our members safe in this new volatile crypto market.
Join our “Apprentice” plan now for your 7-day trial.


The Crypto Den was created in 2017 to help the rapidly growing crypto community learn and understand the fundamentals of digital currencies and how to trade them. 

Since then we have taught thousands of members the basics of technical analysis and trading strategies to further progress and perfect their trading abilities.

In the TradeRoom you will be included in a supportive environment which encourages personal growth, education and community support.

It’s a place to share your trading ideas and follow other experienced traders’ feeds to help keep your finger on the pulse of such a volatile market!

Categories
Avalanche Crypto News Market Analysis Siacoin Trading Zilliqa

Top 3 Coins to Watch Today: ZIL, SC, AVAX – March 28 Trading Analysis

Let’s take a closer look at today’s altcoins showing breakout signals. We’ll explain what the coin is, then dive into the trading charts and provide some analysis to help you decide.

1. Zilliqa (ZIL)

Zilliqa ZIL is a public, permissionless blockchain designed to offer high throughput with the ability to complete thousands of transactions per second. It seeks to solve the issue of blockchain scalability and speed by employing sharding as a second-layer scaling solution. The platform is home to many decentralised applications, and it also allows for staking and yield farming. The native utility token of Zilliqa, ZIL, is used to process transactions on the network and execute smart contracts.

ZIL Price Analysis

At the time of writing, ZIL is ranked the 70th cryptocurrency globally and the current price is US$0.1134. Let’s take a look at the chart below for price analysis:

Source: TradingView

ZIL‘s 60% drop during Q1 found a low near $0.04138 before closing over a weekly high around $0.09872.

This daily close over the high could signal a shift in market structure that might reach probable resistance near $0.1237. A sustained bullish move may target the swing high at $0.1364. If this stop run occurs, a run beyond the high into probable resistance near $0.1588 and $0.1645 is possible.

Bulls could buy a retracement to possible support near $0.1058, just above the weekly open. A bearish turn in the marketplace may propel the price toward possible support near $0.09536. 

However, relatively equal lows near $0.08934 and $0.08824 provide an attractive target for bears if the market resumes its bearish trend. A run on these lows might find support between $0.08615 and $0.08566.

2. Siacoin (SC)

Siacoin SC is the native utility token of Sia, a blockchain-based distributed, decentralised cloud storage platform. Sia acts as a secure, trustless marketplace for cloud storage in which users can lease access to their unused storage space. Agreements and transactions are enforced with smart contracts, and Siacoin is the medium of exchange for paying for storage on the network. The main goal of the project is to become the “backbone storage layer of the internet”.

SC Price Analysis

At the time of writing, SC is ranked the 120th cryptocurrency globally and the current price is US$0.01177. Let’s take a look at the chart below for price analysis:

Source: TradingView

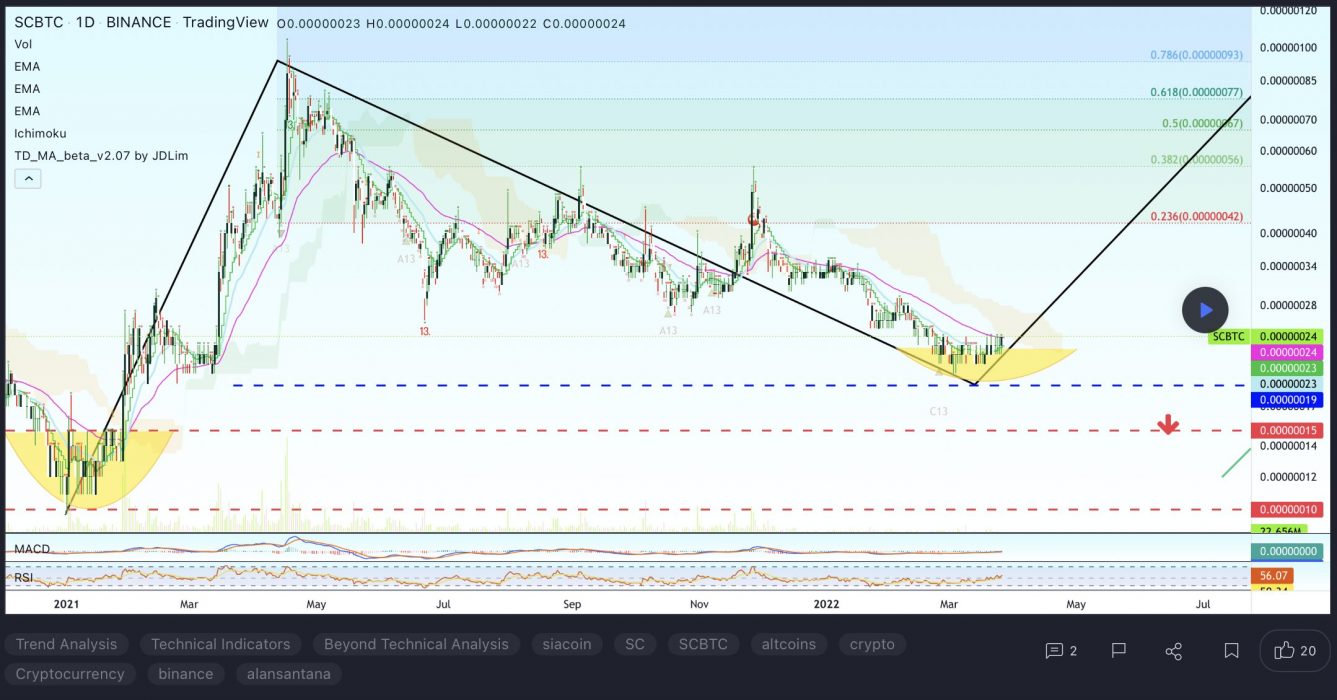
After a 70% decline from December, SC has ranged between $0.008723 and $0.01165.

The recent rally is approaching probable resistance near $0.01290 but could be aiming for stops above the relatively equal highs near $0.01430. Continuation of the bullish move could target the daily gap near $0.01624.

Aggressive bulls might add to positions near $0.01130 and $0.01094. Price action near $0.01012 may be more likely to provide support – if the price reaches it – during any retracements.

Relatively equal lows clustered around $0.009743 seem likely to be swept if the bearish trend resumes. If this move occurs, the price might find support at the significant higher-timeframe level near $0.009375.

3. Avalanche (AVAX)

Avalanche AVAX is the fastest smart contracts platform in the blockchain industry, as measured by time-to-finality, and has the most validators securing its activity of any proof-of-stake protocol. Avalanche is blazingly fast, low-cost, and green. Any smart contract-enabled application can outperform its competition on Avalanche. AVAX is the native token of Avalanche. It is a hard-capped, scarce asset that is used to pay for fees, secure the platform through staking, and provide a basic unit of account between the multiple subnets created on Avalanche.

AVAX Price Analysis

At the time of writing, AVAX is ranked the 10th cryptocurrency globally and the current price is US$86.06. Let’s take a look at the chart below for price analysis:

Source: TradingView

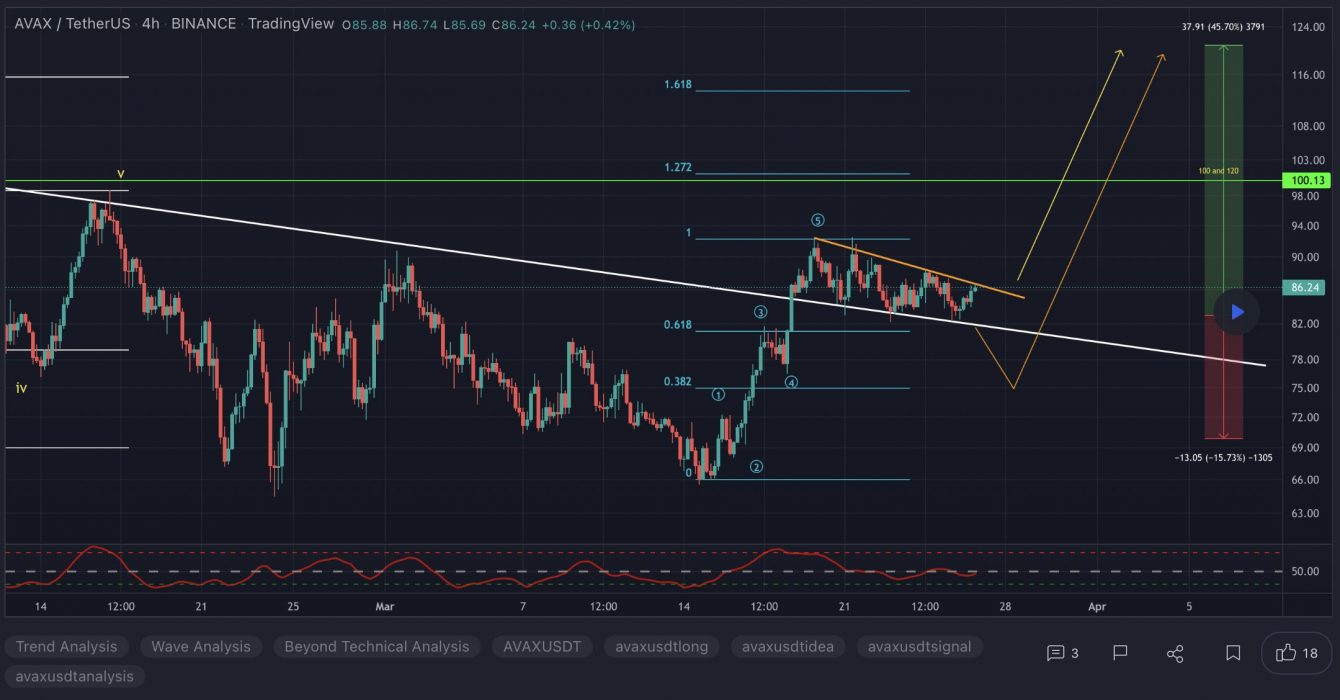
AVAX‘s 55% gains in February ended with an almost 25% retracement as the rest of the altcoin market dropped during early March. Bulls stepped in near the 51.8% retracement of Q4’s move, creating a consolidation that ended with last week’s bullish impulse to resistance near $89.35.

With the 9, 18 and 40 EMAs stacked bullish and a bullish higher-timeframe trend, it’s reasonable to anticipate retracement to possible support before further bullish expansion. 

Near the 40 EMA, a broad zone from $70.15 to $67.45 could see interest from bulls before further expansion. If this level fails, bears might capitalise on any sharp moves down in Bitcoin, aiming for possible support near the 65% retracement, at $63.74, and potentially lower to a higher-timeframe support zone between $58.42 and $55.73.

If the higher-timeframe bullish trend resumes and the current resistance near $97.35 breaks, the wicks near $109.84 and the new monthly highs might see profit-taking.

Learn How to Trade Live!

Join Dave and The Crypto Den Crew and they’ll show you live on a webinar how to take your crypto trading to the next level.

Where to Buy or Trade Altcoins?

These coins have high liquidity on Binance Exchange, so that could help with trading on AUD/USDT/BTC pairs. And if you’re looking at buying and HODLing cryptos, then Swyftx Exchange is an easy-to-use popular choice in Australia.
Categories
Crypto News ICP Market Analysis Shiba Inu Smooth Love Potion Trading

Top 3 Coins to Watch Today: SLP, SHIB, ICP – March 25 Trading Analysis

Let’s take a closer look at today’s altcoins showing breakout signals. We’ll explain what the coin is, then dive into the trading charts and provide some analysis to help you decide.

1. Smooth Love Potion (SLP)

Smooth Love Potion SLP tokens are earned by playing the Axie Infinity game. This digital asset serves as a replacement for experience points. SLP are ERC-20 tokens, and they can be used to breed new digital pets known as Axies. The cost of breeding begins at 100 SLP but increases gradually, rising to 200 SLP for the second breed, 300 for the third, 500 for the fourth, 800 for the fifth, and 1,300 for the sixth. Axies can be bred a maximum of seven times, and the seventh breed costs 2,100 SLP. This limit exists in order to prevent hyperinflation in the marketplace.

SLP Price Analysis

At the time of writing, SLP is ranked the 370th cryptocurrency globally and the current price is US$0.02127. Let’s take a look at the chart below for price analysis:

Source: TradingView

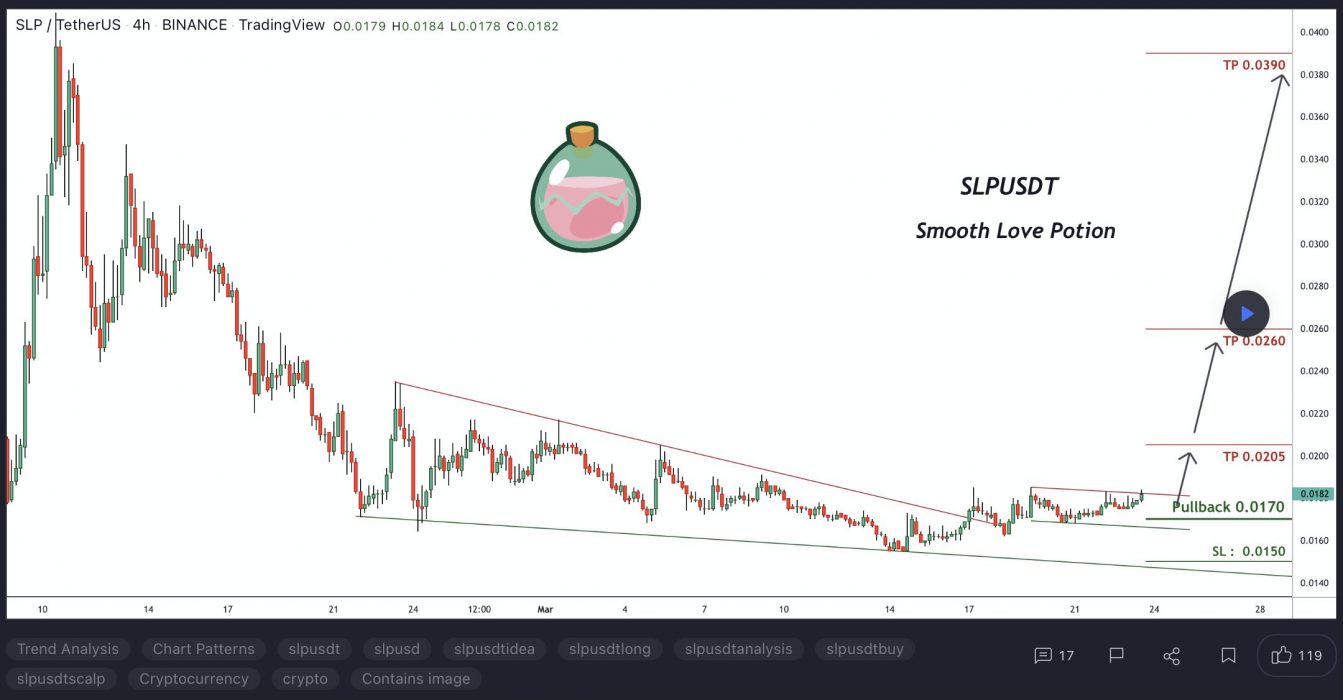
SLP‘s 120% rally during February ran into 48% retracement near $0.01715. Since then, the price has been consolidating in a 40% range between $0.02124 and $0.02562.

Just below the late-December low, $0.01724 is the first level likely to provide substantial support. If the price breaks down through this level, overlapping levels near $0.01658 might cap a run on the lows near $0.01532 and $0.01475.

The higher-timeframe analysis points to the area near $0.02851 as the next substantial resistance. Significant selling has been occurring here on the daily chart. If this level breaks, the swing highs near $0.03127 and $0.03460 may be the next targets.

2. Shiba Inu (SHIB)

Shiba Inu SHIB coin was created anonymously in August 2020 under the pseudonym “Ryoshi”. The meme coin quickly gained traction and value as a community of investors was drawn in by the cute charm of the coin, paired with headlines and tweets from personalities including Elon Musk and Vitalik Buterin.

SHIB Price Analysis

At the time of writing, SHIB is ranked the 15th cryptocurrency globally and the current price is US$0.00002474. Let’s take a look at the chart below for price analysis:

Source: TradingView

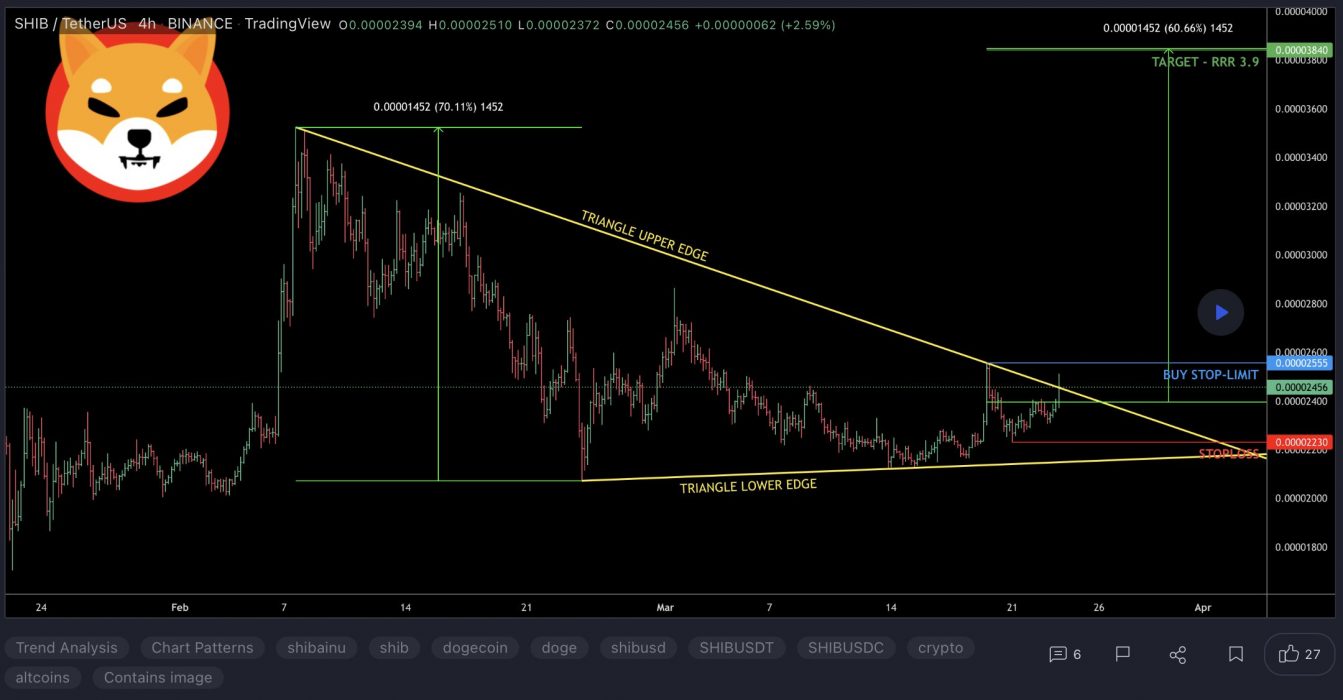
SHIB performed well during February, reaching over 60% from the first week of the month into the resistance near $0.00003542.

For the past several days, the price has been moving in a falling wedge and appears to be flipping old support near $0.00002342 to resistance. If this level breaks – perhaps due to the tempting daily equal lows below – the next support begins near $0.00002129.

Bulls entering at these levels could set their first target near the previous resistance near $0.00002980. Beyond this level, probable targets include the new monthly highs near $0.00003324 and the resistance above near $0.00003652.

A break of this resistance later this month could continue to the new highs near $0.00003782 and $0.00003824.

3. Internet Computer (ICP)

The Internet Computer ICP is the world’s first blockchain that runs at web speed with unbounded capacity. It also represents the third major blockchain innovation, alongside Bitcoin and Ethereum – a blockchain computer that scales smart contract computation and data, runs them at web speed, processes and stores data efficiently, and provides powerful software frameworks to developers. By making this possible, the Internet Computer enables the complete reimagination of software, providing a revolutionary new way to build tokenised internet services, pan-industry platforms, decentralised financial systems, and even traditional enterprise systems and websites.

ICP Price Analysis

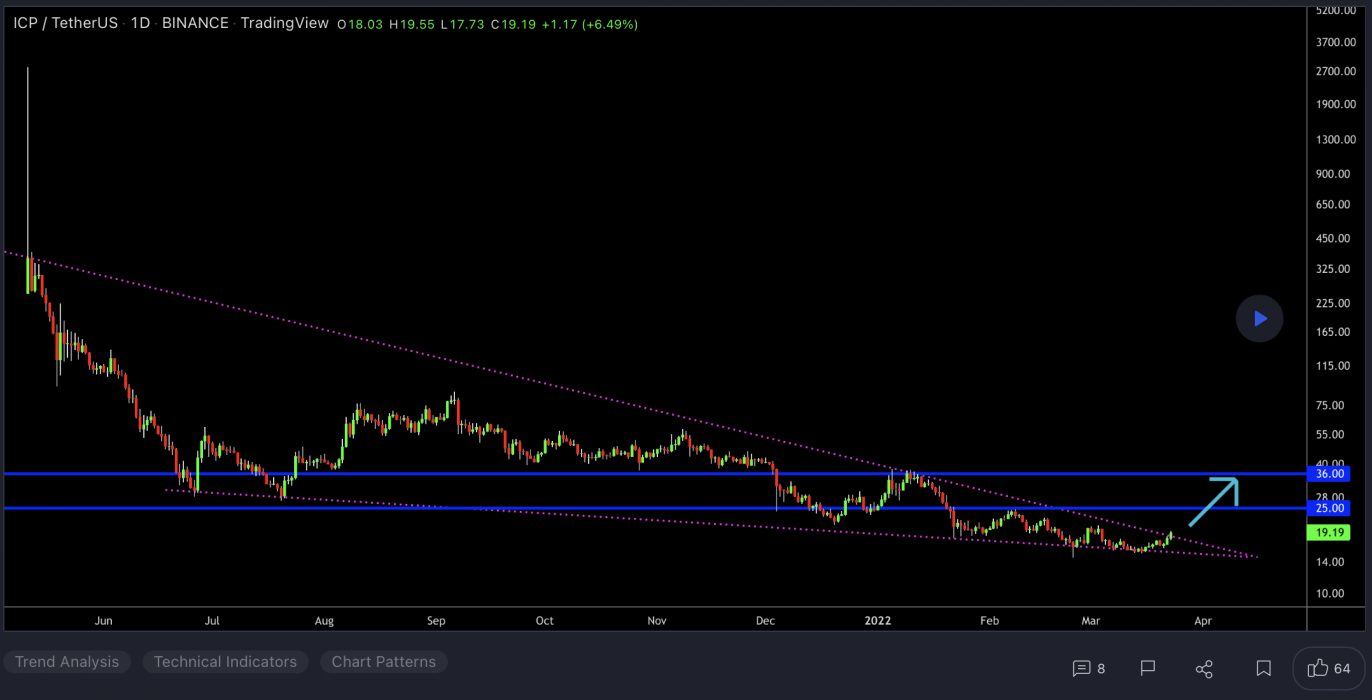
At the time of writing, ICP is ranked the 35th cryptocurrency globally and the current price is US$19.17. Let’s take a look at the chart below for price analysis:

Source: TradingView

During March, ICP also turned the corner, breaking a key swing high. This move could suggest a longer-term bullish trend.

The swing high near $25.24 stands out as a bullish target and marks an area of probable resistance. Further continuation could reach into possible resistance starting near $29.35.

Even if the bearish trend continues, a stop run at the recent swing low near $17.00 into possible support beginning near $16.47 is reasonable. If the price reaches further down, the swing low and possible support near $15.97 might provide another downside target. 

The area near $14.25 could also provide support. However, a drop this far could suggest a stop run below the higher-timeframe relatively equal lows near $13.82 into possible support beginning around $13.00.

Learn How to Trade Live!

Join Dave and The Crypto Den Crew and they’ll show you live on a webinar how to take your crypto trading to the next level.

Where to Buy or Trade Altcoins?

These coins have high liquidity on Binance Exchange, so that could help with trading on AUD/USDT/BTC pairs. And if you’re looking at buying and HODLing cryptos, then Swyftx Exchange is an easy-to-use popular choice in Australia.
Categories
Cardano Crypto News Loopring Market Analysis Solana Trading

Top 3 Coins to Watch Today: ADA, SOL, LRC – March 24 Trading Analysis

Let’s take a closer look at today’s altcoins showing breakout signals. We’ll explain what the coin is, then dive into the trading charts and provide some analysis to help you decide.

1. Cardano (ADA)

Cardano ADA is a proof-of-stake blockchain platform whose stated goal is to allow “changemakers, innovators and visionaries” to bring about positive global change. The open-source project also aims to “redistribute power from unaccountable structures to the margins to individuals”, helping to create a society that is more secure, transparent, and fair. Cardano is used by agricultural companies to track fresh produce from field to fork, while other products built on the platform allow educational credentials to be stored in a tamper-proof way, and retailers to clamp down on counterfeit goods.

ADA Price Analysis

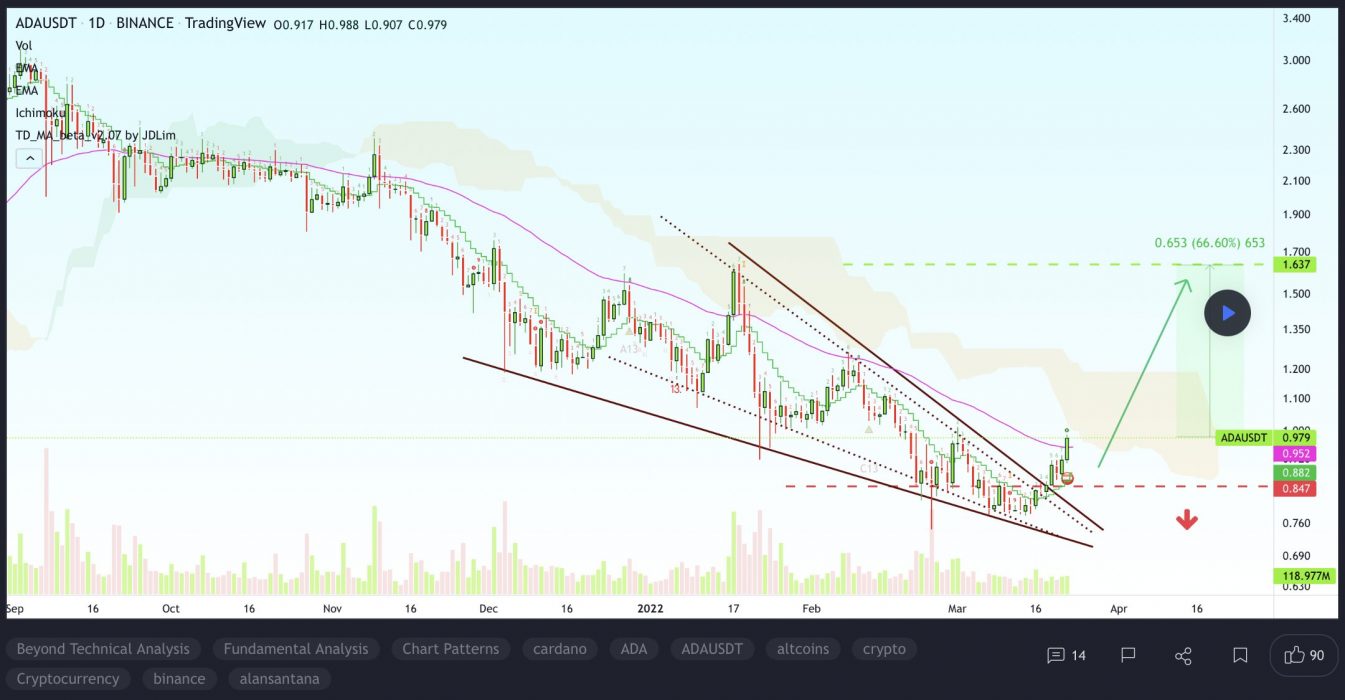
At the time of writing, ADA is ranked the 7th cryptocurrency globally and the current price is US$1.08. Let’s take a look at the chart below for price analysis:

Source: TradingView

ADA‘s near 65% drop during Q3 found a low near $0.7835 last week before closing over a short-term high.

This daily close over the high could signal a shift in market structure that may reach probable resistance near $1.10. A sustained bullish move may target the swing high at $1.14. If this stop run occurs, a run beyond the high into probable resistance near $1.25 and $1.33 is possible.

Bulls could buy a retracement to possible support near $0.9240, just above the weekly open. A bearish turn in the marketplace may propel the price toward possible support near $0.8725. 

However, relatively equal lows near $0.8357 and $0.8022 provide an attractive target for bears if the market resumes its bearish trend. A run on these lows might find support between $0.7847 and $0.7352.

2. Solana (SOL)

Solana SOL is a highly functional open-source project that banks on blockchain technology’s permissionless nature to provide decentralised finance (DeFi) solutions. The Solana protocol is designed to facilitate decentralised app (DApp) creation. It aims to improve scalability by introducing a proof-of-history (PoH) consensus combined with the underlying proof-of-stake (PoS) consensus of the blockchain.

SOL Price Analysis

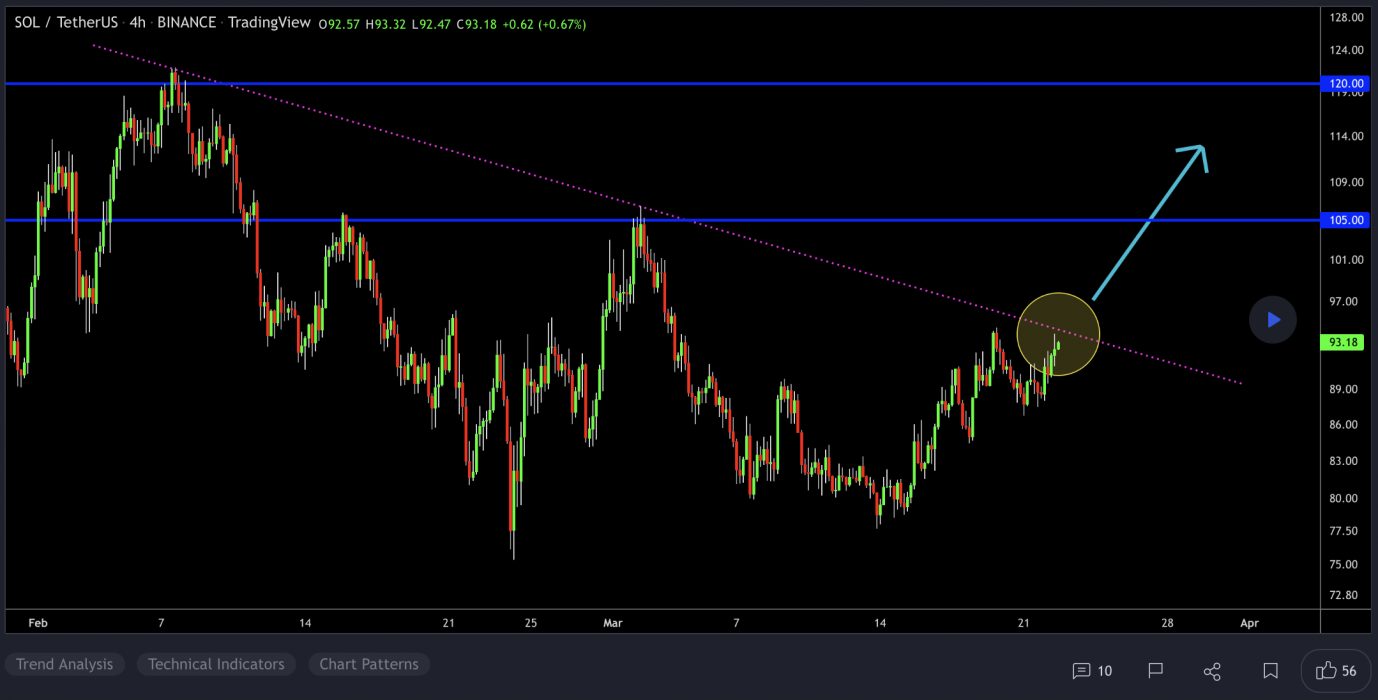
At the time of writing, SOL is ranked the 9th cryptocurrency globally and the current price is US$94.76. Let’s take a look at the chart below for price analysis:

Source: TradingView

SOL has retraced 71% from its November all-time high and reached possible support last week near $82.34. Resistance might begin near $98.24, which has confluence with the 9 and 18 EMAs.

A more substantial rally might reach near the swing high at $110.23 and the 40 EMA. This high is less likely to break if bears plan to continue the downtrend without a lengthier consolidation.

While not highly probable in the current market conditions, a more animated move upward could reach a wide resistance area between $123.42 and $135.94. This zone is where the last movement down accumulated positions before breaking down. 

Possible support rests near $80.34, which showed sensitivity on the last test. While it could provide support again, the higher-timeframe bearish trend is more likely to propel the price into an inefficient area between $76.10 and $70.54. If the price reaches this zone, the May 2021 swing high near $64.13 might mark a more sensitive level.

3. Loopring (LRC)

LRC is the Ethereum-based cryptocurrency token of Loopring, an open protocol designed for the building of decentralised crypto exchanges. Loopring’s purported goal is to combine centralised order matching with decentralised on-blockchain order settlement into a hybridised product that will take the best aspects of both centralised and decentralised exchanges.

LRC Price Analysis

At the time of writing, LRC is ranked the 67th cryptocurrency globally and the current price is US$1.09. Let’s take a look at the chart below for price analysis:

Source: TradingView

LRC lifted off last week, with the impulse sweeping the new swing highs into resistance up to $1.14.

If the price retraces now that it has taken highs, aggressive bulls could look for entries at the recently broken resistance between $1.06 and $0.9950. A deeper retracement that fills the gap down to the monthly level at $0.9460 provides a better entry, with any quick drops near the monthly open at $0.9058 providing the most favourable entries.

Continuation through the current resistance around $1.19 is likely to explode through the remaining daily highs stacked up to $1.28. There’s no telling how far the price could go beyond these new monthly high prices.

Learn How to Trade Live!

Join Dave and The Crypto Den Crew and they’ll show you live on a webinar how to take your crypto trading to the next level.

Where to Buy or Trade Altcoins?

These coins have high liquidity on Binance Exchange, so that could help with trading on AUD/USDT/BTC pairs. And if you’re looking at buying and HODLing cryptos, then Swyftx Exchange is an easy-to-use popular choice in Australia.
Categories
Crypto News Litecoin Market Analysis Terra Trading Zcash

Top 3 Coins to Watch Today: LTC, LUNA, ZEC – March 23 Trading Analysis

Let’s take a closer look at today’s altcoins showing breakout signals. We’ll explain what the coin is, then dive into the trading charts and provide some analysis to help you decide.

1. Litecoin (LTC)

Litecoin LTC is a cryptocurrency designed to provide fast, secure and low-cost payments by leveraging the unique properties of blockchain technology. The cryptocurrency was created based on the Bitcoin protocol, but it differs in terms of the hashing algorithm used, hard cap, block transaction times, and a few other factors. Litecoin has a block time of just 2.5 minutes and extremely low transaction fees, making it suitable for micro-transactions and point-of-sale payments.

LTC Price Analysis

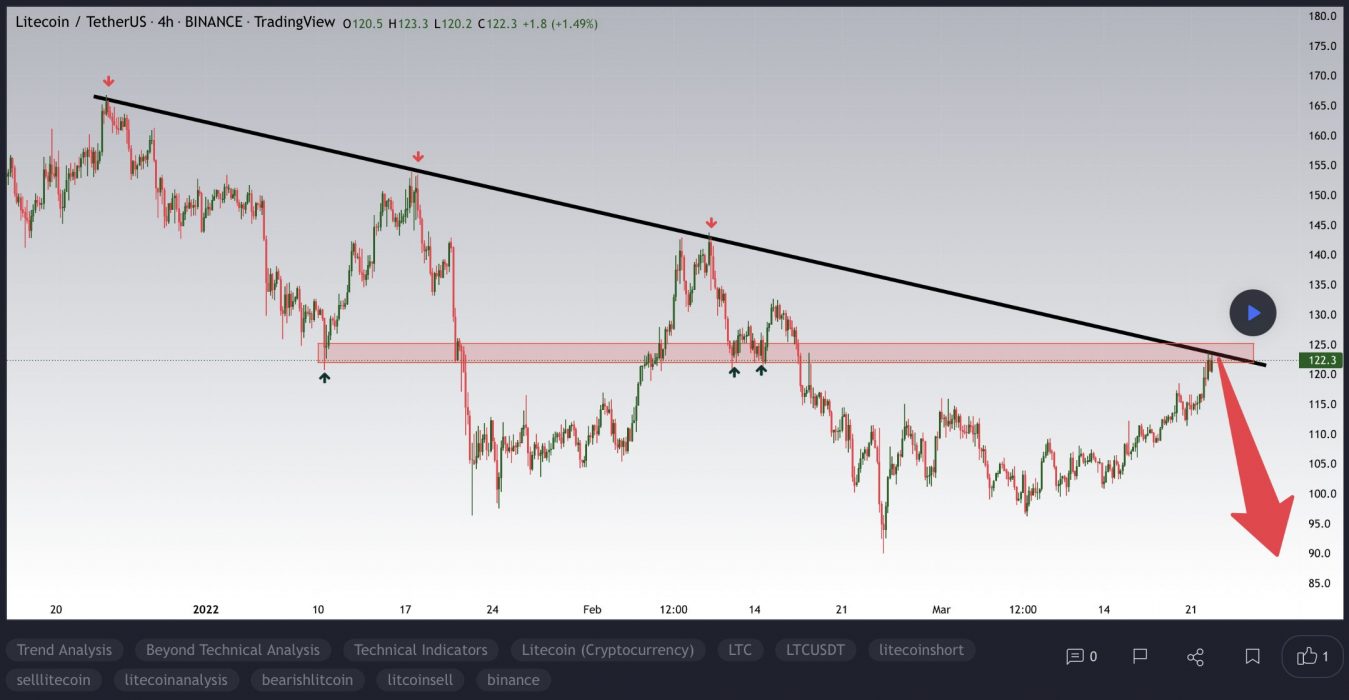
At the time of writing, LTC is ranked the 20th cryptocurrency globally and the current price is US$121.80. Let’s take a look at the chart below for price analysis:

Source: TradingView

After setting a low last week, LTC kicked off a recovery trend that gained nearly 24% to break the weekly highs.

The following 60% plummet found support near $104.36, sweeping under the 40 EMA into the 61.8% retracement level before bouncing to resistance beginning at $124.53.

This area could continue to provide resistance, possibly causing a retracement to the 9 EMA and 18 EMA near $129.12, where aggressive bulls might begin bidding. The level near $137.98, which has confluence with the 40 EMA, may see more interest from bulls loading up for an attempt on probable resistance beginning near $152.13. 

However, if Bitcoin continues its sideways trend, much lower prices could be seen. The old support near $101.18 could provide at least a short-term bounce. If this level fails, the old monthly lows near $94.23 might also give support and see the start of a new bullish cycle after retesting these support levels.

2. Terra (LUNA)

Terra LUNA is a blockchain protocol that uses fiat-pegged stablecoins to power price-stable global payments systems. According to its whitepaper, Terra combines the price stability and wide adoption of fiat currencies with the censorship-resistance of Bitcoin, and offers fast and affordable settlements. Terra’s native token, LUNA, is used to stabilise the price of the protocol’s stablecoins. LUNA holders are also able to submit and vote on governance proposals, giving it the functionality of a governance token.

LUNA Price Analysis

At the time of writing, LUNA is ranked the 7th cryptocurrency globally and the current price is US$92.65. Let’s take a look at the chart below for price analysis:

Source: TradingView

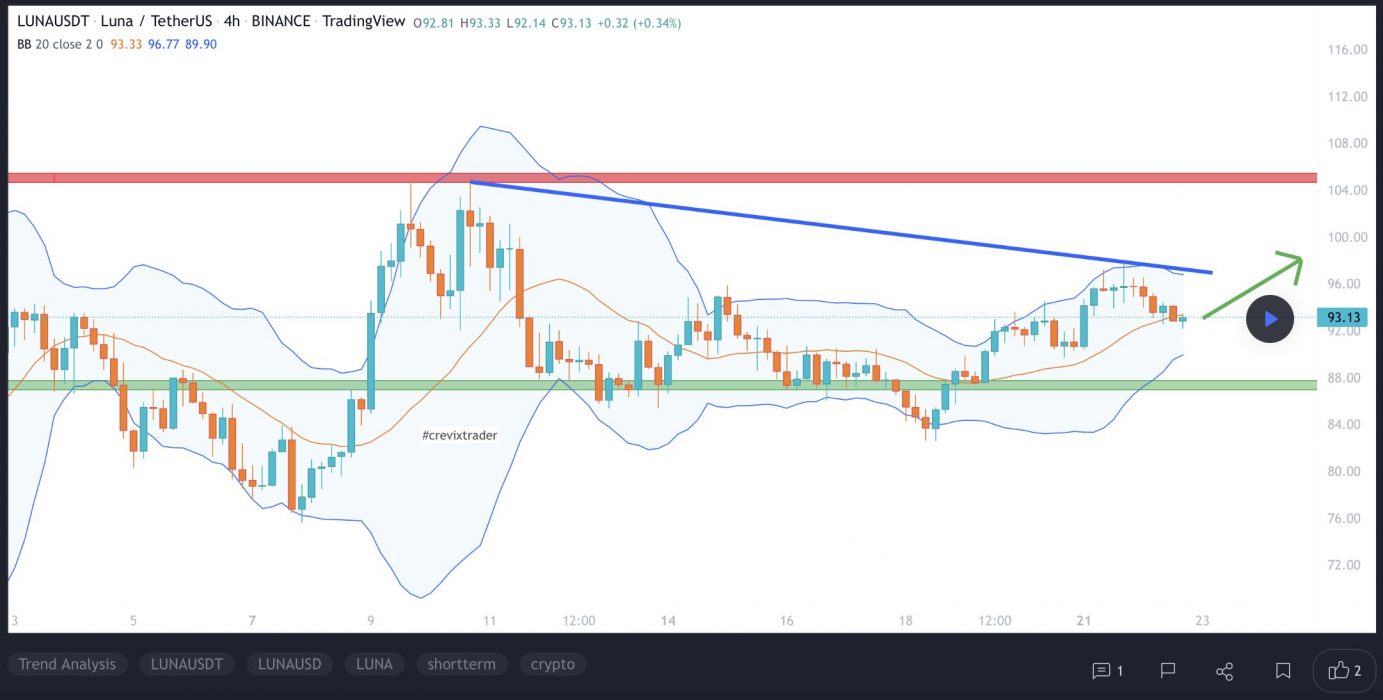
LUNA showed significant strength in the face of a mostly bearish altcoin market, rallying over 90% in late February.

The price is currently retracing from resistance near $102.90, just below the all-time high. Bulls might begin eyeing entries near $82.00, which will soon be near the 18 EMA and between the 61.8% and 78.6% retracement levels of the last leg upward.

A deeper retracement might reach an inefficient zone and the 40 EMA under the last daily swing low, between $77.44 and $74.07. A move below this low suggests a more bearish shift in market structure. If this shift occurs, it could create a short setup to target possible support at the upmove’s accumulation zone, near $70.41.

While the price is retracing, $90.44 offers the closest probable resistance at the 2022 yearly open. Just above, near the March monthly open, the consolidation lows near $96.69 are also a reasonable candidate for resistance.

If the price breaks through these resistances, the significant resistance at $100.69 might also break and allow LUNA to set new all-time highs. However, bulls should keep in mind that the overall market is mostly bearish, decreasing the chances of a massive bullish breakout. If the price does break the all-time high and enter discovery, overlapping extensions near $128.40 offer a possible significant target.

3. Zcash (ZEC)

Zcash ZEC is a decentralised cryptocurrency focused on privacy and anonymity. It uses the zk-SNARK zero-knowledge proof technology that allows nodes on the network to verify transactions without revealing any sensitive information about those transactions. Zcash transactions, on the other hand, still have to be relayed via a public blockchain, but unlike pseudonymous cryptocurrencies, ZEC transactions by default do not reveal the sending and receiving addresses or the amount being sent.

ZEC Price Analysis

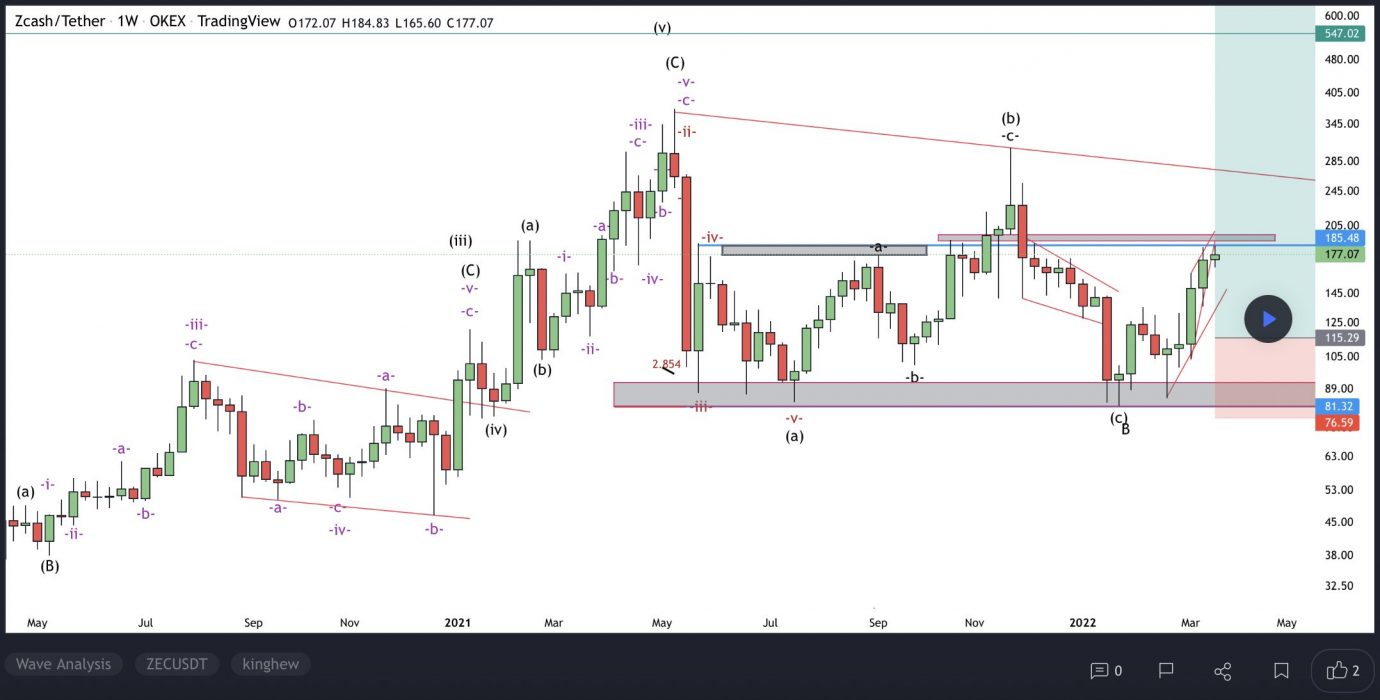
At the time of writing, ZEC is ranked the 50th cryptocurrency globally and the current price is US$176.30. Let’s take a look at the chart below for price analysis:

Source: TradingView

ZEC‘s recent bearish flip of the 9, 18 and 40 EMAs might cause bulls to be less aggressive in bidding. However, possible support near $149.47 and $160.96 – between the 41.8% and 58.6% retracements – could see at least a short-term bounce. 

Last year’s long-term consolidation suggests that the areas near $136.23 may be more likely to cause a longer-term trend reversal. 

Bears are likely to add to their shorts at probable resistance beginning near $180.50, which has confluence with the 18 EMA. A fast break of this resistance could trigger more selling near $192.12, the start of the bearish move.

If an aggressive bullish move does appear, trapped buyers in the probable resistance beginning near $216.41 might provide a ceiling for this impulse.

Learn How to Trade Live!

Join Dave and The Crypto Den Crew and they’ll show you live on a webinar how to take your crypto trading to the next level.

Where to Buy or Trade Altcoins?

These coins have high liquidity on Binance Exchange, so that could help with trading on AUD/USDT/BTC pairs. And if you’re looking at buying and HODLing cryptos, then Swyftx Exchange is an easy-to-use popular choice in Australia.

Categories
Crypto News IoTeX Market Analysis Qtum THORChain Trading

Top 3 Coins to Watch Today: IOTX, QTUM, RUNE – March 22 Trading Analysis

Let’s take a closer look at today’s altcoins showing breakout signals. We’ll explain what the coin is, then dive into the trading charts and provide some analysis to help you decide.

1. IoTeX (IOTX)

IoTeX IOTX has built a decentralised platform with the aim of empowering the open economics for machines – an open ecosystem where people and machines can interact with guaranteed trust, free will, and under properly designed economic incentives. IoTeX is the decentralised backbone for machine economics, which serves machines ranging from smart home devices to autonomous vehicles.

IOTX Price Analysis

At the time of writing, IOTX is ranked the 96th cryptocurrency globally and the current price is US$0.07691. Let’s take a look at the chart below for price analysis:

Source: TradingView

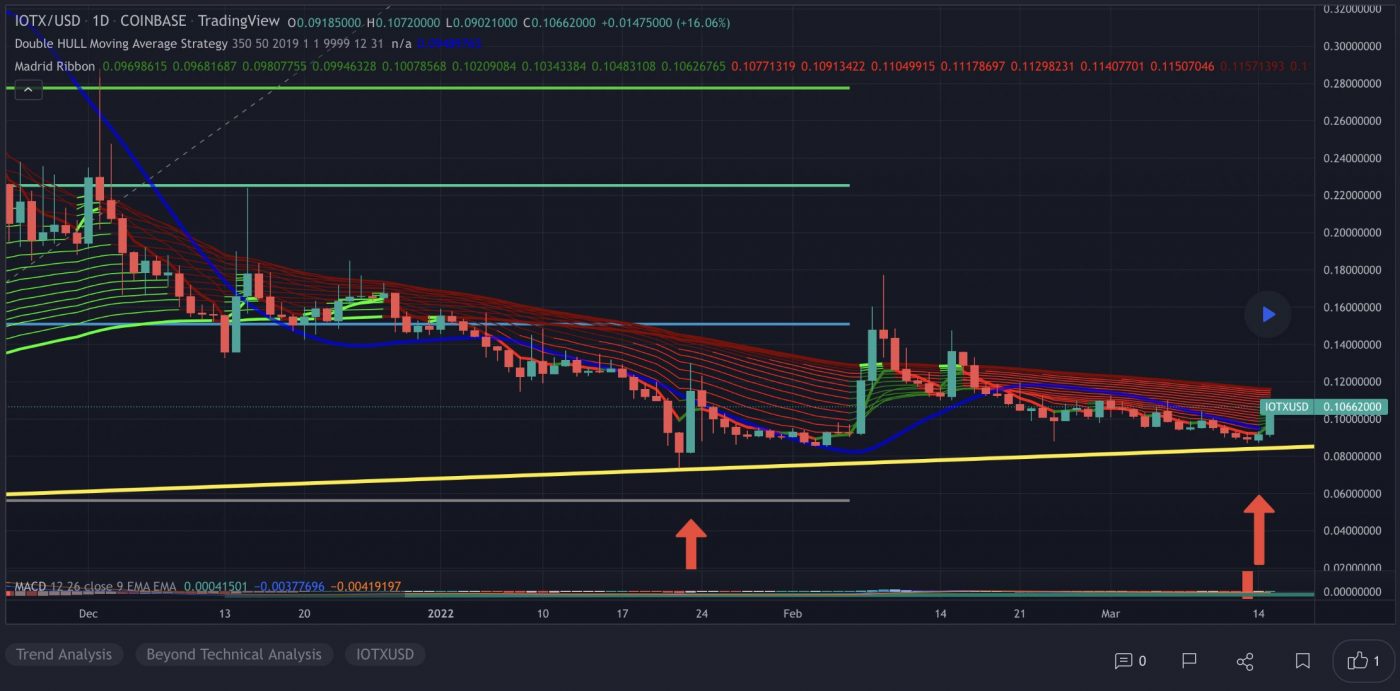
By late February, IOTX had retraced 76% from its November high as it created relatively equal lows near $0.06206.

Just above these lows, the price is testing possible support near $0.07245. This level saw accumulation in early March and could support at least a short move upward.

If this level instead breaks and the price drops, bears could be aiming for an inefficiently traded area between $0.05215 and $0.03327. This area is under multiple relatively equal lows that have been in place since late Q3 2021, providing an appealing target for bears. 

However, a move into probable resistance near $0.08318 could occur first, even if the price later breaks down. This level is a range high for a significant amount of trading during Q1 2022.

If this resistance breaks, the price could reach the next probable resistance near $0.09316, where it consolidated before mid-February’s breakdown.

2. Quantum (QTUM)

Quantum QTUM is a proof-of-stake (PoS) smart contract open-source blockchain platform and value transfer protocol. It aims to bring together the strengths of Bitcoin and Ethereum in one chain. QTUM is built on Bitcoin’s UTXO transaction model, with the added functionality of smart contract execution and DApps. Recently, the platform added support for DeFi applications. 

QTUM Price Analysis

At the time of writing, QTUM is ranked the 100th cryptocurrency globally and the current price is US$6.76. Let’s take a look at the chart below for price analysis:

Source: TradingView

QTUM retraced 74% from its November high before forming a new low near a cluster of older relatively equal lows in late January.

Last week’s sharp rally reached probable resistance near $7.12. This level is near the 61.8% and 78.6% retracements of the last significant move upward.

Possible support rests just below the March open, near $6.27. This area saw significant consolidation in late February and early March. It remains to be seen whether this is a run on bears’ stops before a more substantial move down – or a bullish shift in market structure that could lead to a more significant rally.

With the overall market being bearish and significant numbers of equal lows enticing bears below, traders may want to watch possible support near $4.10. This area is inefficiently traded and borders the last accumulation before Q1 2021’s stunning rally.

Suppose this is the start of a more significant rally. In that case, bulls might target $10.18, where higher timeframes show an inefficiently traded area near multiple bearish rejections during December. A powerful bullish swing could reach up to $11.75, where early December saw inefficient trading and the bulk of Q3 2021’s trading took place.

3. THORChain (RUNE)

ThorChain RUNE is a decentralised liquidity protocol that allows users to easily exchange cryptocurrency assets across a range of networks without losing full custody of their assets in the process. The native utility token of the THORChain platform is RUNE. This is used as the base currency in the THORChain ecosystem and is also used for platform governance and security as part of THORChain’s Sybil resistance mechanisms – since THORChain nodes must commit a minimum of 1 million RUNE to participate in its rotating consensus process.

RUNE Price Analysis

At the time of writing, RUNE is ranked the 47th cryptocurrency globally and the current price is US$8.61. Let’s take a look at the chart below for price analysis:

Source: TradingView

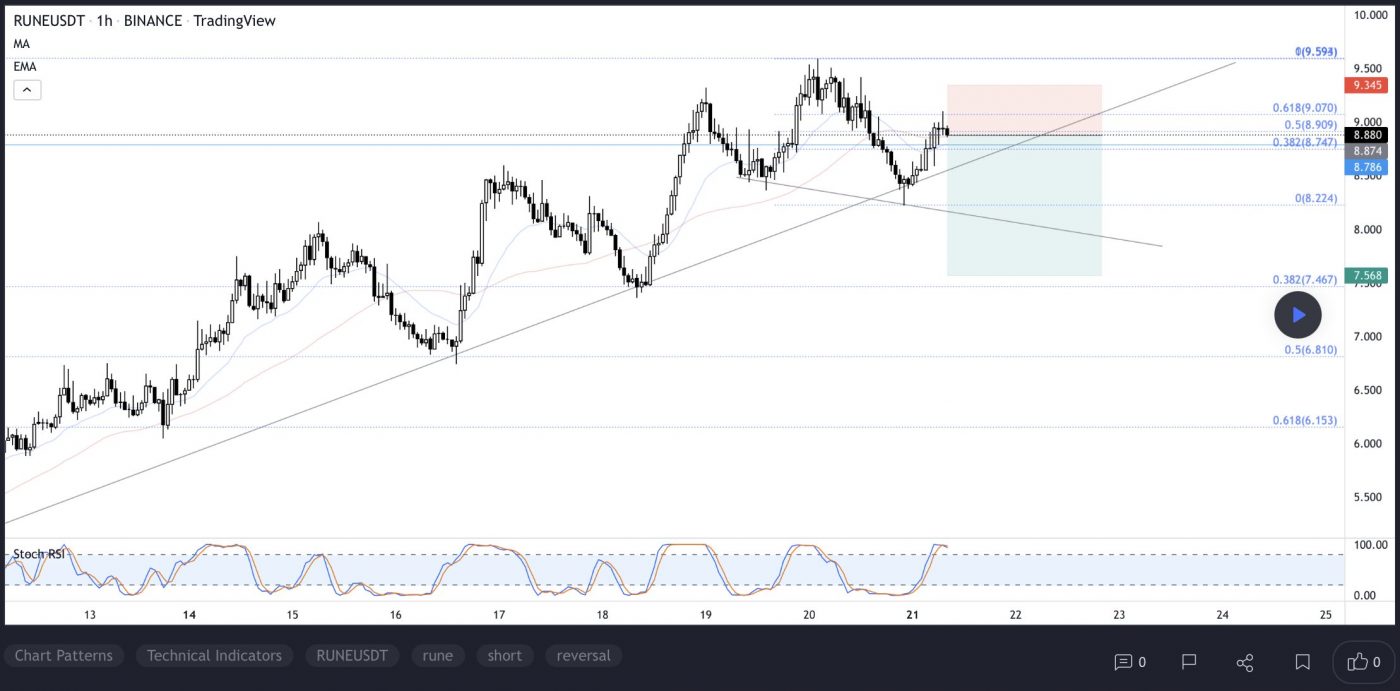
RUNE abruptly rallied after retracing nearly 83% from its November high, climbing 218% from its late February low.

Bulls are currently taking profits in a contested area between $8.28 and $9.23. This area saw inefficient trading on higher timeframes. It could serve as support if the price trades through its high end and retests it – or as resistance if the price breaks back below.

The closest support rests just below, near $8.21. The old high at this level could support a rally into resistance near $9.50.

A move through the closest resistance might target the consolidation midpoint near $10.80, near the 27% extension of the current rally. If this level breaks, bulls might target an inefficient area near $12.89 and beyond.

If the price rejects from this level and breaks the closest support, it could find support near the midpoint of the current range and 2022 yearly open, near $6.09. The price might also find support slightly below near the 61.8% retracement level, around $5.98.

If these supports break, bears might be targeting four relatively equal lows near $3.10, under the March monthly open.

Learn How to Trade Live!

Join Dave and The Crypto Den Crew and they’ll show you live on a webinar how to take your crypto trading to the next level.

Where to Buy or Trade Altcoins?

These coins have high liquidity on Binance Exchange, so that could help with trading on AUD/USDT/BTC pairs. And if you’re looking at buying and HODLing cryptos, then Swyftx Exchange is an easy-to-use popular choice in Australia.
Categories
Market Analysis The Crypto Den

TradeRoom: Our Weekly Crypto Trades Analysis – Mar 21, 2022

Welcome to this weekly series from the TradeRoom. My name is Dave and I’m the founder of The Crypto Den, an Australian-based crypto trading and education community aiming to give you the knowledge to take your trading game to the next level.
Crypto Market Outlook

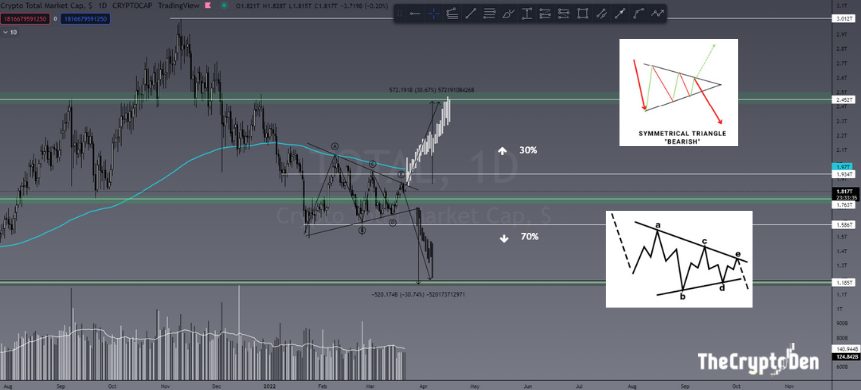
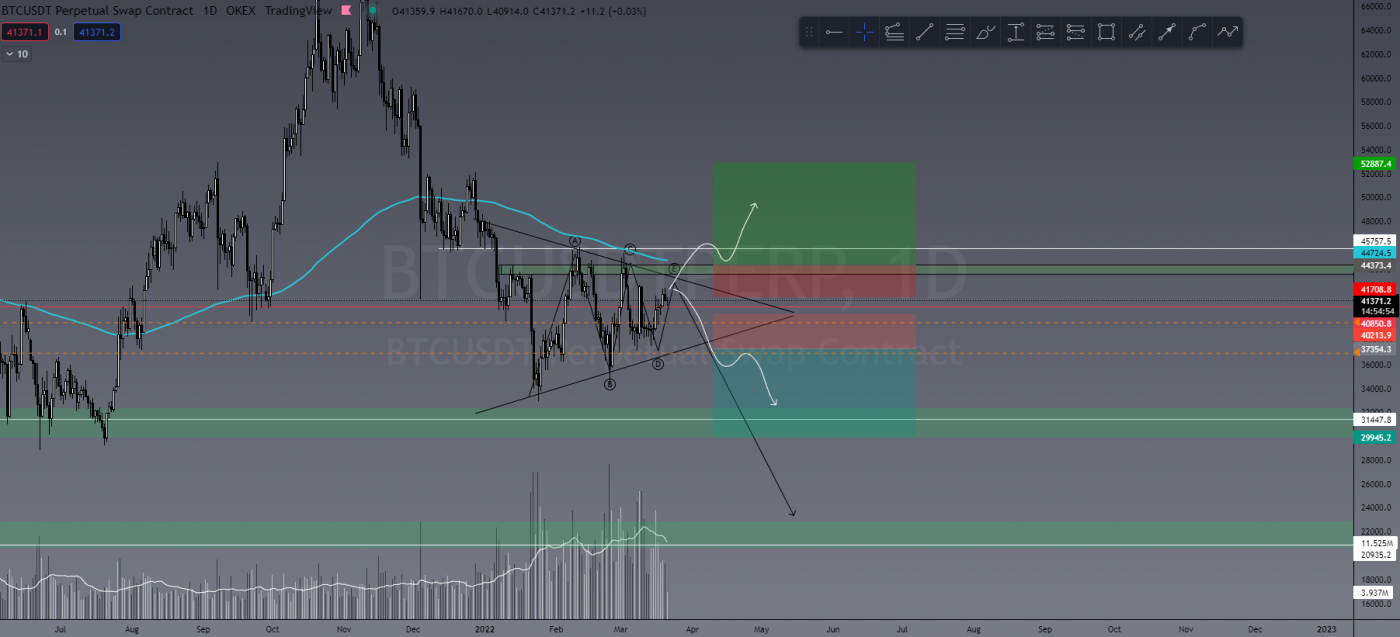
The market is constricting into a decision point. Up or down? Well, we’ll know soon. The TOTAL, like BTC, is still in this symmetrical triangle pattern. Like I said last week, this is generally a continuation pattern with a 70% chance of persisting with the current trend, leaving a 30% chance of reversal. In the chart below, you can see that in both directions we have a high probability of moving 30%, leaving us currently sitting at an equilibrium (EQ).

TOTAL Marketcap

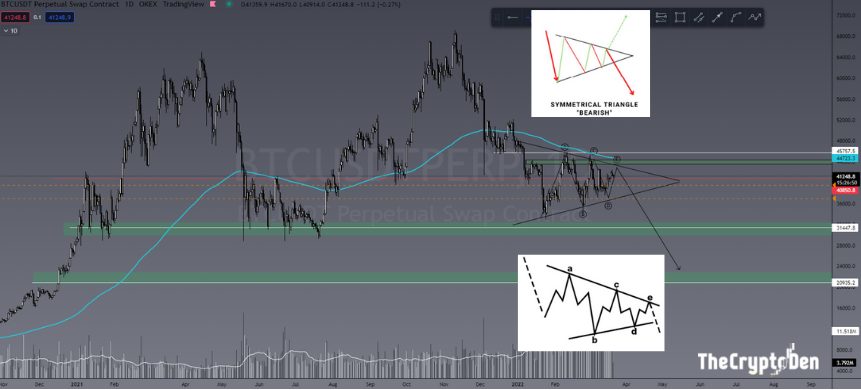
Elliott Wave Theory would suggest we are in this bearish symmetrical triangle, also with an ABCDE consolidation. While ever it remains below the daily 200EMA, this will be my bias, which I’ve stated many times.

BTC is painting the same pattern and scenario. Despite popular belief, I’m not a “permabear” – I just trade what’s in front of me and even though we have seen some small pumps in price action, I’m still not seeing anything overly bullish. Does this mean BTC is all doom and gloom? No. It just means that for me, it’s bearish until it’s not, and that point of invalidation is a breakout above local market structure (US$45,760) and the daily 200EMA, and to hold above for a few days to a week.

BTC/USDT

Last Week’s Performance

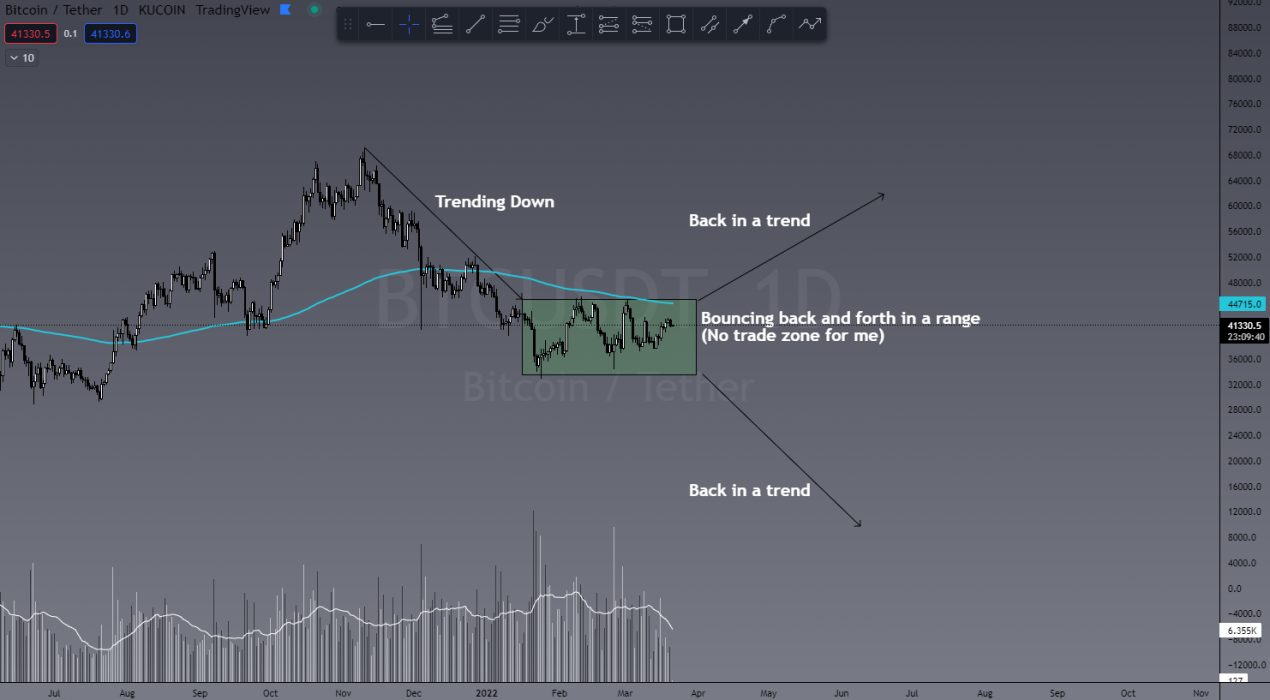
Again, like the week before last, I didn’t enter any new positions. The reason for this is I don’t like to trade a ranging market. I like to trade with A trend. And while ever it’s ranging, it’s NOT trending.

I still have 11 short positions open but have not opened anything new in two weeks. I’m waiting for the market to decide which trend it’s going to follow. Continue down? Or reverse and head up? Either way, I’m waiting.

Here is a visual representation of what I mean by my no trade zone:


This Week’s Trades

WAVES/USDT

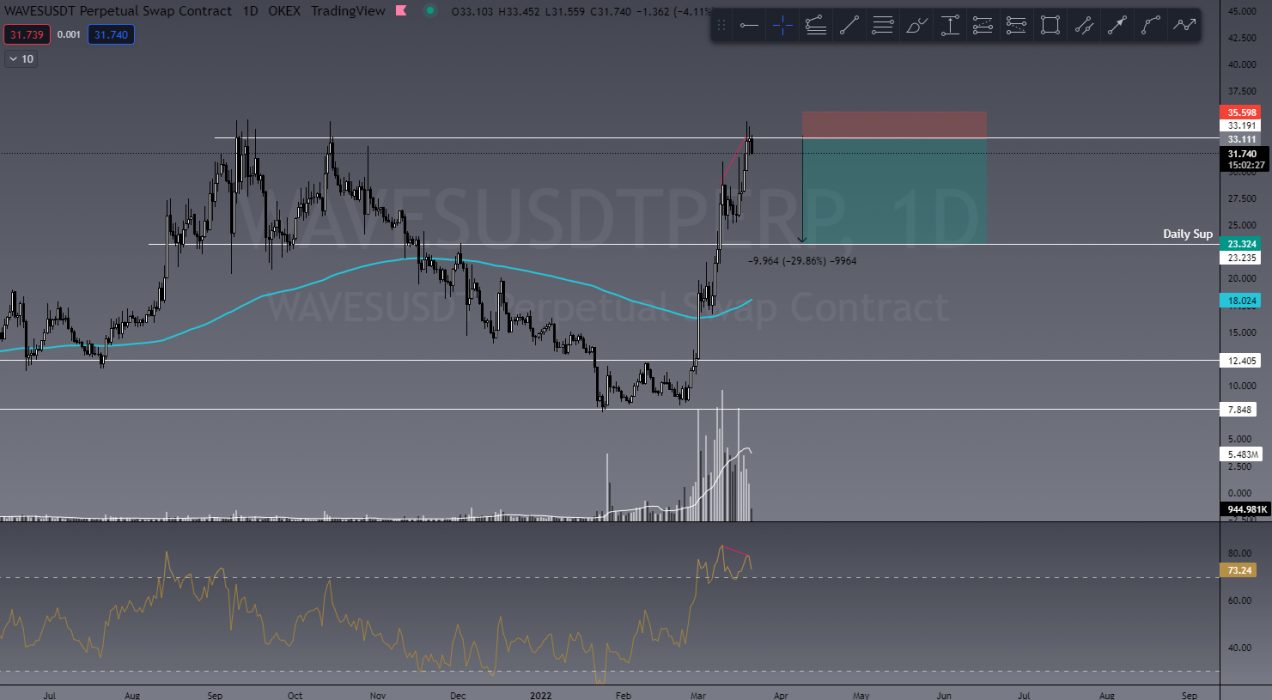
This is a tough one due to the fundamentals surrounding WAVES at the moment with all that’s happening in Ukraine, but from a technical standpoint I’m seeing a daily bearish divergence at daily resistance with declining volume. So we could certainly see a retracement here soon. I’ll be entering a small position.

WAVES/USDT

BTC/USD

For BTC, I’m hoping we get a decision this week. One way or another, I have a plan and so should you! If we break to the upside, I’ll wait for the pullback to confirm new support and enter LONG. If we break to the downside, I’ll do the reverse and wait for the retest on enter SHORT. As a trader trading on leverage, it doesn’t matter to me.

BTC/USDT


Introducing TCD’s New Social Platform

The Crypto Den now has a FREE purpose-built social platform to share investment ideas, trade chat, connect to like-minded people, share info and more, without the censorship of Facebook. The platform is designed for those more focused on the investment/profitable side of the crypto world.


Are You a Trader?

Invite to Join our TradeRoom

If you’d like to become a better trader, you’re invited to join our TradeRoom where we share daily charts and market analysis. In our community we strongly encourage and teach correct risk management strategies to keep our members safe in this new volatile crypto market.
Join our “Apprentice” plan now for your 7-day trial.


The Crypto Den was created in 2017 to help the rapidly growing crypto community learn and understand the fundamentals of digital currencies and how to trade them. 

Since then we have taught thousands of members the basics of technical analysis and trading strategies to further progress and perfect their trading abilities.

In the TradeRoom you will be included in a supportive environment which encourages personal growth, education and community support.

It’s a place to share your trading ideas and follow other experienced traders’ feeds to help keep your finger on the pulse of such a volatile market!