Categories
Crypto News Ethereum Classic Market Analysis Trading

Top 3 Coins to Watch Today: ETC, CRV, DEGO – November 19 Trading Analysis

Let’s take a closer look at today’s altcoins showing breakout signals. We’ll explain what the coin is, then dive into the trading charts and provide some analysis to help you decide.

1. Ethereum Classic (ETC)

Ethereum Classic ETC is a hard fork of Ethereum that launched in July 2016. Its main function is as a smart contract network, with the ability to host and support decentralised applications (DApps). Its native token is ETC. Since its launch, Ethereum Classic has sought to differentiate itself from Ethereum, with the two networks’ technical roadmaps diverging further with time. Ethereum Classic first set out to preserve the integrity of the existing Ethereum blockchain after a major hacking event led to the theft of 3.6 million ETH.

ETC Price Analysis

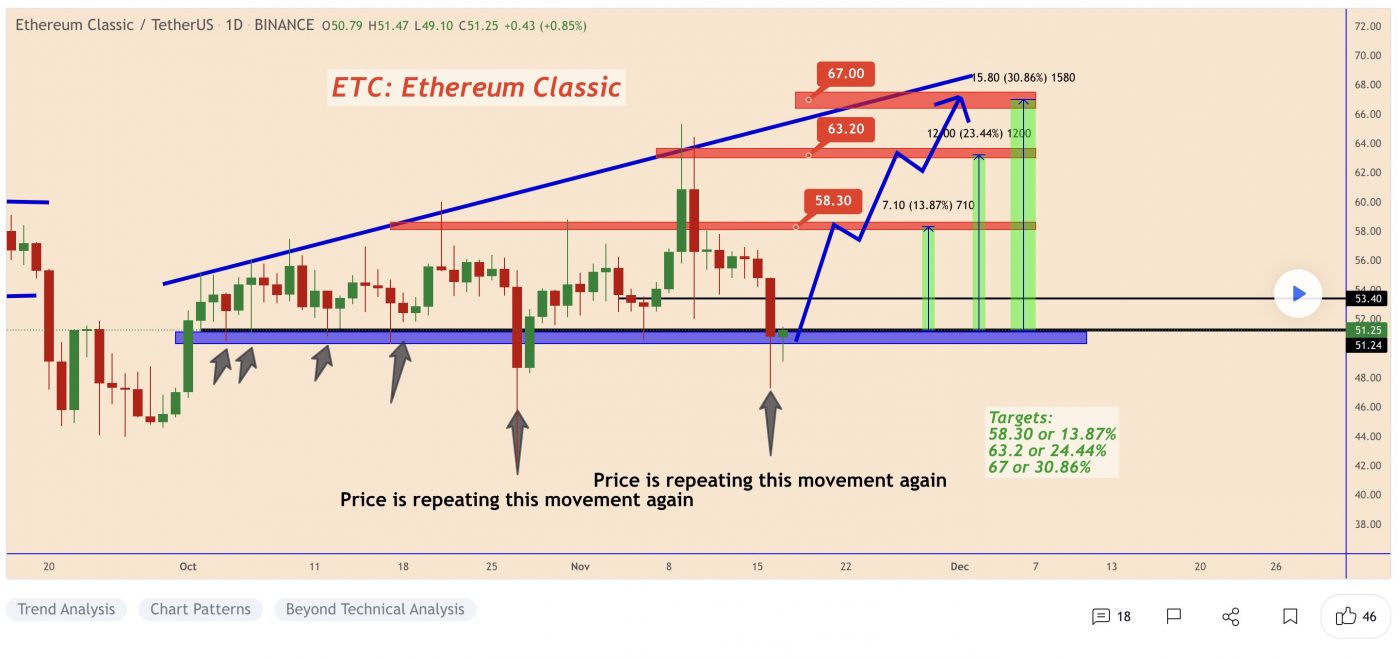
At the time of writing, ETC is ranked the 30th cryptocurrency globally and the current price is US$48.65. Let’s take a look at the chart below for price analysis:
Source: TradingView

During October, ETC broke several swing highs that could be the signal for a new bullish trend.

Last week’s break of the most recent swing low could suggest some downside in the short term. It formed probable resistance near $46.32 and may target the swing low and possible support near $43.90.

The swing low and possible support near $40.21 could be the second bearish target if the move down continues. The relatively equal lows near $38.00 and possible support underneath near $36.75 could provide more substantial support.

The last swing high near $52.44 gives a near-term target if bullish continuation continues. However, resistance beginning around $55.80 could cap this move. A break of this resistance might continue to probable resistance near $57.03 and reach above the cluster of relatively equal highs near $62.89.

2. Curve DAO Token (CRV)

Curve CRV is a decentralised exchange for stablecoins that uses an automated market maker (AMM) to manage liquidity. Curve has gained considerable attention by following its remit as an AMM specifically for stablecoin trading. The launch of the DAO and CRV token brought in further profitability, given CRV’s use for governance, as it is awarded to users based on liquidity commitment and length of ownership. The explosion in DeFi trading has ensured Curve’s longevity, with AMMs turning over huge amounts of liquidity and associated user profits.

CRV Price Analysis

At the time of writing, CRV is ranked the 80th cryptocurrency globally and the current price is US$3.68. Let’s take a look at the chart below for price analysis:

Source: TradingView

Last month, bulls enjoyed 95% gains at CRV‘s peak before the price confirmed stiff resistance beginning at $4.60.

The 4-Hour chart shows that support may be forming between $3.56 and $3.50, near the monthly open. Aggressive bulls could enter in this area, although safer entries may be found much further below near $3.44 and $3.39 after a sweep of the current consolidation’s swing lows.

The last swing high near $3.98 provides a likely first target if the price does bounce from this region. Beyond this swing high, the 1.0 extension near $4.29 and the 2.0 extension near $4.52 and $4.65 may provide the next major targets.

3. Dego Finance (DEGO)

Dego Finance DEGO is a decentralised ecosystem that offers a diverse combination of the non-fungible token (NFT) and decentralised finance (DeFi) tools. It is an independent, open NFT ecosystem. Any user is allowed to launch an NFT and initiate mining, auctions and trading, covering the entire lifecycle of the product. Dego’s NFT protocol is a cross-chain, second-layer infrastructure for Blockchain projects that can be leveraged for user acquisition and token distribution.

DEGO Price Analysis

At the time of writing, DEGO is ranked the 554th cryptocurrency globally and the current price is US$7.48. Let’s take a look at the chart below for price analysis:

Source: TradingView

During October, bulls enjoyed 85% gains at DEGO‘s peak before the price confirmed strong resistance beginning at $10.25.

The 1-Day chart shows that support may be forming between $7.32 and $7.12, near the weekly open. Aggressive bulls could enter in this area, although safer entries may be found much further below near $6.82 and $6.58 after a sweep of the current consolidation’s swing lows.

The last swing high near $7.83 provides a likely first target if the price does bounce from this region. Beyond this swing high, the 1.0 extension near $8.15 and the 2.0 extension near $8.40 may provide the next major targets.

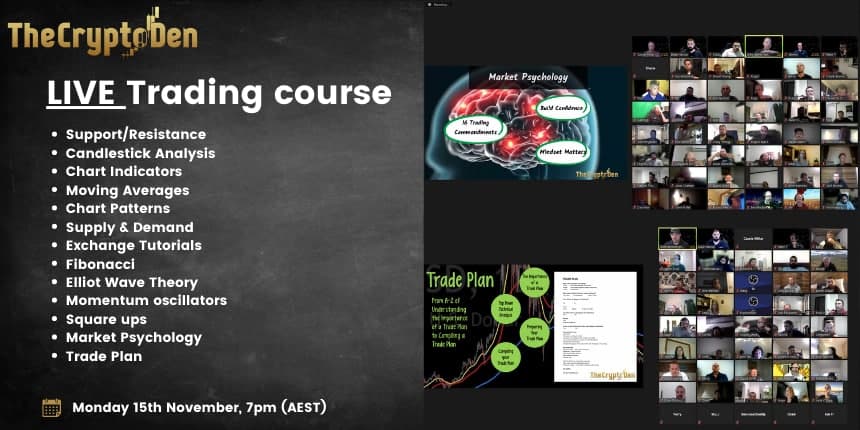
Learn How to Trade Live!

Join Dave and The Crypto Den Crew and they’ll show you live on a webinar how to take your crypto trading to the next level.

Duration: 6-week course
From: November 15 to December 22
Date/Time: Twice a week, Mon and Wed at 7pm AEST
Location: Zoom webinar
Where to Buy or Trade Altcoins?

These coins have high liquidity on Binance Exchange, so that could help with trading on AUD/USDT/BTC pairs. And if you’re looking at buying and HODLing cryptos, then Swyftx Exchange is an easy-to-use popular choice in Australia.

Categories
Crypto News Market Analysis Solana Trading

Top 3 Coins to Watch Today: SOL, ENJ, MTL – November 18 Trading Analysis

Let’s take a closer look at today’s altcoins showing breakout signals. We’ll explain what the coin is, then dive into the trading charts and provide some analysis to help you decide.

2. Solana (SOL)

Solana SOL is a highly functional open-source project that banks on blockchain technology’s permissionless nature to provide decentralised finance (DeFi) solutions. The Solana protocol is designed to facilitate decentralised app (DApp) creation. It aims to improve scalability by introducing a proof-of-history (PoH) consensus combined with the underlying proof-of-stake (PoS) consensus of the blockchain.

SOL Price Analysis

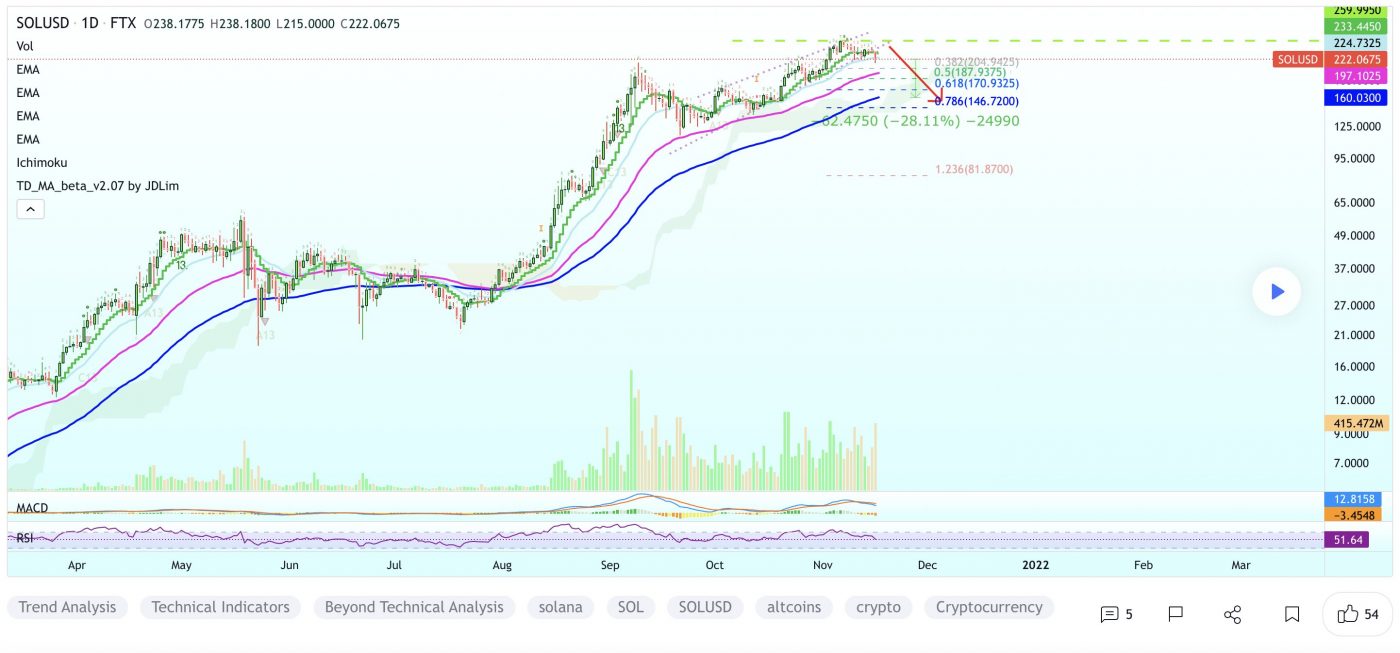
At the time of writing, SOL is ranked the 5th cryptocurrency globally and the current price is US$211.32. Let’s take a look at the chart below for price analysis:

Source: TradingView

SOL retraced nearly 75% from its high before finding a low during mid-October. Since then, the price has been sweeping stops on both sides of its local range as the current consolidation sets up the next move.

Aggressive bulls might bid near $205, although a sweep of the stops near $195 could reach below the next swing low into possible support near $188. A continued downtrend might run into the weekly gap near $173.

Some bears might add more shorts near $200, although a push to $224 is reasonable. A daily candle close over the swing high near $245 could suggest that a longer-term trend reversal is in play, with bulls possibly entering on a retracement near $276.

2. Enjin Coin (ENJ)

Enjin Coin ENJ is a project of Enjin, a company that provides an ecosystem of interconnected, blockchain-based gaming products. Enjin’s flagship offering is the Enjin Network, a social gaming platform through which users can create websites and clans, chat, and host virtual item stores. Enjin Coin is a digital store of value used to back the value of blockchain assets such as non-fungible tokens (NFTs).

ENJ Price Analysis

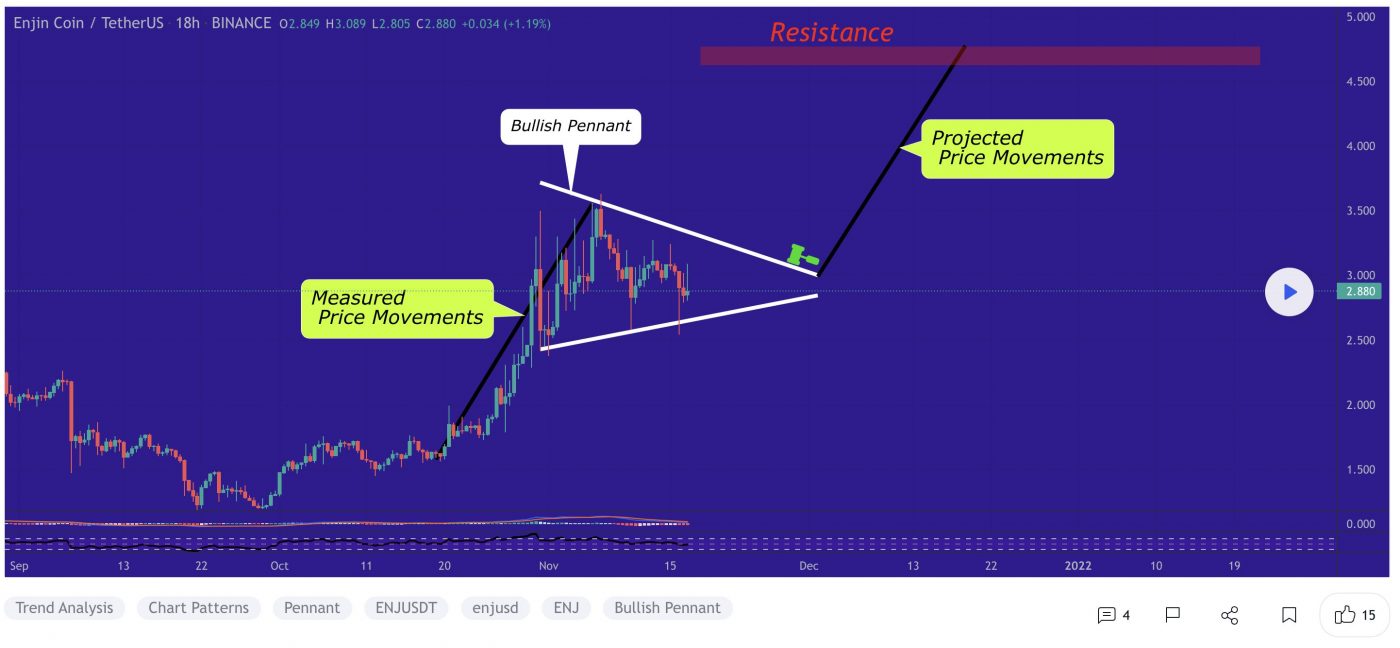
At the time of writing, ENJ is ranked the 65th cryptocurrency globally and the current price is US$2.87. Let’s take a look at the chart below for price analysis:

Source: TradingView

ENJ spent November ranging across the monthly open, reaching 25% over and 30% below. The price is currently consolidating between adjacent resistance and support at $3.10 with no clear higher-timeframe trend. A strong move over the monthly open could signal a run to resistance beginning near $3.28. 

This move would likely target the swing high at $3.36 and relatively equal highs near $3.42. A sustained bullish trend could reach up to the monthly high near $3.50.

Bulls might see a sweep of the relatively equal lows near $2.70 as a chance to buy at a discount. If this level fails to hold, the next significant area for the price to find buyers is likely near the consolidation around $2.63 and $2.58.

3. Metal (MTL)

Metal MTL is the native currency of Metal products and an essential part of the Metal ecosystem. Sending and receiving any crypto to friends on Metal Pay is, according to the team, instant and feeless. Designed to make cryptocurrency payments fast and easy, users pay zero fees when sending, receiving, buying or selling MTL. On the Metal X exchange, users can reduce fees by paying the fee in MTL. Additionally, users can receive loyalty benefits for holding MTL inside the exchange.

MTL Price Analysis

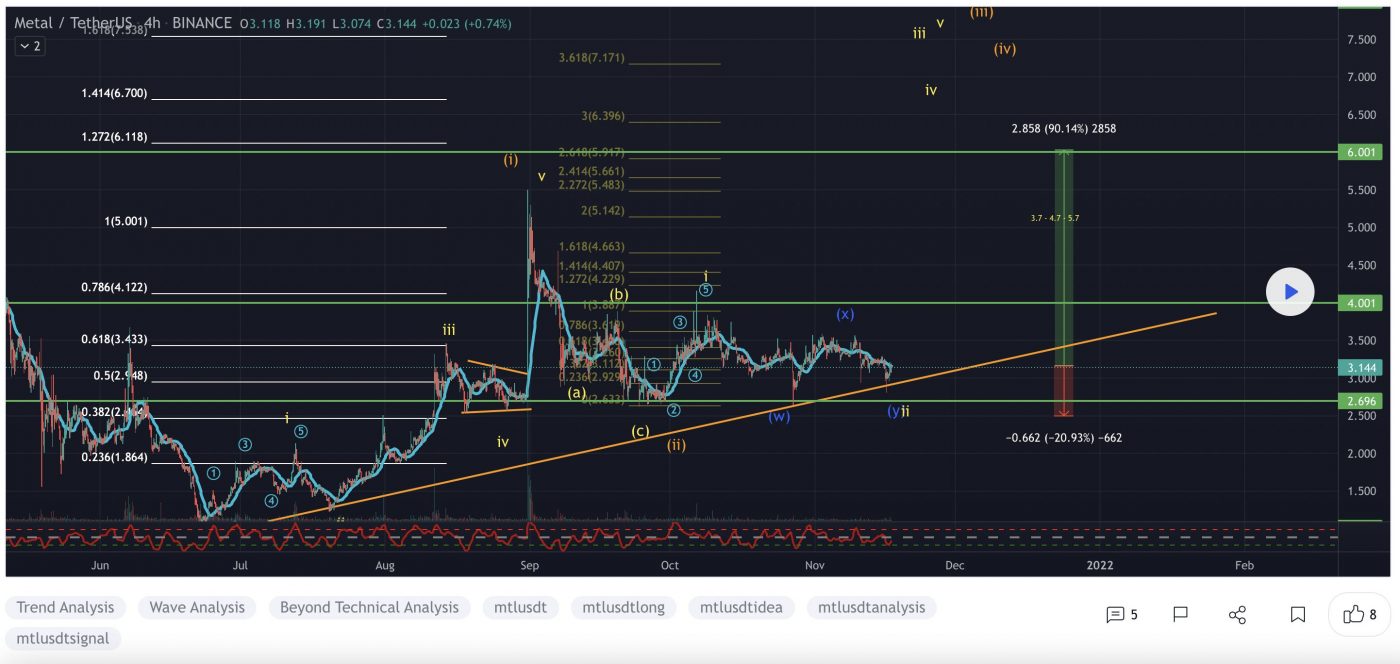
At the time of writing, MTL is ranked the 317th cryptocurrency globally and the current price is US$3.20. Let’s take a look at the chart below for price analysis:

Source: TradingView

MTL‘s strong downtrend that began in September has retraced most of its Q3 move, recently sweeping lows near $2.81 but struggling to find strong support.

A sweep of the relatively equal lows near $3.11 into possible support around $2.98, combined with bullish market conditions, could be the catalyst that begins to form a bottom. If this level fails, bulls might buy the monthly gap’s low near $2.81.

The swing low near $3.15 may form resistance to any sudden pumps as holders unload some of their position. A more substantial move might sweep relatively swing highs into probable resistance near $3.37, potentially reaching up to monthly open near $3.50.

Learn How to Trade Live!

Join Dave and The Crypto Den Crew and they’ll show you live on a webinar how to take your crypto trading to the next level.

Duration: 6-week course
From: November 15 to December 22
Date/Time: Twice a week, Mon and Wed at 7pm AEST
Location: Zoom webinar

Where to Buy or Trade Altcoins?

These coins have high liquidity on Binance Exchange, so that could help with trading on AUD/USDT/BTC pairs. And if you’re looking at buying and HODLing cryptos, then Swyftx Exchange is an easy-to-use popular choice in Australia.

Categories
Crypto News Market Analysis Trading

Top 3 Coins to Watch Today: MATIC, ATOM, AXS – November 17 Trading Analysis

Let’s take a closer look at today’s altcoins showing breakout signals. We’ll explain what the coin is, then dive into the trading charts and provide some analysis to help you decide.

1. Polygon (MATIC)

Polygon MATIC is the first well-structured, easy-to-use platform for Ethereum scaling and infrastructure development. Its core component is Polygon SDK, a modular, flexible framework that supports building multiple types of applications. The MATIC token will continue to exist and will play an increasingly important role, securing the system and enabling governance.

MATIC Price Analysis

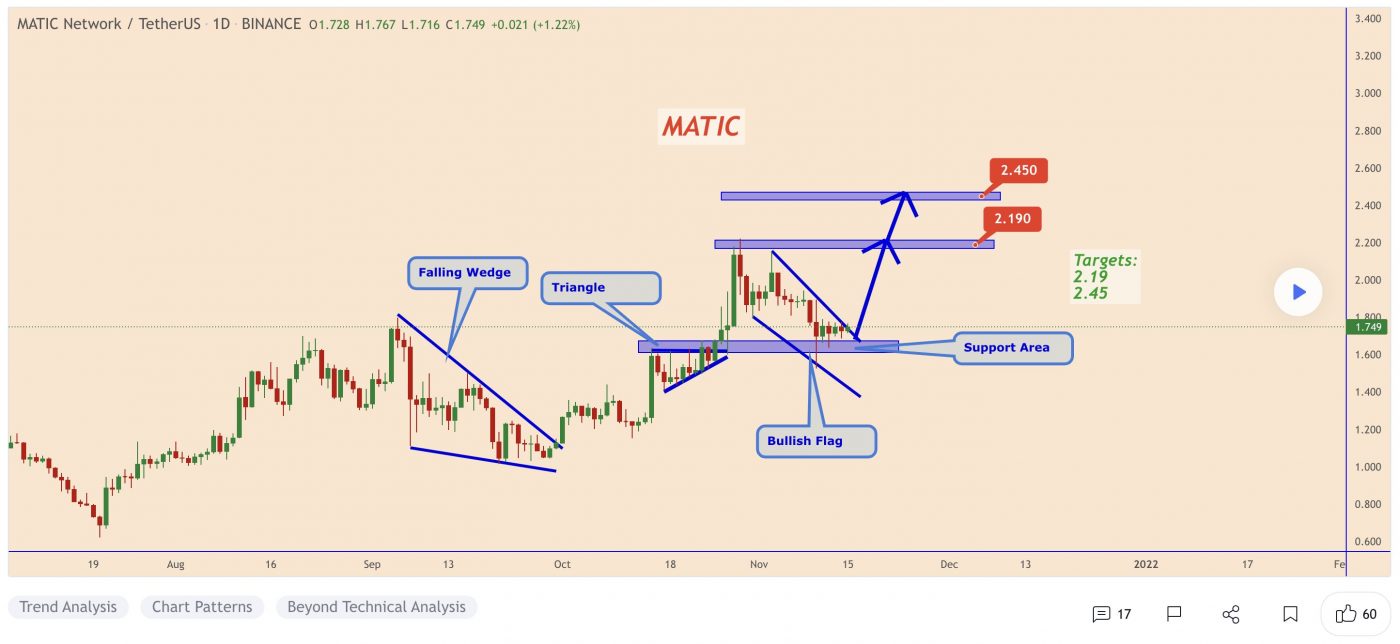
At the time of writing, MATIC is ranked the 20th cryptocurrency globally and the current price is US$1.60. Let’s take a look at the chart below for price analysis:

Source: TradingView

October marked a turning point for MATIC, with the price rocketing up almost 80% from its lows to probable resistance beginning near $2.04.

The price is currently struggling with the area between $1.78 and $1.41. This region could provide support after a close above – or resistance after a close below. 

A retracement could reach into the daily gap and possible support around $1.53. A more bearish shift in the marketplace will likely aim for the relatively equal lows near $1.50, and the potential support just below that begins around $1.45.

Continuation to the upside will likely target the monthly high near $2.01. However, probable resistance beginning at $1.82 and $1.93 could cap or slow down this move.

2. Cosmos (ATOM)

Cosmos ATOM bills itself as a project that solves some of the “hardest problems” facing the blockchain industry. It aims to offer an antidote to “slow, expensive, unscalable and environmentally harmful” proof-of-work protocols, like those used by Bitcoin, by offering an ecosystem of connected blockchains. ATOM tokens are earned through a hybrid proof-of-stake algorithm, and they help to keep the Cosmos Hub, the project’s flagship blockchain, secure. This cryptocurrency also has a role in the network’s governance.

ATOM Price Analysis

At the time of writing, ATOM is ranked the 30th cryptocurrency globally and the current price is US$29.46. Let’s take a look at the chart below for price analysis:

Source: TradingView

Q3 provided respectable 198% gains for bulls who bought ATOM at the monthly open, with the price finding resistance near $30.12.

If bulls take back control this week, the top of the former gap beginning at $26.44 may provide support for at least a short-term bounce. The top of the consolidation range starting near $22.58 is more likely to provide substantial support.

The most robust support is likely to be found in the overlapping consolidation ranges between $20.74 and $19.06, with a sharp slice through these levels possibly suggesting the end of the bull run.

The region from approximately $35.70 to the most recent swing high is likely to provide some resistance. The swing high provides a reasonable first target for a possible next leg up. 

If this high breaks, the 1.0 extension near $39.21 and the 2.0 extension near $45.90 may provide the next primary targets.

3. Axie Infinity (AXS)

Axie Infinity AXS is a blockchain-based trading and battling game that is partially owned and operated by its players. The Axie Infinity ecosystem has its own unique governance token, known as Axie Infinity Shards AXS. These are used to participate in key governance votes and will give holders a say in how funds in the Axie Community Treasury are spent.

AXS Price Analysis

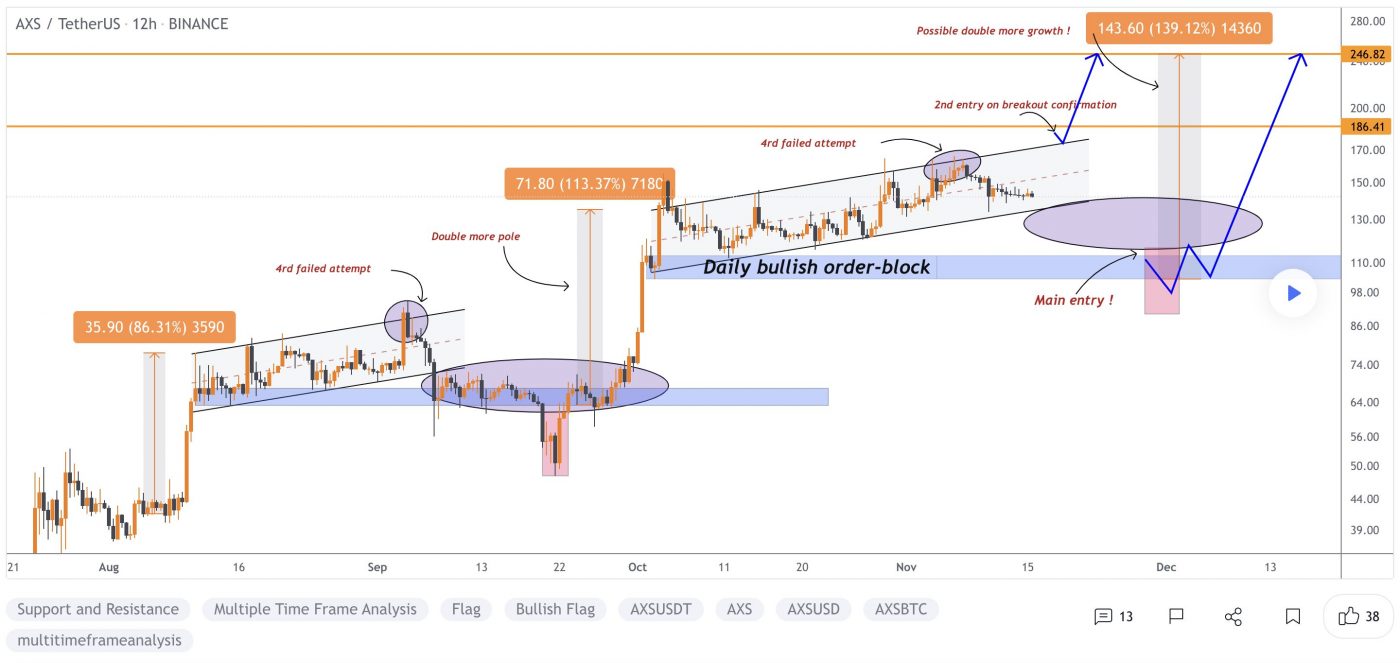
At the time of writing, AXS is ranked the 25th cryptocurrency globally and the current price is US$131.87. Let’s take a look at the chart below for price analysis:

Source: TradingView

AXS‘s relatively small 45% range could suggest that a much larger move is setting up in November.

Aggressive bulls could look for entries at the most recent area of support formed near $120. However, equal lows near $114 make a tempting target for a stop run into this support. This move could reach support near $105. 

A decisive move to the downside could run stops below the second set of relatively equal lows near $97.23, possibly reaching support at an old swing high and a daily gap near $90.58.

A recent level near $142 provided resistance and caused a recent swing high to form near $158, offering first targets. A move through this high may arrive at new high levels near $176 and $180.

Learn How to Trade Live!

Join Dave and The Crypto Den Crew and they’ll show you live on a webinar how to take your crypto trading to the next level.

Duration: 6-week course
From: November 15 to December 22
Date/Time: Twice a week, Mon and Wed at 7pm AEST
Location: Zoom webinar

Where to Buy or Trade Altcoins?

These coins have high liquidity on Binance Exchange, so that could help with trading on AUD/USDT/BTC pairs. And if you’re looking at buying and HODLing cryptos, then Swyftx Exchange is an easy-to-use popular choice in Australia.
Categories
Crypto News Market Analysis Trading VeChain

Top 3 Coins to Watch Today: XEC, LTO, VET – November 16 Trading Analysis

Let’s take a closer look at today’s altcoins showing breakout signals. We’ll explain what the coin is, then dive into the trading charts and provide some analysis to help you decide.

1. eCash (XEC)

eCash XEC follows through on key blockchain scaling promises. An innovative Avalanche consensus layer and its own token layer are unique technical highlights of eCash, which also aims to introduce features never before seen in a Bitcoin project such as staking, fork-free network upgrades, and subchains. Built by an experienced team of bitcoin developers who founded Bitcoin Cash, eCash is a fork of bitcoin with a more aggressive technical roadmap.

XEC Price Analysis

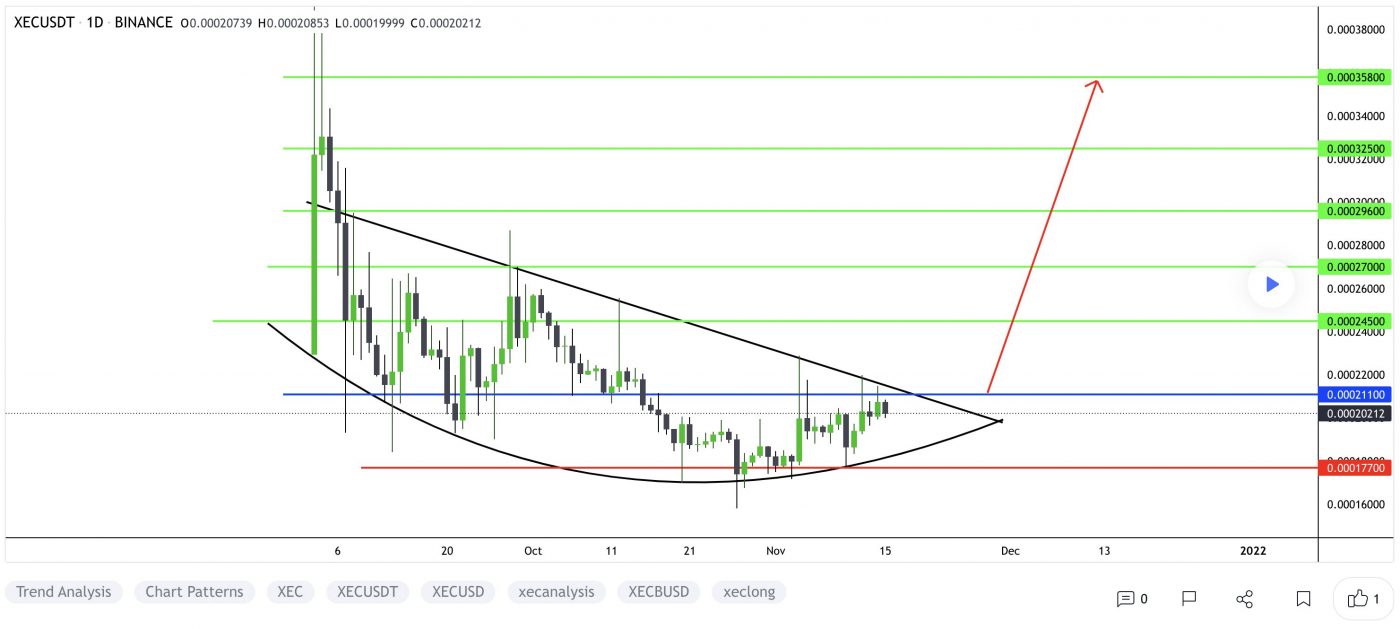
At the time of writing, XEC is ranked the 51st cryptocurrency globally and the current price is US$0.0001984. Let’s take a look at the chart below for price analysis:

Source: TradingView

Early September’s sharp 1,683% rally retraced nearly 60% by the end of October before shifting XEC‘s market structure to the upside during early November.

The 9, 18 and 40 EMAs are compressing and could flip to a bullish stacking within the next few days. If they do, a level near $0.0001752 has provided support and could give support again on a retest. 

If the price instead breaks down, possibly caused by traders selling Monday’s news or a drop in bitcoin’s price, bulls might find support near $0.0001369. This level has confluence with the 78.6% retracement of the fastest portion of September’s move. 

However, a steeper drop could reach as low as $0.0001135, near the 78.6% retracement of the larger-timeframe move.

An area between $0.0002144 and $0.0002284 has been providing resistance. If this level breaks, bulls might encounter their next resistance near the upper portion of the local range between $0.0002456 and $0.0002572. 

The 127% extension of late October and early November’s move, near $0.0003078, might also provide some resistance. If bulls flip this resistance to support, $0.0003586 could offer the last resistance before another round of price discovery.

2. LTO Network (LTO)

LTO Network (LTO) is a hybrid blockchain platform for decentralised workflows and business process automatisation. Thanks to a solution based on live contracts, companies can enter into and carry out transactions, exchange information with each other, organise supply chains, delegate data processing and more, simultaneously and without relying on trust. LTO Network provides the following kinds of assistance: the facilitation and control of the entire transaction process, the exchange of information between parties, the creation of business supply chains, and the secure transfer of data to third parties.

LTO Price Analysis

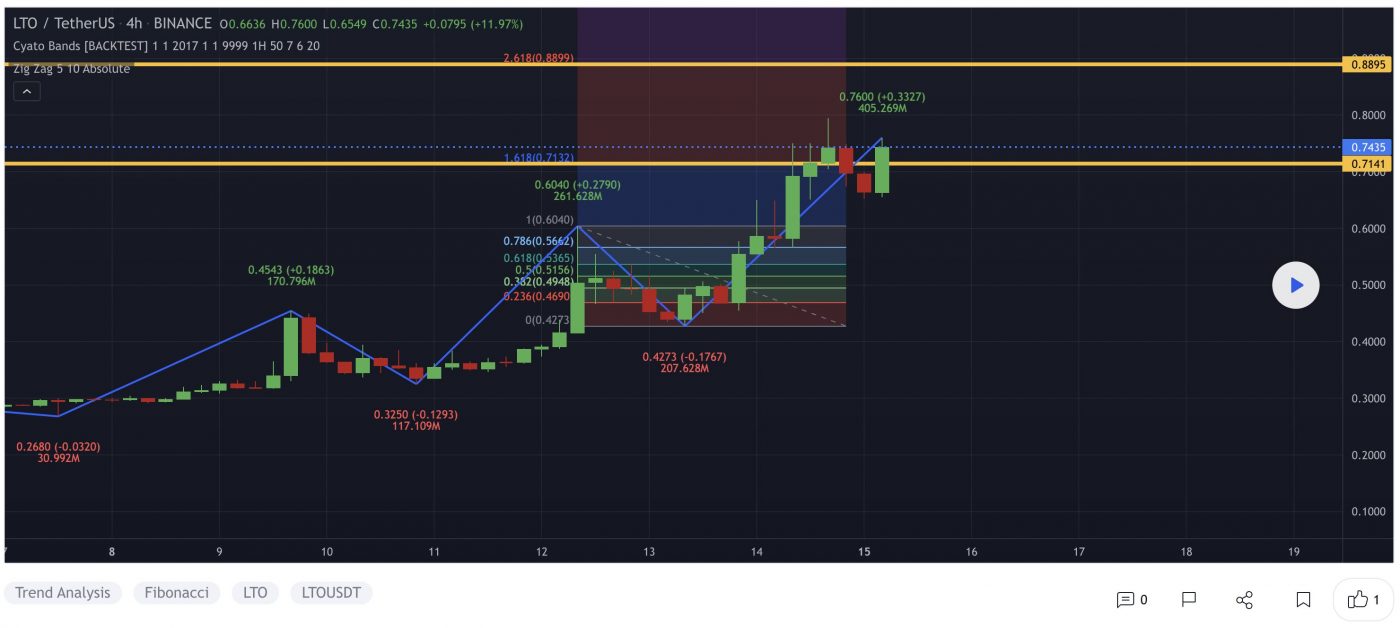
At the time of writing, LTO is ranked the 356th cryptocurrency globally and the current price is US$0.6428. Let’s take a look at the chart below for price analysis:

Source: TradingView

LTO‘s explosive upward move during the past week ran nearly 200% into resistance, beginning near $0.7807. On higher timeframes, little rests above this level to stop bulls before another round of price discovery.

Wednesday’s roadmap reveal could give information that propels the price above the 2021 highs. On the other hand, the exact roadmap details could instead show that the recent surge was overpriced by speculators, leading to a retest of possible support.

An area near an old swing high and the April 2021 breakdown could give support between $0.6509 and $0.6040. However, bulls might be more willing to step in near the 50% retracement and 8 EMA between $0.5540 and $0.4883. 

A deeper retracement, perhaps from an underwhelming roadmap reveal or a sharp downturn in bitcoin’s price, could reach as low as the old consolidation’s highs, 40 EMA, and 78.6% retracement between $0.3979 and $0.3546.

3. VeChain (VET)

VeChain VET is a blockchain-powered supply chain platform. VeChain aims to use distributed governance and Internet of Things (IoT) technology to create an ecosystem that solves some of the major problems with supply chain management. The platform uses two in-house tokens, VET and VTHO, to manage and create value based on its VeChainThor public blockchain. The idea is to boost the efficiency, traceability and transparency of supply chains while reducing costs and placing more control in the hands of individual users.

VET Price Analysis

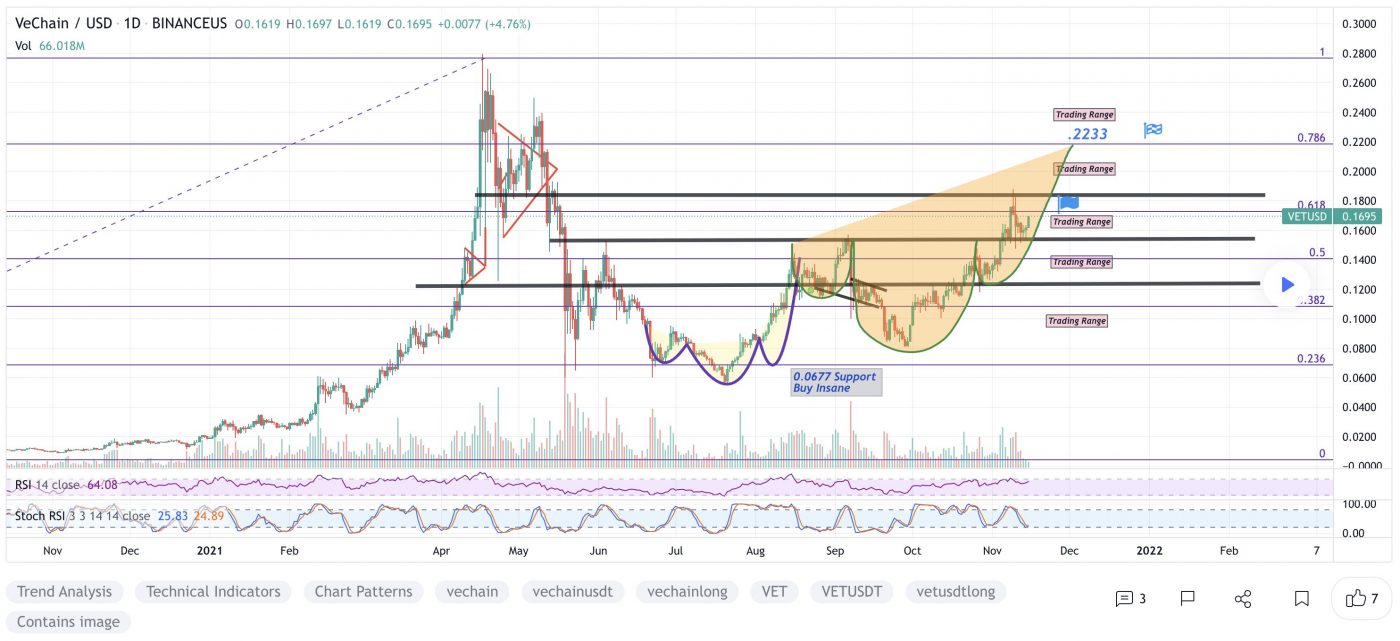
At the time of writing, VET is ranked the 23th cryptocurrency globally and the current price is US$0.1676. Let’s take a look at the chart below for price analysis:

Source: TradingView

VET‘s 129% move from late September’s lows ran into resistance near $0.17785, at the 27% extension of the summer’s swing.

An old high and the 18 EMA have provided support near $0.1539 and might give support again on a retest. This area also has confluence with the 50% and 61.8% retracement of November’s swing.

Just below, near $0.1259, the 61.8% retracement of the current Q4 swing might also mark an area of support. Traders selling the news of Tuesday’s mainnet upgrade could trigger a retracement that reaches this level. 

If the market remains bullish, $0.08962 is unlikely to be revisited but could see interest from bulls during any deeper retracement.

An area near $0.2011, at the 50% extension of the summer’s swing, could see some profit-taking if bulls break the current resistance near $0.1778. Above, old consolidations near $0.2232 and $0.2401 might also provide some resistance before another round of price discovery.

Learn How to Trade Live!

Join Dave and The Crypto Den Crew and they’ll show you live on a webinar how to take your crypto trading to the next level.

Duration: 6-week course
From: November 15 to December 22
Date/Time: Twice a week, Mon and Wed at 7pm AEST
Location: Zoom webinar

Where to Buy or Trade Altcoins?

These coins have high liquidity on Binance Exchange, so that could help with trading on AUD/USDT/BTC pairs. And if you’re looking at buying and HODLing cryptos, then Swyftx Exchange is an easy-to-use popular choice in Australia.
Categories
Events Market Analysis The Crypto Den

TradeRoom: Our Weekly Crypto Trades Analysis – Nov 15, 2021

Welcome to this weekly series from the TradeRoom. My name is Dave and I’m the founder of The Crypto Den, an Australian-based crypto trading and education community aiming to give you the knowledge to take your trading game to the next level.

Learn from the experts! Live Trading Course by The Crypto Den starts tonight at 7pm AEST! Register for the Live Trading Sessions

Crypto Market Outlook

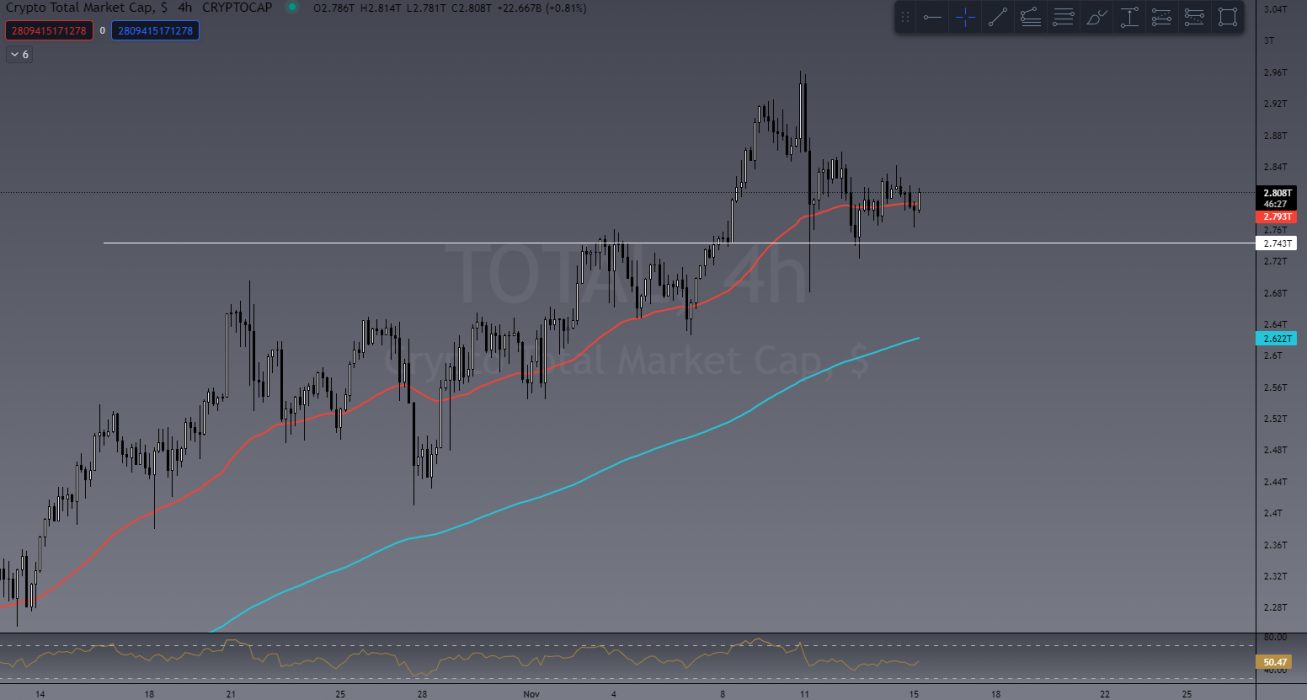
We’ve seen a bit of a pullback in price action in the market over the past four days, which isn’t a bad thing. Last week the total crypto market cap reached US$3 trillion for the first time in history and has since pulled back to the US$2.7 trillion mark, which could be seen as a new level of “Support”. It’s currently sitting at US$2.8 trillion.

Total market cap sitting at US$2.8 trillion

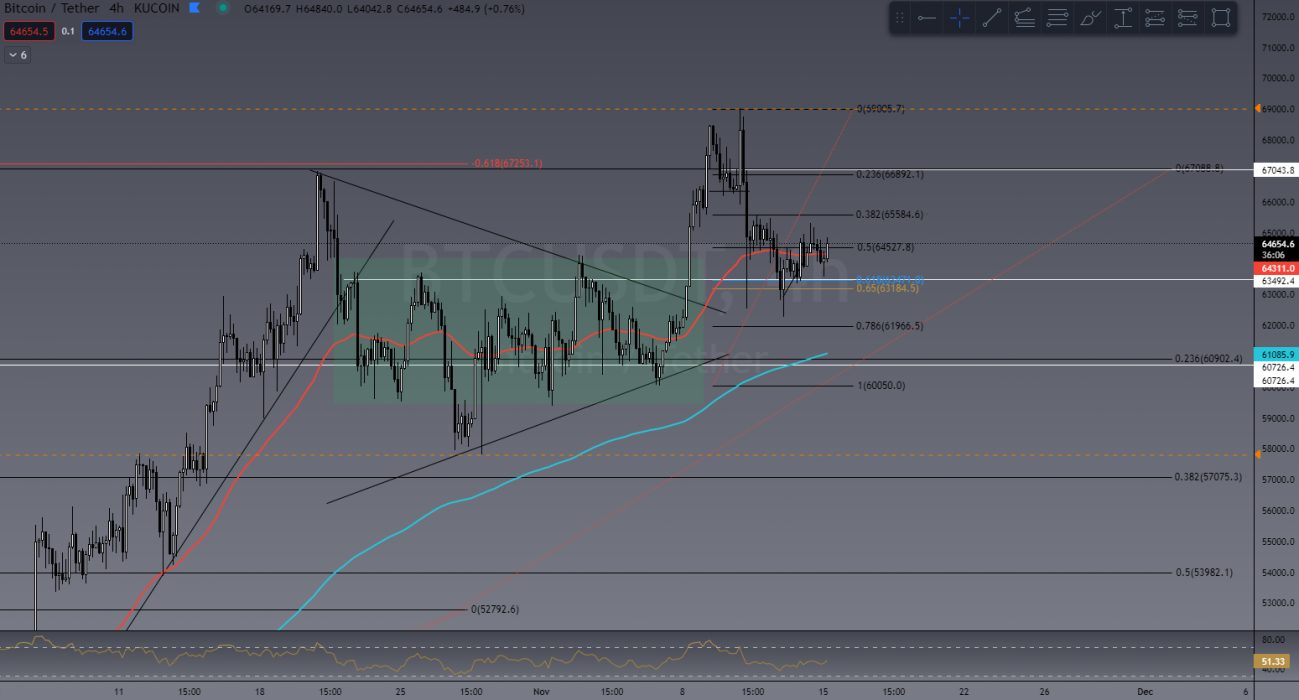
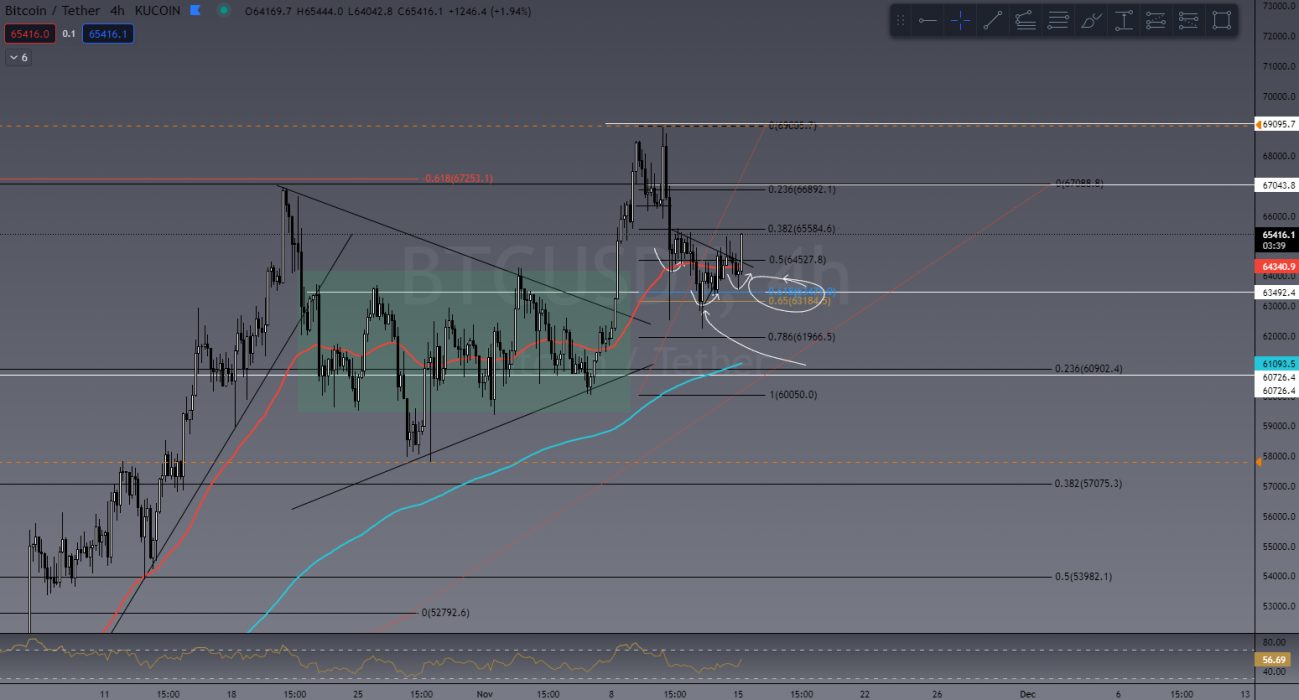
In last week’s article I mentioned BTC forming a symmetrical triangle which, as a general rule, has a 70% chance of breaking out to the upside. As you’ll see below, BTC did have a bullish break into a new all-time high (ATH) and has since reversed with some bearish price action to what we call a retest zone. What goes up, must come down … and that’s the same for financial markets. Nothing continues to go up without having some downs along the way.

BTC is retesting a new level of support after retracing in the 61.8% golden pocket. This is actually a bullish signal and could simply indicate a new market structure to launch from! We still expect BTC to reach US$78,000 soon.

BTC breaking out and now retesting support

Last Week’s Performance

MANA/USDT

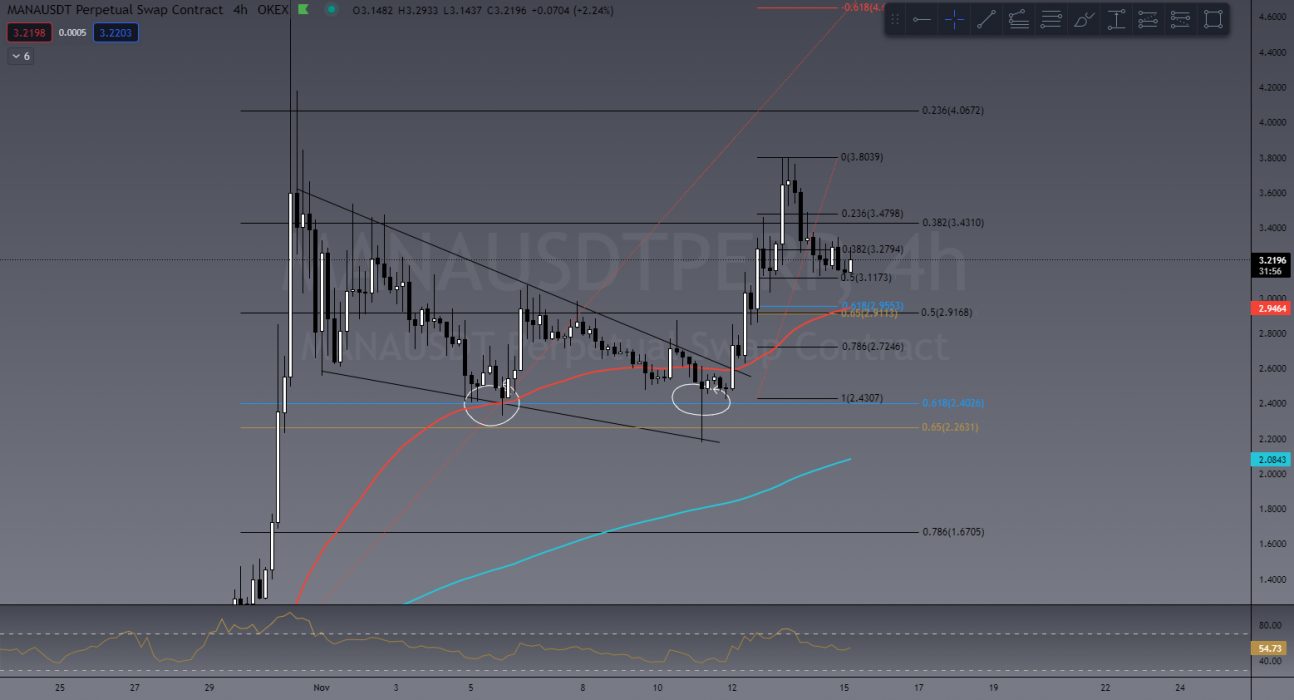
Last week I mentioned the coin to watch was MANA (Decentraland) as the bullish momentum was just too good to ignore. It’s seen price action increase 57% and currently retracing. It seems to be bouncing from the 50% fib level at the time of writing and could see the 61.8% fib before a continuation up again. In the TradeRoom there’s been a lot of chatter around these Metaverse coins/tokens, and the sentiment is very bullish!

MANA breaking out and retracing

CHR/USDT

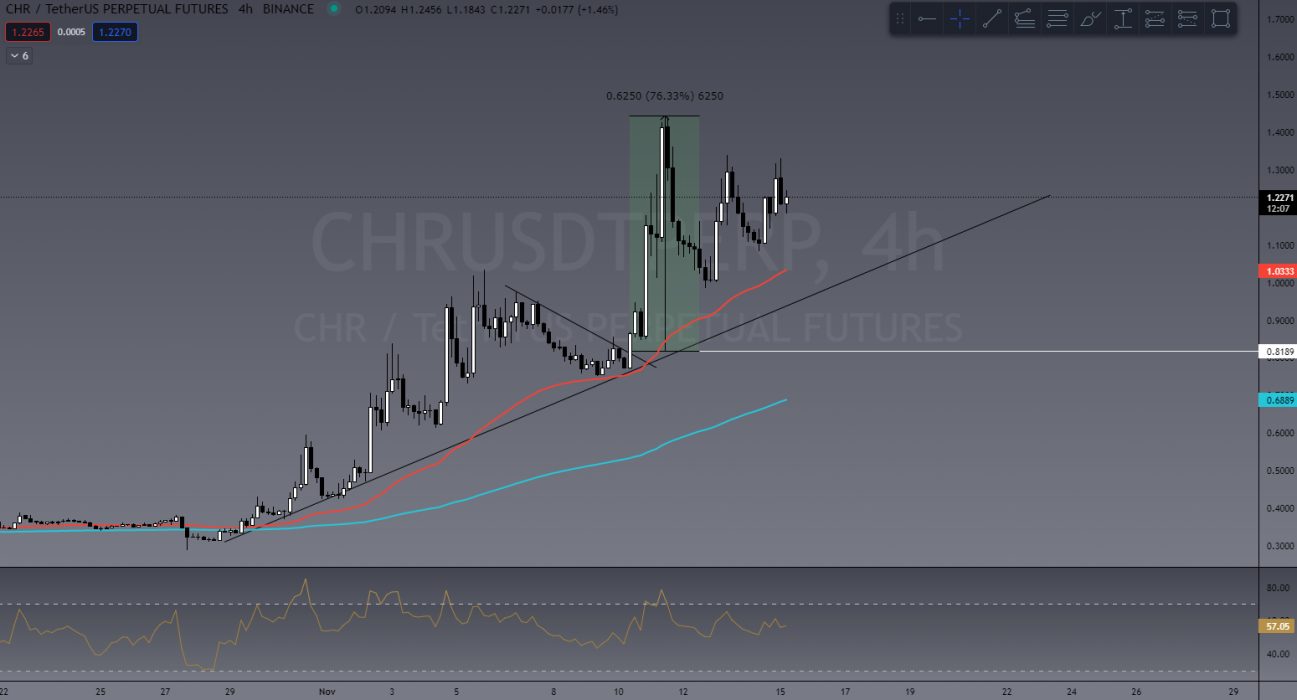
An amazing trade taken last week by one of our TradeRoom legends – “TypeGuy” – was on CHR (another Metaverse token). I’ve recreated his chart below. You can see see price action retraced to the trend line, then painted a bullish engulfing candle leading to a breakout. TypeGuy trades this on 10x leverage yielding him over 300% ROI. CHR did 76% on spot in only two days! That’s what I call a killer trade! TypeGuy has become an extremely consistent trader in TradeRoom after completing our trading course and shares a massive amount of his charts every week!

Massive 76% on CHR in only 2 days!

This Week’s Trades

BTC/USD

As mentioned above, BTC has seen a healthy pullback in price action and retraced back to that golden pocket. Forming a higher low (HL) on the 4H chart and breaking out the new market structure is VERY bullish so far. A big bullish engulfing candle was forming at the time of writing this and if this momentum can continue, we will surely see a break well above US$70,000 this week!

BTC breakout and retest

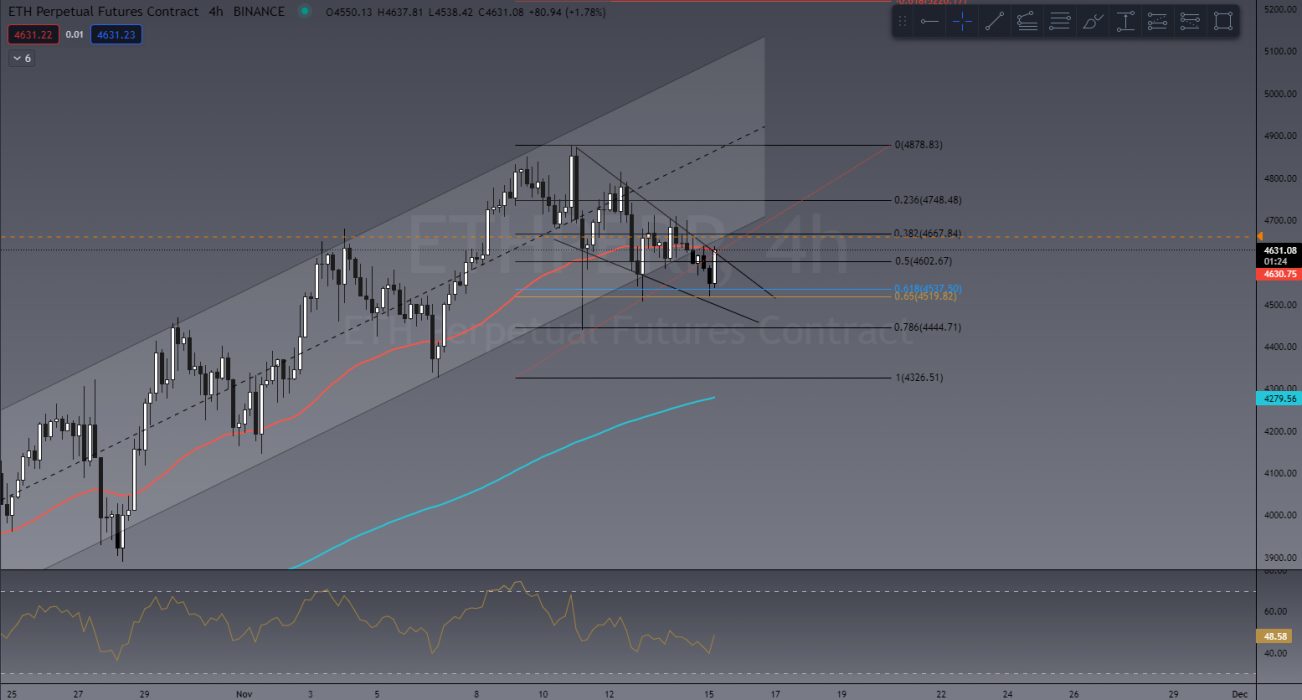
ETH/USD

If BTC follows the bullish path, ETH won’t be far behind. Currently in a falling wedge (bullish continuation pattern) and having had a “triple bottom” in that golden pocket, ETH looks really bullish! We would expect to see US$5,000 ETH this week if this plays out well!

LTC/USD

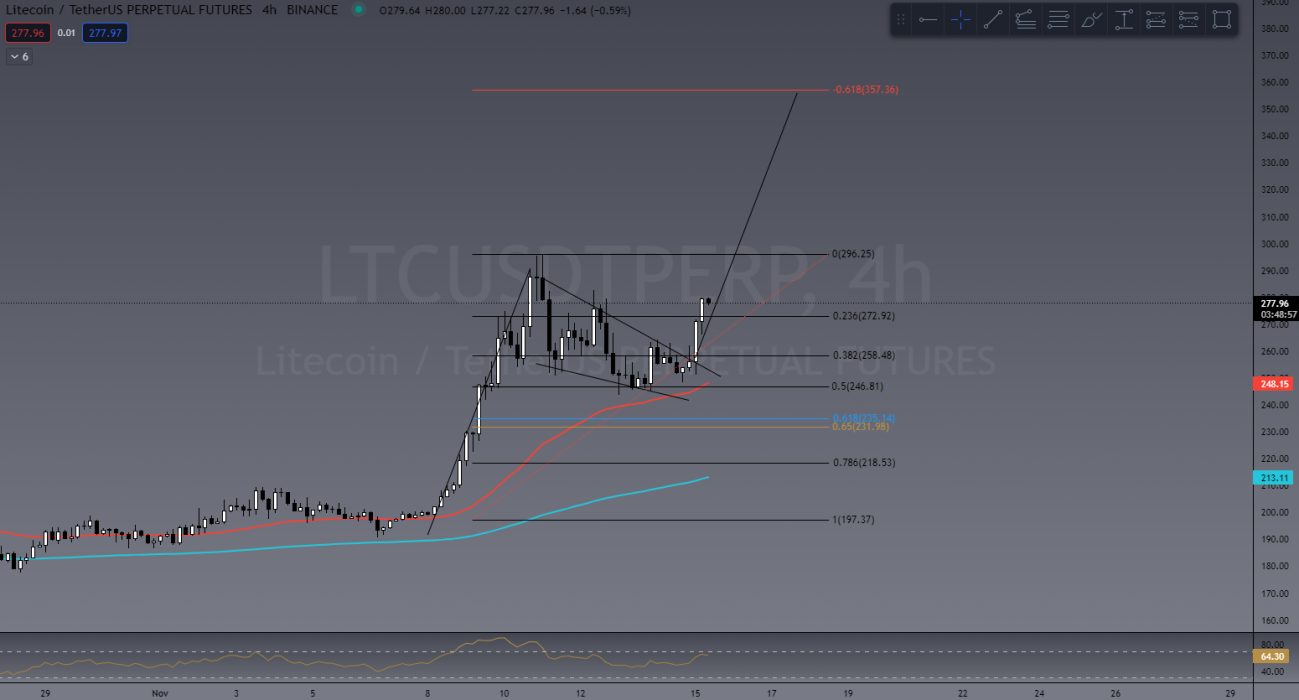
Another big top 10 to watch is LTC. Litecoin is usually either late to the party or early, but it’s rarely on time! What I mean by this is that sometimes it leads the way in price action, beating other top 10 coins to the punch, or it gets totally left behind to do its own thing and show up late again.

This time LTC has shown up early. Pushing out of the falling wedge we expect to see a slight and short-lived pullback before continuing up. I’m getting a Fibonacci target of US$350.

LTC breakout and target based on “flag pole” and Fibonacci

It’s important to remember that when trading ALT coins, their price action is heavily dependent on BTC. If BTC takes a bullish path, ALTs will likely follow. If BTC turns bearish, then ALTs will likely dump in price even harder!

If you’d like to become a better trader, you’re invited to join our TradeRoom where we share daily charts and market analysis. In our community we strongly encourage and teach correct risk management strategies to keep our members safe in this new volatile crypto market.

Live Trading Lessons – 6-Week Course

If you’d like to improve your trading, we teach you how to understand and implement all of the trading strategies we use in our 6-week Trading Fundamentals Course.

>> Register for the Live Trading Sessions – starts TONIGHT 7pm AEST!

Other ways to learn:

>> Take our Free Beginners’ Trading Course

>> Join our Trading Community for your 7-day free trial


The Crypto Den was created in 2017 to help the rapidly growing crypto community learn and understand the fundamentals of digital currencies and how to trade them. 

Since then we have taught thousands of members the basics of technical analysis and trading strategies to further progress and perfect their trading abilities.

In the TradeRoom you will be included in a supportive environment which encourages personal growth, education and community support.

It’s a place to share your trading ideas and follow other experienced traders’ feeds to help keep your finger on the pulse of such a volatile market!

Categories
Binance Bitcoin Crypto News Investing Market Analysis Markets

Crypto Market Dips After Surge, $750 Million Liquidated

After a particularly profitable week in crypto, with bitcoin reaching new all-time highs, the market saw a sudden drop and more than US$750 million was liquidated, according to data from Coinglass.

BTC Takes a Nosedive

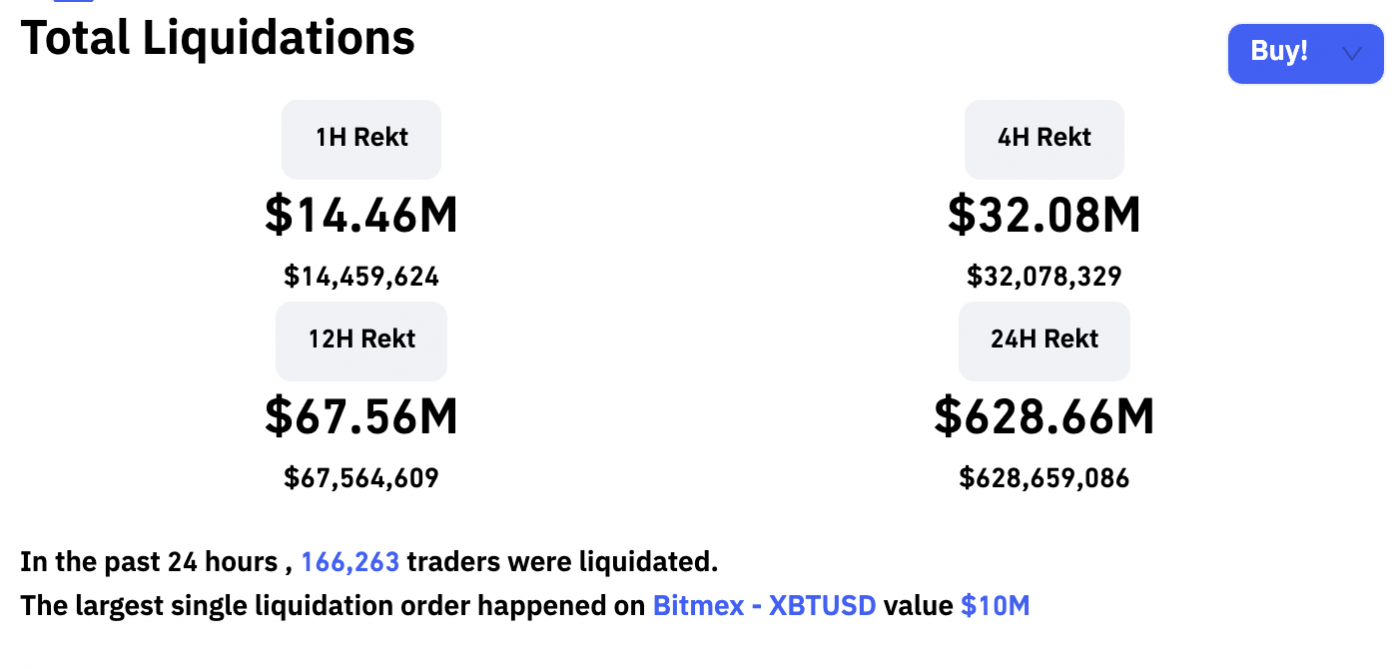
In the past 24 hours, after the crypto market saw some immense growth and bitcoin (BTC) reached a new all-time high of over US$69,000, a whopping 166,292 traders were liquidated to the value of over US$750 million when the price of BTC dipped below US$63,000.

The largest single liquidation order happened on Bitmex XBTUSD to the value of US$10 million. At the time of writing, the price of bitcoin had rallied to US$65,138, according to CoinGecko.

Total liquidations observed. Source: Coinglass

According to data from Coinglass (formerly Bybt), 81 percent of the liquidations observed came from long positions, with the majority of them happening on Binance.

Quantitative analyst PlanB, which has gained significant popularity for its eerie accuracy in predicting monthly closing prices for BTC, took to Twitter to post a funny meme about the liquidated positions:

Again, This Is Just a ‘Bit’ Too Soon

Liquidations such as the one we have just observed are becoming a far-too-common phenomenon. In September, for example, the crypto market saw some serious positions liquidated. Early in the month, the market recorded liquidations worth over US$3.7 billion due to a major downturn. Later, another major drop in the market saw over US$2.5 billion long positions liquidated in just two days.

Categories
Binance Coin Crypto News Loopring Market Analysis Trading

Top 3 Coins to Watch Today: BNB, ALPHA, LRC – November 12 Trading Analysis

Let’s take a closer look at today’s altcoins showing breakout signals. We’ll explain what the coin is, then dive into the trading charts and provide some analysis to help you decide.

1. Binance Coin (BNB)

Binance BNB is the biggest cryptocurrency exchange globally, based on daily trading volume. Binance aims to bring cryptocurrency exchanges to the forefront of world financial activity. Aside from being the largest cryptocurrency exchange, Binance has launched a whole ecosystem of functionalities for its users. The Binance network includes the Binance Chain, Binance Smart Chain, Binance Academy, Trust Wallet, and Research projects, which all employ the powers of blockchain technology to bring new-age finance to the world. Binance Coin is an integral part of the successful functioning of many of the Binance sub-projects.

BNB Price Analysis

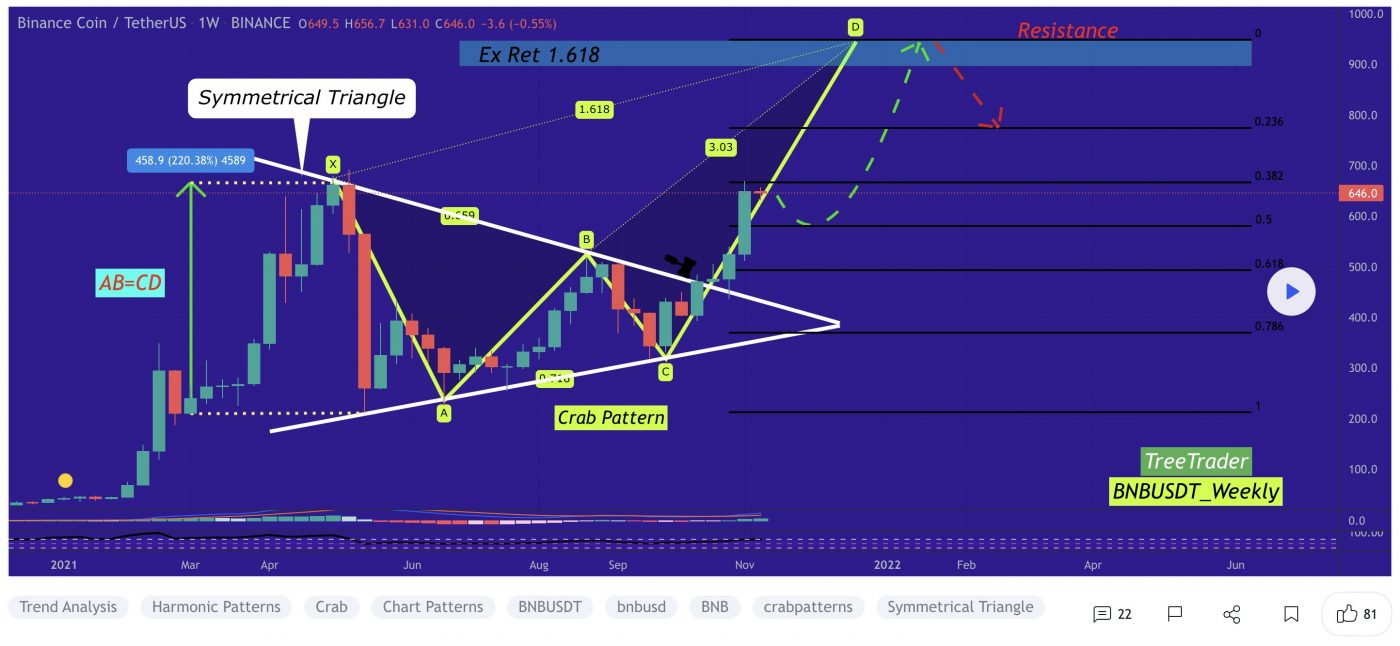
At the time of writing, BNB is ranked the 3rd cryptocurrency globally and the current price is US$627.61. Let’s take a look at the chart below for price analysis:

Source: TradingView

After a 60% decline from August to September, BNB has ranged between $651 and $512.

The recent rally is approaching probable resistance near $671 but could be aiming for stops above the relatively equal highs near $667. Continuation of the bullish move could target the daily gap near $677.

Aggressive bulls might add to positions near $615 and $608. Price action near A$590 may be more likely to provide support – if it gets there – during any retracements.

Relatively equal lows clustered around $586 seem likely to be swept if the bearish trend resumes. If this move occurs, the price might find support at the significant higher-timeframe level near $578.

2. Alpha Finance (ALPHA)

Alpha Finance Lab ALPHA is a cross-chain DeFi platform that looks to bring Alpha to users across a variety of different blockchains, including Binance Smart Chain (BSC) and Ethereum. The platform aims to produce an ecosystem of DeFi products that address unmet needs in the industry while remaining simple to use and access. ALPHA is the native utility token of the platform. Token holders can earn a share of network fees by staking ALPHA tokens to cover any default loans. Other use cases for the token include liquidity mining and governance voting.

ALPHA Price Analysis

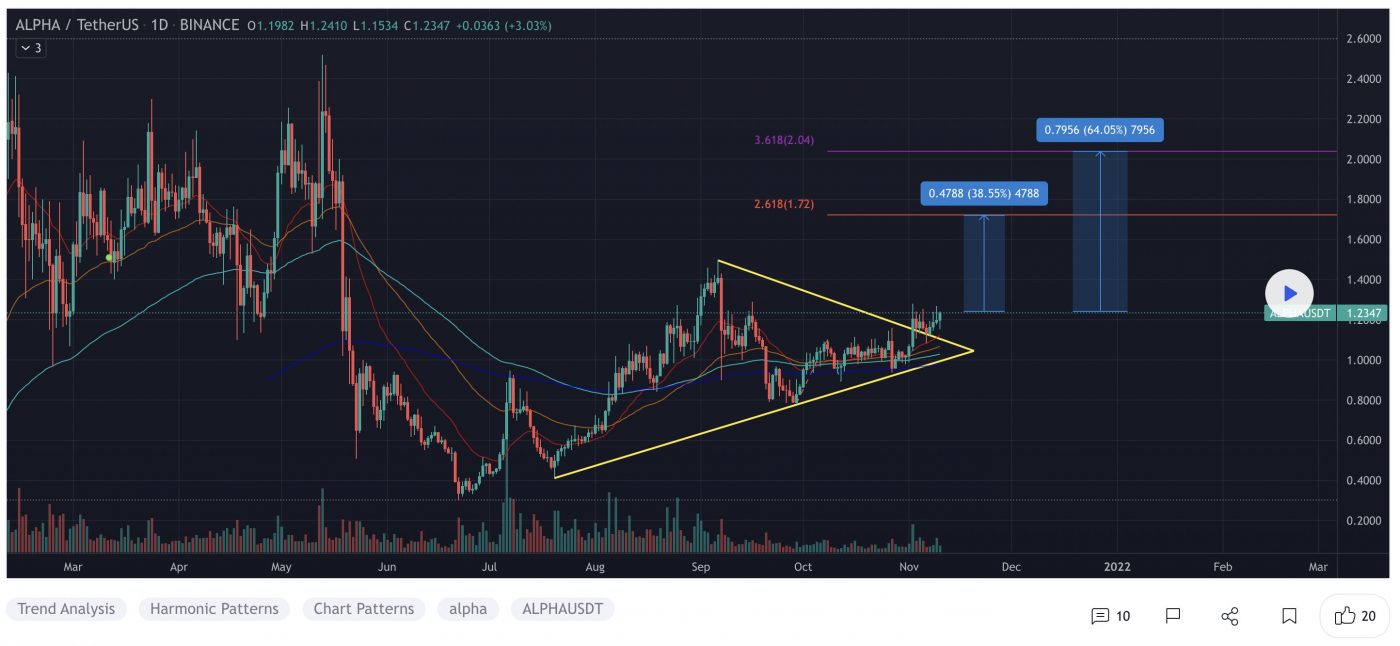
At the time of writing, ALPHA is ranked the 150th cryptocurrency globally and the current price is US$1.15. Let’s take a look at the chart below for price analysis:

Source: TradingView

APLHA‘s massive May spike retraced near $0.5233 into the consolidation that began the impulse before bouncing to $0.7365. 

This consolidation could provide support again, although bears would first have to push the price through possible support near $1.06. The market’s structure may be shifting bearish, with $1.29 likely to provide some resistance if this is the case. A sustained bearish move could reach the swing low near $0.9243 before finding support near $0.8190.

However, the bullish higher-timeframe trend might prevail, with relatively equal highs near $1.34 potentially giving an attractive target to lure the price over the monthly open. If so, the price could reach the midpoint near $1.48.

3. Loopring (LRC)

LRC is the Ethereum-based cryptocurrency token of Loopring, an open protocol designed for the building of decentralised crypto exchanges. Loopring’s purported goal is to combine centralised order matching with decentralised on-blockchain order settlement into a hybridised product that will take the best aspects of both centralised and decentralised exchanges.

LRC Price Analysis

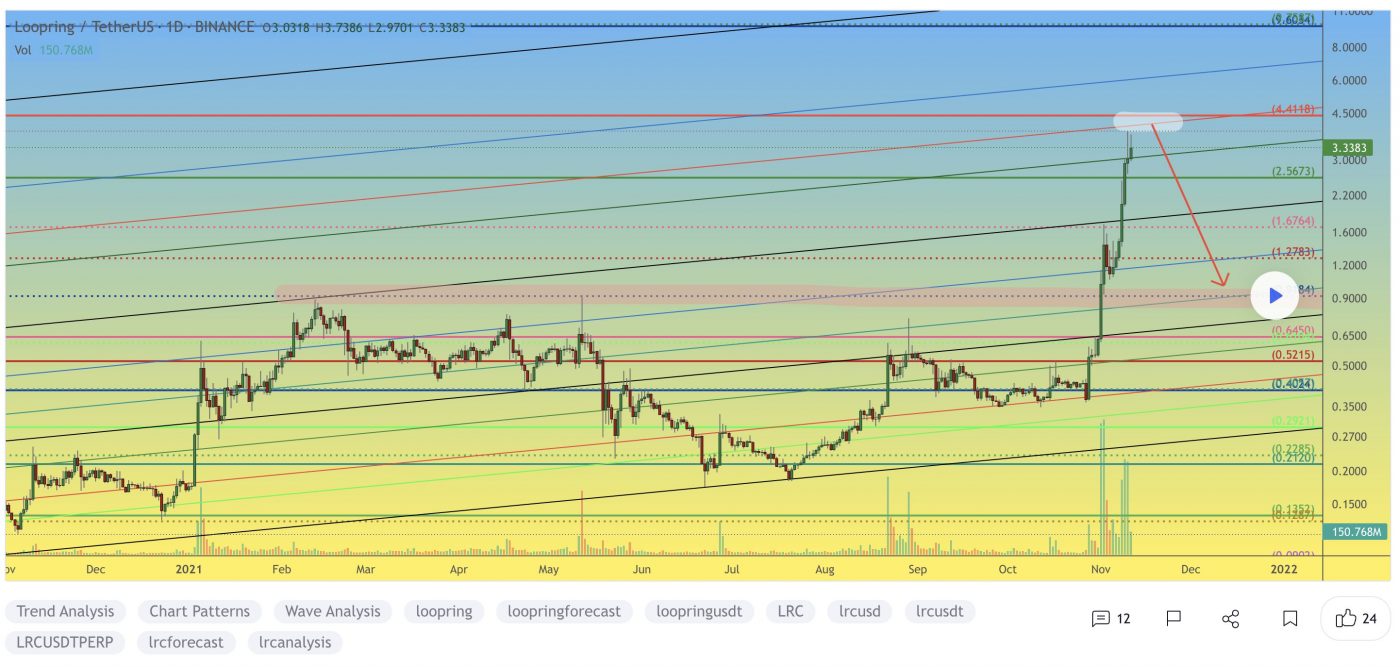
At the time of writing, LRC is ranked the 46th cryptocurrency globally and the current price is US$3.27. Let’s take a look at the chart below for price analysis:

Source: TradingView

LRC lifted off last week, with the impulse sweeping the new swing highs into resistance up to $3.72.

If the price retraces now that it has taken highs, aggressive bulls could look for entries at the recently broken resistance between $3.14 and $3.00. A deeper retracement that fills the gap down to the monthly level at $2.80 provides a better entry, with any quick drops near the monthly open at $2.58 providing the most favourable entries.

Continuation through the current resistance around $3.35 is likely to explode through the remaining daily highs stacked up to $3.56. There’s no telling how far the price could go beyond these new all-time high prices.

Learn How to Trade Live!

Join Dave and The Crypto Den Crew and they’ll show you live on a webinar how to take your crypto trading to the next level.

Duration: 6-week course
From: November 15 to December 22
Date/Time: Twice a week, Mon and Wed at 7pm AEST
Location: Zoom webinar

Where to Buy or Trade Altcoins?

These coins have high liquidity on Binance Exchange, so that could help with trading on AUD/USDT/BTC pairs. And if you’re looking at buying and HODLing cryptos, then Swyftx Exchange is an easy-to-use popular choice in Australia.
Categories
Crypto News Market Analysis NEO Trading

Top 3 Coins to Watch Today: MANA, NEO, CELO – November 11 Trading Analysis

Let’s take a closer look at today’s altcoins showing breakout signals. We’ll explain what the coin is, then dive into the trading charts and provide some analysis to help you decide.

1. Decentraland (MANA)

Decentraland MANA defines itself as a virtual reality platform powered by the Ethereum blockchain that allows users to create, experience, and monetise content and applications. In this virtual world, users purchase plots of land that they can later navigate, build upon and monetise. Decentraland uses two tokens: MANA and LAND. MANA is an ERC-20 token that must be burned to acquire non-fungible ERC-721 LAND tokens. MANA tokens can also be used to pay for a range of avatars, wearables, names and more on the Decentraland marketplace.

MANA Price Analysis

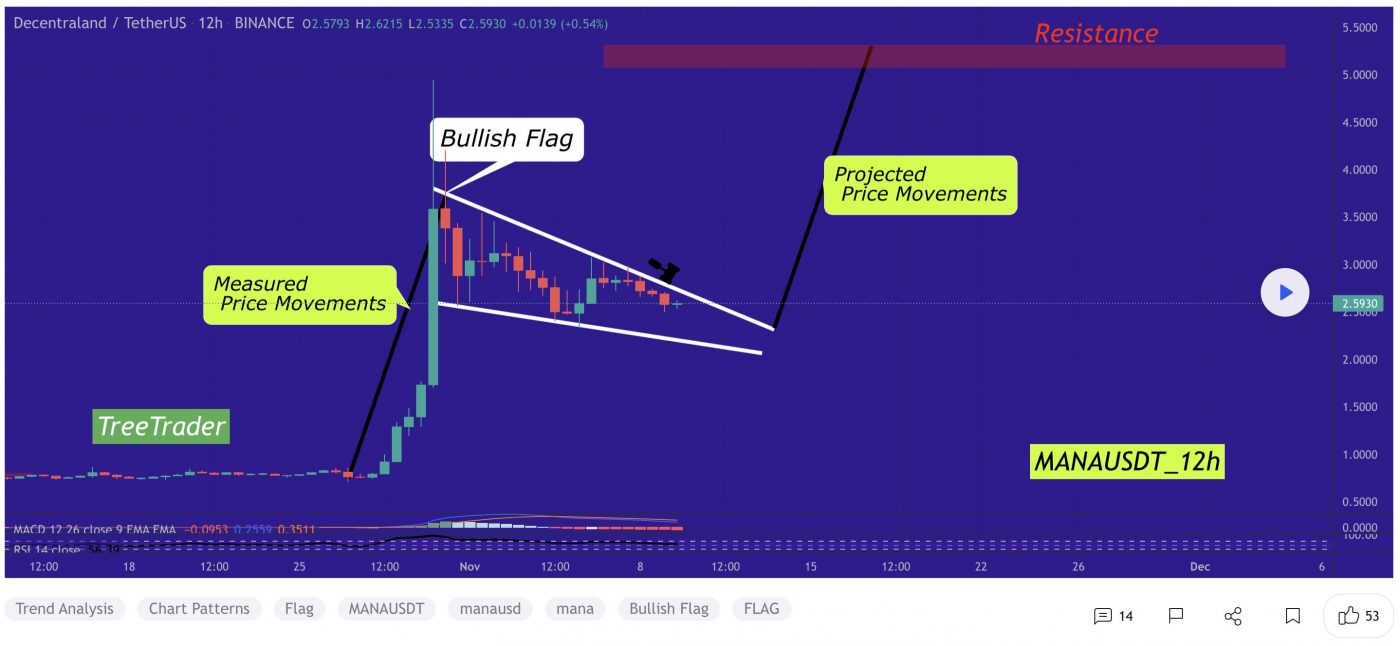
At the time of writing, MANA is ranked the 44th cryptocurrency globally and the current price is US$2.62. Let’s take a look at the chart below for price analysis:

Source: TradingView

Like many other altcoins, MANA set a new all-time high in late October before retracing 45% to the low at $2.50 last week.

Price broke through resistance near $2.46, which may mark an area of possible support on a retracement. If this support fails, bulls might also step in near $2.41. However, a drop this far increases the chances of a stop run to $2.37 and possibly into support near $2.32. For now, continuing bullish market conditions could help $2.20 become support.

The swing high around $2.70 gives bulls a reasonable first target, with $2.79 also likely to draw the price upward. Higher-timeframe resistance beginning near $2.86 or $2.95 could cap the move or trigger consolidations. If bullish market conditions continue, bulls might test probable resistance near $3.24.

2. Neo (NEO)

NEO bills itself as a “rapidly growing and developing” ecosystem that has the goal of becoming the foundation for the next generation of the internet – a new economy where digitised payments, identities and assets come together. As well as creating a worldwide community of developers who create new infrastructure for the network and lower barriers to entry, the team behind this project operates an EcoBoost initiative that’s designed to encourage people to build decentralised apps and smart contracts on its blockchain.

NEO Price Analysis

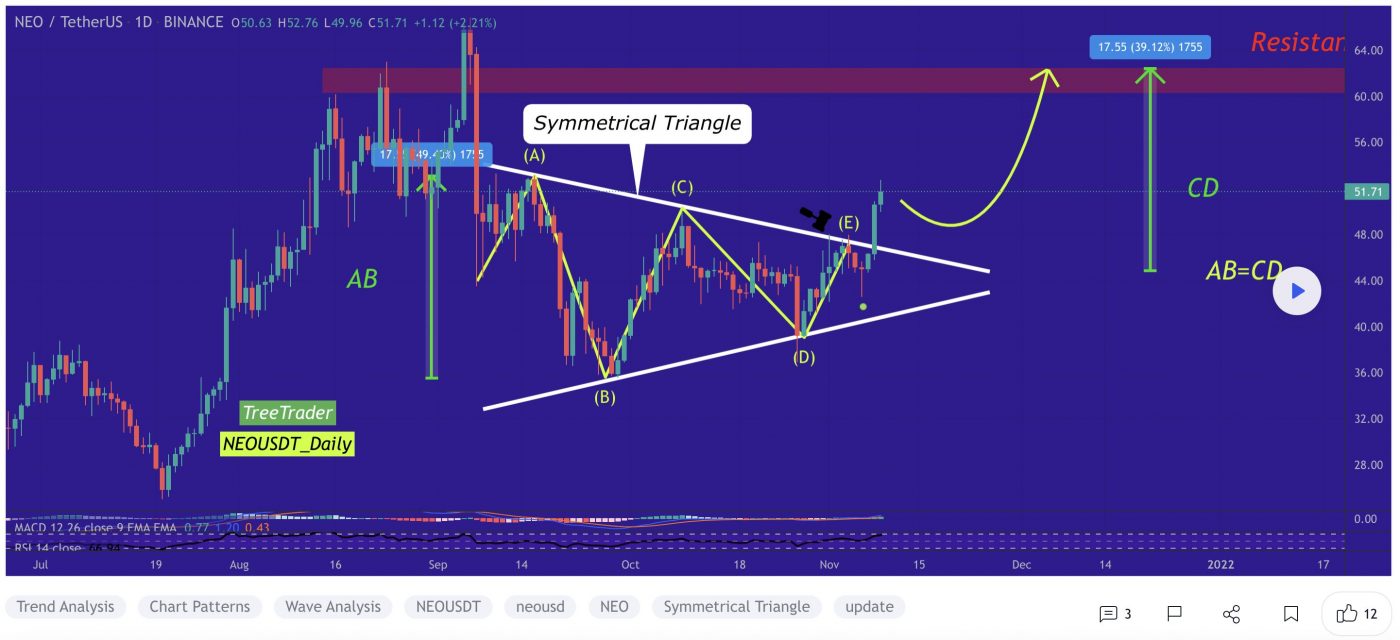
At the time of writing, NEO is ranked the 53rd cryptocurrency globally and the current price is US$52.32. Let’s take a look at the chart below for price analysis:

Source: TradingView

After creating a second equal low in late September, NEO has rallied nearly 55% into resistance that starts near $60.12.

Aggressive bulls looking for a continuation to the nearest cluster of relatively equal highs around $57.33 might look for bids near $50.86. More significant resistance rests above, near $62.15. A group of significant swing highs at $65.36, $68.55 and $70.23 give possible targets if this resistance breaks.

A stop run on the recent low at $48.00 into possible support beginning near $46.13 might see stronger bidding. This area also has a confluence with the August monthly open.

A bearish market shift could reach the swing low at $43.68 into possible support beginning near $40.24.

3. Celo (CELO)

Celo is a blockchain ecosystem focused on increasing cryptocurrency adoption among smartphone users. The network also allows for the creation of smart contracts and decentralised applications (DApps) as part of decentralised finance (DeFi). The platform has two native tokens. CELO is a proof-of-stake (PoS) token used for transaction fees, governance participation and related activities. In the future, the platform aims to host various stablecoins, with one, the Celo Dollar (CUSD), already in use.

CELO Price Analysis

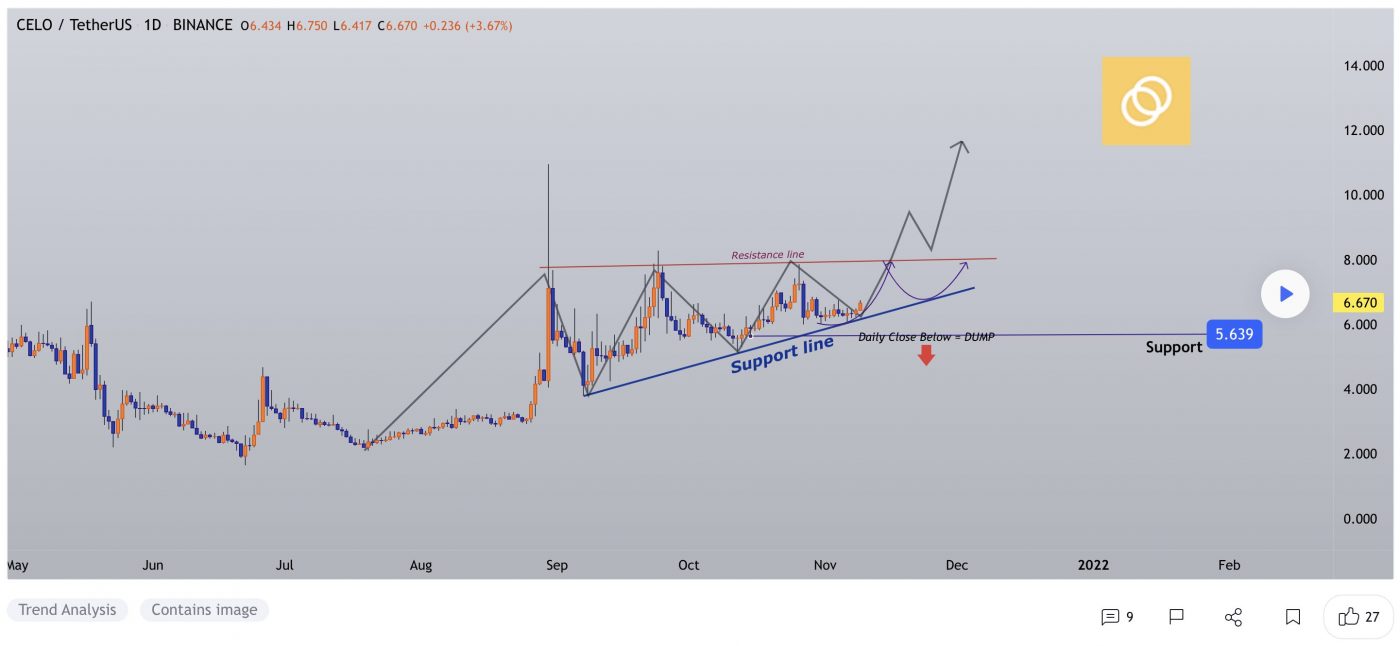
At the time of writing, CELO is ranked the 70th cryptocurrency globally and the current price is US$6.53. Let’s take a look at the chart below for price analysis:

Source: TradingView

CELO continued its rally through the daily gap between $5.87 and $5.94, turning this region into an area of possible support. 

However, a stop run under the relatively equal lows at $6.30 could form a wick below this level, potentially reaching an untapped daily gap beginning near $6.19.

Resistance starting at $6.73 has seen significant profit-taking, shown by the long upper wicks on the daily candles. A break of this resistance may reach the next significant swing high at $6.98, continue into probable resistance just above, and possibly set new monthly highs at $7.26.

Learn How to Trade Live!

Join Dave and The Crypto Den Crew and they’ll show you live on a webinar how to take your crypto trading to the next level.

Duration: 6-week course
From: November 15 to December 22
Date/Time: Twice a week, Mon and Wed at 7pm AEST
Location: Zoom webinar

Where to Buy or Trade Altcoins?

These coins have high liquidity on Binance Exchange, so that could help with trading on AUD/USDT/BTC pairs. And if you’re looking at buying and HODLing cryptos, then Swyftx Exchange is an easy-to-use popular choice in Australia.
Categories
Crypto News EOS Market Analysis Trading

Top 3 Coins to Watch Today: EOS, UNI, FIL – November 10 Trading Analysis

Let’s take a closer look at today’s altcoins showing breakout signals. We’ll explain what the coin is, then dive into the trading charts and provide some analysis to help you decide.

1. Eos (EOS)

EOS is a platform designed to allow developers to build decentralised apps. The project’s goal is relatively simple: to make it as straightforward as possible for programmers to embrace blockchain technology and ensure the network is easier to use than rivals. As a result, tools and a range of educational resources are provided to support developers who want to build functional apps quickly. EOS also aims to improve the experience for users and businesses. While the project tries to deliver greater security and less friction for consumers, it also vies to unlock flexibility and compliance for enterprises.

EOS Price Analysis

At the time of writing, EOS is ranked the 40th cryptocurrency globally and the current price is US$5.29. Let’s take a look at the chart below for price analysis:

Source: TradingView

After an 81% decline from May to July, EOS has ranged between US$4.23 and $6.45.

The recent rally is approaching probable resistance near $5.49 – but could be aiming for stops above the relatively equal highs near $5.37. Continuation of the bullish move could target the daily gap near $5.84.

Aggressive bulls might add to positions near $5.19 and $5.10. Price action near $5.00 may be more likely to provide support – if the price reaches it – during any retracements.

Relatively equal lows clustered around $4.90 seem likely to be swept if the bearish trend resumes. If this move occurs, the price might find support at the significant higher-timeframe level near $4.82.

2. Uniswap (UNI)

Uniswap UNI is a popular decentralised trading protocol known for its role in facilitating the automated trading of decentralised finance (DeFi) tokens. Uniswap aims to keep token trading automated and completely open to anyone who holds tokens while improving the efficiency of trading versus that on traditional exchanges. Uniswap creates more efficiency by solving liquidity issues with automated solutions, avoiding the problems which plagued the first decentralised exchanges.

UNI Price Analysis

At the time of writing, UNI is ranked the 15th cryptocurrency globally and the current price is US$27.49. Let’s take a look at the chart below for price analysis:

Source: TradingView

UNI‘s 65% retracement from its August highs set a low near $20.41 during its consolidation that began in mid-September.

Relatively equal highs near $30.56 could be the current target if the price breaks through resistance beginning near $31.87. Bullish continuation might reach through the next significant swing high near $33.76 into the daily gap near $35.59.

If bullish strength continues, the zones just below the monthly open near $36.88 and $37.45 could halt any retracement. 

A bearish shift in the market might seek the relatively equal lows near $25.33 into possible support near $24.51. If this down move occurs, the swing low near $23.90 and possible support near $22.34 may be the primary objective.

3. Filecoin (FIL)

Filecoin FIL is a decentralised storage system that aims to “store humanity’s most important information”. The project was first described back in 2014 as an incentive layer for the Interplanetary File System (IPFS), a peer-to-peer storage network. Filecoin is an open protocol backed by a blockchain that records commitments made by the network’s participants, with transactions using FIL, the blockchain’s native currency. The blockchain is based on both proof-of-replication and proof-of-spacetime.

FIL Price Analysis

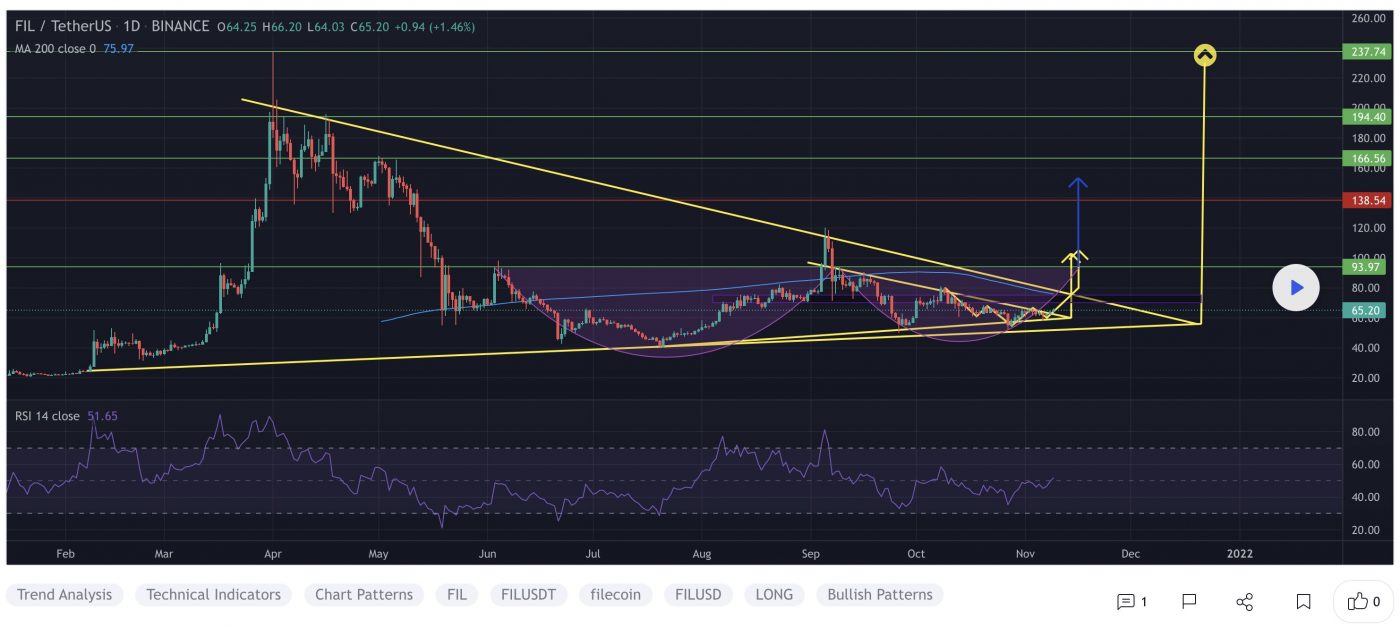
At the time of writing, FIL is ranked the 28th cryptocurrency globally and the current price is US$67.30. Let’s take a look at the chart below for price analysis:

Source: TradingView

After retracing nearly 70% from its September high, FIL set a low near $55.34 as it formed its current range.

Last week, the price swept highs near $67.34. Relatively equal daily highs near $70.55 provide a reasonable target, although resistance beginning near $73.68 could cap the move. A break of this resistance is likely to target the swing high near $78.12 into higher-timeframe resistance beginning near $85.07.

The current area near $62.33 could provide support, although bulls may be more likely to buy near the price fractal near $60.15 if a retracement reaches this level. A break of this area could continue down to sweep the October low near $56.93 into possible support beginning near $52.36.

Learn how to Trade Live!

Join Dave and The Crypto Den Crew and they’ll show you live on a webinar how to take your crypto trading to the next level.

Duration: 6 week course
From: November 15 to December 22
Date/Time: Twice a week, Mon and Wed at 7pm AEST
Location: Zoom webinar

Where to Buy or Trade Altcoins?

These coins have high liquidity on Binance Exchange, so that could help with trading on AUD/USDT/BTC pairs. And if you’re looking at buying and HODLing cryptos, then Swyftx Exchange is an easy-to-use popular choice in Australia.
Categories
Crypto News Market Analysis Trading

Top 3 Coins to Watch Today: BOSON, CRO, DOT – November 9 Trading Analysis

Let’s take a closer look at today’s altcoins showing breakout signals. We’ll explain what the coin is, then dive into the trading charts and provide some analysis to help you decide.

1. Boson Protocol (BOSON)

Boson Protocol BOSON is a trust minimised and cost minimised protocol that automates digital to physical redemptions using NFTs encoded with game theory. Boson Protocol’s vision is to enable a decentralised commerce ecosystem by funding and accelerating the development of a stack of specialist applications to disrupt, unbundle and democratise commerce. Boson provides a commerce interface between the Metaverse and the physical world.

BOSON Price Analysis

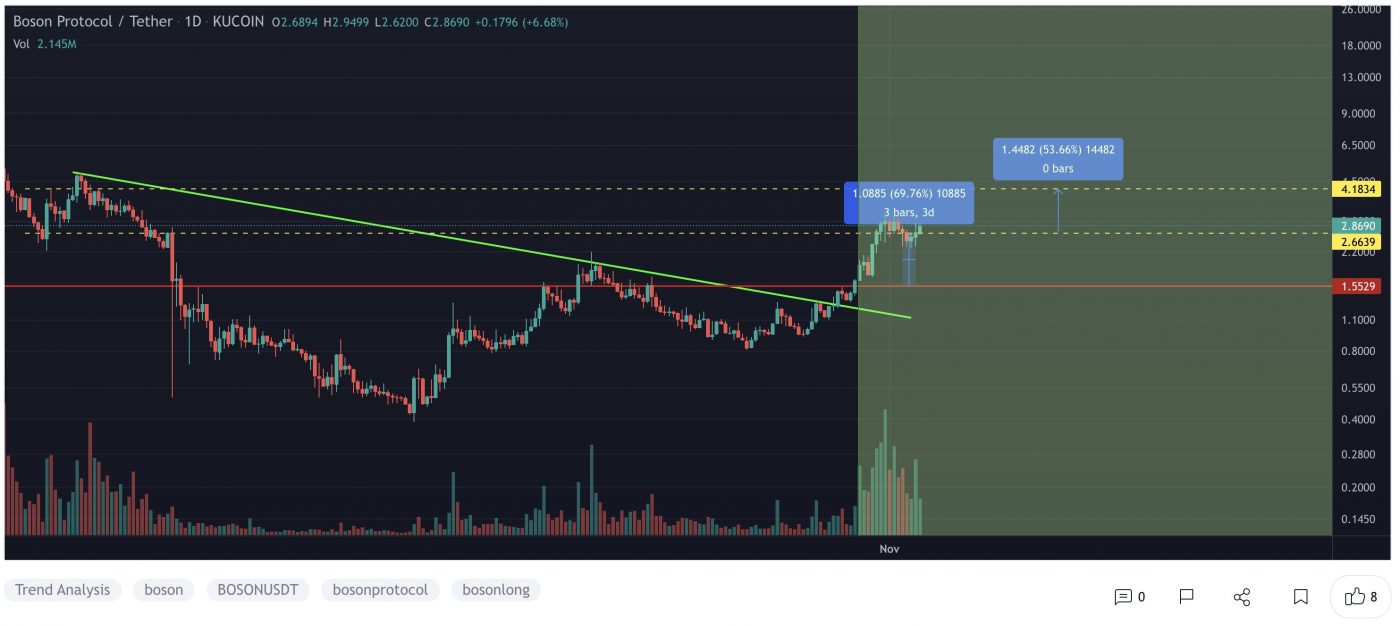
At the time of writing, BOSON is ranked the 365th cryptocurrency globally and the current price is A$3.86. Let’s take a look at the chart below for price analysis:

Source: TradingView

BOSON‘s 305% rally from its September lows ran into resistance at an old swing low near A$4.04.

After November 4’s mainnet release, the retracement to the last significant swing high found some support near A$2.96. This level could provide support again on a retest since it has confluence with the 18 EMA and the current move’s 50% retracement. If the price consolidates or fails to convincingly break October’s high before the portal launch, traders might “sell the news” into this possible support level.

Bulls waiting for a higher risk-to-reward entry might wait for the price to revisit the 61.8% retracement level near A$2.35. This level could provide support, given its confluences with multiple previous swing highs. However, it may not be revisited for some time if the overall market remains bullish.

If bulls flip the current resistance near A$4.04 to support, old consolidation highs near A$4.79 might provide the next resistance. However, the 100% extension of the summer’s swing is a likely target. This extension aligns with multiple old highs from A$5.53 to A$5.83.

2. Crypto Coin (CRO)

Crypto.com coin CRO is the native cryptocurrency token of Crypto.com Chain – a decentralised, open-source blockchain developed by the Crypto.com payment, trading and financial services company. Crypto.com Chain is one of the products in Crypto.com’s lineup of solutions designed to accelerate the global adoption of cryptocurrencies as a means of increasing personal control over money, safeguarding user data, and protecting users’ identities. The CRO blockchain serves primarily as a vehicle that powers the Crypto.com Pay mobile payments app.

CRO Price Analysis

At the time of writing, CRO is ranked the 23rd cryptocurrency globally and the current price is A$0.5296. Let’s take a look at the chart below for price analysis:

Source: TradingView

CRO went parabolic from November 1, reaching nearly 105% percent within eight days as it blasted through its old all-time high.

This fast move left little compelling higher-timeframe support near the current price. A level near A$0.4322, which has confluence with the 8 EMA and 127% extension of H1 2021’s swing, could provide support while traders riding hype from today’s mainnet launch take profits on their positions.

Further below, near A$0.3791, 2021’s previous all-time high could also provide some support on a retest. The last consolidation before the breakout, near November’s open, might give the most substantial support. However, this would require significant retracement from the current price point.

While final targets are impossible to predict, extensions from H1 2021’s move suggest that the 100% extension, near A$0.6075, could provide some resistance. Above this level, the 150% extension near A$0.7428 could also trigger bulls to take profits.

3. Polkadot (DOT)

Polkadot DOT is an open-source sharding multichain protocol that facilitates the cross-chain transfer of any data or asset types, not just tokens, thereby making a wide range of blockchains interoperable with each other. Polkadot’s native DOT token serves three clear purposes: providing network governance and operations, and creating parachains by bonding. The Polkadot protocol connects public and private chains, permissionless networks, oracles and future technologies, allowing these independent blockchains to trustlessly share information and transactions through the Polkadot relay chain.

DOT Price Analysis

At the time of writing, DOT is ranked the 8th cryptocurrency globally and the current price is A$71.98. Let’s take a look at the chart below for price analysis:

Source: TradingView

As the long-awaited Parachain Auctions approach, DOT consolidates between A$69.72 and A$72.51 at the 100% extension of September’s consolidation, after a sharp move up through all-time highs on November 1.

The current consolidation could provide support if the price breaks the zone’s high near A$72.51. A better risk-to-reward entry could present itself near the daily candle bodies of the last swing high near A$64.67, which also has confluence with the 18 EMA and the 61.8% retracement. This potential drop could reach to possibly support the November open and 78.6% retracement, near A$59.68.

A sharper downturn in the market could send the price as low as A$53.89, near the last significant swing high in this leg, although a move this low could signal the start of a bearish trend.

Extensions from September’s consolidation indicate that the 150% extension, near A$84.78, and the 200% extension, near A$95.62, could be the next significant targets.

Where to Buy or Trade Altcoins?

These coins have high liquidity on Binance Exchange, so that could help with trading on AUD/USDT/BTC pairs. And if you’re looking at buying and HODLing cryptos, then Swyftx Exchange is an easy-to-use popular choice in Australia. You can also buy these coins from different exchanges listed on Coinmarketcap.