Categories
Bitcoin Market Analysis Markets The Crypto Den Trading

TradeRoom: Our Weekly Crypto Trades Analysis – Nov 8, 2021

Welcome to this weekly series from the TradeRoom. My name is Dave and I’m the founder of The Crypto Den, an Australian-based crypto trading and education community aiming to give you the knowledge to take your trading game to the next level.

Crypto Market Outlook

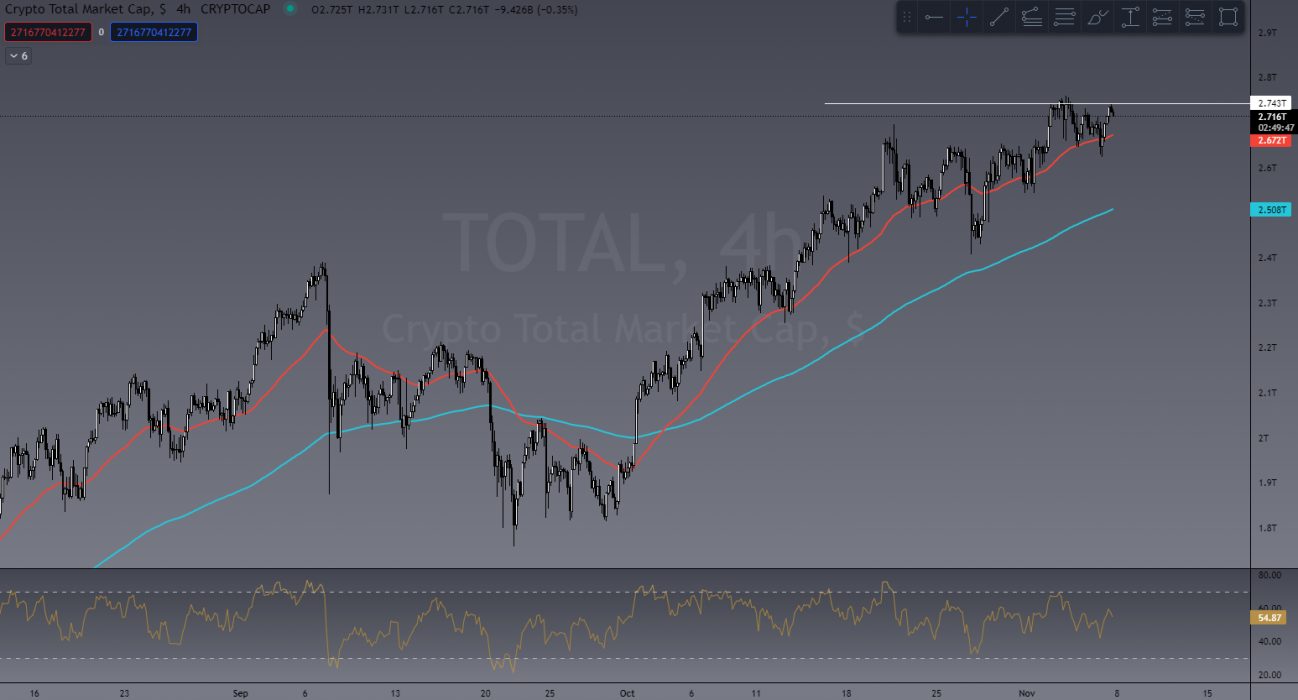
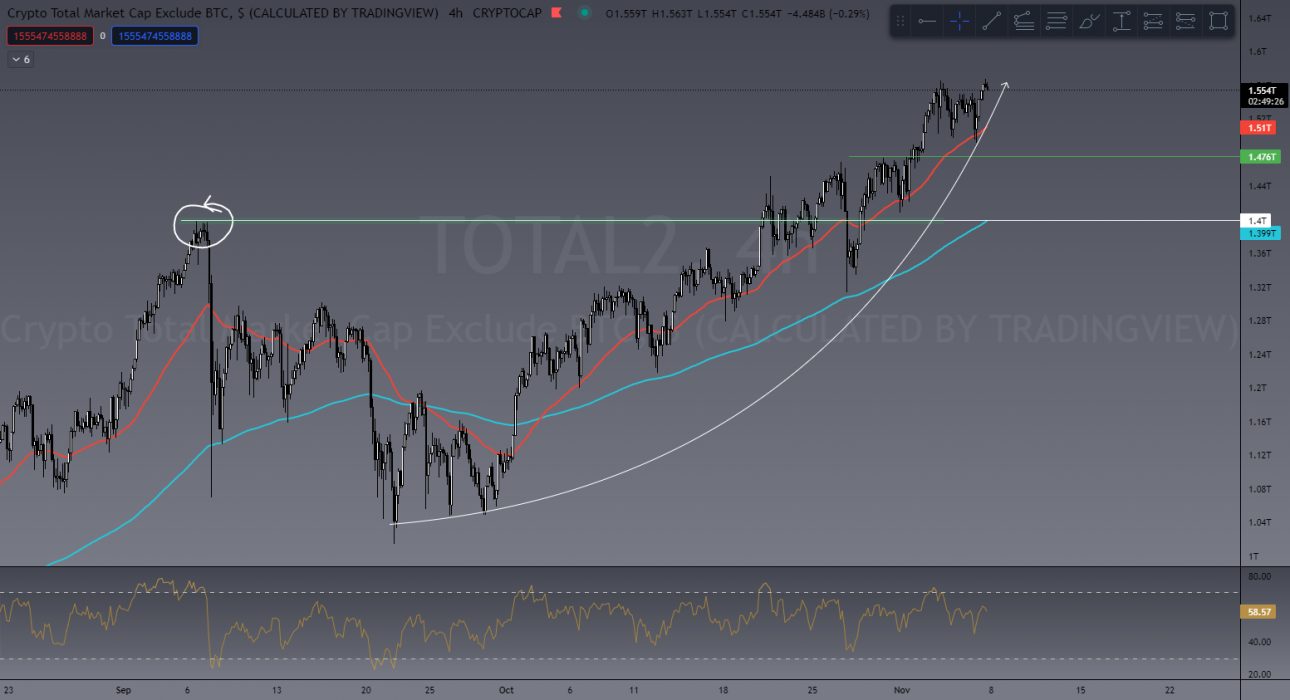
Last week the overall Crypto Market Cap (TOTAL) sat steady at the US$2.6 trillion area and this week is still holding strong, currently at US$2.7 trillion. The flow of money into ALTS has shown some serious bullish price action across the board all week with near perfect conditions as a trader.

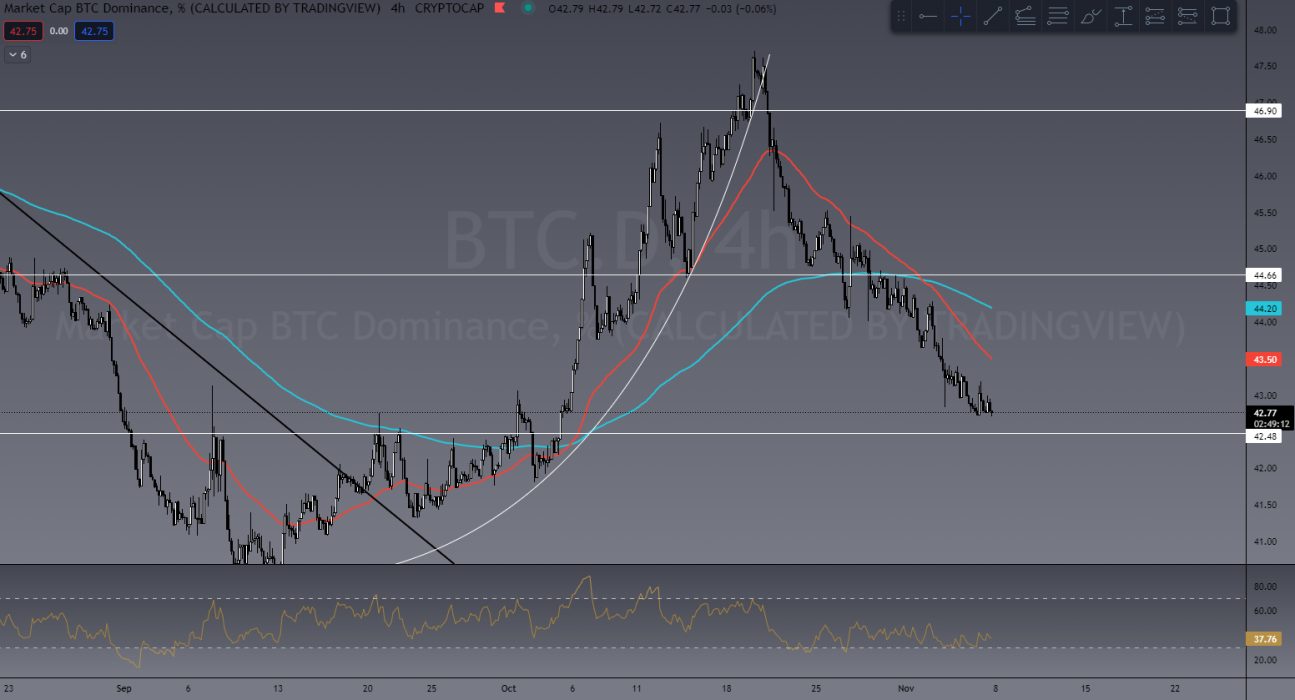
Bitcoin dominance is still dropping. Over the past seven days it’s dropped from 44% to 42%, while the ALT market added almost US$100 billion (6% growth).
Total Crypto Marketcap
ALT coin Marketcap
BTC Dominance

Looking at BTC, we are seeing a few key points of interest.
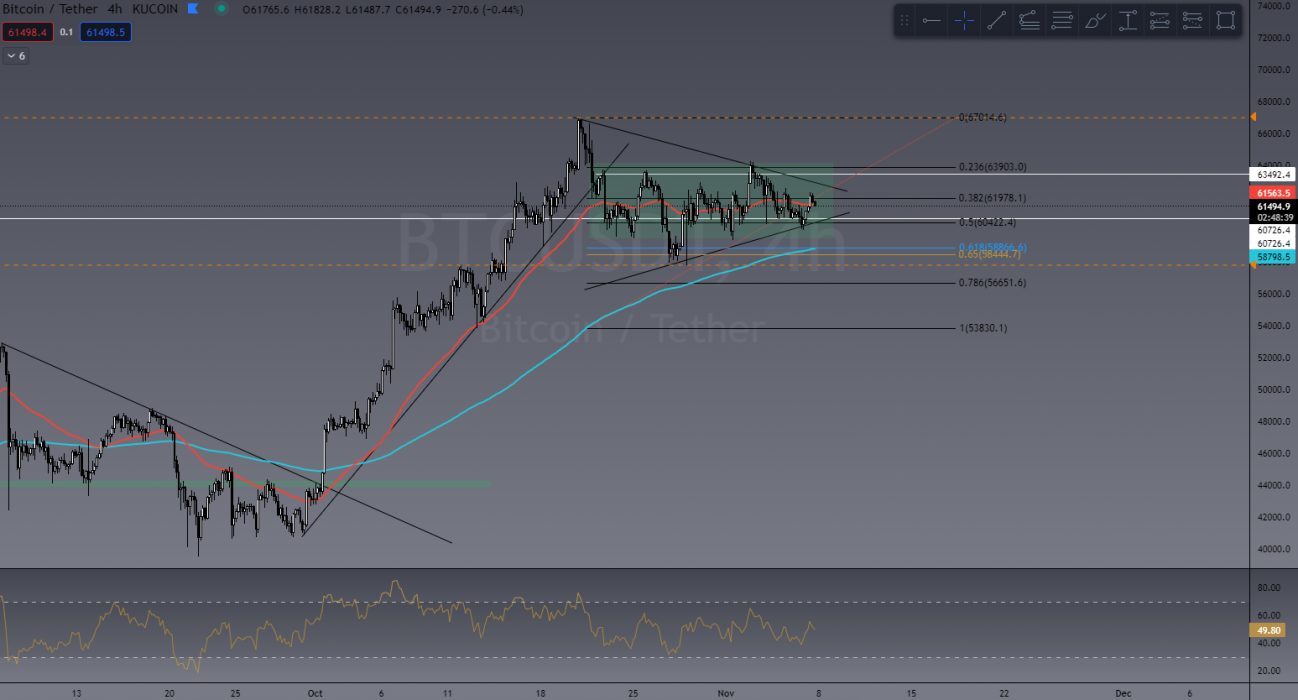
First, since last week BTC has been ranging. Despite the BTC.D dropping further, this isn’t a bad thing. Holding steady above US$60,000 and ranging up to US$64,000 shows a bit of consolidation.

After its ATH push, it’s retraced into a golden pocket (61.8% FIB) from its previous level of consolidation, with a series of Lower Highs (LH) and Higher Lows (HL) forming a symmetrical triangle (usually a bullish continuation pattern with a 70% chance of continuing with existing trend).

Our first target in the TradeRoom still sits at US$78,000. As traders we move with the market and change our bias to suit, and at the moment the general consensus is bullish!
BTC/USDT

Something to keep an eye on, however, is the BTC monthly chart. At the moment it’s showing a bit of indecision (Doji Candle) and while there are still three weeks of the month to go, it’s worth keeping in mind. We expect this to change but it’s worth noting.
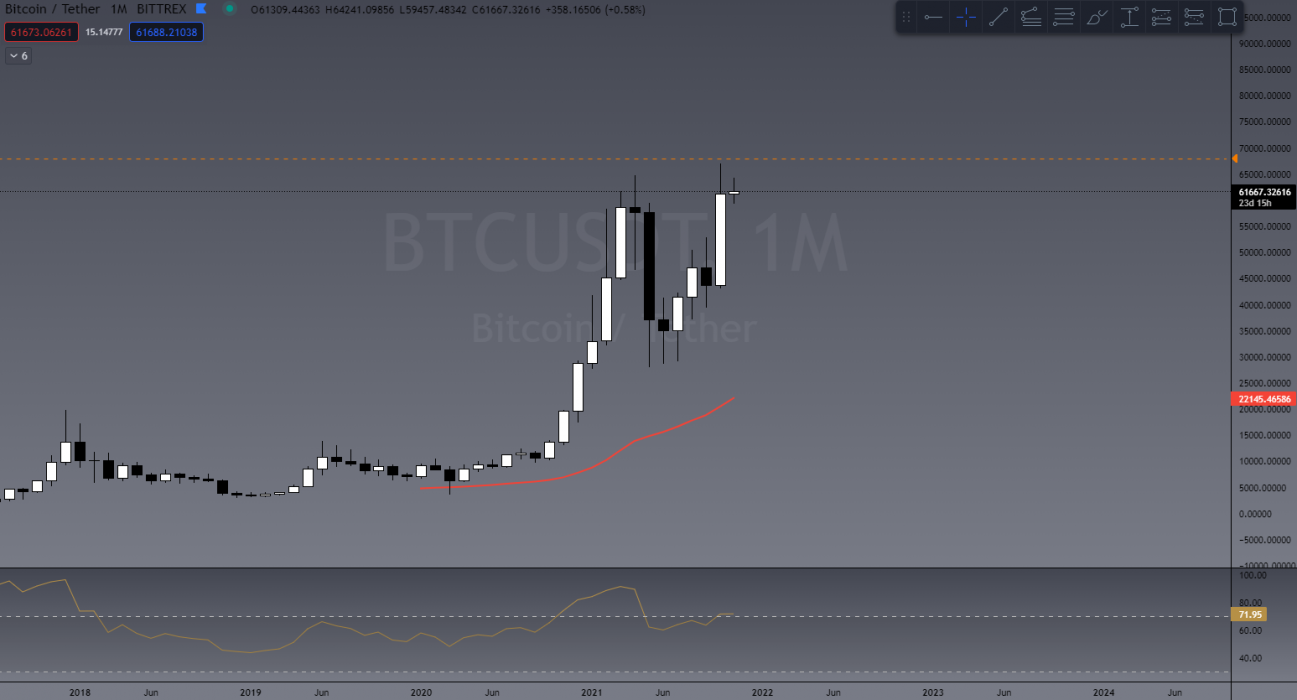
BTC monthly chart

Last Week’s Performance

SOL/USDT

For the third week in a row, Solana (SOL) has made the top of my list. Why? Because it’s a money-making machine! With another 25% growth in the last week, there just seems to be no stopping it. Painting a bit of a daily Doji candle at the time of writing, however, if BTC does in fact take off I expect SOL won’t be far behind.
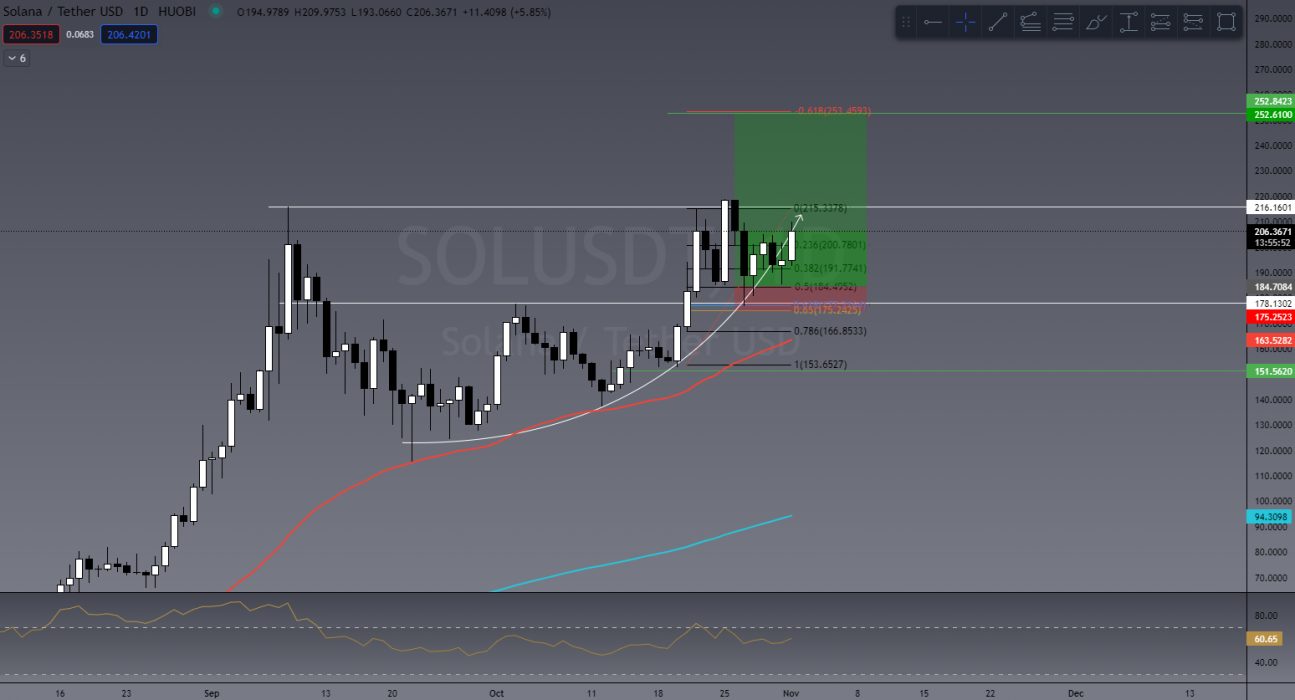
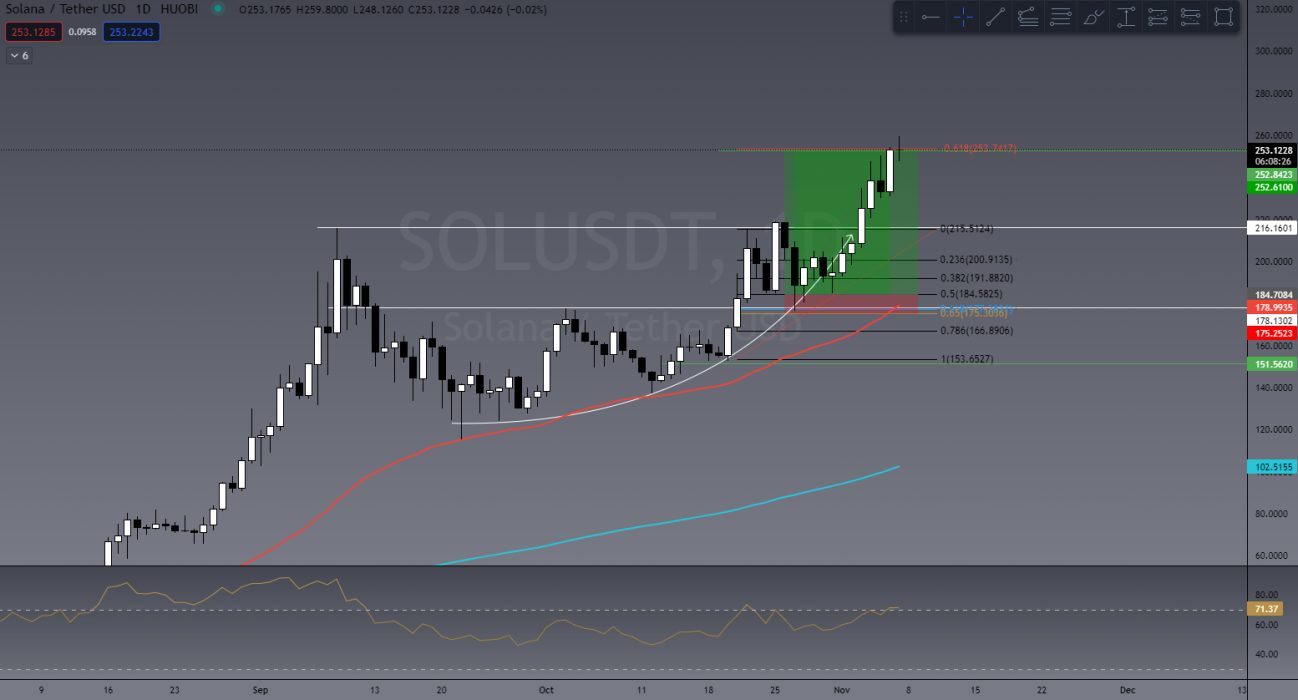
Chart I shared in last week’s article
SOL this week!

AXS/USDT

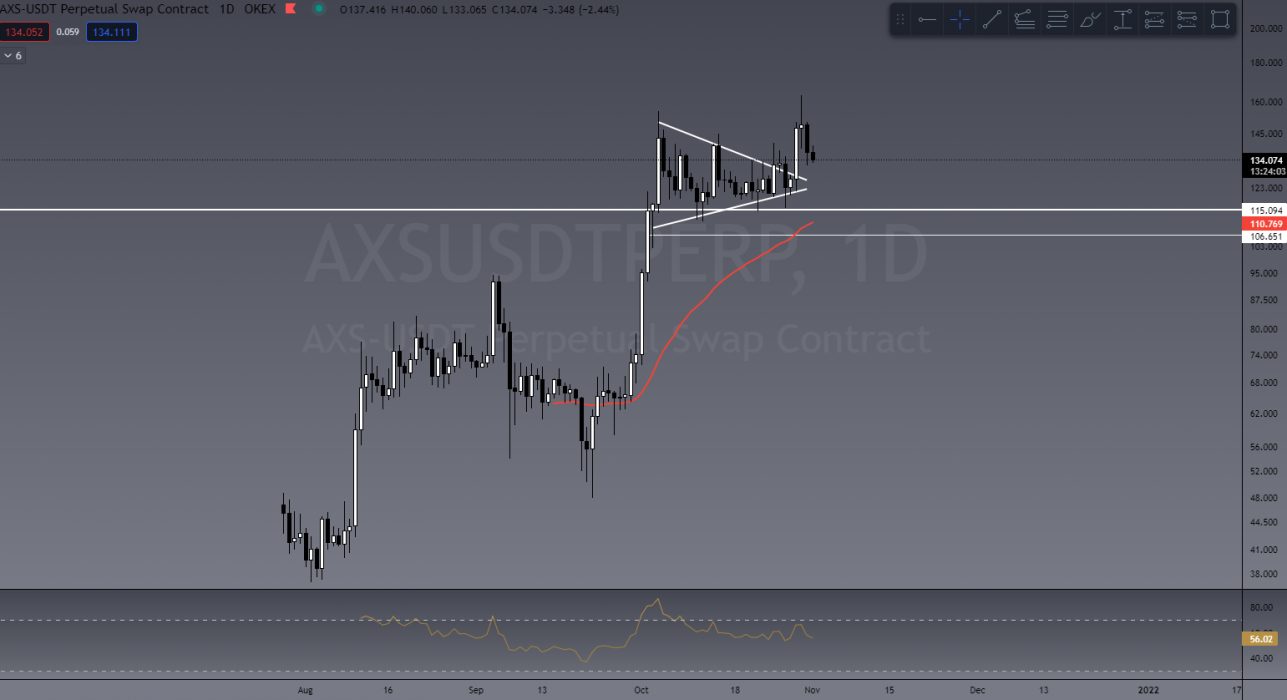
Another trade setup I mentioned in last week’s article is AXS. Since breaking out of its symmetrical triangle, AXS peaked out at 35%, which those of you who leverage trade will know is a significant move, even on a 10x trade.
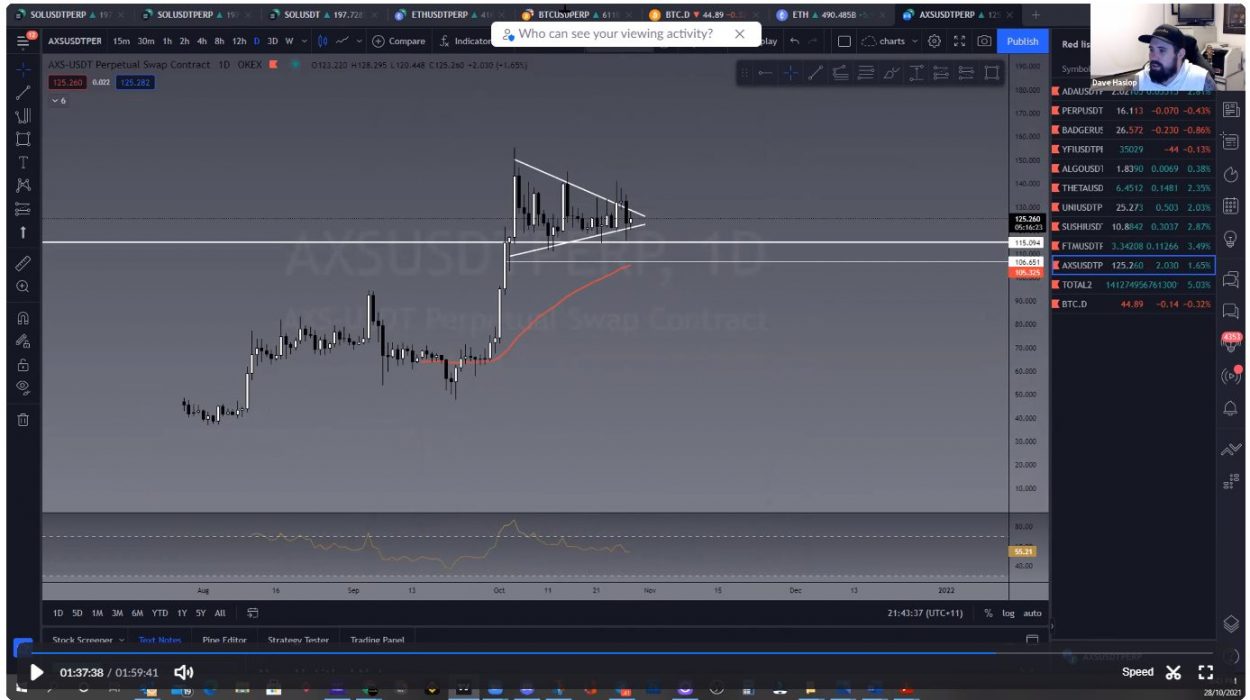
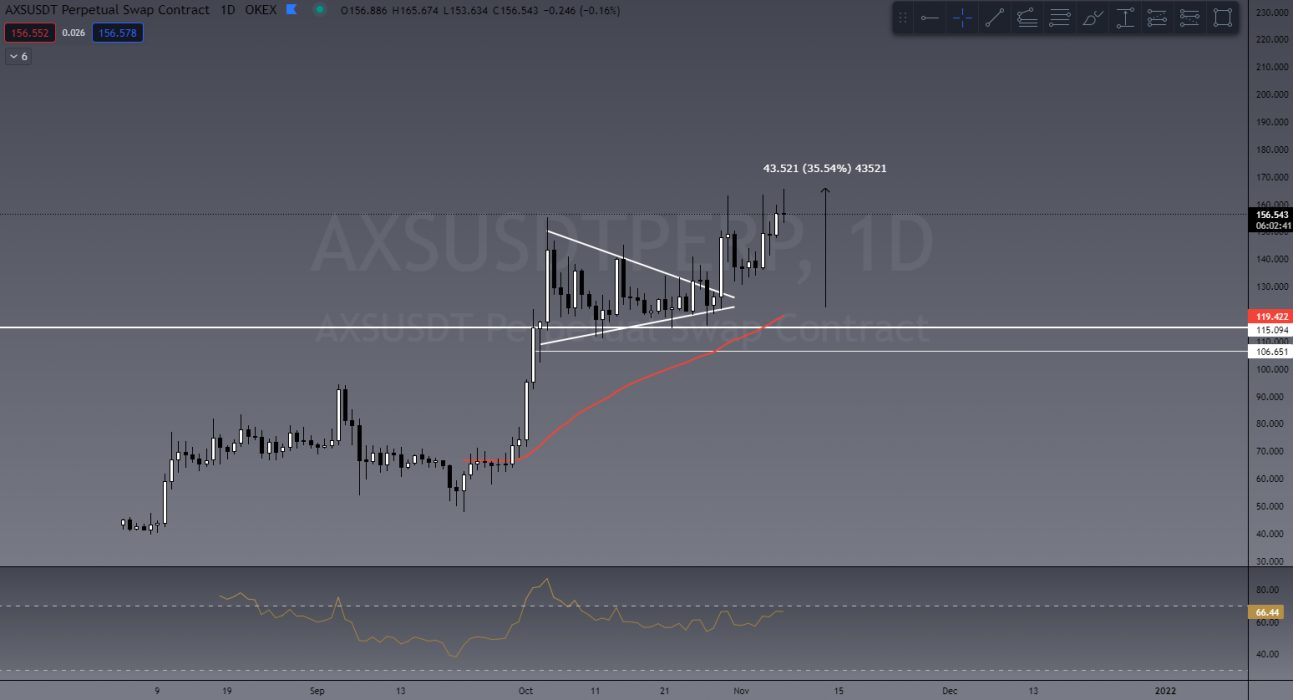
Last week’s screenshot from a TradeRoom Market Scan
AXS breakout on daily chart

This Week’s Trades

BTC/USD

Let’s go back to BTC. If the bullish sentiment plays out, I’m expecting to see something like this:
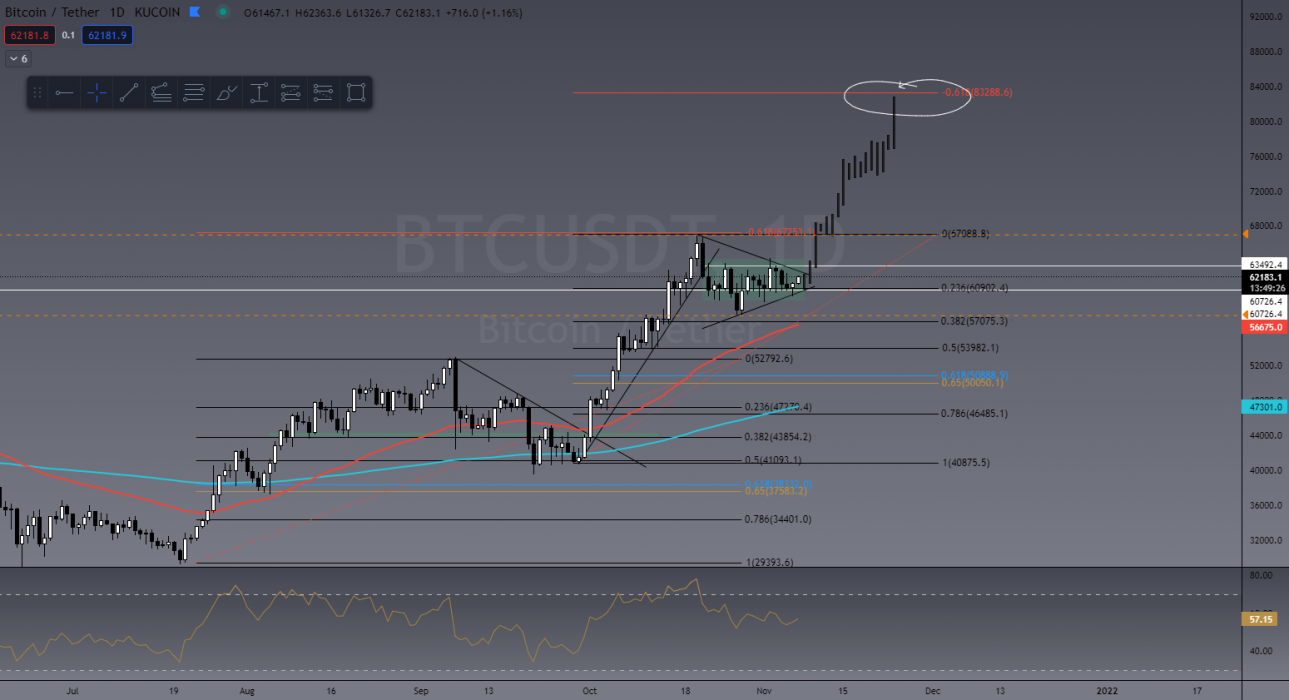
Possible BTC target

You can see in its previous run up, BTC peaked at the “future 618” Fib (a common target fib) after retracing 50% of its last push before that. Now, it’s not uncommon for momentum to pick up and only see retraces of 38.2% in a continuation trade. If it follows the same pattern, a target of US$83,000 is likely. Our initial target for BTC is still US$78,000.

MANA/USDT

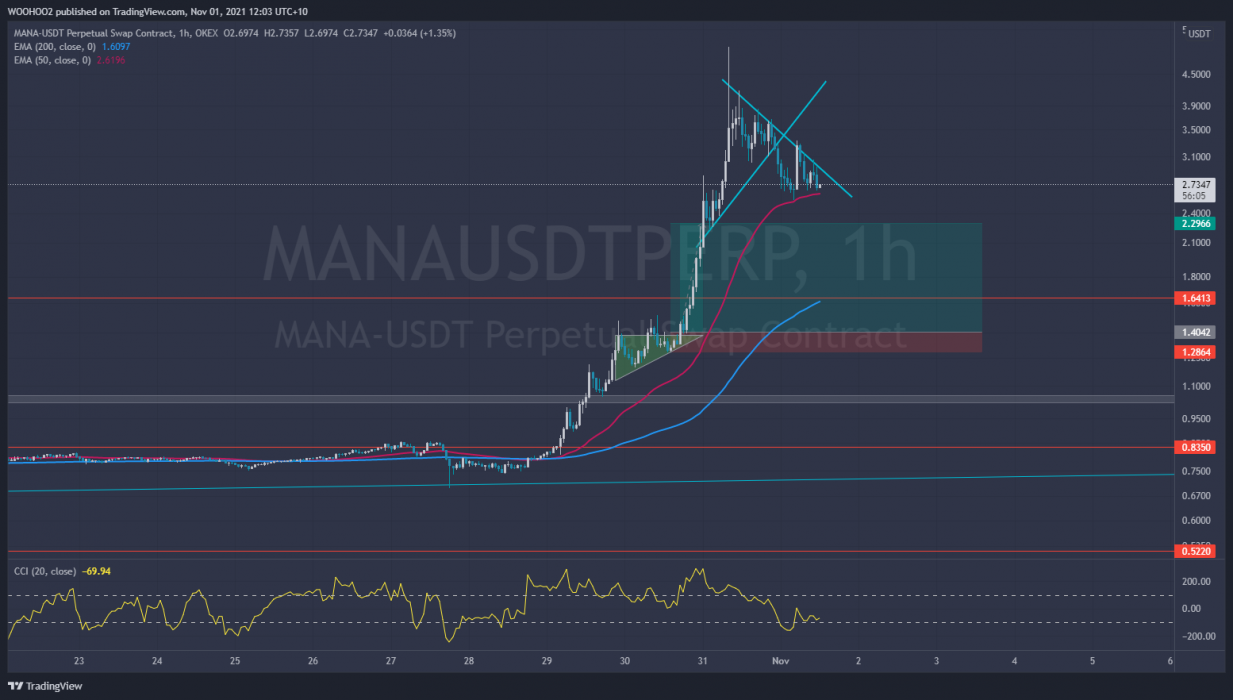
One of the biggest coins to watch for this week, I think, will be MANA (Decentraland). The momentum is too high to ignore and with all the hype around the metaverse tokens, this has been one nice little performer.

We charted this in the TradeRoom last week and collectively made over 1000% RIO in a matter of hours!

From a technical standpoint, MANA has retraced to the golden pocket (common retrace level based on Fibonacci), bounced off the pocket and the 50 Exponential Moving Average (EMA), and is currently in a descending wedge pattern. This is another bullish continuation pattern we teach in our trading course.
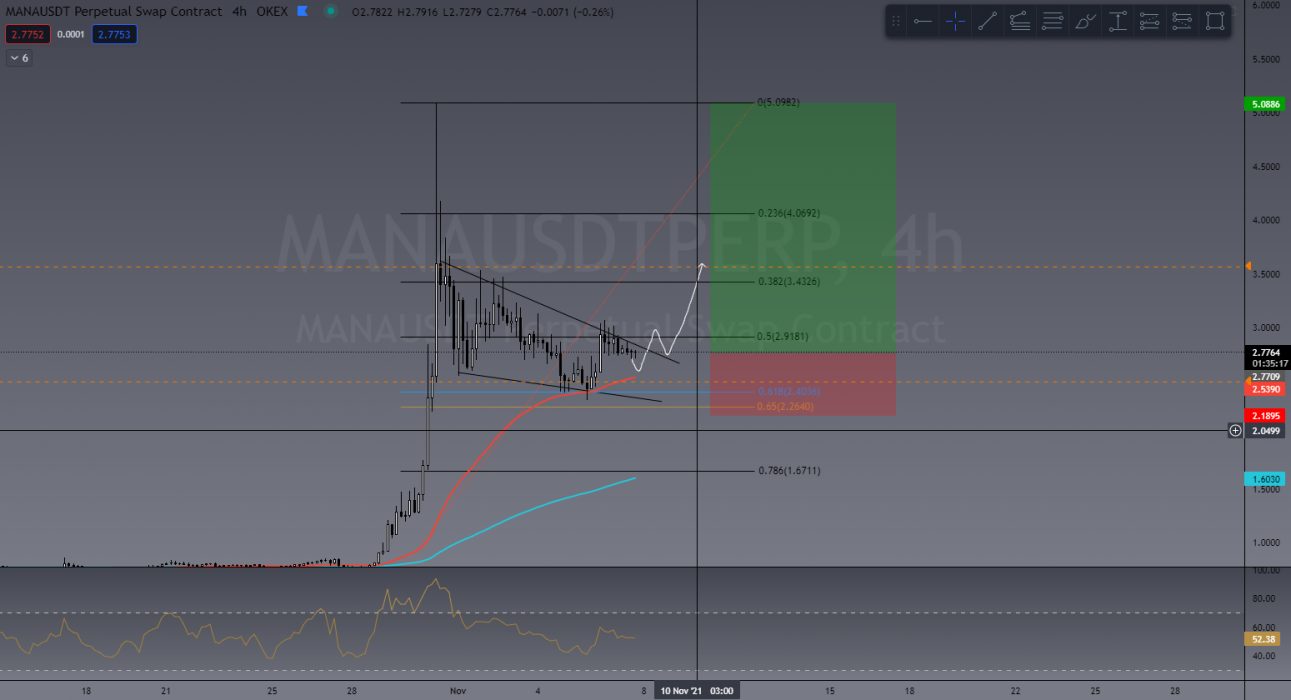
Expect to see something like this play out

It’s important to remember that when trading ALT coins, their price action is heavily dependent on BTC. If BTC takes a bullish path, ALTS will likely follow. If BTC turns bearish, then ALTS will likely dump in price even harder!

If you’d like to become a better trader, you’re invited to join our TradeRoom where we share daily charts and market analysis. In our community we strongly encourage and teach correct risk management strategies to keep our members safe in this new volatile crypto market.

>> Take our Free Beginners’ Trading Course

>> Join our Trading Community for your 7-day free trial

>> If you’d like to learn how to read and analyse charts, our LAST live trading course of the year starts Nov 15!


The Crypto Den was created in 2017 to help the rapidly growing crypto community learn and understand the fundamentals of digital currencies and how to trade them. 

Since then we have taught thousands of members the basics of technical analysis and trading strategies to further progress and perfect their trading abilities.

In the TradeRoom you will be included in a supportive environment which encourages personal growth, education and community support.

It’s a place to share your trading ideas and follow other experienced traders’ feeds to help keep your finger on the pulse of such a volatile market!

Categories
ChainLink Crypto News Data Market Analysis Trading

Top 3 Coins to Watch Today: LINK, ICP, DATA – November 8 Trading Analysis

Let’s take a closer look at today’s altcoins showing breakout signals. We’ll explain what the coin is, then dive into the trading charts and provide some analysis to help you decide.

1. Chainlink (LINK)

The Chainlink Network LINK is driven by a large open-source community of data providers, node operators, smart contract developers, researchers, security auditors and more. The company focuses on ensuring that decentralised participation is guaranteed for all node operators and users looking to contribute to the network. Chainlink allows blockchains to securely interact with external data feeds, events and payment methods, providing the critical off-chain information needed by complex smart contracts to become the dominant form of digital agreement.

LINK Price Analysis

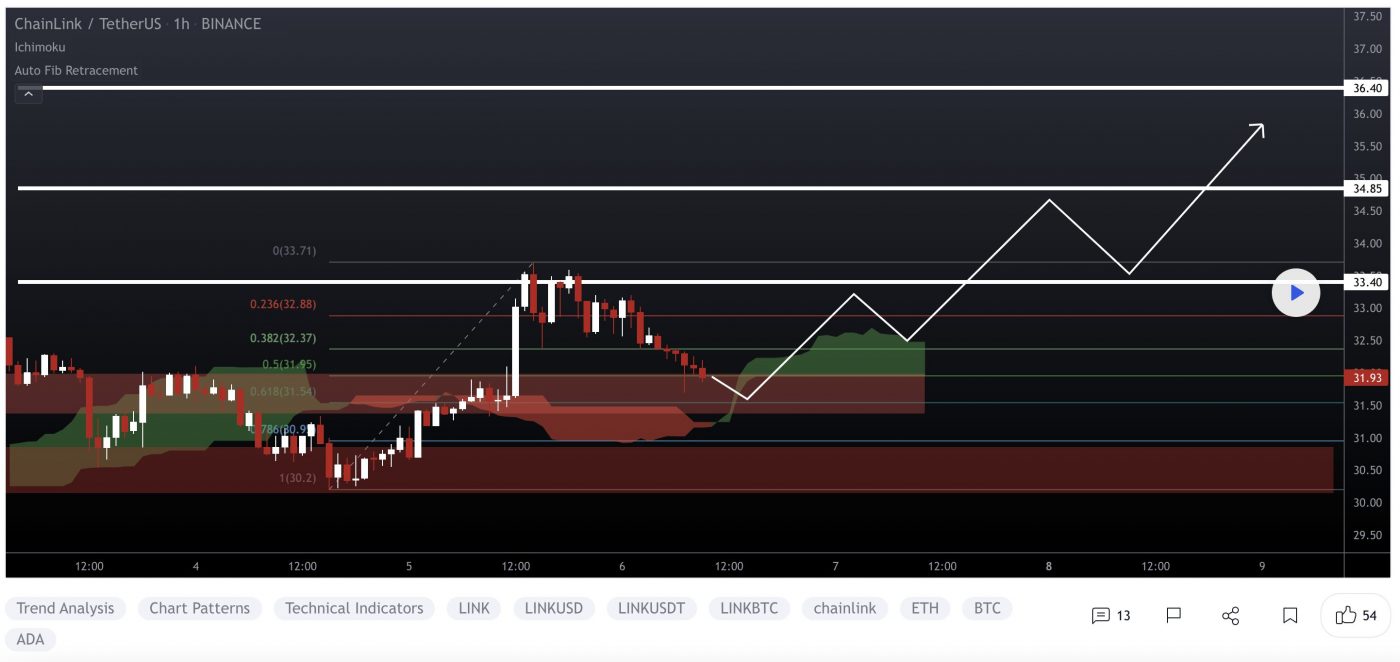
At the time of writing, LINK is ranked the 15th cryptocurrency globally and the current price is A$43.79. Let’s take a look at the chart below for price analysis:

Source: TradingView

LINK‘s massive late-July spike retraced near A$28.46 into the consolidation that began the impulse before bouncing to A$32.77. 

This consolidation could provide support again, although bears would first have to push the price through possible support near A$38.65. The market’s structure may be shifting bearish, with A$35.12 likely to provide some resistance if this is the case. A sustained bearish move could reach the swing low near A$30.44 before finding support near A$29.91.

However, the bullish higher-timeframe trend might prevail, with relatively equal highs near A$49.09 potentially giving an attractive target to lure the price over the monthly open. If so, the price could reach for the midpoint of the August wick near A$53.58.

2. Internet Computer (ICP)

The Internet Computer ICP is the world’s first blockchain that runs at web speed with unbounded capacity. It also represents the third major blockchain innovation, alongside Bitcoin and Ethereum – a blockchain computer that scales smart contract computation and data runs them at web speed, processes and stores data efficiently, and provides powerful software frameworks to developers. By making this possible, the Internet Computer enables the complete reimagination of software, providing a revolutionary new way to build tokenised internet services, pan-industry platforms, decentralised financial systems, and even traditional enterprise systems and websites.

ICP Price Analysis

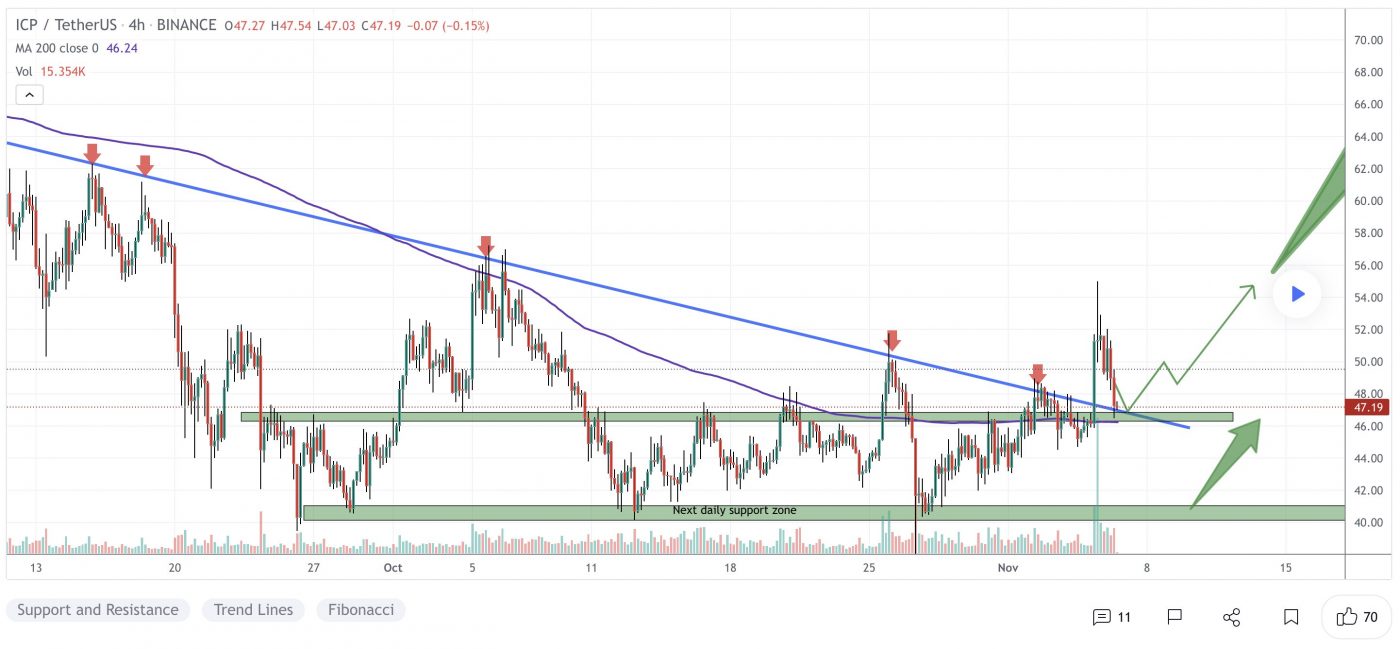
At the time of writing, ICP is ranked the 24th cryptocurrency globally and the current price is A$68.41. Let’s take a look at the chart below for price analysis:

Source: TradingView

In mid-August, ICP also turned the corner, breaking a key swing high in early September. This move could suggest a longer-term bullish trend.

The swing high near A$78.24 stands out as a bullish target and marks an area of probable resistance. Further continuation could reach into possible resistance starting near A$85.35.

Even if the bullish trend continues, a stop run at the recent swing low near A$57.30 into possible support beginning near A$53.87 is reasonable. If the price reaches further down, the swing low and possible support near A$49.27 might provide another downside target. 

The area near A$47.75 could also provide support. However, a drop this far could suggest a stop run below the higher-timeframe relatively equal lows near A$43.18 into possible support beginning around A$41.73.

3. Streamr (DATA)

Streamr DATA is an open-source project and decentralised platform that relies on cryptography instead of trust. It is a P2P, real-time data infrastructure that houses a platform and tools for a new data economy. The technology stack includes a scalable real-time messaging network (pub/sub) hosted on computers worldwide, a marketplace for trading/selling data, and a set of tools for working with real-time data.

DATA Price Analysis

At the time of writing, DATA is ranked the 440th cryptocurrency globally and the current price is A$0.1979. Let’s take a look at the chart below for price analysis:

Source: TradingView

Since August’s high, DATA‘s 57% drop marks the current range as a reasonable area to expect accumulation.

The recent bearish flip of the 9, 18 and 40 EMAs might cause bulls to be less aggressive in bidding. However, possible support near A$0.1722 and A$0.1670 – between the 61.8% and 78.6% retracements – could see at least a short-term bounce. 

Long-term consolidation suggests that the areas near A$0.2264 and A$0.2560 may be more likely to cause a longer-term trend reversal.

Bears are likely to add to their shorts at probable resistance beginning near A$0.1815, which has confluence with the 18 EMA. A fast break of this resistance could trigger more selling near A$0.1720, the start of the bearish move.

If an aggressive bullish move does appear, trapped buyers in the probable resistance beginning near A$0.2190 might provide a ceiling for this impulse.

Where to Buy or Trade Altcoins?

These coins have high liquidity on Binance Exchange, so that could help with trading on AUD/USDT/BTC pairs. And if you’re looking at buying and HODLing cryptos, then Swyftx Exchange is an easy-to-use popular choice in Australia.

Categories
Australia Crypto Trackers Data Market Analysis

Chainalysis Opens Canberra Office after Partnership with CBA Bank

New York-based Chainalysis, best-known as the on-chain data analysis platform, has recently announced its partnership with the Commonwealth Bank of Australia (CBA), opening its new office in Canberra due to increased mainstream adoption and demand for their product.

The new Chainalysis office aims to strengthen its presence in the Pacific region, supporting the local cryptocurrency market, public sector agencies, and financial institutions. The leading blockchain analytics firm also plans to offer crypto trading services to 6.5 million app users. 

The crypto exchange and custody service, designed by CBA, will offer a new feature to its clients using its Commbank app. The bank plans to provide customers with access to up to 10 crypto assets including Bitcoin, Ethereum, Bitcoin Cash, and Litecoin.

Last year, Chainalysis struck up partnerships with leading Australia-based payments provider Assembly Payments and cryptocurrency exchanges CoinSpot and CoinJar to improve compliance standards. During that time the company has more than doubled the number of cryptocurrency customers. 

Global Crypto Adoption Index

With the official opening of the Canberra presence, I’m excited to see how we can work even closer together with the Chainalysis team to allow Australia to fully embrace cryptocurrency and reap the benefits.

Caroline Bowler, CEO, BTC Markets

Partnerships to Strengthen Compliance

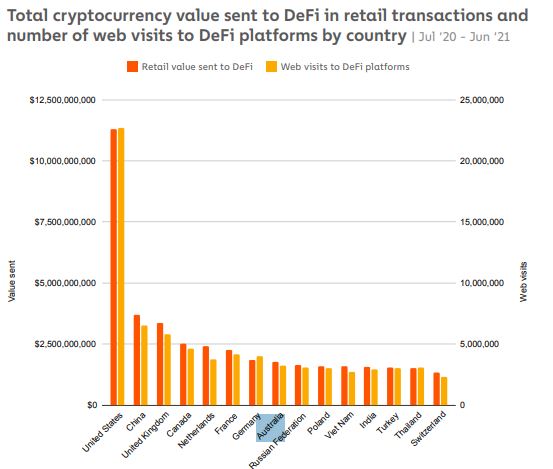
With Australia ranking 38th in terms of global cryptocurrency adoption, Chainalysis’s new Canberra office will enable continued, compliant validation of cryptocurrency. Australia also currently ranks 12th in DeFi adoption.

From working with Chainalysis, we have the confidence that our business is compliant with local regulations, enabling us to continue to build and maintain client trust,

Caroline Bowler, CEO, BTC Markets

Ulisse Dell’Orto, the company’s managing director for the Asia-Pacific region, added: “Chainalysis’s data platform will strengthen the trust necessary to further legitimise cryptocurrency as an everyday asset for retail and institutional investors alike.”

The transparency provided by Chainalysis means that as an industry we can begin to truly build a trusted and compliant foundation for cryptocurrency, giving the reassurance and confidence to our customers that they need.

Alex McCorkindale, head of compliance, Easy Crypto

Crypto Usage Increases in CSAO Region

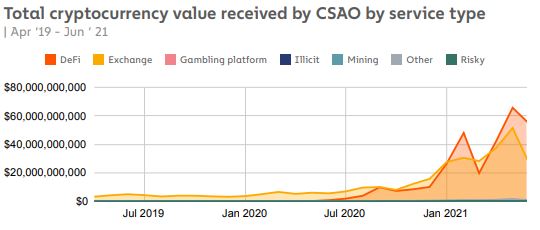
According to its 2021 Geography of Cryptocurrency Report, Chainalysis found Central & Southern Asia and Oceania (CSAO) to be the fourth-largest cryptocurrency market, accounting for 14 percent of all cryptocurrency value transacted between July 2020 and June 2021. CSAO’s transaction activity grew by 706 percent compared to last year in terms of raw value.

Global Crypto Adoption Index

“The Pacific region is quickly becoming a centre for cryptocurrency innovation,” said Todd Lenfield, country manager for ANZ at Chainalysis. “Our increased investment in the region will ensure businesses and governments can explore digital asset ecosystems in a safe, compliant manner.”

With the growth of crypto increasing all over the world, each country finds its uses for digital assets. In Africa, crypto adoption has surged 1200 percent due to its P2P use cases.

In June, Chainalysis announced its Series E funding round, raising US$100 million and bringing its valuation to over US$4 billion. Chainalysis will use the funding to build out its vision as the blockchain data platform.

Categories
Crypto News Market Analysis Trading

Top 3 Coins to Watch Today: ALGO, LUNA, RVN – November 5 Trading Analysis

Let’s take a closer look at today’s altcoins showing breakout signals. We’ll explain what the coin is, then dive into the trading charts and provide some analysis to help you decide.

1. Algorand (ALGO)

The Algorand ALGO blockchain is a permissionless, pure proof-of-stake blockchain protocol. Unlike proof-of-work (PoW) blockchains, where the root block must be validated by randomly selected validators (using computing power), in the pure proof-of-stake approach all of the validators are known to one another and only have to agree on the next block in order to create a new block. Algorand was invented to speed up transactions and improve efficiency in response to the slow transaction times of Bitcoin and other blockchains.

ALGO Price Analysis

At the time of writing, ALGO is ranked the 20th cryptocurrency globally and the current price is A$2.47. Let’s take a look at the chart below for price analysis:

Source: TradingView

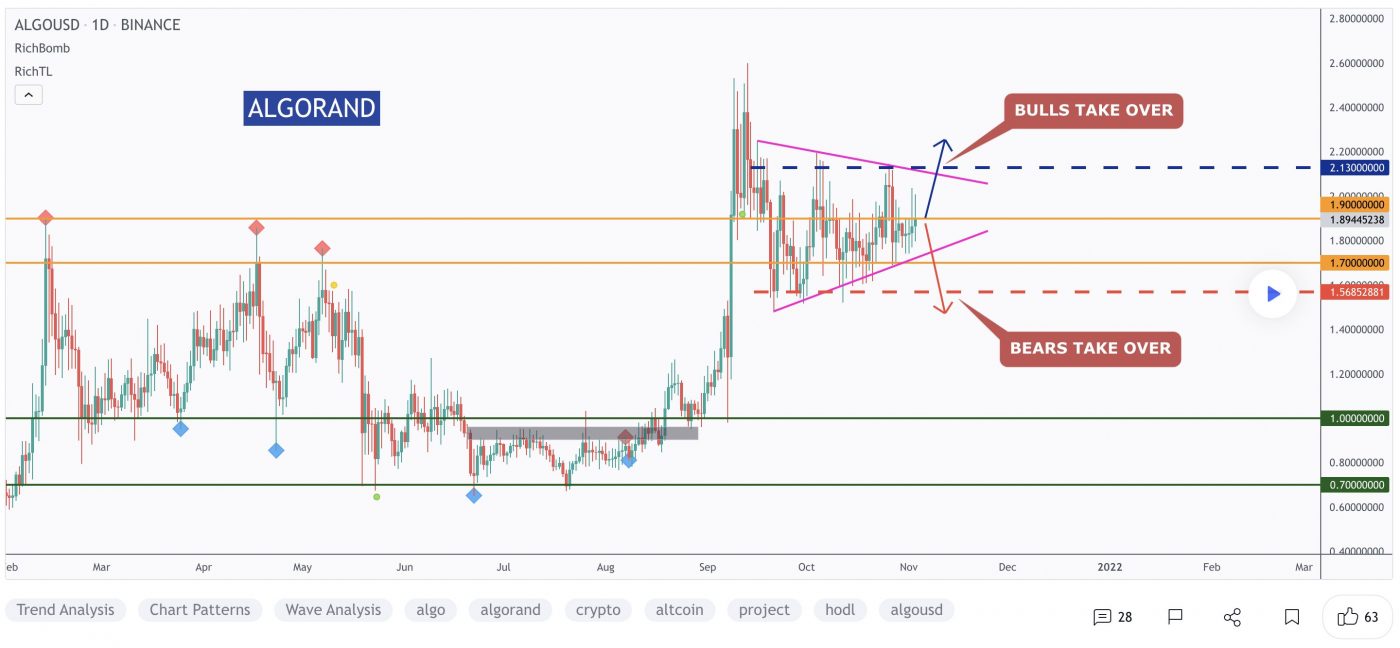
After creating a second equal low in mid-July, ALGO has rallied nearly 95% into resistance that starts near A$1.92.

Aggressive bulls looking for a continuation to the nearest cluster of relatively equal highs around A$2.49 might look for bids near A$2.37. More significant resistance rests above near A$2.57. A group of significant swing highs at A$2.64, A$2.67 and A$2.69 give possible targets if this resistance breaks.

A stop run on the recent low at A$2.35 into possible support beginning near A$2.30 might see stronger bidding. This area also has a confluence with the September monthly open.

A bearish market shift could reach the swing low at A$2.28 into possible support beginning near A$2.24.

2. Terra (LUNA)

Terra LUNA is a blockchain protocol that uses fiat-pegged stablecoins to power price-stable global payments systems. According to its white paper, Terra combines the price stability and wide adoption of fiat currencies with the censorship-resistance of Bitcoin and offers fast and affordable settlements. Terra’s native token, LUNA, is used to stabilise the price of the protocol’s stablecoins. LUNA holders are also able to submit and vote on governance proposals, giving it the functionality of a governance token.

LUNA Price Analysis

At the time of writing, LUNA is ranked the 12th cryptocurrency globally and the current price is A$63.90. Let’s take a look at the chart below for price analysis:

Source: TradingView

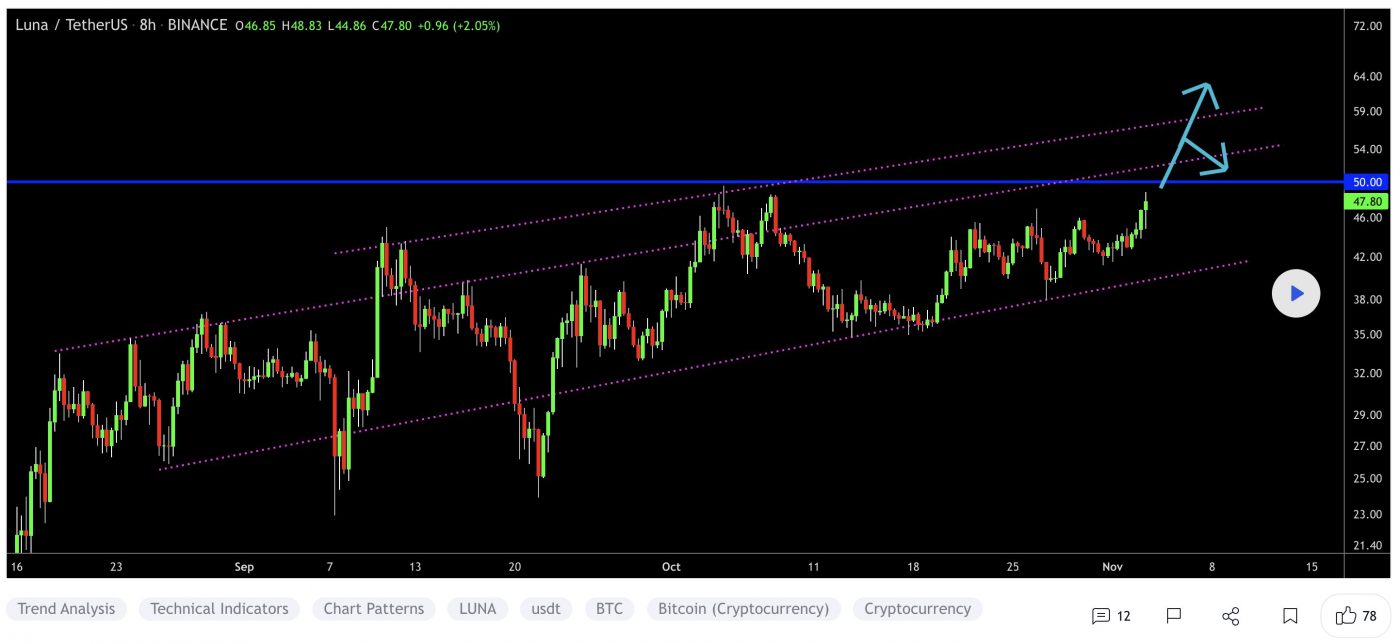
After breaking its March high on August 16, LUNA began a range that has been whiplashing both bulls and bears.

Resistance beginning near A$64.35 held the price down for the second half of September, although bulls have shown some strength near the 9 and 18 EMAs. 

A quick drop to A$49.37, or into the zone beginning near A$46.87, could give bulls the fuel to push through the nearby resistance. If this resistance breaks, the high near A$69.47 provides a reasonable target. 

A break of this level could move further into uncharted territory with the nearest probable resistances projected around A$78.28 and A$84.57.

More patient bulls might be waiting far below the 40 EMA with bids near the higher-timeframe range’s 61.8% retracement, near A$41.59.

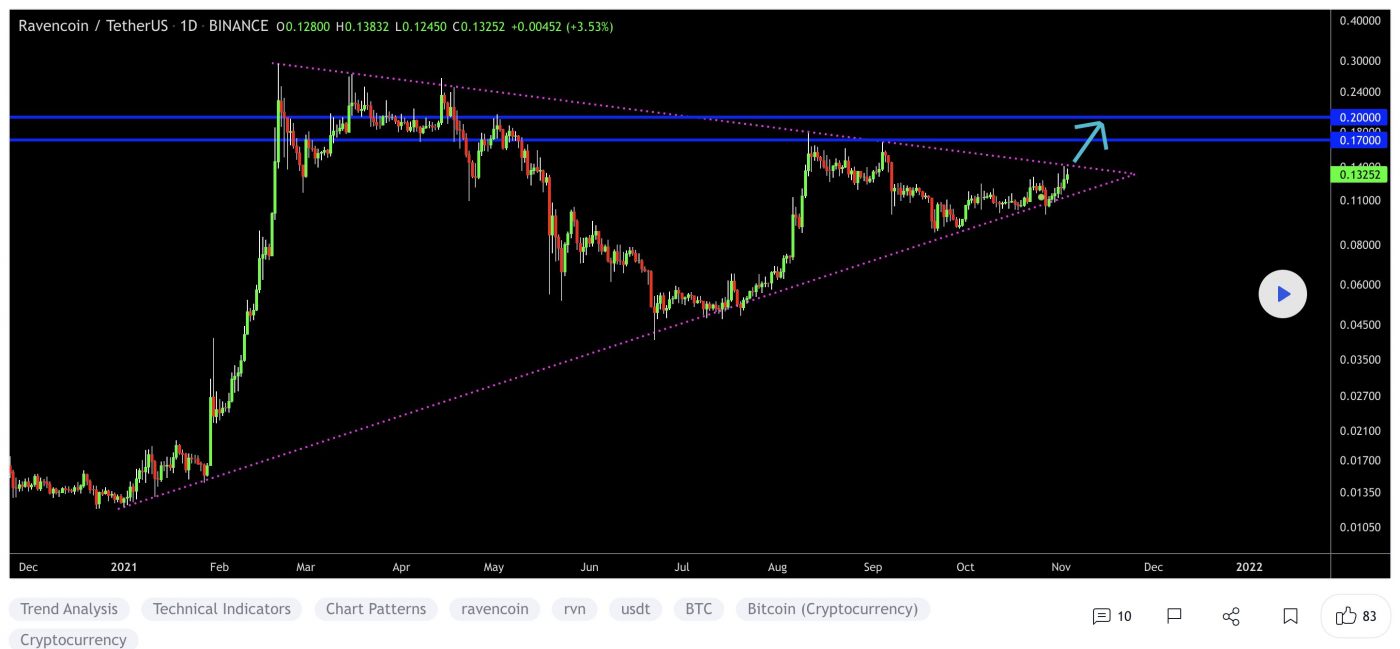
3. Ravencoin (RVN)

Ravencoin RVN is a digital peer-to-peer (P2P) network that aims to implement a use case-specific blockchain, designed to efficiently handle one specific function: the transfer of assets from one party to another. Built on a fork of the Bitcoin code, Ravencoin aims to solve the problem of assets transfer and trading over the blockchain. Previously, if someone created an asset on the Bitcoin blockchain, it could be accidentally destroyed when someone traded the coins it was created with. RVN coins are designed as internal currency within the network and must be burnt in order to issue token assets on the Ravenchain.

RVN Price Analysis

At the time of writing, RVN is ranked the 86th cryptocurrency globally and the current price is A$0.1884. Let’s take a look at the chart below for price analysis:

Source: TradingView

Since August high, RVN‘s 77% drop marks the current range as a reasonable area to expect accumulation.

The recent bearish flip of the 9, 18 and 40 EMAs might cause bulls to be less aggressive in bidding. However, possible support near A$0.1533 and A$0.1398 – between the 61.8% and 78.6% retracements – could see at least a short-term bounce. 

Last year’s long-term consolidation suggests that the areas near A$0.2346 and A$0.2658 may be more likely to cause a longer-term trend reversal.

Bears are likely to add to their shorts at probable resistance beginning near A$0.1912, which has confluence with the 18 EMA. A fast break of this resistance could trigger more selling near A$0.2175, the start of the bearish move.

If an aggressive bullish move does appear, trapped buyers in the probable resistance beginning near A$0.2240 might provide a ceiling for this impulse.

Where to Buy or Trade Altcoins?

These coins have high liquidity on Binance Exchange, so that could help with trading on AUD/USDT/BTC pairs. And if you’re looking at buying and HODLing cryptos, then Swyftx Exchange is an easy-to-use popular choice in Australia.

Categories
Cardano Crypto News Market Analysis Qtum Solana Trading

Top 3 Coins to Watch Today: ADA, SOL, QTUM – November 4 Trading Analysis

Let’s take a closer look at today’s altcoins showing breakout signals. We’ll explain what the coin is, then dive into the trading charts and provide some analysis to help you decide.

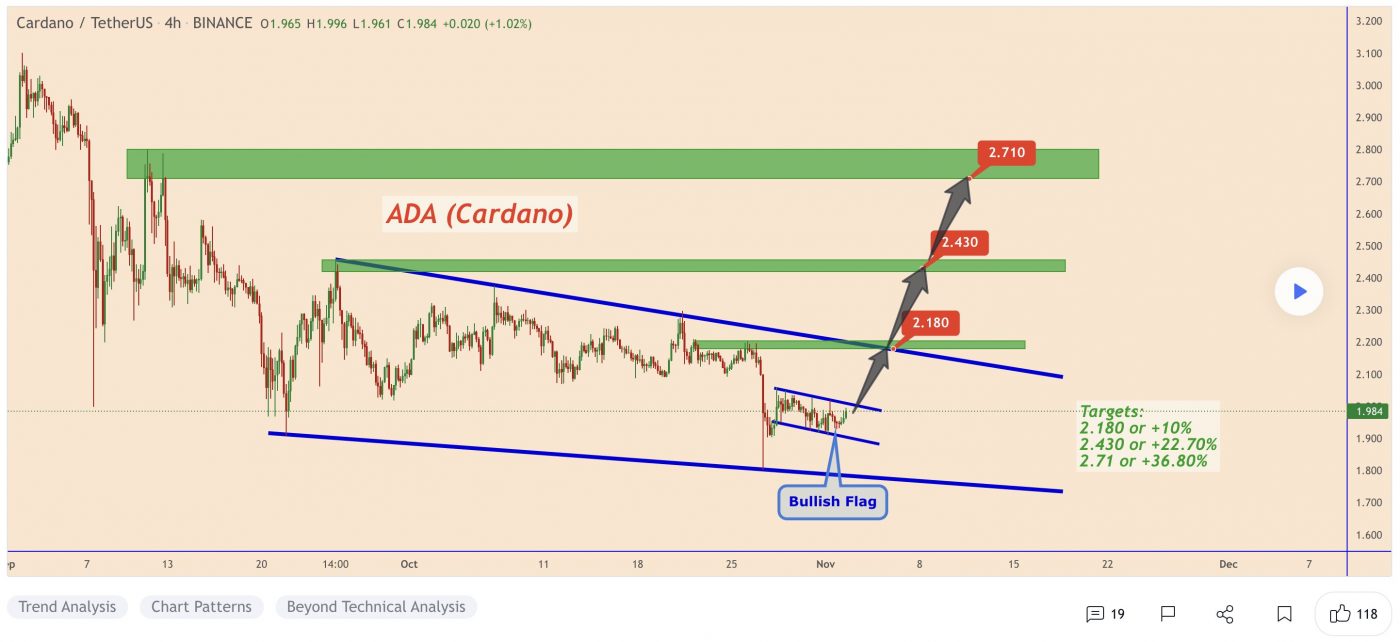
1. Cardano (ADA)

Cardano ADA is a proof-of-stake blockchain platform that says its goal is to allow “changemakers, innovators and visionaries” to bring about positive global change. The open-source project also aims to “redistribute power from unaccountable structures to the margins to individuals”, helping to create a society that is more secure, transparent, and fair.

Cardano is used by agricultural companies to track fresh produce from field to fork, while other products built on the platform allow educational credentials to be stored in a tamper-proof way, and retailers to clamp down on counterfeit goods.

ADA Price Analysis

At the time of writing, ADA is ranked the 5th cryptocurrency globally and the current price is A$2.78. Let’s take a look at the chart below for price analysis:

Source: TradingView

ADA‘s nearly 56% drop from its August highs found a low near A$2.38 in September before closing over a short-term high around A$2.94.

This daily close over the high could signal a shift in market structure that might reach probable resistance near A$3.14. A sustained bullish move may target the swing high at A$3.25. If this stop run occurs, a run beyond the high into probable resistance near A$3.29 and A$3.36 is possible.

Bulls could buy a retracement to possible support near A$2.73, just above the monthly open. A bearish turn in the marketplace may propel the price toward possible support near A$2.68. 

However, relatively equal lows near A$2.65 and A$2.60 provide an attractive target for bears if the market resumes its bearish trend. A run on these lows might find support between A$2.57 and A$2.52.

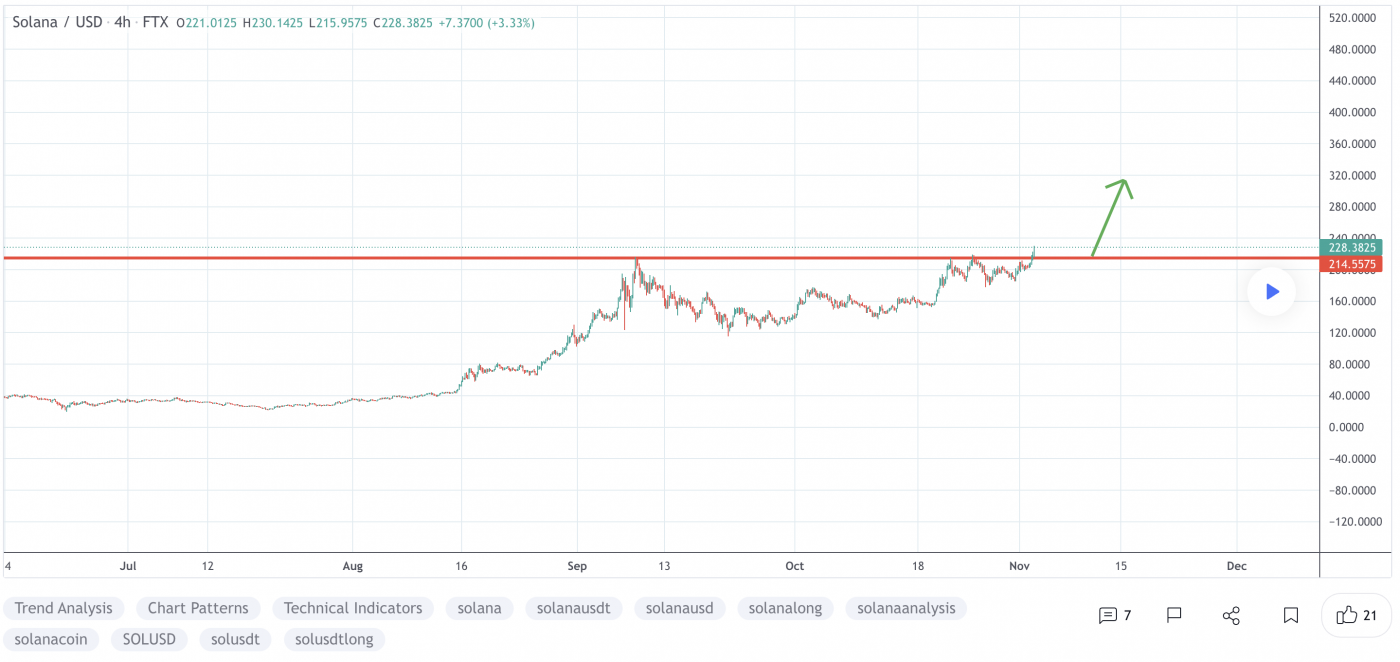
1. Solana (SOL)

Solana SOL is a highly functional open-source project that banks on blockchain technology’s permissionless nature to provide decentralised finance (DeFi) solutions. The Solana protocol is designed to facilitate decentralised app (DApp) creation. It aims to improve scalability by introducing a proof-of-history (PoH) consensus combined with the underlying proof-of-stake (PoS) consensus of the blockchain.

SOL Price Analysis

At the time of writing, SOL is ranked the 6th cryptocurrency globally and the current price is A$301.55. Let’s take a look at the chart below for price analysis:

Source: TradingView

SOL retraced nearly 65% from its high before finding a low in late September. Since then, the price has been sweeping stops on both sides of its local range as the current consolidation sets up the next move.

Aggressive bulls might bid near A$276, although a sweep of the stops near A$270 could reach below the next swing low into possible support near A$262. A continued downtrend might run into the weekly gap near A$245.

Some bears might add more shorts near A$290, although a push to A$315 is reasonable. A daily candle close over the swing high near A$339 could suggest that a longer-term trend reversal may be in play, with bulls possibly entering on a retracement near A$354.

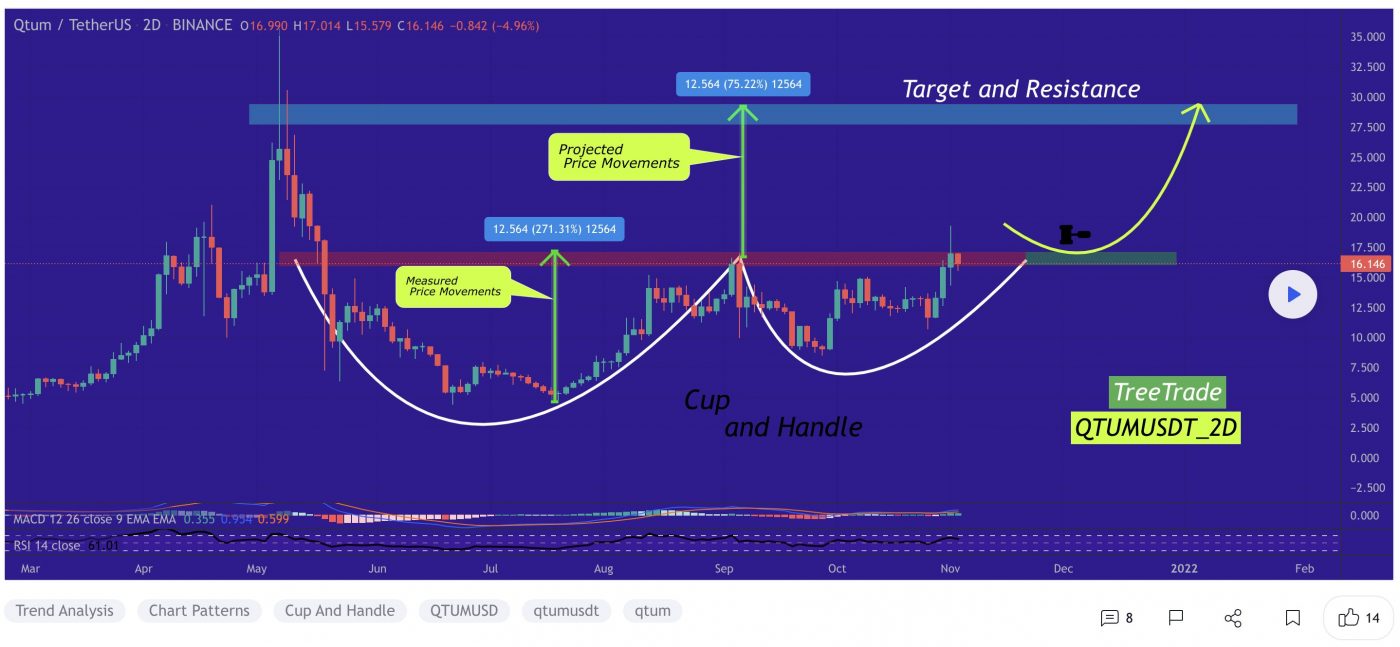
3. Quantum (QTUM)

Quantum QTUM is a proof-of-stake (PoS) smart contract open-source blockchain platform and value transfer protocol. It aims to bring together the strengths of Bitcoin and Ethereum in one chain. QTUM is built on Bitcoin’s UTXO transaction model, with the added functionality of smart contract execution and DApps. Recently, the platform added support for DeFi applications.

QTUM Price Analysis

At the time of writing, QTUM is ranked the 80th cryptocurrency globally and the current price is A$21.33. Let’s take a look at the chart below for price analysis:

Source: TradingView

After dropping almost 85% from its highs, QTUM has been consolidating in a range for the second half of Q3.

The recent sweep of the lows near A$16.45 could set the stage for at least a short rally higher, with bulls possibly buying near A$19.22 for a move toward the relatively equal highs near $24.68. A close over these highs might hint at a longer-term move toward probable resistance near A$28.30, likely following a retracement.

Rejection from possible resistance near A$23.12, potentially including a sweep of the highs around A$22.96, could signal a run to the swing low near A$18.35. If this move occurs, bears might target the swing low and support near A$17.44 and A$16.89.

Where to Buy or Trade Altcoins?

These coins have high liquidity on Binance Exchange, so that could help with trading on AUD/USDT/BTC pairs. And if you’re looking at buying and HODLing cryptos, then Swyftx Exchange is an easy-to-use popular choice in Australia.

Categories
Binance Coin Crypto News Market Analysis Trading

Top 3 Coins To Watch Today: BNB, EGLD, FLOW – November 3 Trading Analysis

Let’s take a closer look at today’s altcoins showing breakout signals. We’ll explain what the coin is, then dive into the trading charts and provide some analysis to help you decide.

1. Binance Coin (BNB)

Binance BNB is the biggest cryptocurrency exchange globally, based on daily trading volume. Binance aims to bring cryptocurrency exchanges to the forefront of world financial activity. Aside from being the largest cryptocurrency exchange, Binance has launched a whole ecosystem of functionalities for its users. The Binance network includes the Binance Chain, Binance Smart Chain, Binance Academy, Trust Wallet, and Research projects, which all employ the powers of blockchain technology to bring new-age finance to the world. Binance Coin is an integral part of the successful functioning of many of the Binance sub-projects.

BNB Price Analysis

At the time of writing, BNB is ranked the 3rd cryptocurrency globally and the current price is A$756.11. Let’s take a look at the chart below for price analysis:

Source: TradingView

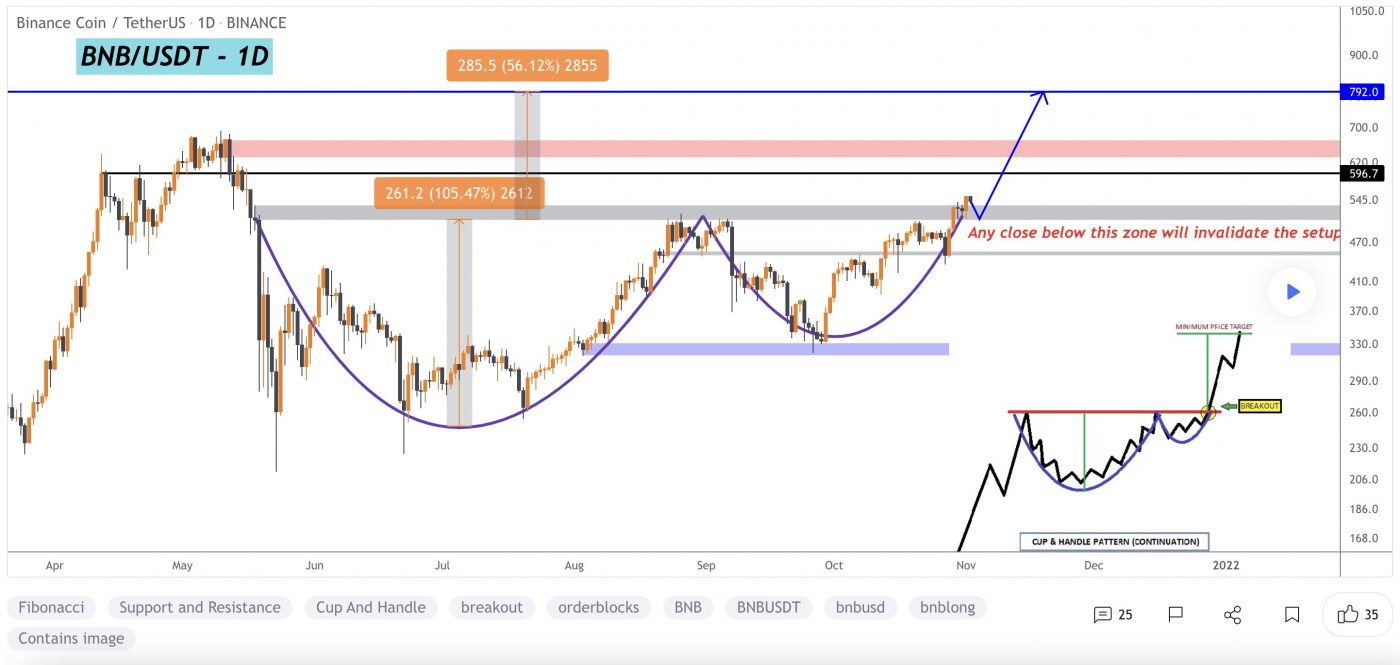
After a 61% decline from August to September, BNB has ranged between A$668 and A$495.

The recent rally is approaching probable resistance near A$795 – but could be aiming for stops above the relatively equal highs near A$848. Continuation of the bullish move could target the daily gap near A$904.

Aggressive bulls might add to positions near A$735 and A$718. Price action near A$709 may be more likely to provide support – if it gets there – during any retracements.

Relatively equal lows clustered around A$697 seem likely to be swept if the bearish trend resumes. If this move occurs, the price might find support at the significant higher-timeframe level near A$680.

2. Elrond (EGLD)

Elrond EGLD is a blockchain protocol that seeks to offer extremely fast transaction speeds by using sharding. The project describes itself as a technology ecosystem for the new internet, which includes fintech, decentralised finance, and the Internet of Things. Its smart contracts execution platform is reportedly capable of 15,000 transactions per second, six-second latency, and a $0.001 transaction cost. The blockchain has a native token known as eGold, or EGLD, that is used for paying network fees, staking, and rewarding validators.

EGLD Price Analysis

At the time of writing, EGLD is ranked the 40th cryptocurrency globally and the current price is A$365.17. Let’s take a look at the chart below for price analysis:

Source: TradingView

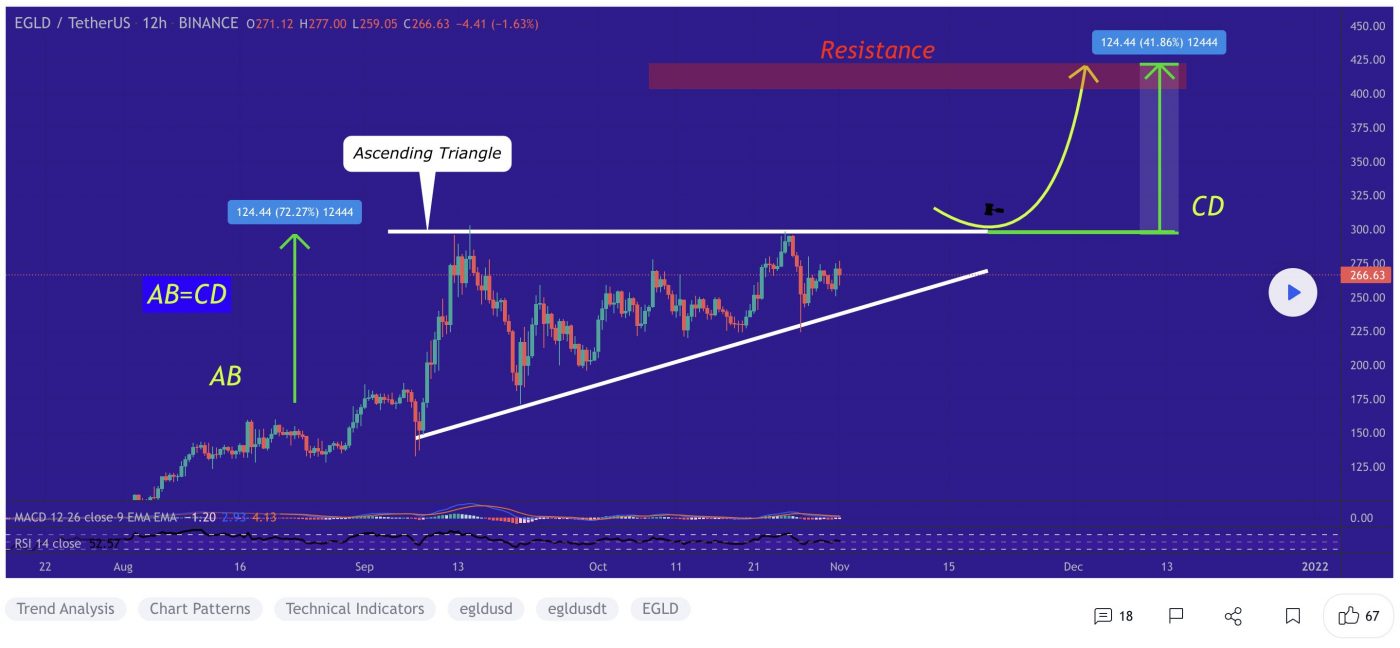
EGLD‘s 45% retracement from its September highs set a low near A$309 during its consolidation that began in mid-October.

Relatively equal highs near A$369 could be the current target if the price breaks through resistance beginning near A$376. Bullish continuation might reach through the next significant swing high near A$387 into the daily gap near A$398.

If bullish strength continues, the zones just below the monthly open near A$405 and A$415 could halt any retracement. 

A bearish shift in the market might seek the relatively equal lows near A$361 into possible support near A$357. If this down move occurs, the swing low near A$350 and possible support near A$342 may be the primary objective.

3. Flow (FLOW)

FLOW is a fast, decentralised and developer-friendly blockchain, designed as the foundation for a new generation of games, apps, and the digital assets that power them. Flow is the only layer-one blockchain originally created by a team that has consistently delivered great consumer blockchain experiences: CryptoKitties, Dapper Wallet, NBA Top Shot. The FLOW token (“FLOW”) is the native currency for the Flow network and the keystone for a new, inclusive and borderless digital economy.

FLOW Price Analysis

At the time of writing, FLOW is ranked the 46th cryptocurrency globally and the current price is A$19.37. Let’s take a look at the chart below for price analysis:

Source: TradingView

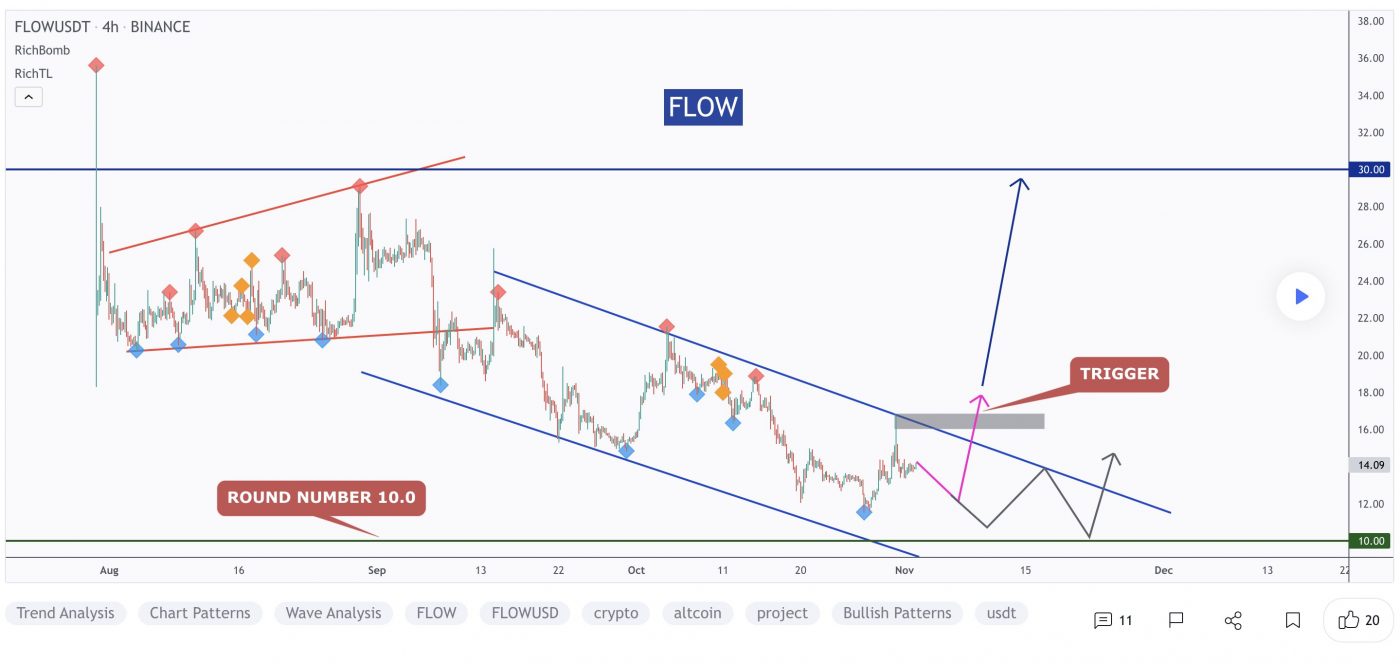
After retracing nearly 80% from its August high, FLOW set a low near A$16.43 as it formed its current range.

Last week, the price swept highs near A$20.72, which now also marks the November monthly open. Relatively equal daily highs near A$22.36 provide a reasonable target, although resistance beginning near A$23.09 could cap the move. A break of this resistance is likely to target the swing high near A$25.81 into higher-timeframe resistance beginning near A$27.19.

The current area near A$18.50 could provide support, although bulls may be more likely to buy near the price fractal near A$17.42 if a retracement reaches this level. A break of this area could continue down to sweep the June low near A$14.95 into possible support beginning near A$13.09.

Where to Buy or Trade Altcoins?

These coins have high liquidity on Binance Exchange, so that could help with trading on AUD/USDT/BTC pairs. And if you’re looking at buying and HODLing cryptos, then Swyftx Exchange is an easy-to-use popular choice in Australia.

Categories
Crypto News ICON Market Analysis Trading

Top 3 Coins To Watch Today: COTI, ICX, SCRT – November 2 Trading Analysis

Let’s take a closer look at today’s altcoins showing breakout signals. We’ll explain what the coin is, then dive into the trading charts and provide some analysis to help you decide.

1. Coti (COTI)

COTI markets itself as the first enterprise-grade fintech platform that empowers organisations to build their own payment solutions as well as digitise any currency to save time as well as money. COTI is one of the world’s first blockchain protocols that is optimised for decentralised payments and designed for use by merchants, governments, payment DApps, and stablecoin issuers. The ecosystem has a DAG-based blockchain, proof-of-trust consensus algorithm, multiDAG, GTS (Global Trust System), a universal payment solution, and a payment gateway.

COTI Price Analysis

At the time of writing, COTI is ranked the 140th cryptocurrency globally and the current price is A$0.8359. Let’s take a look at the chart below for price analysis:

Source: TradingView

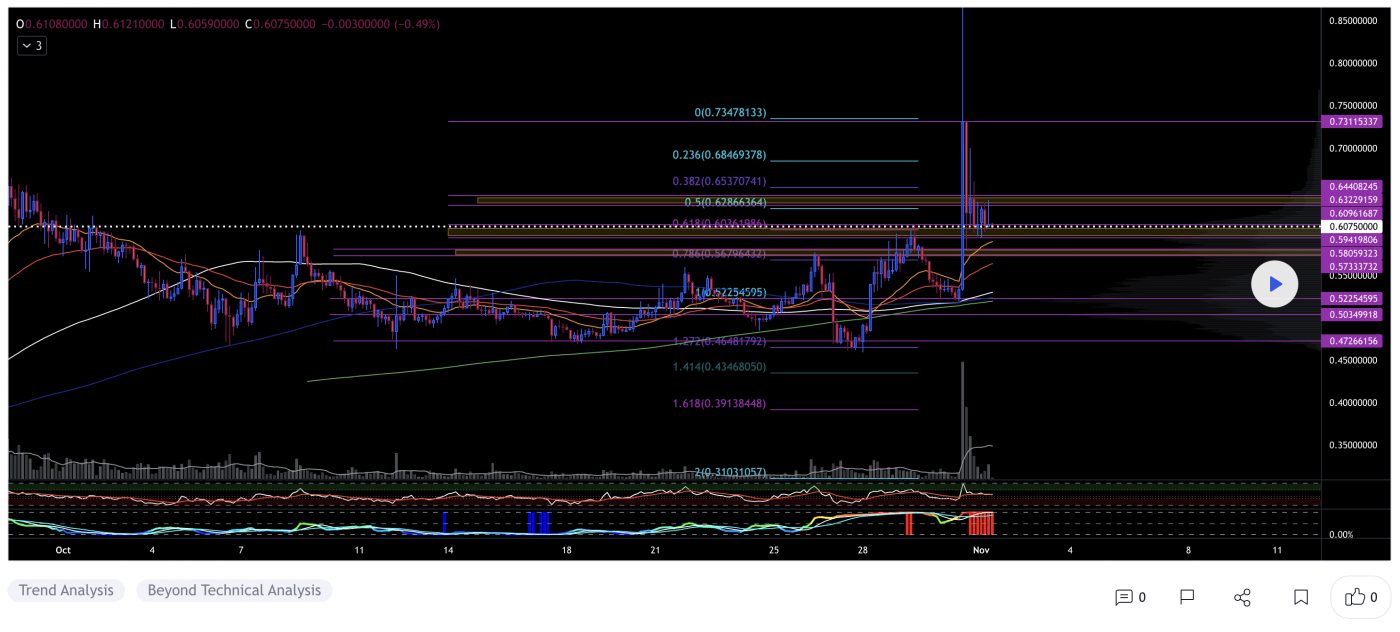
COTI‘s 189% rally from its September lows spiked through March’s high before going into a minor retracement and consolidation.

Last week’s rapid climb before Tuesday’s mainnet release could be setting up a “sell the news” scenario. However, the price is on possible support beginning near A$0.7955, which has confluence with the 9 EMA.

If this level holds, bulls may be ready to push COTI to its next target. Possible support around the current range low, near A$0.7232, and the 40 EMA might see a stronger reaction from bulls and provide a better risk-to-reward entry.

A sharper downturn in the market – perhaps from a steep BTC retrace – could reach near the 61.8% retracement of September’s move. This area had a strong reaction on October 27. A level near the 79% retracement, around A$0.5085, could also provide support. However, if the price reaches this far, it might signal a longer-term bearish shift.

Final targets are impossible to predict, but extensions from 2021’s significant move and the current leg suggest bulls might take profits near A$1.08, A$1.20, and A$1.58.

2. ICON (ICX)

ICON is a decentralised blockchain network focused on interoperability. With ICON’s “blockchain transmission protocol”, independent blockchains like Bitcoin and Ethereum can connect and transact with each other. This opens up cross-chain use cases that are impossible without an interoperability layer like ICON. The ICON blockchain is powered by loopchain, a blockchain engine designed by ICONLOOP.

ICX Price Analysis

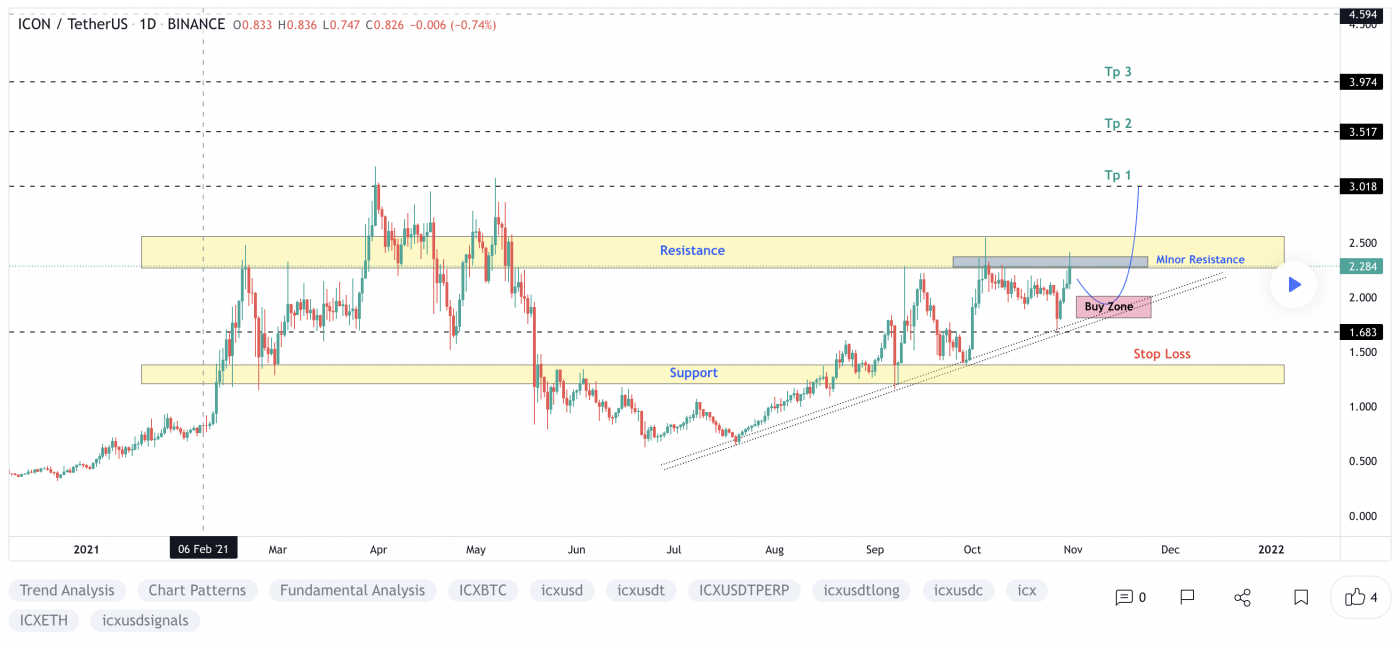
At the time of writing, ICX is ranked the 80th cryptocurrency globally and the current price is A$3.04. Let’s take a look at the chart below for price analysis:

Source: TradingView

ICX‘s 300% climb from its June low has continued grinding upward at a steady pace.

At the current price, near the local range’s high, A$3.05 could support a move toward all-time highs. If the price dips, an area near the range low and 9, 18, and 40 EMAs could provide a better risk-to-reward entry for bulls. The Mainnet 2.0 Launch on Thursday could be the catalyst by causing some investors to take profits, prompting a retracement.

Like COTI, a more significant bearish shift in BTC could send the price down to a larger range’s lows near A$2.34 and possibly as far as A$2.07. This area saw a strong reaction in October 27’s retracement.

Bulls will likely take some profits near the highs at A$3.98, but the price could continue well beyond the highs. The final target is impossible to predict, but extensions from early 2021’s significant move and the current range suggest that bulls might take more profits near A$5.31 and A$5.98.

3. Secret (SCRT)

Secret SCRT is the native coin of the Secret Network, a decentralised network for private/secure computation. Nodes on the network (known as secret nodes) can perform generalisable computations over encrypted data, which allows smart contracts (known as secret contracts) to use private and sensitive data as inputs. Our focus is on computational privacy, not just transactional privacy. Developers can build decentralised, privacy-preserving “Secret Apps” on the network. The privacy functionality of the Secret Network is critical for many fields, including decentralised finance, Web3, machine learning, access control, and many more.

SCRT Price Analysis

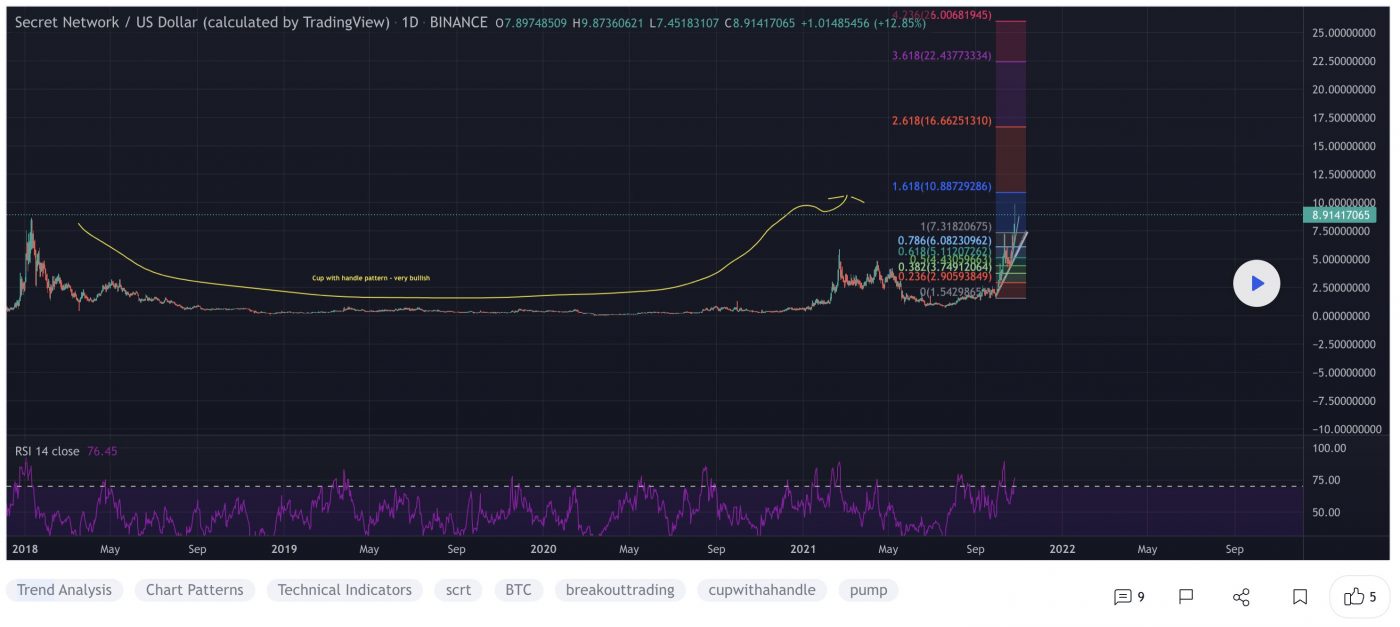
At the time of writing, SCR is ranked the 86th cryptocurrency globally and the current price is A$12.05. Let’s take a look at the chart below for price analysis:

Source: TradingView

SCRT‘s stunning 1,344% move from its July low could have more room to run. However, the price is distancing itself from quality higher-timeframe support.

Near the current price, A$12.03 could give resistance before any next leg up as bulls bid near the 9 EMA. However, the consolidation under the last swing high near A$9.29 and the 61.8% retracement is a better candidate for robust support. The Shade Protocol snapshots, which start this Sunday, could help support the price hold this range by encouraging investors not to sell.

Closer to the 78.6% retracement, just under the 40 EMA, and near the last impulse’s range low, A$7.80 could provide more substantial support for another significant swing.

Price is currently finding resistance near an extension from 2018’s bull run. If the bulls flip this level, extensions on 2021’s move suggest that they might take their next profits near A$15.67 and A$17.27.

Where to Buy or Trade Altcoins?

These 3 Altcoins have the highest liquidity on Binance Exchange so that would help for trading on USDT or BTC pairs. However, if you’re just looking at buying some quick and HODLing, then Swyftx Exchange is a popular choice in Australia.

Categories
Bitcoin Crypto News Market Analysis The Crypto Den Trading

TradeRoom: Our Weekly Crypto Trades & Analysis – Nov 1st, 2021

Welcome to this weekly series from the TradeRoom. My name is Dave and I’m the founder of The Crypto Den, an Australian-based crypto trading and education community aiming to give you the knowledge to take your trading game to the next level.

In this article:

  1. Crypto Market Outlook
  2. Last Week’s Performance
  3. This Week’s Trades

Crypto Market Outlook

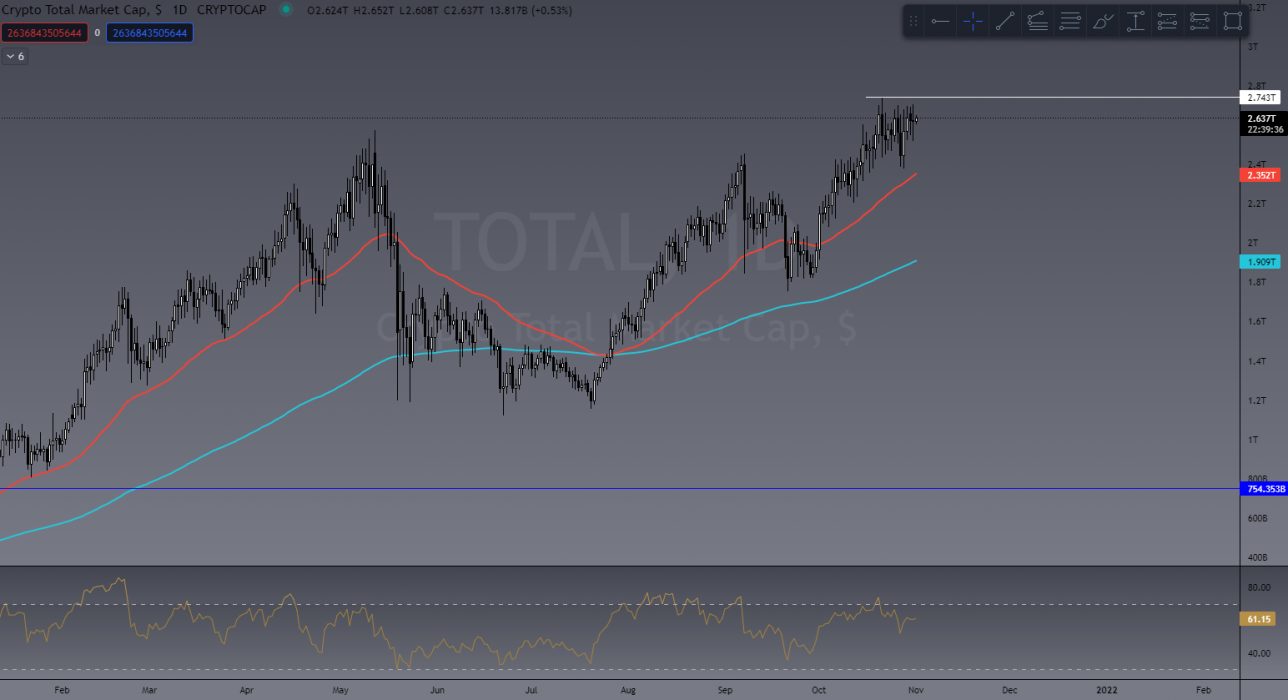
Despite BTC dropping 14% from its new all time high (ATH) last week the entire Crypto Market Cap (TOTAL) still looks very healthy sitting at US$2.64 Trillion area. Which is only a 4% drop since the new ATH of the market cap.

Total Crypto Market Cap

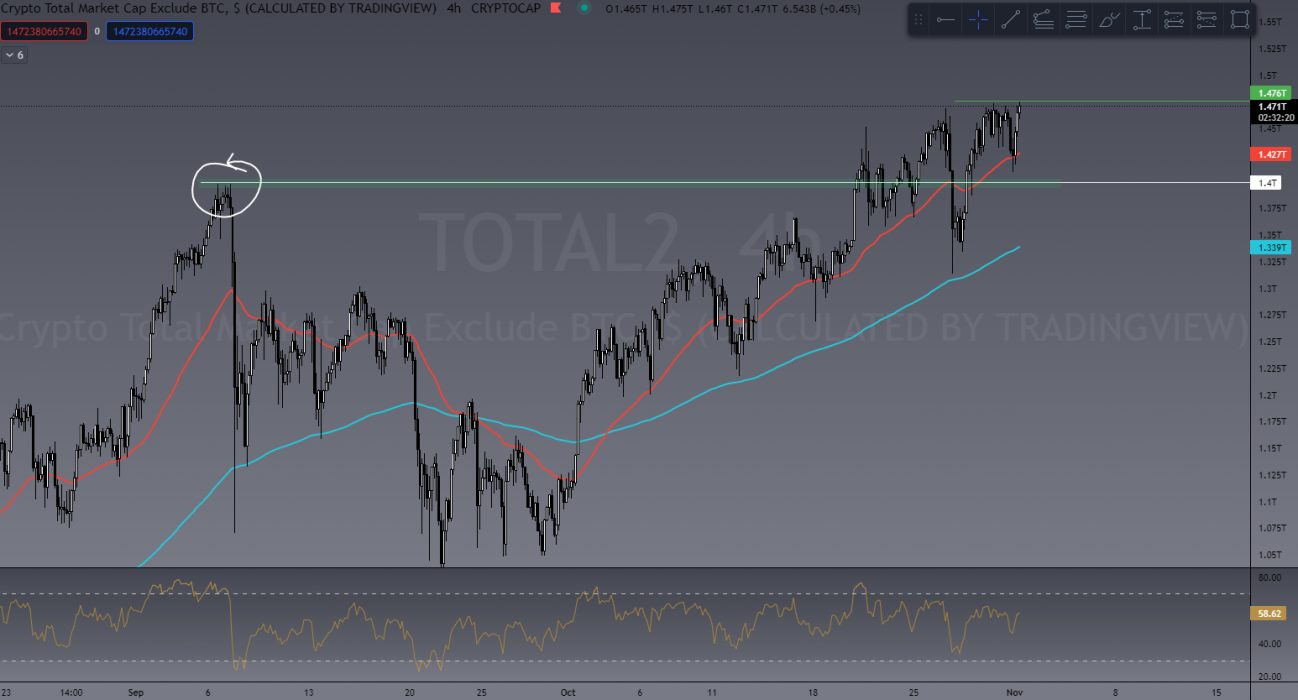
What we find really encouraging is the current position of the ALT coin market (TOTAL2) which has a total value of US$1.47 Trillion. Reaching new highs yet again this is extremely bullish, not just for ALTS, but show for BTC as well as its showing strong confidence in the overall market. Bitcoin Dominance (BTC.D) dropped with BTC recently and ALTS only seen rather minor reactions to this drop.

Total Crypto Market Cap EXCLUDING BTC

Even the total crypto cap excluding both BTC and ETH (TOTAL3) has reached new highs this week topping out at US$963 Billion. Which tells us that a lot of capital is confidently flowing into ALTS across the board and not just to the Crypto #2 Ethereum.

Now lets take a good look at Bitcoin.

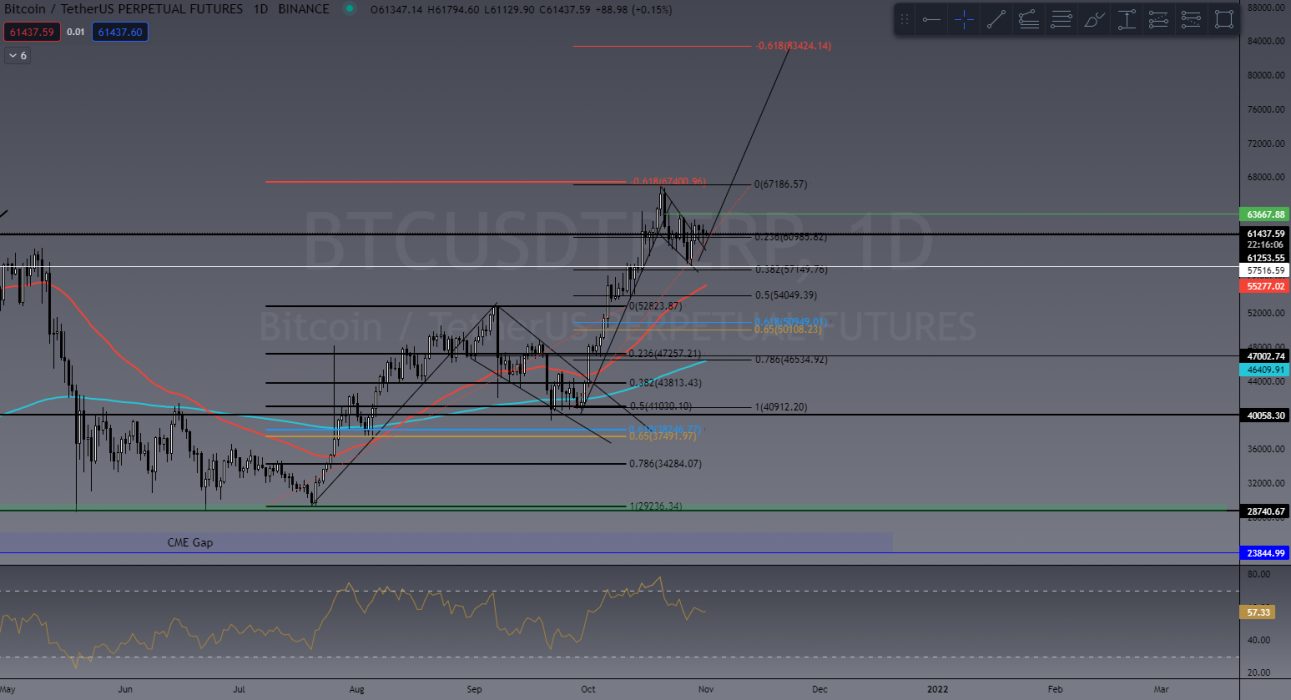
BTC pulled back to find daily support at US$57,500 after reaching a new ATH at US$67,000. We thought we would see a much stronger initial push high from BTC after achieving a new high however a pullback like this is NOT unhealthy. In fact quite the opposite.

Possible bullflag for BTC

BTC could simply be painting a daily bullflag! This is a bullish trend continuation pattern which shows a price projection (length of the flag pole) lining up perfectly to a future 618 Fibonacci level. We teach you all about chart patterns and Fibonacci in our Trading Course if you’d like to learn more on this!

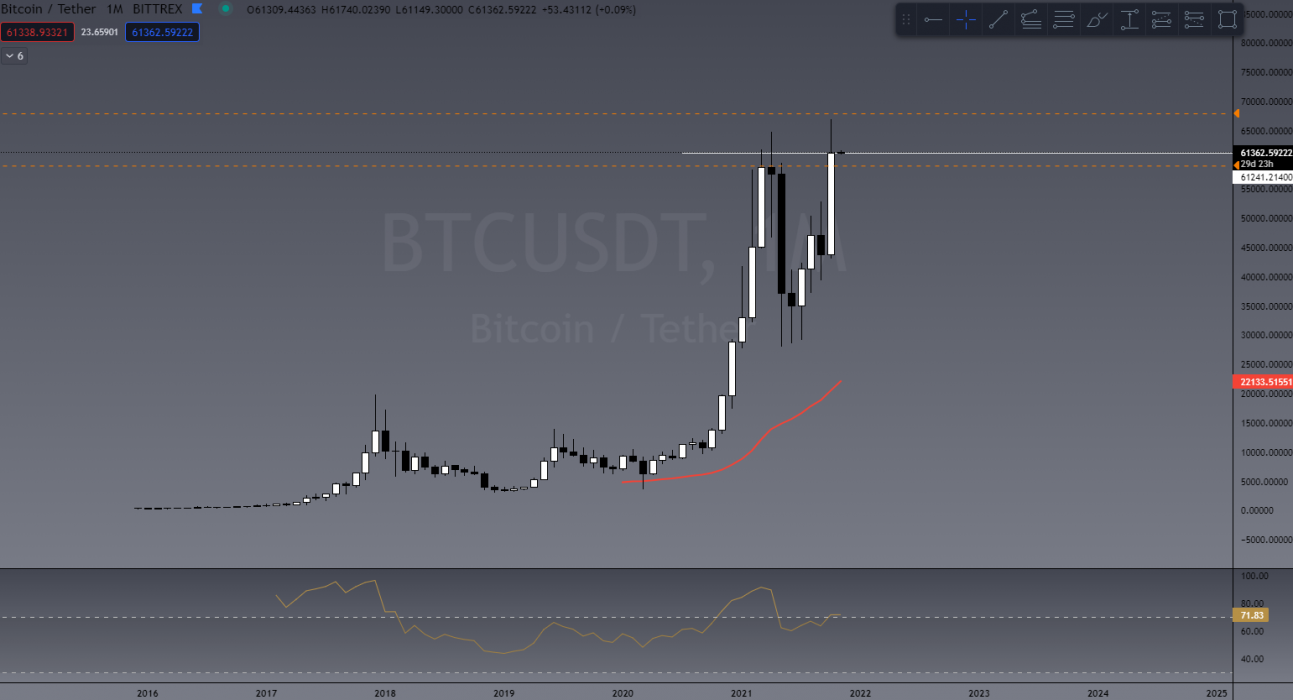
If we take a look at BTC on a monthly chart you’ll see its just had its highest monthly close ever! Another very bullish sign.

BTC highest ever monthly close

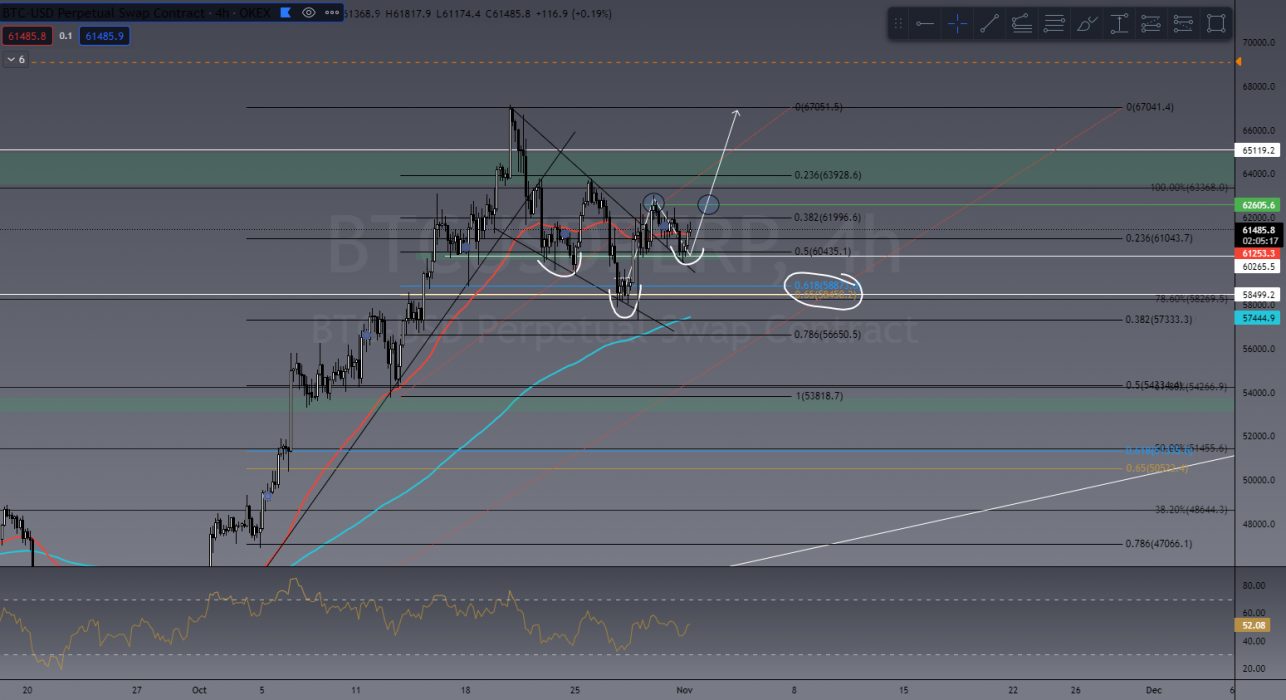
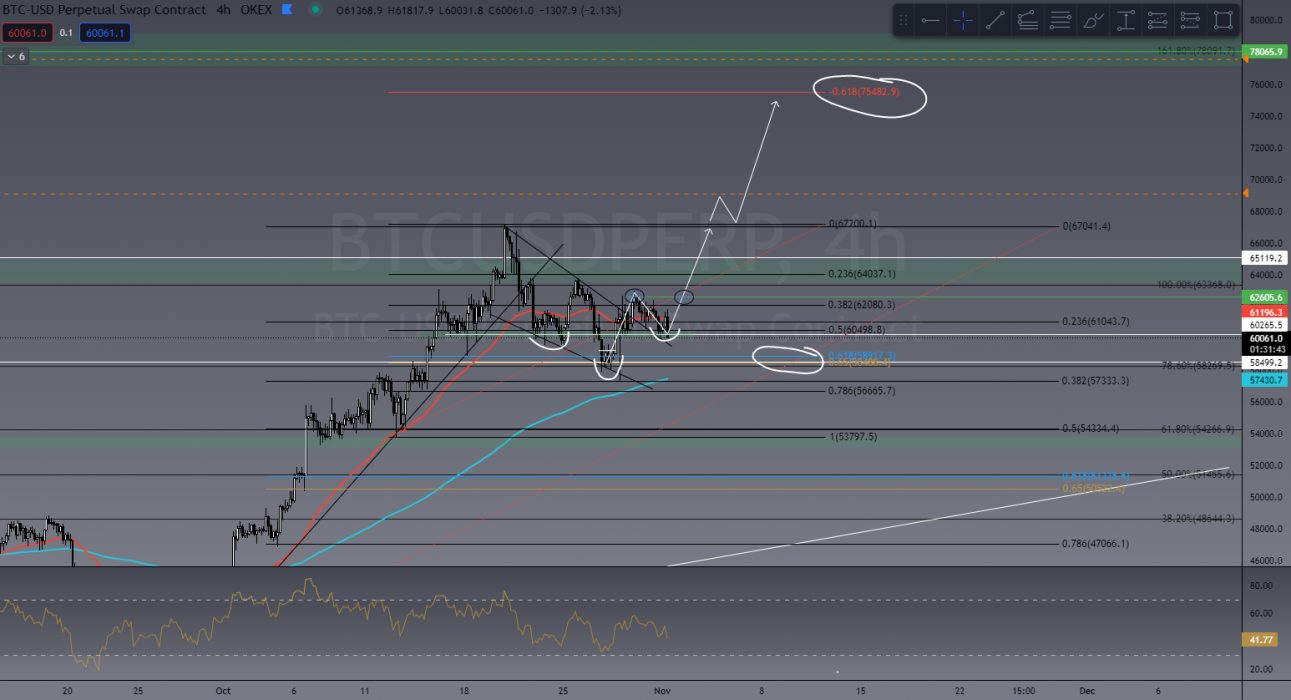
So what are we looking for in the TradeRoom next? Based on a 4 hour chart it shows BTC breaking out of the bull flag and retesting a level of both horizontal support and the local down trend. This restest forms a higher low (HL) which leads some pattern traders to see an inverse head and shoulders pattern (iH&S) which is a common reversal pattern preceding a recent trend down. The “head” also reached the common Fib retrace level of 61.8%. We are waiting to see a confirmation of this by breaking above US$62,605 (green line/circles). Once this is confirmed I see BTC approaching the new ATH with bullish strength behind it!

Overall market sentiment is high. The general consensus is that we will see the entire market make another move up. Be sure to mitigate any risk by ensuring stop losses are in place!

BTC breaking out and retesting bullflag

Last Week’s Performance

SOL/USDT

In my last article I touched on SOL being one of the key coins to watch. Even with BTC dropping that 14% I’m so impressed with how well SOL has held its own. Making a higher high (HH) on daily chart we still expect to see SOL reach new highs at around US$250

SOL/USDT

ETH/USD

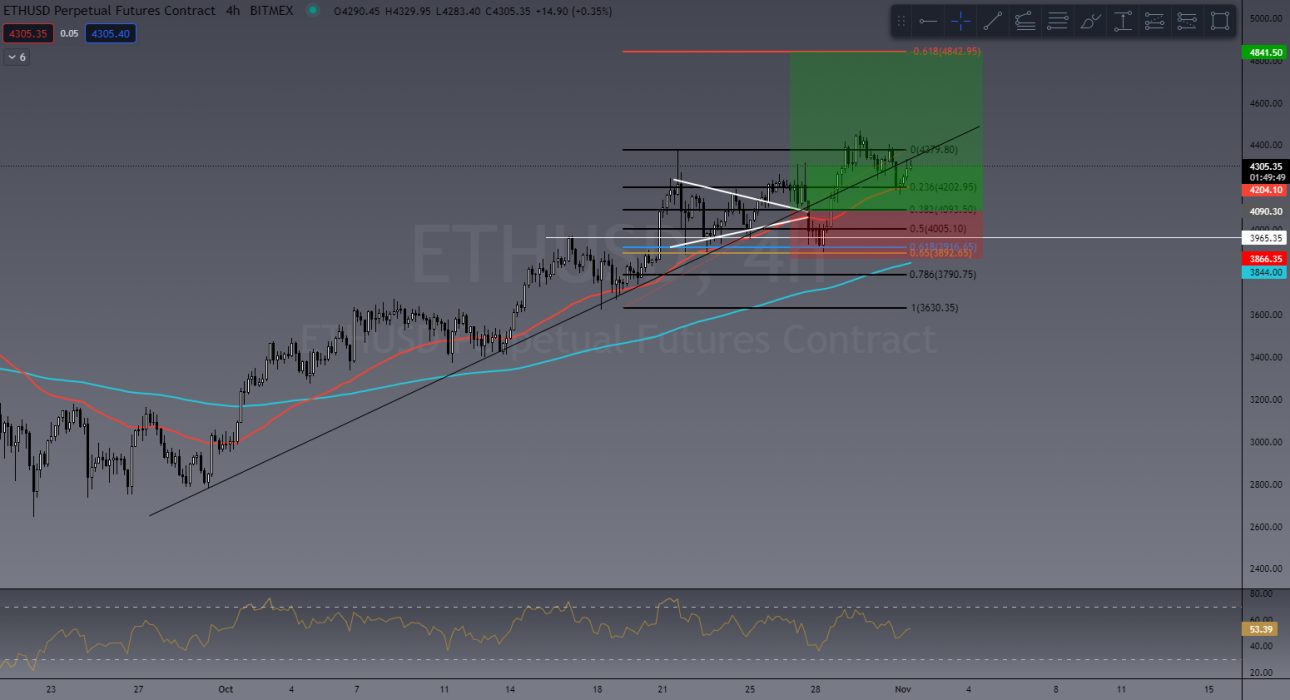
We also looked at ETH for a long position. As you can see in the chart below this trade was ALMOST stopped out when BTC pulled back however it wasn’t hit and we are still in the trade. Again, I’m expecting to see ETH hit close to US$5,000 soon!

ETH/USD

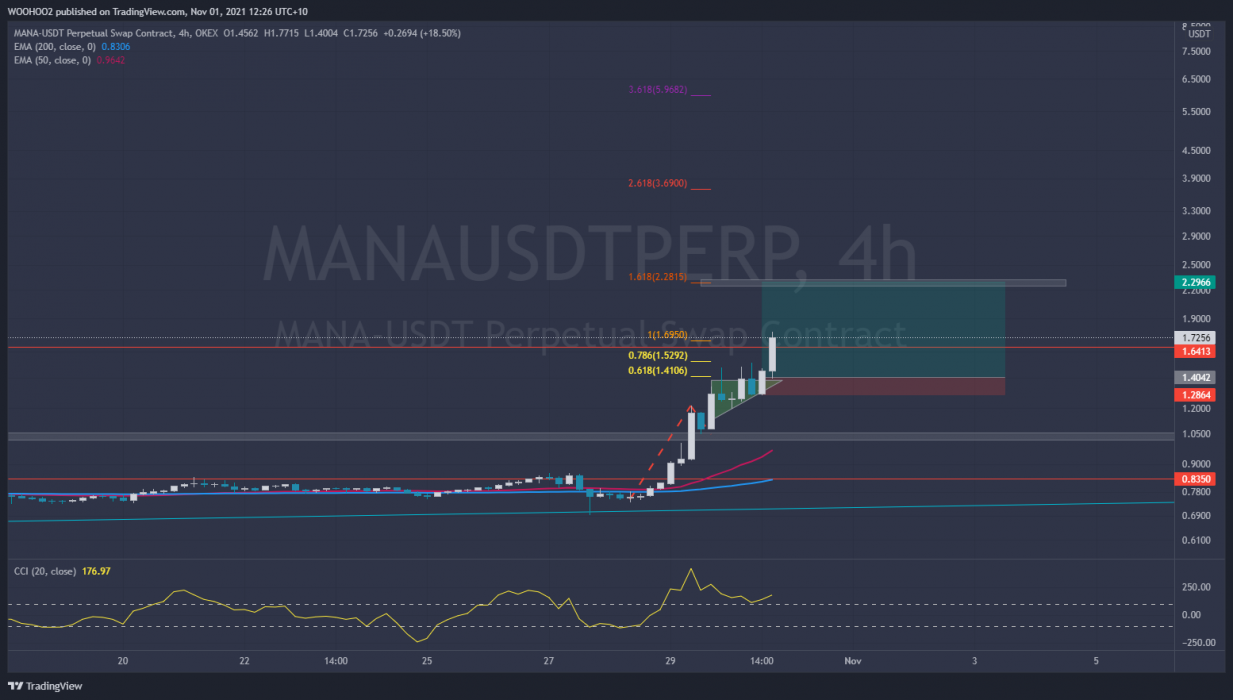
MANA/USDT

This trade was by one our our TradeRoom members and former students! Using Fibonacci as a project tool this trade played out better than expected!

MANA/USDT
MANA/USDT

‘Dazzling’ as he’s known in the TradeRoom spotted this ascending triangle pattern (another bullish continuation pattern). After entering MANA did a massive 240% move. Daz entered into a leveraged trade yielding him over 1000% which is amazing! I’m sure everyone reading this from the TradeRoom can agree Daz is a TCD legend and always extremely helpful and supportive within the community! Nice work Daz!

NOTE: Daz has been trained to trade with leverage. Leverage trading should NOT be done by beginners. If you’d like to learn our Trading Fundamentals LIVE course starts in 2 weeks!


This Week’s Trades

BTC/USD

Lets look at BTC first. Can it follow the potential path addressed above and breaks the ATH at US$67,000 we will likely see US$75,000 – US$78,000 as a first target.

BTC/USD

ALGO/USDT

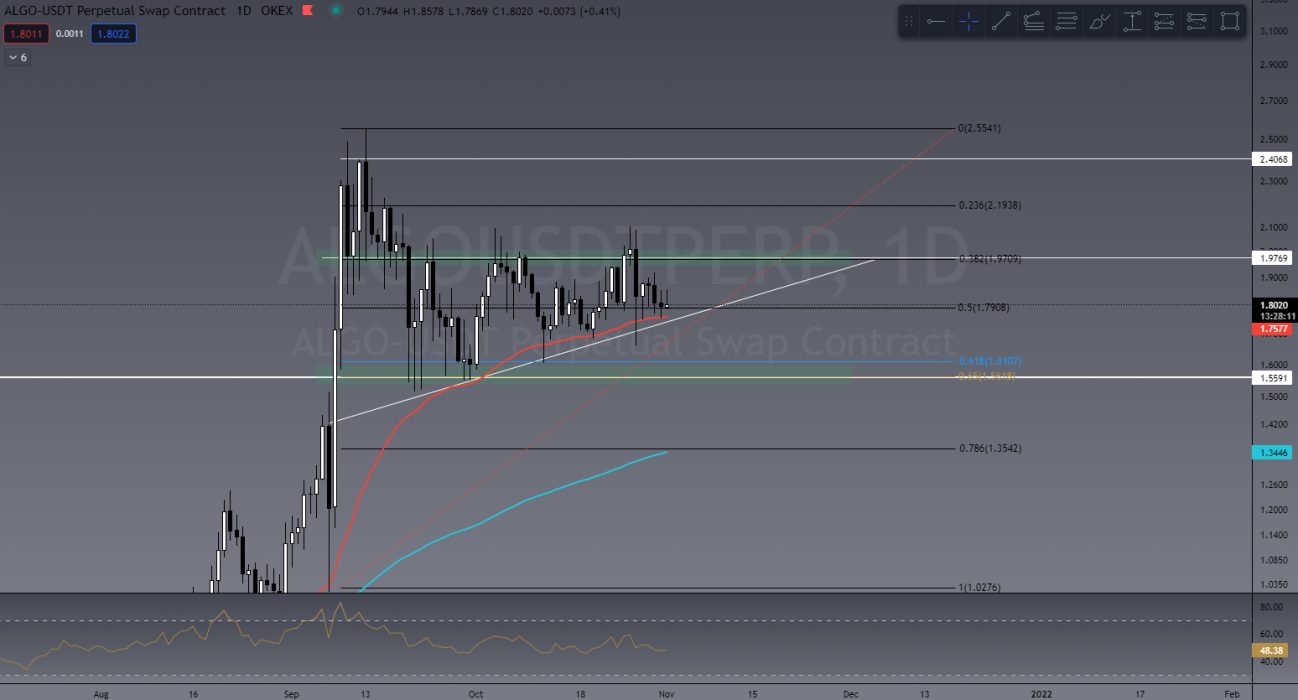
An ALT showing some signs of strength amid the BTC pullback and one of the fan favourites in TradeRoom is ALGO.
Showing some daily Higher Lows (HL) with equal highs ALGO is one to watch this next week or so.

ALGO/USDT

AXS/USDT

AXS is one we touched on in our market scan last Thursday as its be painting a daily symmetrical triangle. Again this shows good strength against BTC. AXS has since broken out and already achieved a 34% increase. Currently pulling back to test support and could present opportunity for a new entry.

Thursday TradeRoom Market scan
ALGO/USDT breaking out and retesting

Its important to remember that when trading ALT coins, their price action is heavily dependent on BTC. If BTC takes a bullish path ALTS will likely follow. If BTC turns bearish then ALTS will likely dump in price even harder!

If you would like to become a better trader, you are invited to join our TradeRoom where we share daily charts and market analysis. In our community we strongly encourage and teach correct risk management strategies to keep our members safe in this new volatile crypto market.

>> Take our Free Beginners’ Trading Course

>> Join our Trading Community for your 7 day free trial


The Crypto Den was created in 2017 to help the rapidly growing crypto community learn and understand the fundamentals of digital currencies and how to trade them. 

Since then we have taught thousands of members the basics of technical analysis and trading strategies to further progress and perfect their trading abilities.

In the TradeRoom you will be included in a supportive environment which encourages personal growth, education and community support.

It’s a place to share your trading ideas and follow other experienced traders’ feeds to help keep your finger on the pulse of such a volatile market!

Categories
Crypto News Market Analysis Trading

Top 3 Coins To Watch Today: CAKE, ANKR, AKRO – November 1 Trading Analysis

Let’s take a closer look at today’s altcoins showing breakout signals. We’ll explain what the coin is, then dive into the trading charts and provide some analysis to help you decide.

1. PancakeSwap (CAKE)

PancakeSwap CAKE is an automated market maker (AMM) – a decentralised finance (DeFi) application that allows users to exchange tokens, providing liquidity via farming and earning fees in return. PancakeSwap uses an automated market maker model where users trade against a liquidity pool. These pools are filled by users who deposit their funds into the pool and receive liquidity provider (LP) tokens in return. PancakeSwap allows users to trade BEP20 tokens, provide liquidity to the exchange and earn fees, stake LP tokens to earn CAKE, stake CAKE to earn more CAKE, and stake CAKE to earn tokens of other projects.

CAKE Price Analysis

At the time of writing, CAKE is ranked the 45th cryptocurrency globally and the current price is A$23.06. Let’s take a look at the chart below for price analysis:

Source: TradingView

CAKE‘s 71% decline during May created relatively equal lows near A$23.56 before bouncing over the local range’s midpoint near A$34.60. A bullish altcoin market could help CAKE bulls regain a stronger bullish trend.

Aggressive bulls could look for entries in the daily gap starting near A$20.77. The monthly open aligns with more probable support near A$19.84. 

A stop run below the monthly open near A$18.62 might provide a more favourable entry. A more substantial bearish move – perhaps from a sharp drop in Bitcoin’s price – could challenge support near A$16.30, just above the equal lows.

Resistance rests just above, with the zone from A$27.59 to A$31.26 likely to provide a short-term ceiling. A break through this level might target resistance just under the cluster of relatively equal highs near A$33.47. 

Beyond these highs, resistance near A$38.15 provides a final challenge before attacking an old daily swing high near A$40.86.

2. Ankr (ANKR)

ANKR originates as a solution that utilises shared resources in order to provide easy and affordable blockchain node hosting solutions. Founded in November 2017, it has since built a marketplace for container-based cloud services through the usage of shared resources. It is a platform that enables the sharing economy, where any customer can access resources at a more affordable rate, while also providing enterprises with the ability to monetise their spare computing power that is not being utilised. It is unique in the way that it is the first to use trusted hardware, and this ensures a high level of security.

ANKR Price Analysis

At the time of writing, ANKR is ranked the 104th cryptocurrency globally and the current price is A$0.1706. Let’s take a look at the chart below for price analysis:

Source: TradingView

ANKR continues to set new monthly highs in its chaotic upwards trend.

Support might be found in the daily gap above the October monthly open near A$0.1395. A deeper retracement is likely to target the relatively equal lows into support near A$0.1254. 

The daily gap near A$0.1586 could also provide support. However, another gap inside the down candles, around A$0.1424, provides the highest chances of solid support while offering a high risk-reward entry.

There is currently no resistance overhead since the price is in discovery. Extensions hint at the areas around A$0.2166 and A$0.2463 as reasonable take-profit zones.

3. Akropolis (AKRO)

Akropolis AKRO is a company that operates an Ethereum-based decentralised finance protocol that seeks to provide an autonomous financial ecosystem for saving and growing wealth, including through borrowing and lending. To do so, it offers a series of products including AkropolisOS, a framework for developing for-profit decentralised autonomous organisations; Sparta, a platform for uncollateralised lending; and Delphi, a yield farming aggregator and tool for dollar-cost averaging. The project uses an ERC-20 token, AKRO, for protocol governance across its suite of products.

AKRO Price Analysis

At the time of writing, AKRO is ranked the 387th cryptocurrency globally and the current price is A$0.04938. Let’s take a look at the chart below for price analysis:

Source: TradingView

AKRO holders endured a wild October as the price rallied over 85% before running the month’s lows. This stop run could set the stage for another rally. However, the recent volatility means bulls should be extra cautious with stop placement. 

Bulls might find support around the current price near A$0.04355. The next high probability support rests near A$0.03912, below the last two swing lows. A move this deep could sweep monthly lows into an area near A$0.03577.

The price is currently struggling with resistance near A$0.05134 at the previous monthly open. A strong move into this resistance is likely to target the swing high near A$0.05421. 

Above this swing high, a monthly high at A$0.05986 is the next likely target, which also marks another wide resistance zone. Volatility inside this resistance could tag a new monthly high at A$0.06532.

Where to Buy or Trade Altcoins?

These coins have high liquidity on Binance Exchange, so that could help with trading on AUD/USDT/BTC pairs. And if you’re looking at buying and HODLing cryptos, then Swyftx Exchange is an easy-to-use popular choice in Australia.

Categories
Crypto News Market Analysis Trading

MANA Surges +80% in a Single Day amid HashKey to Open First Virtual Headquarter in Decentraland

MANA is trading in an uptrend, like many other Altcoins. The cryptocurrency MANA just went up +80% in a single day by breaking a bullish pennant pattern with strong buying volume on multiple exchanges and surges over +135% in a week.

What is Decentraland?

Decentraland MANA defines itself as a virtual reality platform powered by the Ethereum blockchain that allows users to create, experience, and monetize content and applications. Decentraland uses two tokens: MANA and LAND. MANA is an ERC-20 token that must be burned to acquire non-fungible ERC-721 LAND tokens. MANA tokens can also be used to pay for a range of avatars, wearables, names, and more on the Decentraland marketplace.

MANA Price Analysis

At the time of writing, MANA is ranked the 60th cryptocurrency globally and the current price is A$1.72. Let’s take a look at the chart below for price analysis:

Source: TradingView

After looking at the above 1-Day candle chart, we can clearly see that MANA was trading inside the bullish pennant pattern on the MANA/USDT pair. The first resistance was on the A$1.23 price level, which MANA broke with a strong bullish trend buying volume and is now heading towards the recent high price at A$1.98. Seeing that many Altcoins are holding a strong position this week after the recent bitcoin price breakout, MANA may continue to increase in the uptrend if traders keep buying with high volume.

“A bullish pennant is a technical trading pattern that indicates the impending continuation of a strong upward price move. They’re formed when a market makes an extensive move higher, then pauses and consolidates between converging support and resistance lines.”

What Do the Technical Indicators Say?

The MANA TradingView indicators (on the 1-day) mainly indicate MANA as a Strong Buy, except the Oscillators which indicate MANA as a Buy.

So Why Did MANA Breakout?

General market sentiment seems to suggest cryptos are hopefully turning back bull run season after recent price corrections. Another reason for this sudden pump in price could be whales secretly buying MANA for the coming Altcoins rally. Recent news was also announced regarding HashKey Virtual Headquarter Launch.

Where to Buy or Trade MANA?

MANA has the highest liquidity on Binance Exchange so that would help for trading MANA/BTC or MANA/USDT pairs. And if you’re looking at buying and HODLing cryptos, then Swyftx Exchange is an easy-to-use popular choice in Australia.