Categories
Bitcoin Market Analysis Markets Trading

Bull Market vs Bear Market: What’s the Difference?

What is a bull market and bear market? Whether talking about cryptocurrencies, equity, or real estate, all markets have periods where we can categorise them as either “bearish” or “bullish”. These terms refer to market conditions where a joint situation occurs over a medium or long-term period, usually lasting 1 year or more.

What is a Bull Market?

A bull market is where most assets surge in price gradually. Supply is big and investors are buying more as demand rises. We can say that the market is bullish when most assets of a specific market are in an uptrend.

When investors say they’re bullish on a market, they expect prices to rise for a long period. However, no one knows exactly how much a bull run can last, but they are usually longer than bearish markets and are less volatile.

How to Identify a Bull Market Trend

Trends are never straightforward, they have periods of fluctuation and price drops categorised as higher highs and higher lows.
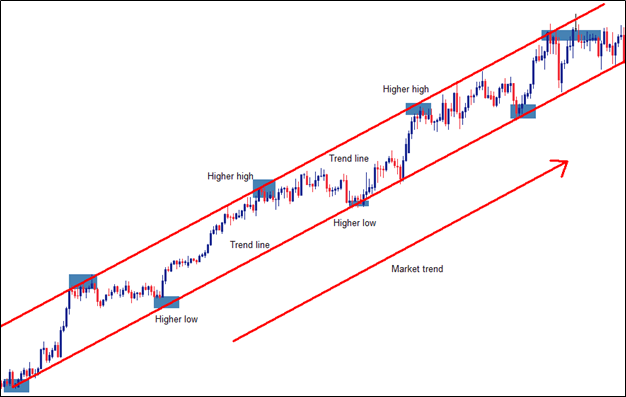
Graph showing Bull market trend. Source: Forex Trader PH

It’s reasonable for a trader to follow the trend and not go against it. This is why it’s important to pay attention to price declines or consolidations when they appear. They don’t usually break the current trend (unless a big event occurs that completely flips it) but they can give you a window of opportunity to enter the market.

What Factors Can Create a Bull Market?

Several forces drive demand up or down. Take for example how the COVID-19 pandemic boosted the crypto market and practically shut down the global economy. What did happen during that time of crisis? Well, to name a few things:

  • Small, mid-size businesses started closing and unemployment rates skyrocketed.
  • Governments started sending relief packs embedded as monthly checks and injected trillions of dollars trying to help their citizens in the time of crisis.
  • Global central banks started printing trillions of dollars to help stabilise their respective countries.

Remote jobs became a priority for most companies globally, and people were forgetting about physical cash and paying for things using digital money on the Internet, like e-commerce websites. This reinforced and highlighted the benefits of cryptocurrencies, not only in times of financial crisis but in general.

How Did Institutional Capital Boosted the Crypto Market?

Investors knew that as central banks printed more and more money, so they wanted to hedge against fiat hyperinflation, and cryptocurrencies became an attractive alternative for them. Thus institutional capital flocked to the crypto market as more clients demanded alternative assets that could make up for a better store of value.

Investment banks like JP Morgan, Goldman Sachs, and Morgan Stanley; Payment Giants like Visa, Mastercard and PayPal; Hedge funds and institutional investors —the list goes on. They all at first condemned cryptocurrencies and their usefulness in real-time situations, and now most of these companies support them.

Investment banks started offering Bitcoin trading services among other crypto-related services to their clients. JP Morgan even offered job positions for Ethereum blockchain developers. PayPal allowed crypto custody and crypto-payments just like Visa and Mastercard.

News, adoption, and the overall benefits of crypto during these periods gave the crypto market and the decentralised finances (DeFi) ecosystem, which is now over US$60 million in total value locked, a dramatic boost.

Crypto Adoption is Accelerating

In January 2020, BTC was priced at over $7,000. By December, it was breaking one of the toughest psychological barriers: $20k, reaching over $24,000 that month. This is an increase of 224%. When institutional capital came into play and cryptocurrencies were all over the news, Bitcoin surpassed astronomical price records of over $40,000 in January 2021. 

This doesn’t mean the market didn’t experience fluctuations during its bull run. The most notorious price corrections happened on February 21, when it dropped more than 20% between February 21 and 23, shortly after reaching a price record of US$58,322.

However, crypto adoption only accelerated with time, and now most institutional investors plan to own crypto by 2026.

What is a Bear Market?

Within a bear market, most assets are in a downward trend. Demand is low and most investors are selling their positions, further pushing the downtrend. However, most investors won’t call it a real bear market unless it loses 20% from recent highs. In essence:

  • Bearish periods apply to every market
  • Most assets move in a downtrend
  • Negative investors’ sentiment takes over

We all know The COVID-19 outburst shut down the entire economy and caused one of the toughest stock market crash in history. However, it accelerated Bitcoin’s rise to the eye of investors and amplified the narrative of Bitcoin as a safe store of value against the decaying purchasing power of the U.S. Dollar. 
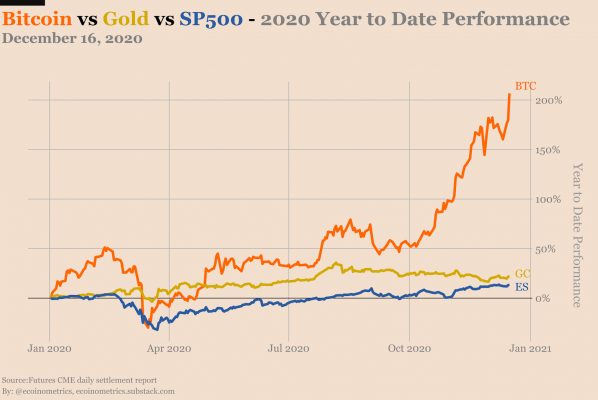
Bitcoin's market performance in 2017 and 2020
Bitcoin’s market performance in 2017 and 2020

Large price drops will trigger weak hands. This is usually called “panic selling.” There’s an interesting feature within the crypto market when this happens: most crypto holders (called HODLers) would look at this as an opportunity to buy as many coins as they can and profit from the next bull run. Interest is low and the usual buyers in these periods are miners and Bitcoin maximalists who want to stack as many BTC as they can.

And why do crypto traders do this? Because the crypto market has a finite supply in contrast to the infinite supply of fiat currency.

On the other hand, bullish crypto markets are dynamic with supply and demand in a perpetual state of flux as new participants and older HODLers compete for block-space, testing each other’s resolve to HODL in the face of parabolic price growth.

Let’s take Bitcoin as an example. While Bitcoin has surged in value over 9000% since 2015 it doesn’t mean the market hasn’t experienced bearish periods. In December 2017, it had one of the largest bearish runs that extended to mid-2019.
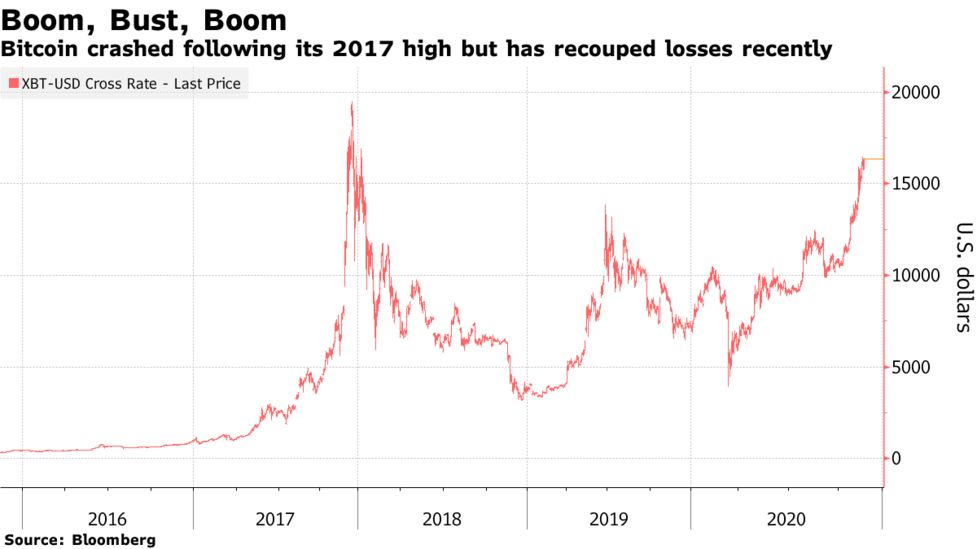
Bitcoin's market performance in 2017 and 2020
Bitcoin’s market performance in 2017 and 2020

Why Timeframes are Important

Using time frames properly is key to understanding the current state of the market so you trade it accordingly. Time frames can be classified as primary (longer periods), intermediate, and short-term, and each one will give you a different perspective of the market.

A rule of thumb is to always trade the primary time frame as market signals are more reliable. On shorter time frames, traders might find cluttered charts with exaggerated long spreads. However, this time frame works well for short-positions, so everything depends on the trader and the way he wants to trade.

Ideally, a trader bases his first technical analysis by studying the longer time frame to define in what direction the market is going. Bull markets usually last months or years, so to do a proper market analysis, setting a higher timeframe will help you have a better notion of what’s happening.

How Long Do Bear and Bull Markets Last?

Nobody knows how long these periods last. Usually, bull markets have greater and stronger rallies —they could last one year or exceed 10 years. On the other hand, bear markets have a shorter duration, but they come with more abrupt movements and volatility.

In the case of the stock market, assets don’t usually fluctuate by high points of percentage. Fiat currencies, for instance, are not stable —the degree to which they fluctuate is small and that’s why people consider them stable.

The Volatility of the Crypto Market

In contrast, the crypto market is volatile. Crypto assets can fluctuate by hundreds or thousands of points per day, and as crypto becomes mainstream and financial institutions start digging into crypto and blockchain technology, the price has been subject to harsh market corrections and explosive price surges. 

News, institutional adoption, major events (like the China FUD), or even a comment from a wealthy influencer can cause powerful price surges or corrections that either boosts the market or stagger it, shrouding investors’ sentiment with pessimism or optimism.

Closing Thoughts

bull and bear markets can always be traded. Identifying what are the market conditions will help you to better manage your capital and invest more smartly.

During a bull run, most traders would follow the trend by applying their trading strategy. Traders entering the market set lower time frames after identifying the primary trend to define their next position.

During bear markets, traders are wary and try to protect themselves from larger price drops. It’s advisable to stay in cash during these periods, wait and study the market to catch an opportunity to trade it.

Categories
Binance Crypto News Market Analysis Solana Swyftx Theta Trading

Top 3 Coins To Watch Today: SOL, THETA, HBAR July 28 Trading Analysis

Let’s take a closer look at today’s altcoins showing breakout signals. We’ll explain what the coin is, then dive into the trading charts and provide some analysis to help you decide.

1. Solana (SOL)

Solana SOL is a highly functional open source project that banks on blockchain technology’s permissionless nature to provide decentralised finance (DeFi) solutions. The Solana protocol is designed to facilitate decentralised app (DApp) creation. It aims to improve scalability by introducing a proof-of-history (PoH) consensus combined with the underlying proof-of-stake (PoS) consensus of the blockchain.

SOL Price Analysis

At the time of writing, SOL is ranked the 15th cryptocurrency globally and the current price is A$38.22. Let’s take a look at the chart below for price analysis:

Source: TradingView

After a 250% run during May, SOL has been consolidating in a gap near A$35.28 from the past few weeks.

A sweep of the lows may have created support around A$28.55, which could give aggressive bulls a chance to get on board at the range lows. If the retracement continues, the price may find support near the gaps around A$27.94 and A$25.77.

The relatively equal daily highs at A$42.83 provide a potential first target. A break of the resistance near A$44.67 might reach resistance near A$48.00 and a sweep of the last high near A$53.42. 

If the price leaves the current low near A$45.87 intact, a bullish breakout from the current consolidation range could reach the extensions near A$56.37 and A$58.44.

2. Theta Network (THETA)

Theta Network THETA is a blockchain powered network purpose-built for video streaming. Launched in March 2019, the Theta mainnet operates as a decentralised network in which users share bandwidth and computing resources on a peer-to-peer (P2P) basis. Theta features its own native cryptocurrency token, THETA, which performs various governance tasks within the network, and counts Google, Binance, Blockchain ventures, Gumi, Sony Europe and Samsung as Enterprise validators, along with a Guardian network of thousands of community-run guardian nodes.

THETA Price Analysis

At the time of writing, THETA is ranked the 20th cryptocurrency globally and the current price is A$7.71. Let’s take a look at the chart below for price analysis:

Source: TradingView

Last week we saw 95% gains for THETA, but the bull run might not be over yet.

Resistance near A$7.80 is pinning the price down as it accumulates on an old monthly level near A$5.89. A sweep of this consolidation range could reach probable support near A$4.67, giving bulls a better risk-reward entry.

The last high at A$12.71 and a May high at A$16.87 are probable first targets. The area between A$11.27 and A$13.45 may provide some resistance, with extensions suggesting that A$14.35 may be a likely area of contention.

A break of this resistance could run as high as the extension at A$17.85 during this move.

3. Hedera Hashgraph (HBAR)

Hedera Hashgraph HBAR is a public network that allows individuals and businesses to create powerful decentralised applications (DApps). It is designed to be a fairer, more efficient system that eliminates some of the limitations that older blockchain-based platforms face, such as slow performance and instability. Unlike most other cryptocurrency platforms, Hedera Hashgraph isn’t built on top of a conventional blockchain. Instead, it introduces a completely novel type of distributed ledger technology known as a Hashgraph.

HBAR Price Analysis

At the time of writing, HBAR is ranked the 51th cryptocurrency globally and the current price is A$0.2702. Let’s take a look at the chart below for price analysis:

Source: TradingView

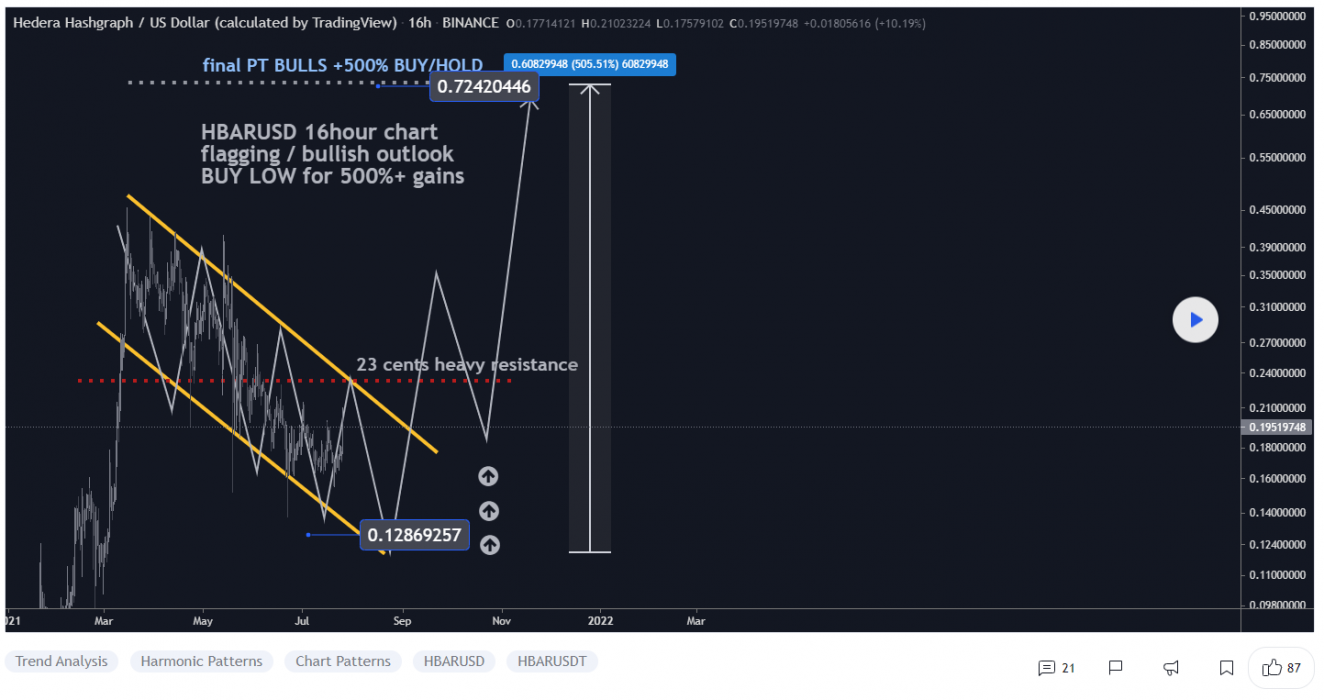
HBAR bears saw 48% retracement during July as the price approaches resistance from a weekly gap beginning at A$0.2855.

Support may have formed last weekend near A$0.2547, which would be confirmed by a strong move above this level and provide a probable area for entries. A gap beginning at A$0.2485 may also offer support if tested, along with the last movement’s base starting at A$0.2267.

Old overlapping levels and a previous move’s 2.0 extension make A$0.3541 to A$0.3862 a likely resistance area. If the price retraces near A$0.4017 before piercing this level to form a new 1.0 extension, an old monthly high near A$0.4325 may be the next target.

Where to Buy or Trade Altcoins?

These coins have high liquidity on Binance Exchange, so that could help with trading on AUD/USDT/BTC pairs. And if you’re looking at buying and HODLing cryptos, then Swyftx Exchange is an easy-to-use popular choice in Australia. However, you can also buy these coins from different exchanges listed on Coinmarketcap.

Categories
Binance Crypto News Market Analysis Swyftx Trading

Top 3 Coins To Watch Today: ETNA, EXRD, KAVA July 27 Trading Analysis

Let’s take a closer look at today’s altcoins showing breakout signals. We’ll explain what the coin is, then dive into the trading charts and provide some analysis to help you decide.

1. ETNA Network (ETNA)

ETNA Network is a one-stop shop for all things DeFi, NFTs and gaming. ETNA’s NFT Factory is an all-in-one marketplace and factory, the first NFT marketplace that facilitates spot trading of supported assets. The factory allows creators to easily mint digital assets and showcase them to collectors.

ETNA Price Analysis

At the time of writing, ETNA is ranked the 1278th cryptocurrency globally and the current price is A$0.3007. Let’s take a look at the chart below for price analysis:

Source: TradingView

NOTE: this coin is charted against the BNB pair

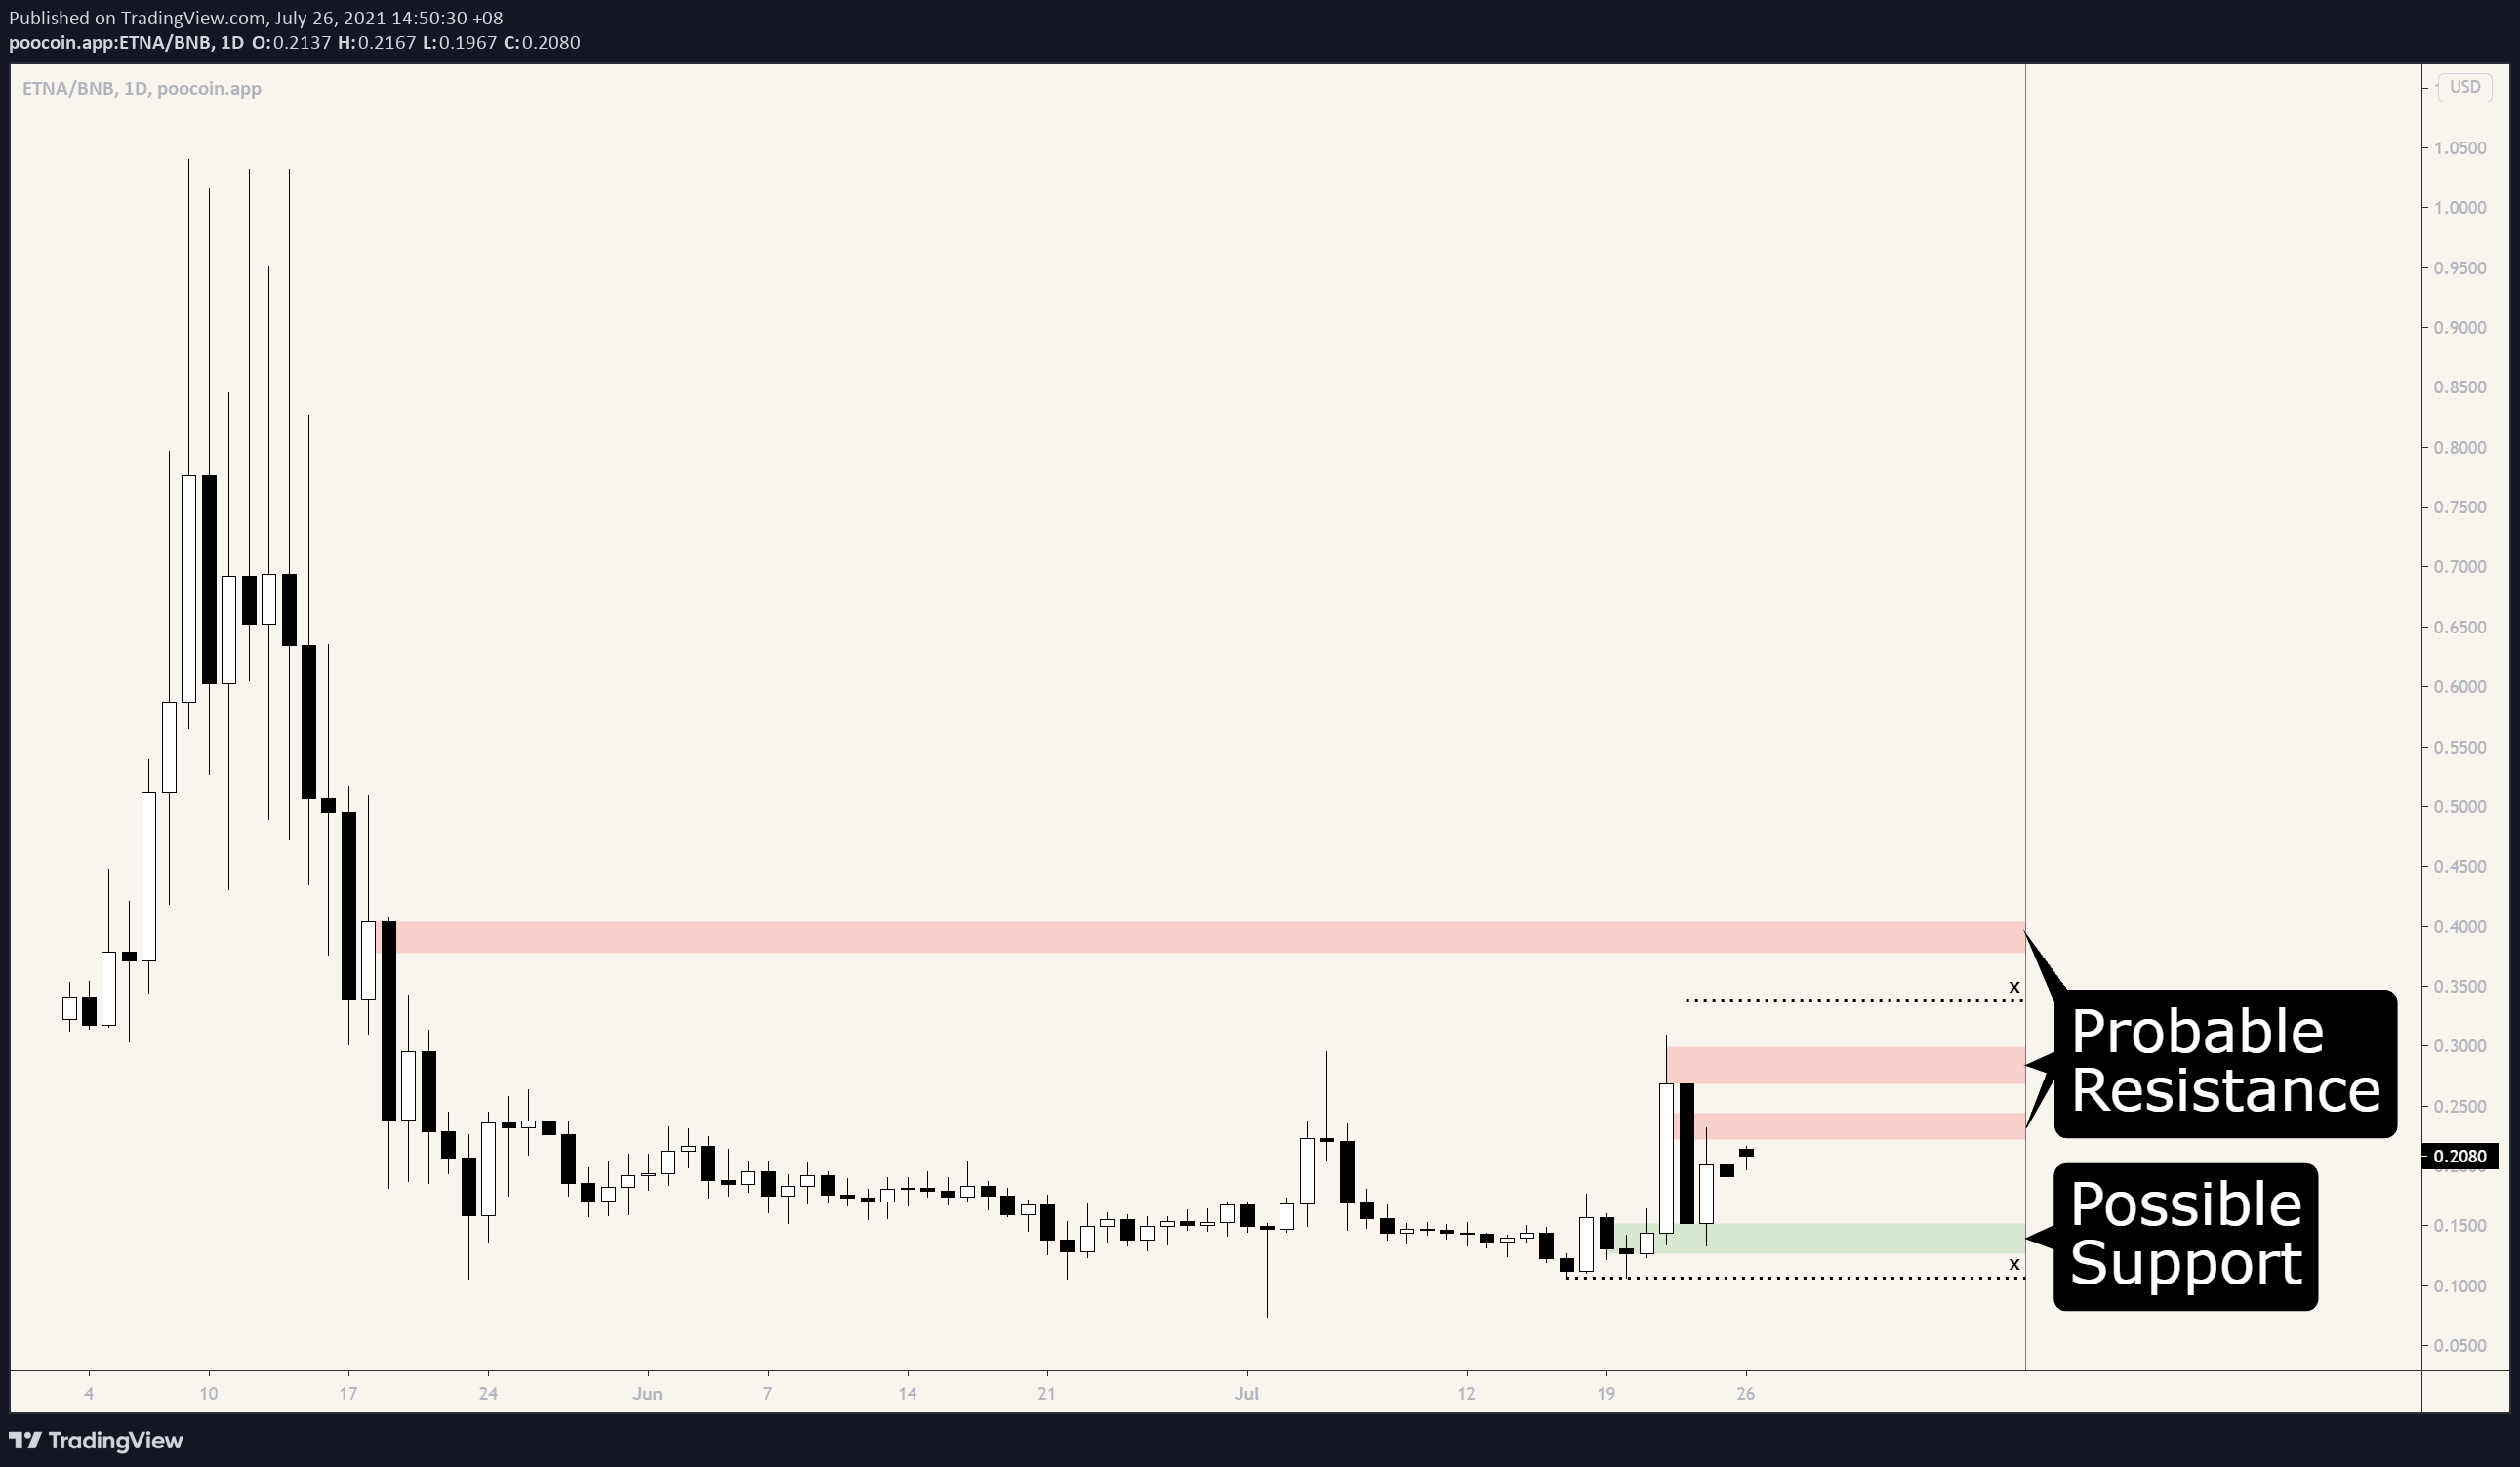
After a stunning 92% drop since early May, ETNA seems to have entered an accumulation phase.

The last few days have found resistance in the weekly level near A0$.2223, which may continue to hold the price down. The daily chart also shows resistance near A$0.2689, while the swing high at A$0.3375 gives a likely target if this resistance fails. A run above this level may reach the weekly gap with a high near A$0.3781.

The consolidation around A$0.1723 has provided support and could do so again. However, relatively equal daily lows near A$0.1561 give a tempting target for bears. Below this level, little exists to provide explicit support on the chart.

2. Radix (EXRD)

Radix EXRD is the first layer-one protocol specifically built to serve DeFi. Decentralised finance applications are currently built on protocols that are not fit for purpose, leading to congestion, hacks and developer frustration. Radix changes this by introducing a scalable, secure-by-design, composable platform with a DeFi-specific build environment to make it easy to build and launch scalable DeFi.

EXRD Price Analysis

At the time of writing, EXRD is ranked the 274th cryptocurrency globally and the current price is A$0.1992. Let’s take a look at the chart below for price analysis:

Source: TradingView

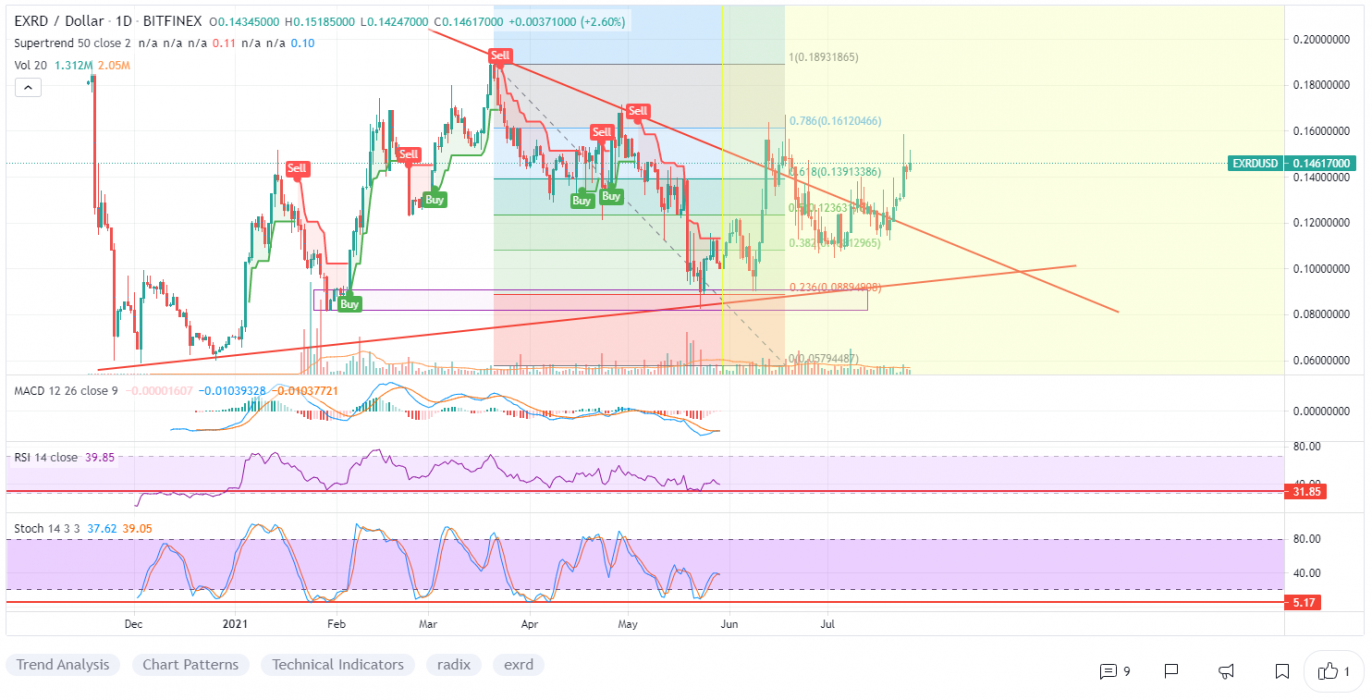
EXRD‘s nearly 57% drop since late March found a low in late May, with price action now trending upward through a higher-timeframe range.

The area beginning near A$0.2155 has provided strong resistance and may do so again. However, relatively equal highs near A$0.2389 offer a tempting target for bulls. A run of these highs may reach up into the daily gap near A$0.2437.

Aggressive bulls might add to their positions near A$0.1854. If the price breaks through this level, it may be reaching for the cluster of swing lows near A$0.1594 and A$0.1422. A more substantial move down may run stops below the relatively equal January and May lows, around A$0.1169, into the daily gap at this level.

3. Kava.io (KAVA)

Kava is a cross-chain DeFi lending platform that allows users to borrow USDX stablecoins and deposit a variety of cryptocurrencies to begin earning a yield. In addition to Kava’s USDX stablecoin, the Kava blockchain also includes the native KAVA token. This is a utility token used for voting on governance proposals and also functions as a reserve currency for when the system is undercollateralised.

KAVA Price Analysis

At the time of writing, KAVA is ranked the 114th cryptocurrency globally and the current price is A$6.12. Let’s take a look at the chart below for price analysis:

Source: TradingView

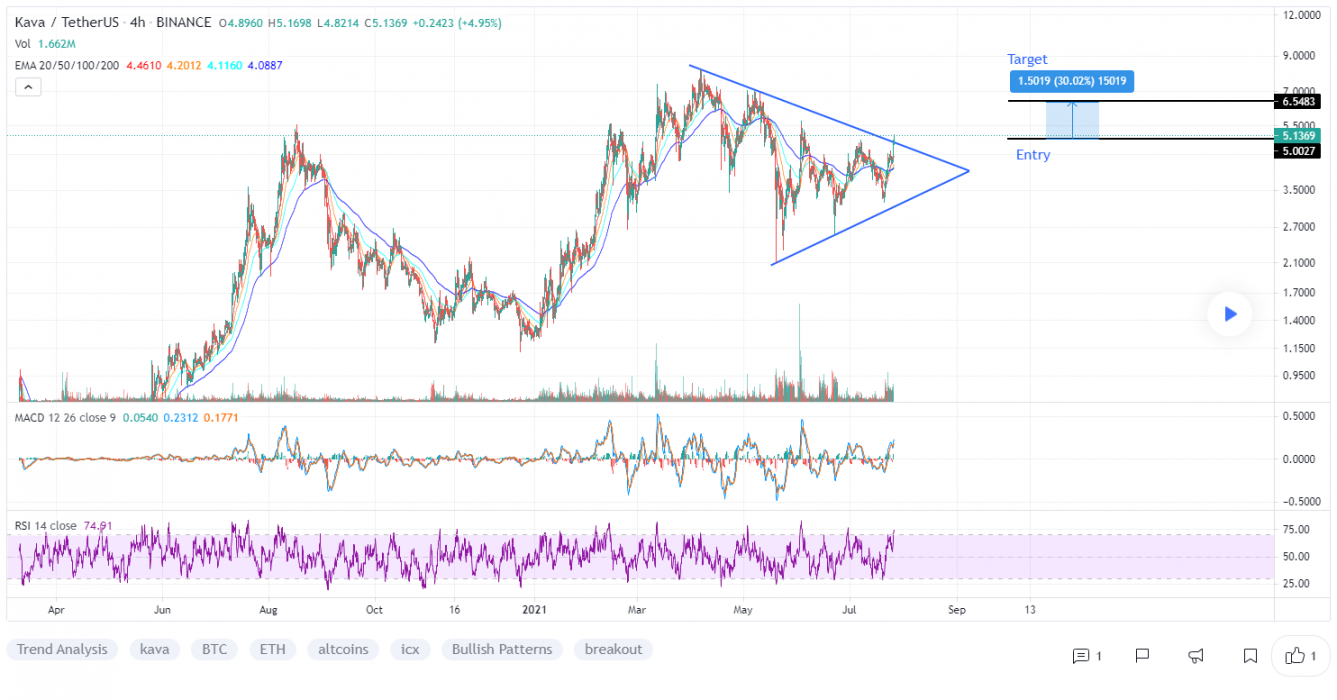
KAVA has been trading through a massive range since April, with the price showing mild bullishness during July.

Bulls bought at the level near A$4.28. The weekly level and daily gap near A$5.73 could prompt buyers to step in again as the price challenges the swing high and resistance around A$6.75. A strong move and acceptance above this level may reach for the swing highs at A$8.72 and A$9.99, which marks another area of resistance.

However, rejection from the current area may send the price down to retest support near A$4.81. Relatively equal lows around A$4.28 provide a rich target for a stop run. Sustained bearishness may reach the low near A$3.47 and possibly as low as A$2.86 into higher-timeframe support.

Where to Buy or Trade Altcoins?

These three coins have high liquidity on Binance Exchange, so that could help with trading on AUD/USDT/BTC pairs. And if you’re looking at buying and HODLing cryptos, then Swyftx Exchange is an easy-to-use popular choice in Australia. However, you can also buy these coins from different exchanges listed on Coinmarketcap.

Categories
Binance Crypto News Market Analysis Swyftx Trading

Venus XVS Surged +54% in a Single Day amid XVS listed on Poloniex Defi Innovation Zone

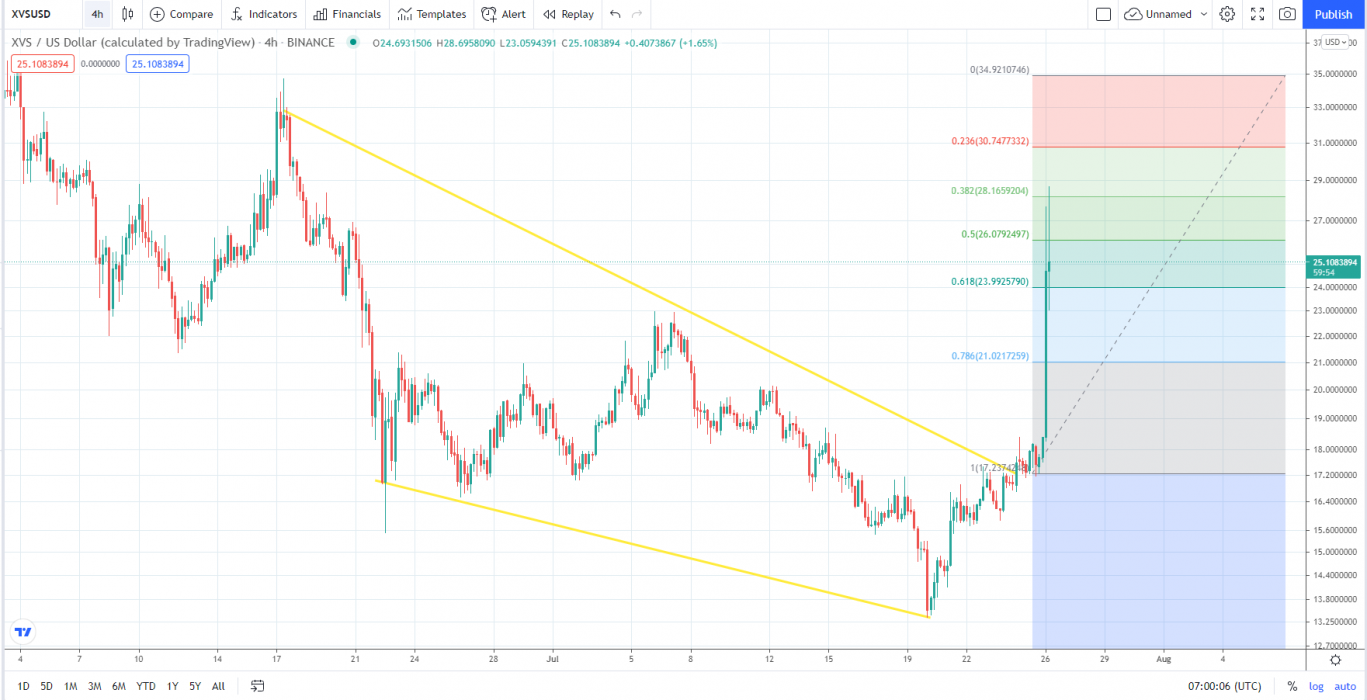
Venus XVS is trading in an uptrend, like many other Altcoins. The cryptocurrency XVS just went up +54% in a single day by breaking a falling wedge pattern with strong buying volume on multiple exchanges and surges over +86% in a week.

What is XVS?

Venus XVS is an algorithmic money market and synthetic stablecoin protocol launched exclusively on Binance Smart Chain (BSC). The protocol introduces simple-to-use crypto-asset lending and borrowing solution to the decentralized finance (DeFi) ecosystem, enabling users to directly borrow against collateral at high speed while losing less to transaction fees. The governance of the protocol is entirely controlled by XVS community members, since the Venus founders, team members, and other advisors do have any XVS token allocations.

XVS Price Analysis

At the time of writing, XVS is ranked 137th cryptocurrency globally and the current price is A$34.08. This represents a +86% increase since July 20, 2021 (seven days ago), as shown in the chart below.

Source: TradingView

After looking at the above 4-Hour candle chart, we can clearly see that XVS was trading inside the falling wedge pattern on the XVS/USDT pair. The first resistance was on the A$25.64 price levels which XVS broke with a strong bullish trend buying volume and is now heading towards the previous monthly high price at A$45.38 Seeing that many Altcoins are holding a strong position this week after the recent bitcoin price recovery with 14% in a day XVS might continue to increase in the uptrend if traders keep buying with high volume.

“The Falling Wedge is a bullish pattern that begins wide at the top and contracts as prices move lower. This price action forms a cone that slopes down as the reaction highs and reaction lows converge.”

What Do The Technical Indicators Say?

TradingView indicators (on the one-day window) mainly suggest XVS as a Buy.

So Why Did XVS Breakout?

General market sentiment seems to suggest cryptos are hopefully turning back bull run season after recent massive price corrections. Another reason for this sudden pump in price could be whales secretly buying XVS for the next Altcoins rally. Recent news was also announced regarding Poloniex Listing XVS Coin on its DeFi Innovation Zone.

Where to Buy or Trade XVS?

Venus XVS has high liquidity on the Binance exchange which could help for trading XVS/BTC or XVS/USDT pairs. Instead, if you’re looking at buying and HODLing cryptos, then Swyftx Exchange is a popular choice in Australia.

Categories
Bitcoin Crypto News Market Analysis Markets

Bitcoin Up 20% Over Past Week – Is a Supply Squeeze Underway?

Bitcoin bull runs have historically been triggered by supply squeezes. A number of indicators suggest that a bullish move may be in progress.

Indications of a Supply Squeeze

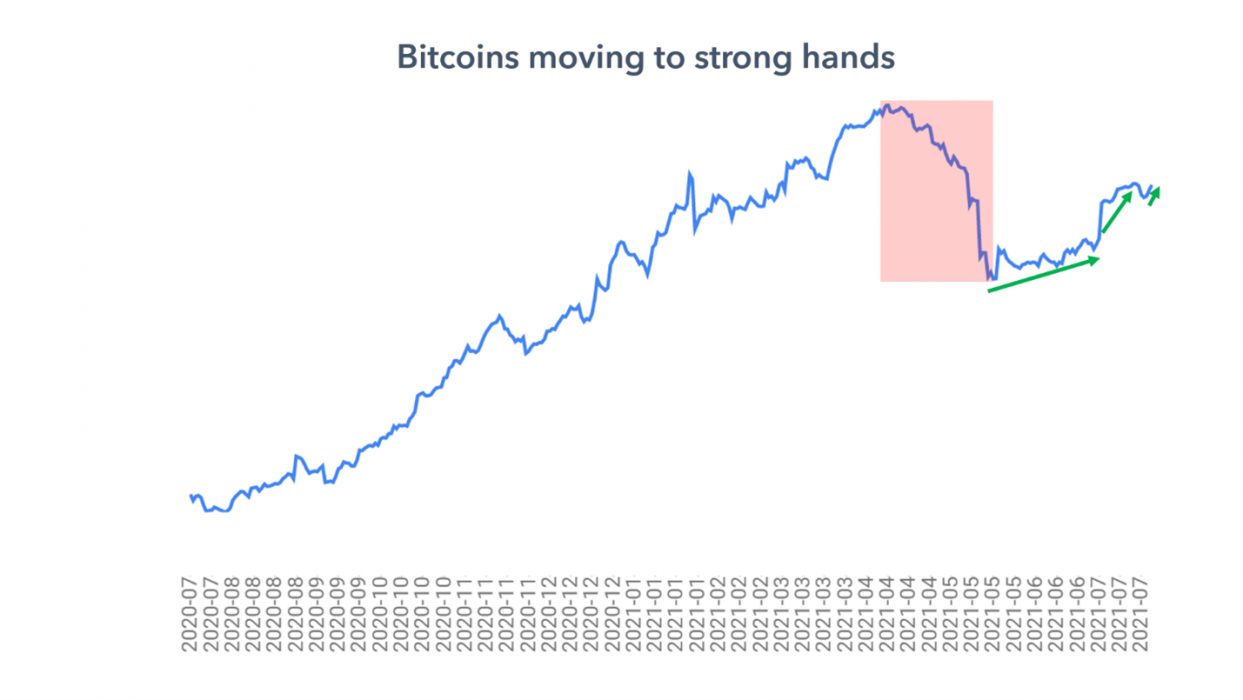
During Q3 2020, long-term holders (LTHs) controlled 80 percent of the supply. Today, that figure is 75 percent and growing, according to on-chain analytics.

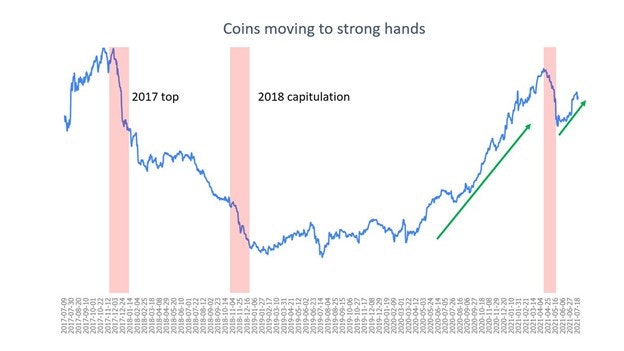
Bitcoin’s supply shock is currently equivalent to levels it was at earlier this year, between US$50K – US$60K a coin. The two charts that follow illustrate the shift in coins towards LTHs:

Bitcoin moving from weak hands to strong hands. Source: Will Clemente III
Coin circulation to strong hands over cycles. Source: Will Clemente III

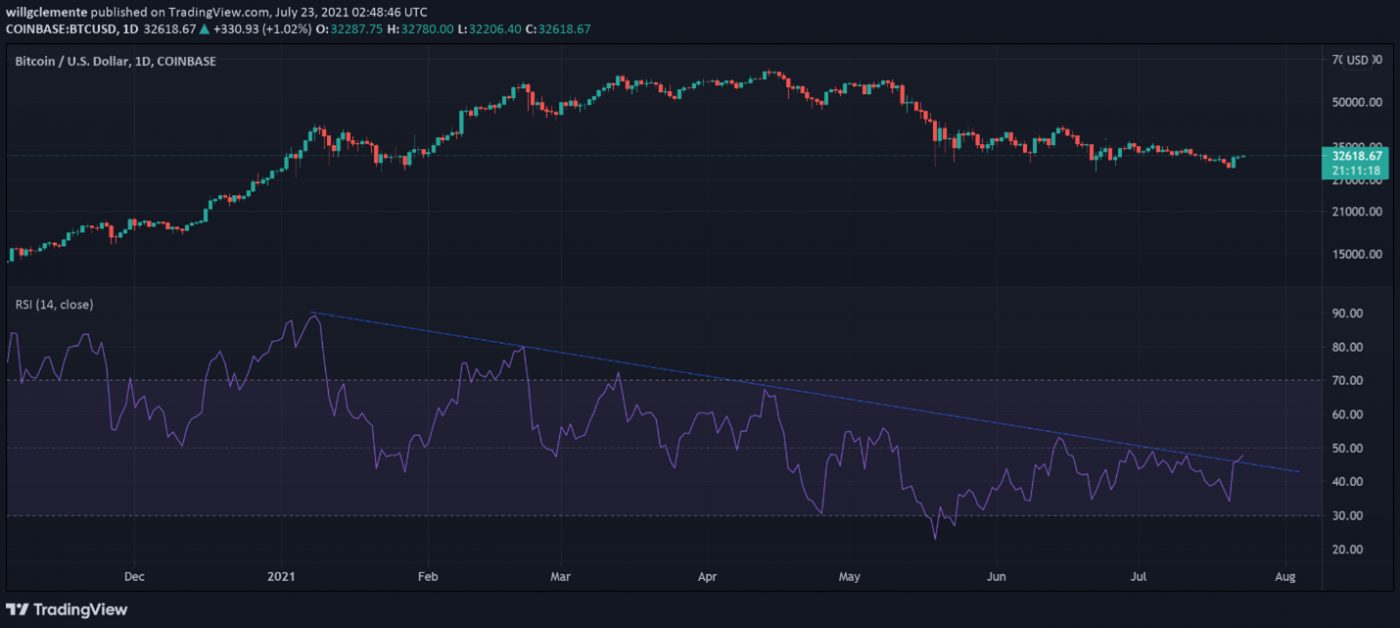
Another bullish indicator to be aware of is the relative strength index (RSI), a momentum tool used to identify overbought and oversold levels. Generally:

  • values of 70 or above indicate that an asset is becoming overbought
  • values of 30 or below indicate that an asset is oversold or undervalued

The RSI has been in a downtrend for seven months but may be turning a corner, as illustrated below:

Relative strength index. Source: Will Clemente III

On-chain analyst Willy Woo also has his eyes on the RSI:

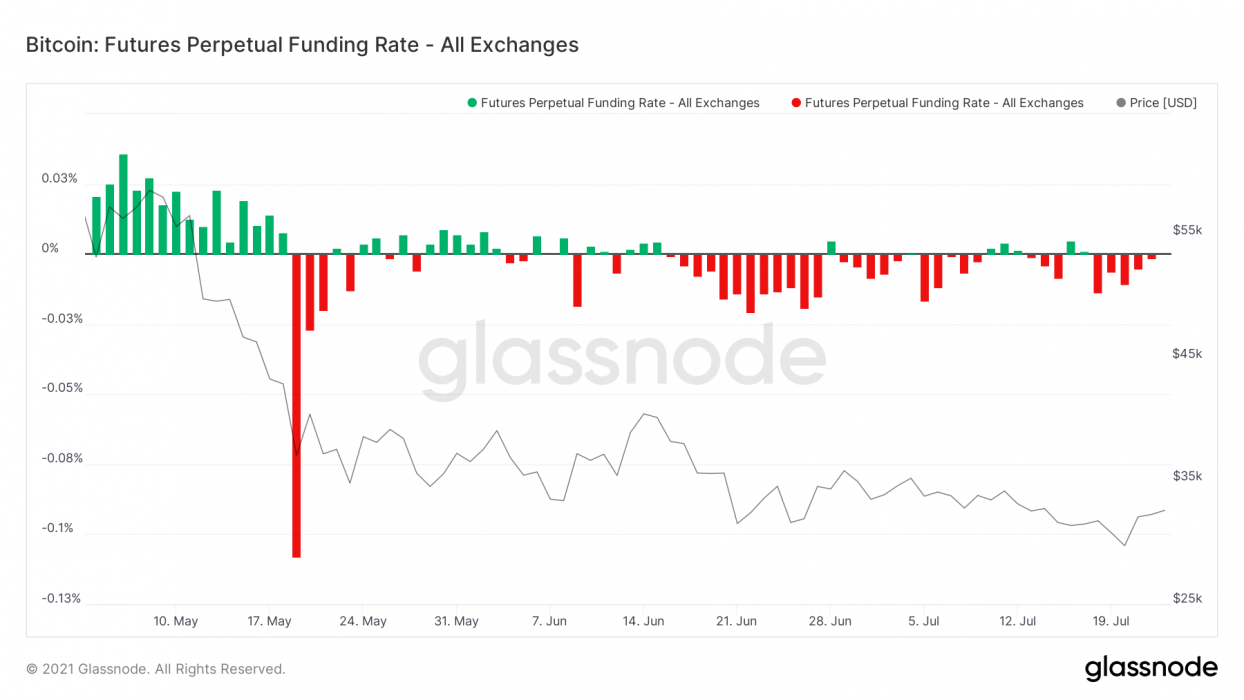
Another interesting metric showing evidence of a potential short squeeze is the the perpetual funding rate. This is the mechanism that pegs the perpetual contract to the index (weighted average price of all major exchanges). When funding is positive, longs are paying shorts to keep their positions open; when negative, vice versa.

Generally, prolonged positive funding is bearish, whereas prolonged negative funding rates is bullish. We’ve seen mostly negative funding rates since late May. The last time we had prolonged negative funding like this was following the March 2020 Covid-19 capitulation, after which the price dramatically rose to an all-time high in December.

Bitcoin futures perpetual funding rate. Source: William Clemente III

Supply Squeeze in Action?

After months of sideways action and a drop below US$30,000 amid market fear, Bitcoin seems to be turning a corner. Last week, Crypto News Australia reported that there was evidence of Bitcoin bears retreating, and perhaps this is coming to fruition.

At the time of writing, Bitcoin has been making sharp bullish moves suggesting that a supply squeeze may in fact be underway. Consider Bitcoin’s recent performance:

  • 1 Month: +24.67%
  • 1 Week: +20.67%
  • 24-Hours: 12.96%

Evidently, things tend to move fast in crypto. At the time of publication, Bitcoin was trading at US$38,228.

Categories
Binance Crypto News DigiByte EOS Market Analysis Ripple Swyftx Trading

Top 3 Coins To Watch Today: EOS, XRP, DGB July 26 Trading Analysis

Let’s take a closer look at today’s altcoins showing breakout signals. We’ll explain what the coin is, then dive into the trading charts and provide some analysis to help you decide.

1. Electro Optical System (EOS)

EOS is a platform that’s designed to allow developers to build decentralized apps DApps. The project’s goal is relatively simple: to make it as straightforward as possible for programmers to embrace blockchain technology and ensure that the network is easier to use than rivals. As a result, tools and a range of educational resources are provided to support developers who want to build functional apps quickly. EOS also aims to improve the experience for users and businesses. While the project tries to deliver greater security and less friction for consumers, it also vies to unlock flexibility and compliance for enterprises.

EOS Price Analysis

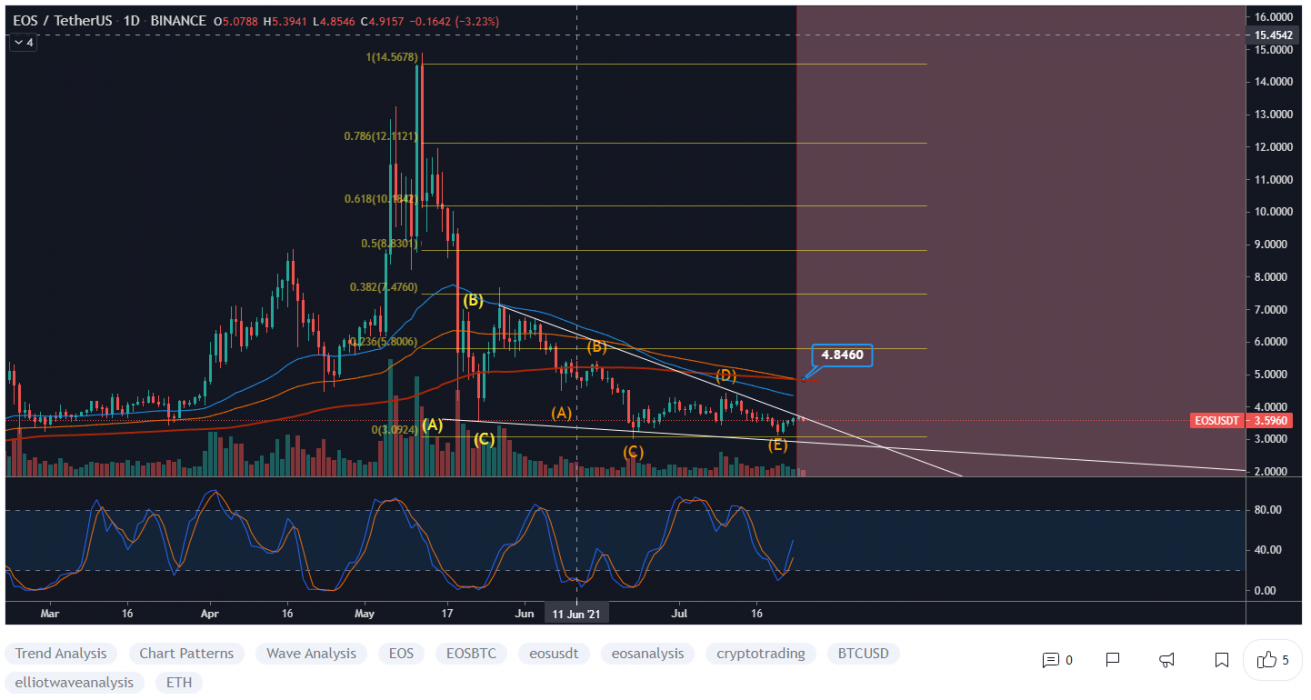
At the time of writing, EOS is ranked the 28th cryptocurrency globally and the current price is A$4.87. Let’s take a look at the chart below for price analysis:

Source: TradingView

EOS marines continue pushing the price higher, printing nearly 45% gains during the end of July.

The consolidation near A$4.75 is likely to provide support as the price continues exploring new highs. However, a set of relatively equal lows near A$4.38 provides a tempting target for a stop run into probable support near A$4.15.

A decidedly bearish shift in the market could reach probable support near A$3.85.

Almost no resistance lies overhead, although low-timeframe traders can use the resistance below recent highs near A$5.20 as a first target. Beyond this level, extensions near A$5.88, A$6.15, and A$6.45 give reasonable higher-timeframe targets.

2. Ripple (XRP)

Ripple XRP is the currency that runs on a digital payment platform called RippleNet, which is on top of a distributed ledger database called XRP Ledger. While RippleNet is run by a company called Ripple, the XRP Ledger is open-source and is not based on blockchain, but rather the previously mentioned distributed ledger database.

XRP Price Analysis

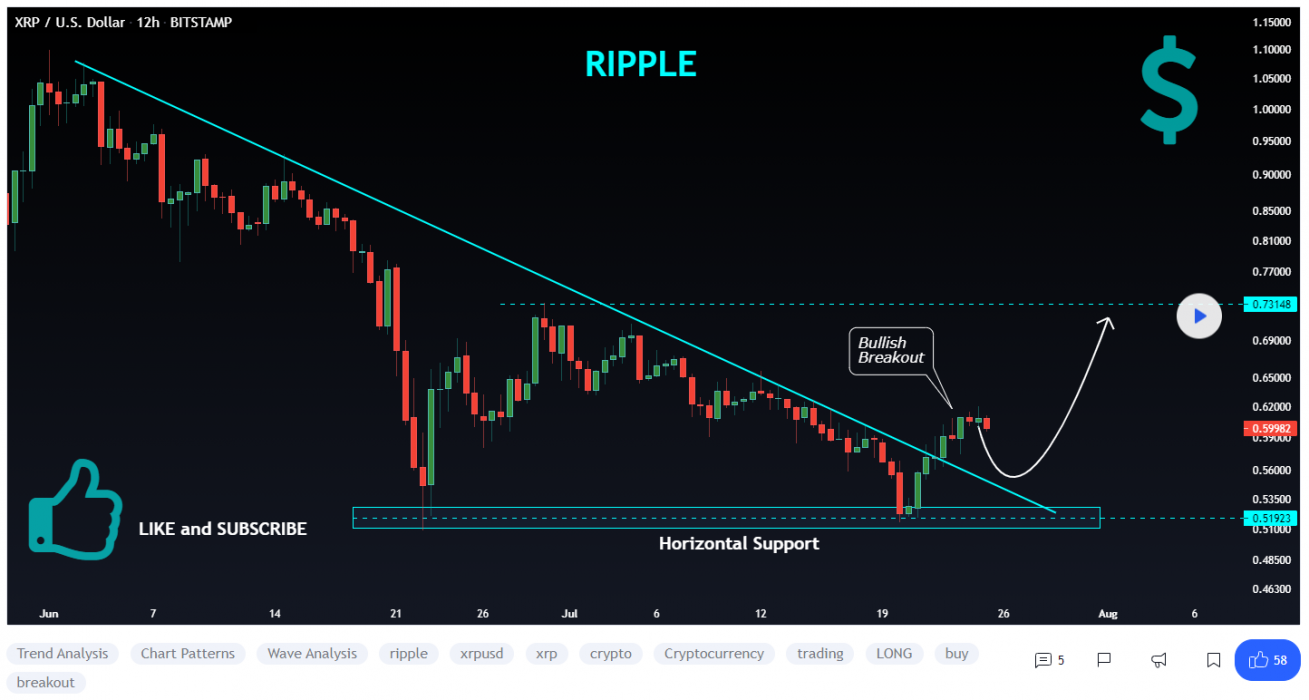
At the time of writing, XRP is ranked the 6th cryptocurrency globally and the current price is A$0.811. Let’s take a look at the chart below for price analysis:

Source: TradingView

XRP retraced 45% during July before finding support near A$0.5937. The following bounce encountered resistance at the daily gap near A$0.6328.

Bulls might wait for a sweep of the local lows into support near A$0.7344 before stepping in. A move to this level could reach into the higher timeframe gap down to A$0.6936. 

In the most bearish scenario, a significant turn in the market could push the price down to the consolidation near A$0.6422.

The local resistance is near A$0.9855 and the relatively equal swing highs give a reasonable first target. Just above, layered resistance near A$1.18 and A$1.27 could slow bulls down as they push the price towards the significant swing high at A$1.45.

3. DigiByte (DGB)

DigiByte DGB is an open-source blockchain and asset creation platform. Development began in October 2013 and the genesis block of its DGB token was mined in January 2014 as a fork of Bitcoin. A longstanding public blockchain and cryptocurrency, DigiByte uses five different algorithms to improve security, and originally aimed to improve on the Bitcoin blockchain’s security, capacity, and transaction speed. DigiByte consists of three layers: a smart contract “App Store,” a public ledger, and the core protocol featuring nodes communicating to relay transactions.

DGB Price Analysis

At the time of writing, DGB is ranked the 89th cryptocurrency globally and the current price is A$0.05837. Let’s take a look at the chart below for price analysis:

Source: TradingView

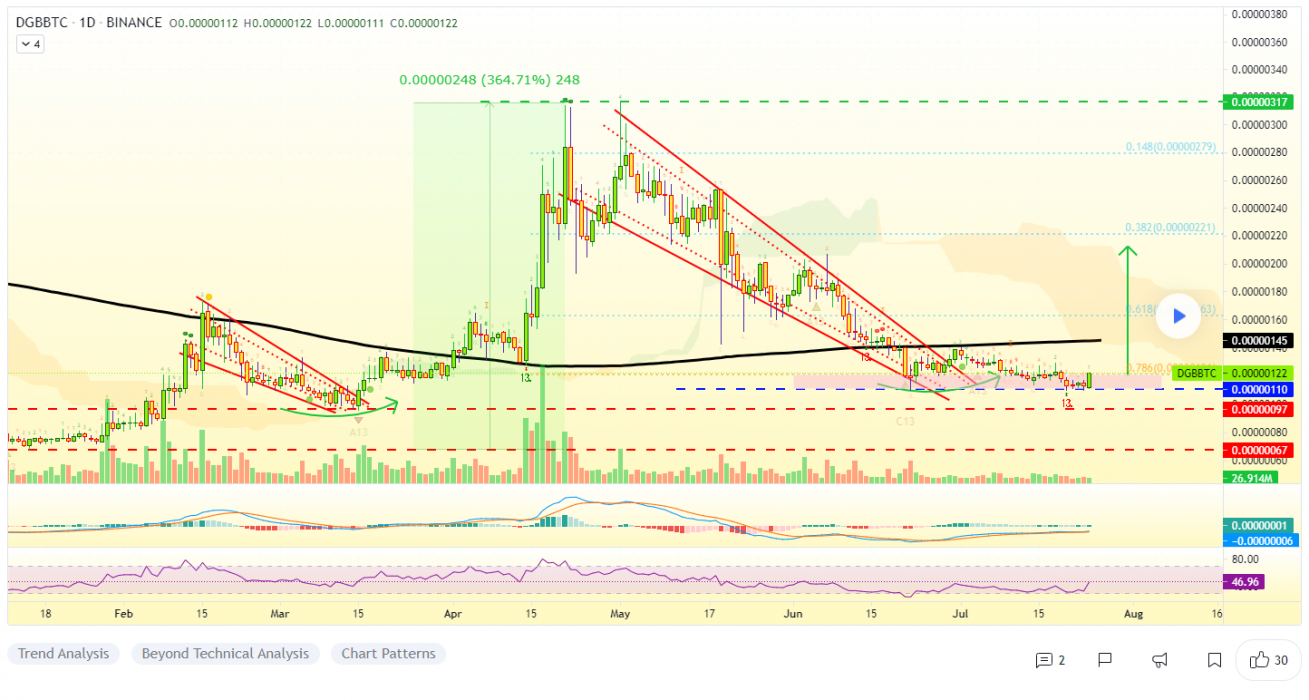
DGB bears have retraced over 145% since June, with little resistance above to end the current price discovery.

The price may find support near A$0.04655. Still, aggressive bulls should be wary of a potential stop run under the monthly open into support near A$0.04371. The area around A$0.04015 should provide strong support if the price reaches this low.

The air above the current price is thin, but the level near A$0.0695 could potentially provide some resistance in the short term. Extensions reaching near A$0.0784 and A$0.0872 make reasonable take-profit zones if the bullish trend continues.

Where to Buy or Trade Altcoins?

These three coins have high liquidity on Binance Exchange, so that could help with trading on AUD/USDT/BTC pairs. And if you’re looking at buying and HODLing cryptos, then Swyftx Exchange is an easy-to-use popular choice in Australia.

Categories
Binance Crypto News Initial Coin Offering Market Analysis Trading

Coin98 Surges +1850% Amid listing on Binance Launchpad – C98 Breakout Analysis

After the launch of Coin98 on Binance Launchpad, C98 took a strong Breakout with +1850% gains in a single day. Let’s take a quick look at C98, price analysis, and possible reasons for the recent breakout.

What is Coin98?

Coin98 is a decentralized finance (DeFi) solution that allows users access to cross-chain swaps, staking, and yield farming. The Coin98 exchange describes itself as a multi-chain liquidity aggregator that supports assets across a variety of blockchains, including but not limited to Ethereum, Binance Smart Chain, Solana, and Tron. Coin98 also has a wallet amongst its offerings, which supports over 20 networks on both its mobile and desktop platforms.

C98 Price Analysis

At the time of writing, C98 is ranked 2549th cryptocurrency globally and the current price is A$1.41. This is a +1268% increase since the launch of its ICO at Binance Launchpad on (23rd July 2021). Have a look at the chart below for price analysis.

Source: Binance Charts

After the launch of Coin98 on Binance Launchpad, It pumped up to A$1.75 having +1850% gains in just a few minutes and the initial opening price of C98 was A$0.0958 at Binance Exchange with many different trading pairs like C98/BTC, C98/USDT, and C98/BUSD.

Currently, C98 is trading at A$1.45 price levels after breaking out the squeeze resistance in its sideways trend & now heading towards its all-time high price.

What do the technical indicators say?

The Coin98 TradingView indicators (on the 1 day) mainly indicate C98 as a strong buy, except the Oscillators which indicate C98 as a neutral.

So Why did Coin98 Breakout?

After the C98 opening at Binance Launchpad, mostly ICO’s pumps after going live on exchange for trade and, General market sentiment seems to suggest cryptos are hopefully turning back bull run season after recent massive price corrections. and then the suggested start of the Altcoins season could have contributed to the recent breakout. It could also be contributed to some recent news of Binance Listing.

Where to Buy or Trade Coin98?

Coin98 has the highest liquidity on Binance Exchange so that would help for trading C98/BTC, C98/BUSD, or C98/USDT pairs. However, you can also buy C98 from different exchanges listed on Coinmarketcap.

Categories
Binance Crypto News Market Analysis Trading

Dexe Surged +118% in a Single Day as Binance adds USDT Trading pair for Dexe

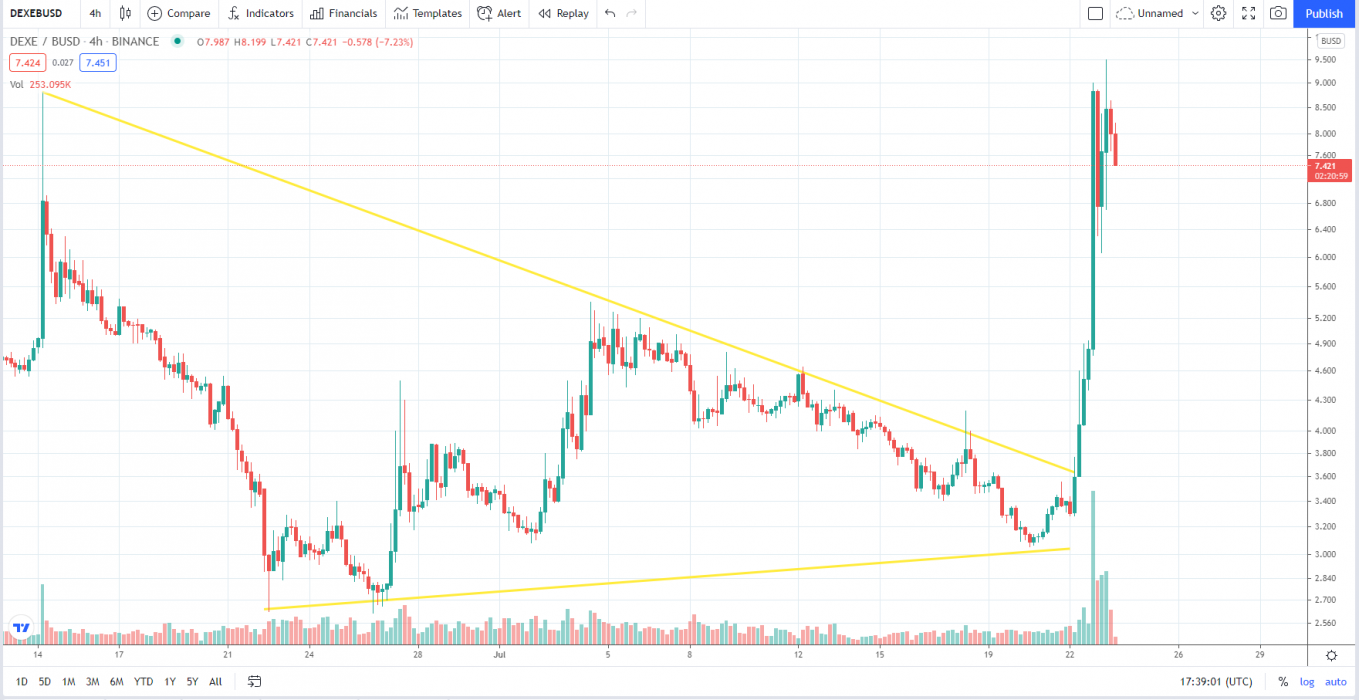
Dexe is trading in an uptrend, like many other Altcoins. The cryptocurrency DEXE just went up +118% in a single day by breaking a falling wedge pattern with strong buying volume on multiple exchanges and surges over +168% in a week.

What is Dexe?

The DeXe token DEXE claims to enable the open and permissionless system. Following protocol rules and contributing resources facilitates consensus among participants, automatic buyback and distribution among insurance vaults, farming rewards among token holders, and burning of tokens for a percentage of traders’ rewards.

Dexe Price Analysis

At the time of writing, DEXE is ranked 554th cryptocurrency globally and the current price is A$10.44. This represents a +168% increase since July 17, 2021 (seven days ago), as shown in the chart below.

Source: TradingView

After looking at the above 4-Hour candle chart, we can clearly see that Dexe was trading inside the falling wedge pattern on the DEXE/BUSD pair. The first resistance was on the A$5.22 price levels which Dexe broke with a strong bullish trend buying volume and is now heading towards the previous monthly high price at A$17.84. Seeing that many Altcoins are holding a strong position this week after the recent bitcoin crash recovery, Dexe might continue to increase in the uptrend if traders keep buying with high volume.

“The Falling Wedge is a bullish pattern that begins wide at the top and contracts as prices move lower. This price action forms a cone that slopes down as the reaction highs and reaction lows converge.”

What Do The Technical Indicators Say?

TradingView indicators (on the one-day window) mainly suggest DEXE as a Neutral.

So Why Did Dexe Breakout?

General market sentiment seems to suggest cryptos are hopefully turning back bull run season after recent massive price corrections. Another reason for this sudden pump in price could be whales secretly buying Dexe for the next Altcoins rally. Recent news was also announced regarding Binance adding DEXE/USDT trading pair.

If you have conducted extensive due diligence and like the concept of the project, and you feel it can create long-term token holder value, investing in some DEXE coin may be a good move. In addition, if you want to be part of the DeXe DAO, holding DEXE tokens is a must.

Where To Buy or Trade Dexe?

Dexe coin has high liquidity on the Binance exchange, which could help for trading DEXE/ETH or DEXE/USDT pairs. However, you can also buy Dexe tokens from other multiple crypto exchanges.


Categories
Binance Crypto News Market Analysis Solana Swyftx Trading

Top 3 Coins To Watch Today: SKL, SOL, CHR July 23 Trading Analysis

Let’s take a closer look at today’s altcoins showing breakout signals. We’ll explain what the coin is, then dive into the trading charts and provide some analysis to help you decide.

1. SKALE Network (SKL)

Skale SKL is described as an elastic network that’s designed to bring scalability to Ethereum. As well as boosting transaction capacity, the decentralized project aims to reduce latency and ensure that payments can be made as cheaply as possible. SKALE Network is geared towards improving both the security and decentralization of Ethereum-based apps. Token holders on the SKALE Network are incentivized and earn rewards by helping to improve the scalability and security of the platform by serving as validators.

SKL Price Analysis

At the time of writing, SKL is ranked the 130th cryptocurrency globally and the current price is A$0.2661 Let’s take a look at the chart below for price analysis:

Source: TradingView

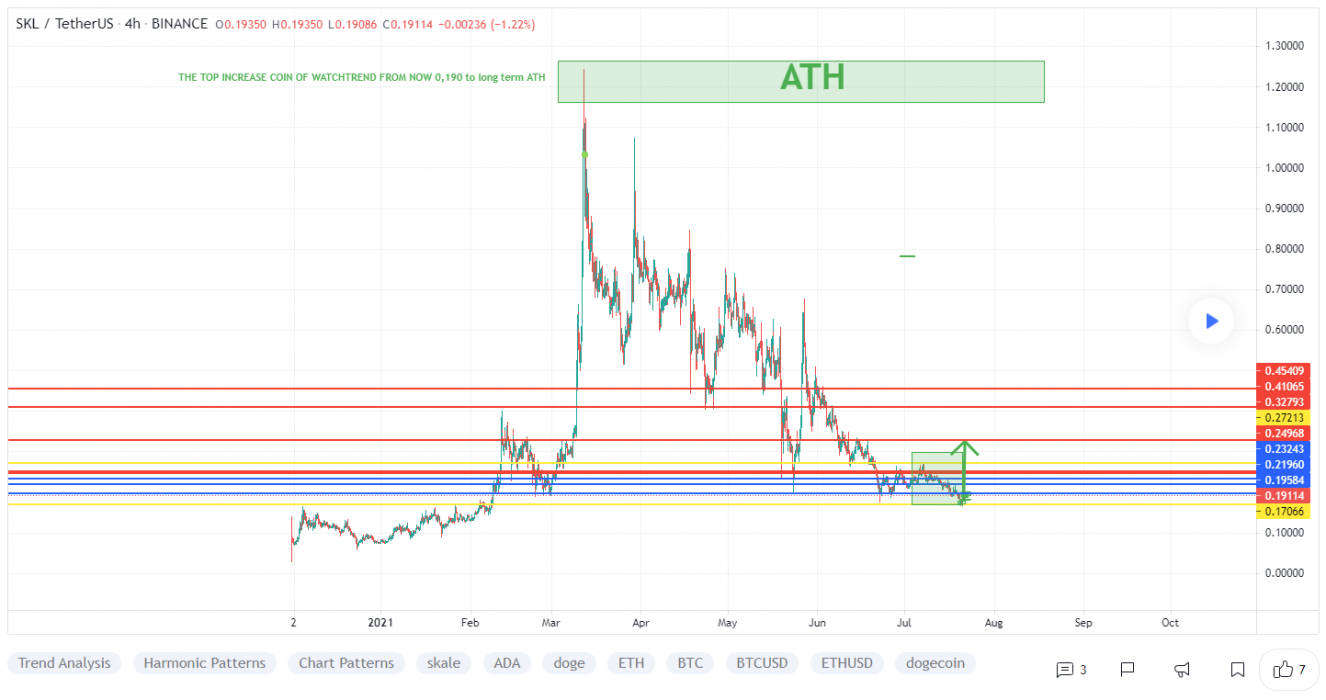
Since the beginning of July, SKL has been in a gentle downtrend. The future likely holds more stop runs and erratic volatility until the chart forms more substantial high-timeframe levels.

A retracement might uncover support near A$0.2538, which is the daily high of the last swing low. The high of the wick beginning near A$0.2471 may also provide support. However, bulls will likely remain wary of the current downtrend, making the low at A$0.2214 likely to be the next bearish target.

Just above, the daily gap beginning near A$0.3288 may provide resistance to bulls, possibly marking a future range high. A push through this level is likely to target the swing high near A$0.3593 – perhaps running to probable resistance near A$0.3844. Strength above this level might signal the start of a bullish trend, encouraging bulls to “buy the dip.”

2. Solana (SOL)

Solana SOL is a highly functional open source project that banks on blockchain technology’s permissionless nature to provide decentralized finance (DeFi) solutions. The Solana protocol is designed to facilitate decentralized app (DApp) creation. It aims to improve scalability by introducing a proof-of-history (PoH) consensus combined with the underlying proof-of-stake (PoS) consensus of the blockchain.

SOL Price Analysis

At the time of writing, SOL is ranked the 14th cryptocurrency globally and the current price is A$37.70. Let’s take a look at the chart below for price analysis:

Source: TradingView

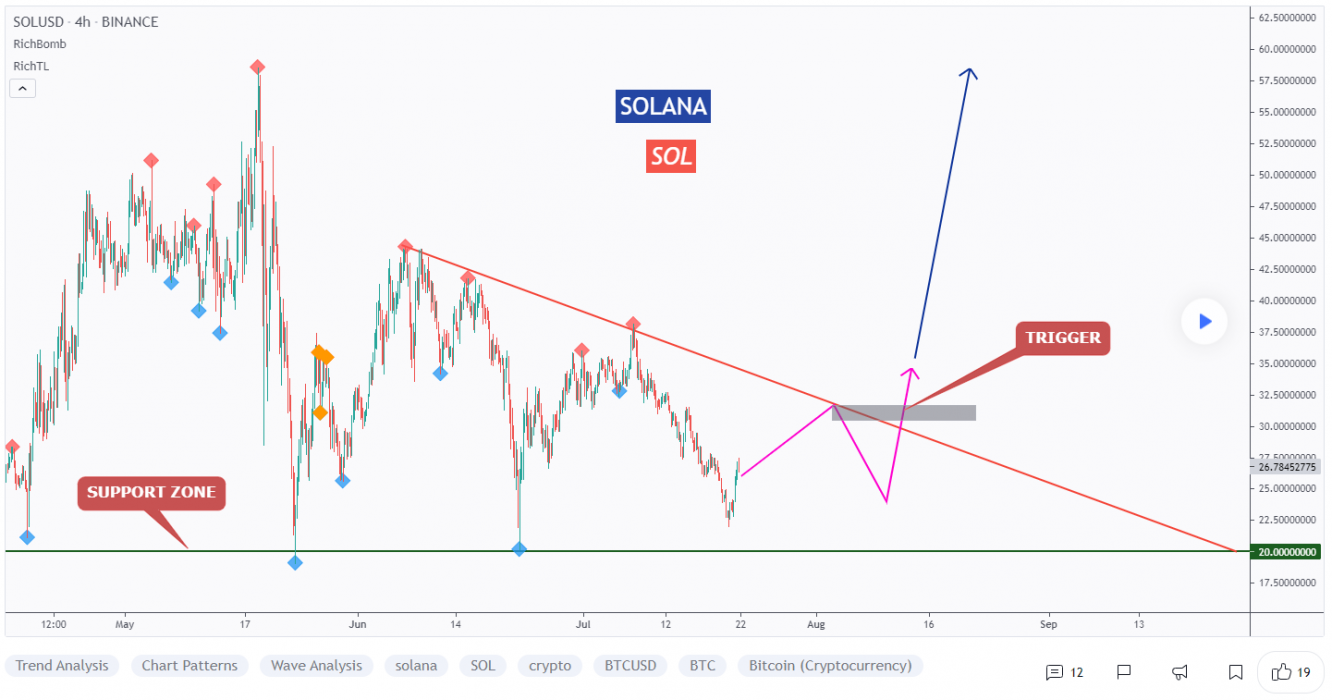
July 11th 125% bullish weekly candle has since bled near 85%, with the SOL finding a low near A$32.54 in mid-July.

Bulls are buying each drop into support near A$35.82, with higher lows forming each time. However, the equal lows near A$33.14 create an attractive target for a stop run. Still, bulls might buy this dip near possible support beginning at A$31.66.

Just over the July monthly open, A$45.73 marks the beginning of a probable resistance zone. A breakthrough in this area might target the equal highs near A$47.95 before running into possible resistance near A$49.89.

A sustained move upward – perhaps from a market-wide bullish shift – could reach the swing high near A$53.68 before encountering probable resistance near A$56.88.

3. Chromia (CHR)

Chromia CHR is an open-source public blockchain conceived of by Swedish company Chromaway AB. The Chroma token (CHR) was launched in May of 2019. The technology behind the Chromia blockchain is adapted from an earlier technology called ‘Postchain’, a solution provided by Chromaway AB for enterprise clients. Chromia is a standalone Layer-1 blockchain and EVM compatible Layer-2 enhancement for Binance Smart Chain and Ethereum.

CHR Price Analysis

At the time of writing, CHR is ranked the 189th cryptocurrency globally and the current price is A$0.3902. Let’s take a look at the chart below for price analysis:

Source: TradingView

During the third week of July, CHR dumped over 62% before finding support near A$0.2688. Consolidation above this level has created a series of relatively equal lows, which are likely to be swept before any longer-term bullish trend begins. 

In the shorter term, the price might establish support near A$0.3588 before running the swing high at A$0.4055. If this bullish move occurs, the price could reach resistance near the May monthly open around A$0.5571 and even sweep the swing high near A$0.5746.

Some support might exist at the daily gap near A$0.2338 A move this low would also fill the June monthly gap and set the stage for a possible bullish reversal.

Where to Buy or Trade Altcoins?

These three coins have high liquidity on Binance Exchange, so that could help with trading on AUD/USDT/BTC pairs. And if you’re looking at buying and HODLing cryptos, then Swyftx Exchange is an easy-to-use popular choice in Australia.


Categories
Binance Crypto News Market Analysis Swyftx Trading

Axie Infinity AXS Surged +42% in a Day amid recent Axie Podcast

Axie Infinity (AXS) is trading in an uptrend, like many other Altcoins. The cryptocurrency AXS just went up +42% in a single day by breaking a falling wedge pattern with strong buying volume and surges over +85% in a week.

What is AXS?

Axie Infinity AXS is a blockchain-based trading and battling game that is partially owned and operated by its players. The Axie Infinity ecosystem also has its own unique governance token, known as Axie Infinity Shards (AXS). These are used to participate in key governance votes and will give holders a say in how funds in the Axie Community Treasury are spent.

AXS Price Analysis

At the time of writing, AXS is ranked 54th cryptocurrency globally and the current price is A$32.79. This is a +85% increase since 16th July 2021 (7 days ago) as shown in the chart below.

Source: TradingView

After looking at the above 1-Day candle chart, we can clearly see that AXS was trading inside the falling wedge pattern on the AXS/USDT pair. The first resistance was on the A$24.87 price levels which AXS broke with a strong bullish trend buying volume and is now heading towards the all-time high price in AUD. Seeing that many Altcoins are holding a strong position this week after the recent bitcoin crash recovery, AXS might continue to increase in the uptrend if the traders keep buying with high volume.

“The Falling Wedge is a bullish pattern that begins wide at the top and contracts as prices move lower. This price action forms a cone that slopes down as the reaction highs and reaction lows converge.”

What Do The Technical Indicators Say?

TradingView indicators (on the 1 day window) mainly suggest AXS as a strong buy, except the Oscillators which indicate AXS as a Buy.

So Why Did AXS Breakout?

General market sentiment seems to suggest cryptos are hopefully turning back bull run season after recent massive price corrections. Another reason for this sudden pump in price could be whales secretly buying AXS for the next Altcoins rally. Recent news was also announced regarding Axie Podcast action.

There was also a 60% increase in new players who joined the Crypto & this massive increase is pushing AXS coin to reach its all-time high price very soon.

Where to Buy or Trade AXS?

Axie Infinity has high liquidity on the Binance exchange which could help for trading AXS/BTC or AXS/USDT pairs. Instead, if you’re looking at buying and HODLing cryptos, then Swyftx Exchange is a popular choice in Australia.